Gamma Rays frim the Galactic Centre
- 格式:pdf
- 大小:340.49 KB
- 文档页数:21

A D V A N C E D T E C H N O L O G Y F O R A S A F E R W O R L DM S pec with protective bootMSpecGamma & Gamma/NeutronHandheld SpectrometerLocate and Identify Specific IsotopesThe MSpec is palm sized gamma ray spectrometer that utilizes a Sodium doped Cesium Iodide Crystal with high signal to noise ratio PMT and state-of-the-art electronics for the most accurate results. The MSpec scans suspect material and quickly analyzes to determine what nuclide isotope is present and then calorizes the result as Medical, Industrial, Natural Occurring Radioactive Material (NORM), or Special Nuclear Material (SNM).User FriendlyThe MSpec has two modes a user may choose from: Manual or Automatic. Automatic is the quickest and easiest to use mode. Set in Automatic the MSpec will search for and detect radioactive material. Once in range the instrument will automatically begin isotopic identification and display the results. Manual mode gives the user greater control including the ability for longer scan times which increases the accuracy of results. This is especially important if there are multiple isotopes present in the same sample.RadView SoftwareR adComm’s exclusive RadView software interfaces with a user’s PC and enables a user to see detailed results of recorded scans in a Histogram format. Each result can be edited with comments, saved as a PDF and archived for future reference or email compatibility.LAURUS Systems, Inc. - Ph: 410-465-5558 - Fax: 410-465-5257 - LAURUS Systems, Inc. - Ph: 410-465-5558 - Fax: 410-465-5257 - RadView PC Software Program for Data ManagementMECHANICAL∙ Rugged Case: 4.75” x 2.5” x 1.22” (12 cm x 6.4cm x 3.1cm) ∙ Display Window : 1.56” x 1.81” (3.96cm x 4.6cm) ∙ Weight : 0.44lbs (200g)∙ Five Push Button Actuation Mini USB Connector for Internal Battery Charging∙ Operating Temperature Range: 14ºF to +113ºF (-10°C to +45ºC) ∙ Thru-hole for Audio Alarm∙Shock resistance – 1 meter drop test ELECTRICAL∙ Micro-Controller Based Architecture ∙ 1.56” x 1.81” (3.96cm x 4.6cm) LCD with Backlight∙ Backlight Auto-Off (180 seconds) with Push Button Auto-On ∙ Audio Alarm with Vibration∙ Stable Low Noise H.V. Power Supply∙ Internal Rechargeable Li Ion Battery with Charging LED indicator ∙ Battery Life: 6 hours continuous with Backlight∙Battery Recharge Time: 4.5 hours based on 2400mAh BatterySOFTWARE∙ Menu Driven User Interface∙ Menu Feature Selection Controlled by a Five Push Button Actuation ∙ Storage of 300 spectra, resettable and downloadable via USB∙ Selectable Features: Date and Time, Units of Measure, Readings Update, Language ∙ PC Configurable∙ Up to 6 Digit Auto-Scaling Displayed Radiation Level ∙ Selectable Displayed Units - CPS, R/hr, Sv/hr∙ Base Sampling Rate is 200 mSec, Screen Updates Every 1/Second (CPS)∙ Battery Level Indicator: Three Bars for Full Battery, Low Battery Warning Message with the battery bar flashing, 10% Battery Capacity Remaining Audio Beep Every One Minute, System will Turn Off at 5% Battery Capacity∙Warning Messages: Move Closer; Move Away, CPS Exceeds Threshold, Stabilization Off. No ID, Stabilization Required, Memory is Full, ScanningDETECTOR Gamma∙ CsI(Na) Crystal: 0.5” X 1.5” (13mm X 38mm) ∙ Energy Range: 20 KeV – 3.0 MeV∙ Dose Rate Range: 1 μR/hr to 1 R/hr (0.01μSv/hr to 10.0 mSv/hr) ∙ Gamma Sensitivity: Cs137 1,300 (cps/mR/hr) ∙ Gamma Spectrum: 1024 Channels ∙ Resolution: 9% or better at 662 KeV∙ Optional Neutron Detector; 4.5 cm³ He3, Sensitivity - .6 cps per /NV ∙ Accumulated Dose: 1000 R (10 Sv), resettable ∙Radiation Warning Level: 1.14 mR/hr (10.0 μSv/hr)Neutron∙ Neutron He3 Tube ∙ High Density Moderator∙ High Gain with High Signal to Noise Ratio Amplifier ∙ Mechanical Noise rejection Circuitry∙Neutron Software Option for the MSpec and the PC SoftwareSPECIFICATIONSMSpecReal Time Spectrum Display。
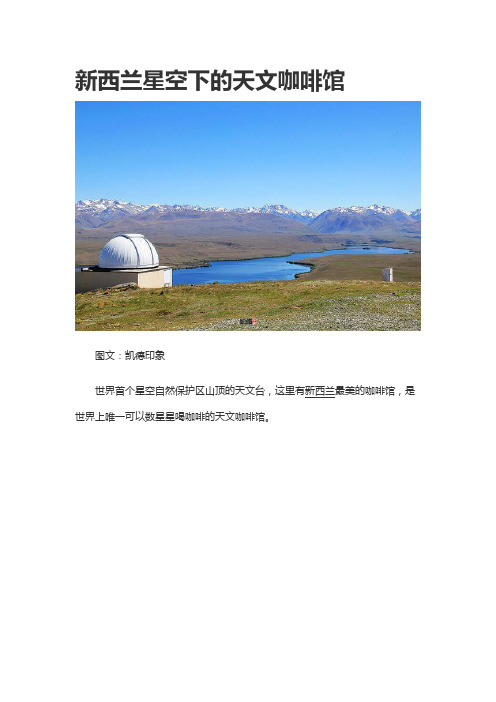
新西兰星空下的天文咖啡馆图文:凯德印象世界首个星空自然保护区山顶的天文台,这里有新西兰最美的咖啡馆,是世界上唯一可以数星星喝咖啡的天文咖啡馆。
天文台里的咖啡馆坐在咖啡馆里数星星从新西兰南岛的特卡波鲁冰花农场和三文鱼农场回来后,我们在镇上的旅游中心逛了逛,新西兰的官方旅游中心都叫做iSight旅游中心,这里提供免费的地图,可以帮你直接预定各种旅游路线和设计行程。
旅游中心的工作人员推荐我们参加这里的观星团,特卡波是全世界都出名的星空自然保护区,小镇附近的约翰山上有个天文台,每天晚上这里都有组织观星团半夜上天文台看星星。
我们都很有兴趣,于是就根据旅游中心的指示到旁边的Earth and Sky服务中心预定观星团计划,不过被告知当天的团都已经满了,只能预定第二天的,好吧,于是这样的原因让我们又在特卡波多住了一天。
天文馆里的热咖啡平静的湖水倒映着雪山湖边的特卡波小镇在外面游荡了一天也实在有点累,吃了晚饭后我们就早早的入睡了。
第二天睡了个懒觉,起来差不多到了中午了。
我们在客厅遇到秋兰,她正在和她马来西亚的妈妈视频聊天。
我们在厨房简单弄了点早餐,回到客厅看到秋兰正在和北京来的女孩聊天,秋兰说她今早去了湖边拍鲁冰花,早晨的特卡波湖特别平静,四周的雪山全部倒映在湖里。
教堂前的鲁冰花开的更茂盛了,她还遇到了好多兔子。
我们听的神往,有点遗憾早上没能早点起床,其实说来奇怪,我们在特卡波的几天都是睡的特别好,简直是要把我们这些年没睡够的全部补回来似得。
秋兰笑着说,很多人来特卡波都是特别好睡,她住的宿舍里有个南美来的妹子,已经在这里睡了好多天了。
咖啡馆里也提供各种西点,味道都很不错哦。
山上温度冻人咖啡馆里有提供热饮和冷饮我们说今晚预定了观星团,早上想先自己上山探探路,秋兰说白天的约翰山(MT John)也很漂亮,可以徒步上山,也可以自己开车上山。
山顶能看到整个特卡波湖和小镇,而且最关键的是山上有个全世界最美的咖啡馆,就建在山上的天文台里。


迈阿密周边旅游必去景点介绍1.自由塔自由塔位于迈阿密市中心美国航空球馆附近,是迈阿密达德学院Miami Dade College 校园的一部分。
这座西班牙文艺复兴式的建筑是迈阿密的地标,在1962-1974年曾作为古巴难民的援助中心。
每到夜晚,建筑上会打出变幻的彩色灯光,异常显眼。
2.迈阿密佩雷斯艺术博物馆迈阿密佩雷斯艺术博物馆是专门收集和展示20-21世纪国际艺术的现当代艺术博物馆,博物馆共三层,藏有超过1800件艺术作品,并定期举办特展。
博物馆临海的位置视野极佳,馆外的花园遍布花草树木,设有座椅和秋千,打造出与自然融为一体的艺术空间。
3.野生动物公园野生动物基地是迈阿密著名的动物保护基地,这里有很多濒临灭绝的保护动物。
不同于传统动物园,你可以与小动物们亲密接触,拍照或玩耍。
向导还会详细介绍动物的相关知识。
4..巴斯艺术博物馆巴斯艺术博物馆是迈阿密最先进的艺术博物馆。
永久藏品包括15世纪至20世纪的欧洲绘画,特别是北欧文艺复兴时期和巴洛克时期的绘画。
过去的展品包括Picasso, Frida Kahlo和Francois Marie Banier的作品。
除了有展示永久藏品的空间外,其展品的规模和质量在迈阿密从前的展示中还没有出现过。
博物馆还设有The New InformationWorkshop实验室,使得那些有抱负的艺术家进行创作。
另外,还有室外雕塑平台,咖啡屋和博物馆商店。
1.最时尚的酒店餐厅南海滩W酒店The DutchAndrew Carmellini的第一家荷式餐厅于2021年在大苹果落户时美食界一片哗然,在惊叹创作料理发展之迅猛的同时评论家们的目光也聚焦在这位擅长创意海鲜菜式的主厨身上,Carmellini借用阳光之州的丰富海产资源将荷式菜肴的精髓在迈阿密乃至整个美国发扬光大。
食客必点:洒上玉米粉的生蚝三明治与盐焗青柠派地址: 2201 Collins Avenue, Miami Beach, Florida 331392.最拉丁的咖啡馆Café Demetrio想在南佛罗里达找到最爱的古巴咖啡馆? 来对地方了,CaféDemetrio的西班牙风情比整个古巴还要古老,作为珊瑚阁区第一家独立咖啡馆,CaféDemetrio坐落于1926年的报社大楼内。

宇宙盛宴;星系中的宇宙美食之旅
在宇宙的浩瀚星系中,隐藏着无尽的神秘和美妙,就如同一场盛大的宇宙盛宴。
今天,让我们一起踏上星系间的宇宙美食之旅,探寻那些令人惊叹的宇宙美味。
首先,我们来到了位于NGC 2244星云中的“星云炫彩餐厅”。
在这个璀璨的星际餐厅,可以品尝到由星云尘埃和气体凝结而成的绚丽色彩的星云冰淇淋,每一口都仿佛在口中绽放出繁星般的光芒,让人陶醉其中。
接着,我们前往M87星系的“黑洞奇观餐厅”。
这里的特色菜肴是以黑洞为灵感制作的“虚空漩涡汤”,每一勺都蕴含着黑洞的神秘力量,让人感受到时间与空间的扭曲。
此外,还有“引力焰烧烤”,烤制在星系引力场中的食材,口感丰富多变,令人回味无穷。
随后,我们来到了Andromeda星系的“星际宴会厅”。
这里聚集着各种星系的美食大师,他们将各自星系的特色菜肴呈现在宴会桌上。
你可以品尝到来自不同星系的异域美食,感受到宇宙文化的多样性和包容。
最后,我们抵达了银河系中心的“星际奢华酒店”。
这里拥有无数星系的顶级大厨,为客人提供最奢华的美食体验。
从“星尘龙虾”到“星辰香槟”,每一道菜品都融合了宇宙的神秘力量和无限可能,让人仿佛置身于星空之中。
在这场宇宙美食之旅中,我们不仅品尝到了各种美味佳肴,更感受到了宇宙的无限魅力和神秘之处。
让我们怀着感恩之心,珍惜这份宇宙盛宴带来的美好体验,期待着下一次星系间的美食之旅。
愿我们的味蕾与心灵,在宇宙的辽阔中得到滋养与启发。
Daniel Libeskind建筑师事务所与室内建筑师Rockwel集团一起,为水晶宫打造了迷人的外在和内在。
之后,Focus Lighting灯光设计公司又献上了一个视觉上看似复杂,技术上非常先进的设计作品。
在过去的三年中,设计师们提交了数百张图纸、三个模型以及不计其数的实物大小的实验模型,就是为了实现我们现在在CityCenter所看到的水晶宫所呈现的百变形象。
水晶宫室内照明顶面的灯槽内投射出错综的光束,沿着内墙斜斜洒落,与建筑一道充满动感。
灯槽内安装的是金卤灯具,每个光源前都配备了精心调校过的金属格栅。
另还安装了金卤灯光源的射灯,被用来投射Rockwell在室内广场布置的各种小品。
墙面和顶面的架状突出物上安装了近千盏上打光的LED变色灯具,色调的变化映射出日光的变化。
在顶面上设计灯槽,以隐藏所有安装在吊顶的灯具,被证明是CityCenter中最大的挑战之一。
Focus Lighting公司与整个设计团队通力合作打造出无缝的整体感。
空间内其它的照明包括大扶梯和巨大雕塑“树屋”内的Mastro海鲜馆的背光照明。
粉红玛瑙色的扶梯用白色LED背光打亮,既节能又方便维护。
精心制作的树屋的树脂条也用LED 灯带背光打亮,与结构融合,维护也相当方便。
安装在结构主体和主顶面上的重点照明灯从顶部及内部突出了树屋的独特性。
水晶宫室外照明站在拉斯维加斯大道上,水晶宫这座购物中心就像一颗发光的珍贵宝石,清晰可辨。
它的立面和屋顶采用的是一种独特的棱纹拉丝金属。
人们经过时,这种材料会反射日光,形成波纹效果。
同时,围绕建筑的硬质景观带上安装的重点照明灯向上打亮立面,在基部和高度上形成两层光带。
硬质景观Focus Lighting公司把由法国超现实雕塑名家拉拉尼夫妇, 著名雕塑家克勒斯·欧登伯格和布鲁根夫妇, 以及英国雕塑家亨利·摩尔创作的雕塑作品都做了照明处理。
另外如走道、小桥、交叉路口以及贯穿CityCenter的裙房也都做了照明处理。
澳洲灯塔旅游景点
澳大利亚有许多美丽的灯塔旅游景点。
以下是一些著名的澳洲灯塔:
1. 高山角灯塔(Cape Byron Lighthouse):位于新南威尔士州拜伦湾,是澳大利亚最古老的灯塔之一,也是澳大利亚最东端的灯塔,提供了壮观的海景。
2. 伊温森角灯塔(Cape Otway Lighthouse):位于维多利亚州的南部,是大洋路沿途的重要景点之一。
游客可以在灯塔顶部欣赏到壮丽的海景。
3. 纳拉科塔角灯塔(Cape Neddick Light):位于塔斯马尼亚州北部的海岸线上,拥有壮丽的海岸美景,灯塔也成为了摄影师们的热门目的地。
4. 登闰角灯塔(Cape Leeuwin Lighthouse):位于西澳大利亚州的博士湾,是澳大利亚大陆最南端的灯塔,也是印度洋与南太平洋交汇处的标志。
5. 西黛礁灯塔(Wedding Cake Island Lighthouse):位于新南威尔士州的科奎尔岛,灯塔呈现出优雅的尖塔形状,周围环绕着美丽的海滩和珊瑚礁。
6. 奥古斯塔角灯塔(Cape Augusta Lighthouse):位于西澳大利亚州南部,灯塔俯瞰着奥古斯塔海湾,提供了壮丽的海景和迷人的日落景色。
以上仅是澳大利亚众多灯塔中的一部分,每个灯塔都有着独特的历史和美景,是澳洲旅游的重要景点之一。
了解航天事业获得的最新成就英语作文全文共3篇示例,供读者参考篇1The Sky's No Limit: Exploring the Latest Space TriumphsHi there! My name is Emily, and I'm a huge fan of everything having to do with space. Ever since I was a tiny kid, I've been fascinated by the twinkling stars at night and all the mysteries waiting to be discovered out there in the cosmos. That's why I was over the moon (get it?) when my teacher announced we'd be learning about the latest accomplishments in space exploration.Where do I even begin? There's just so much awesome stuff happening in the world of aerospace right now. I guess I'll start with the Artemis program, which is NASA's daring new quest to land the first woman and next man on the lunar surface. In 2022, an uncrewed mission called Artemis I traveled all the way to the Moon and back on a test flight. It was a big success that paved the way for Artemis II, a crewed flyby of the Moon scheduled for 2024.But the real exciting part is Artemis III, the actual landing mission targeted for 2025 or 2026. Just imagine – after morethan 50 years, new astronaut bootprints will finally grace the dusty lunar soil! This time though, instead of just hanging out for a few days like the Apollo crews did, NASA wants to establish a permanent base on the Moon. From there, we can launch future expeditions deeper into space to explore the wonders awaiting us.Speaking of ambitious exploration plans, let's talk about Mars! Studying the Red Planet has been one of humanity's biggest priorities in space for decades now. In 2021, NASA's Perseverance rover landed in Jezero Crater and quickly got to work analyzing the region for signs of ancient microbial life. It has already beamed back tons of incredible images and rock/soil data.But get this – Perseverance isn't alone on Mars anymore! In 2023, NASA's Mars helicopter Ingenuity was joined by two other rotorcraft drones from competing space agencies. One is called Ingenuity's Russian cousin, and the other goes by the cool codename "Red Furry." These little choppers are scouting potential sites of interest and paving the way for future Mars exploration.There's even been talk of trying to bring samples of Martian rock and soil back to Earth sometime in the 2030s. Can youimagine holding in your hands something that was once part of an alien world? Mind-blowing!Okay, let's leave the inner solar system for a bit and turn our eyes toward some more distant targets. In recent years, we've made amazing progress in studying the outer planets and their many unusual moons.In 2023, the Juno probe went into a special orbit to get an up-close look at some of Jupiter's largest moons like Ganymede and Europa. Scientists are particularly interested in Europa because they think it may have a vast liquid water ocean beneath its icy shell – an ocean that could possibly support life! How crazy is that?Meanwhile, after over 14 years of traveling through space, NASA's New Horizons spacecraft finally flew past a weird little object nicknamed "Arrokoth" in the Kuiper Belt region in 2019. Studying Arrokoth and other Kuiper Belt objects is helping shed light on how planets first started forming billions of years ago when our solar system was just an infant.But space agencies aren't just exploring the depths of space with robotic probes these days – they're also launching record numbers of advanced telescopes to scan the cosmos from right here on Earth. Leading the way is the incredible James WebbSpace Telescope, which has been opening our eyes to parts of the universe we've never seen before since its launch in 2021.Webb's ultra-powerful infrared vision can pierce through billowing clouds of gas and dust to reveal newborn stars and galaxies taking shape nearly 14 billion light years away – that's just a mere 500 million years after the Big Bang! With Webb's help, I've gotten to gaze upon images of some of the oldest, most distant galaxies ever detected. Many of them look like smears and blobs, but they represent pivotal moments when the universe was just a baby.Webb has also captured unprecedented views of nearby exoplanets – planets orbiting other stars light-years away from us. In 2023, it detected clouds of silicate particles swirling around a planet outside our solar system for the very first time. As if that wasn't enough, the telescope even managed to take direct pictures of a saturn-like planet with rings in another star system!Not to be outdone, observatories on Earth's surface like the Extremely Large Telescope built by the European Southern Observatory have also been making eye-opening discoveries. In 2023, it delivered images of an exoplanet that is spiraling inward toward its host star trapped in a fiery "cosmic dance of death"! Its insights into far-off planetary systems, as well as observationsof objects closer to home like asteroids and comets, are advancing our understanding of the solar system and the broader universe.One of my favorite milestones was when we finally got our first glimpse of the supermassive black hole lurking at the heart of our very own Milky Way galaxy in 2022. It was made possible through the collaborative efforts of observatories across the globe participating in the Event Horizon Telescope project. The image shows the black hole's shadow surrounded by a bright ring of glowing gas being heated up to astronomical temperatures. Eating too much of a cosmic dinner, eh?There's been so much more happening in space that I can't even begin to cover it all. Private companies like SpaceX and Blue Origin are helping make space more accessible for everyone by dramatically reducing launch costs with reusable rockets. China has been making waves with ambitious lunar and Martian exploration programs of its own. Scientists believe they may have detected biosignature gases in the clouds of Venus – a huge hint that some sort of lifeforms could possibly exist there. And don't even get me started on all the movie-like sci-fi innovations being dreamed up, like space tugs that can towwayward asteroids, or gigantic orbital sunshades to help cool the Earth and stop climate change.The cosmos is a place of infinite wonder and possibility, filled with mysteries just waiting to be solved. Though we humans are still in our earliest days of reaching out into the great unknown beyond our planet, our latest adventures into the final frontier are already paying off with discoveries that blow my mind wide open. I can't wait to see where our future journeys out among the stars will take us next!I hope you enjoyed learning more about the latest triumphs in space exploration as much as I enjoyed writing about them. The skies may look calm and peaceful from here on Earth, but out there in the inky blackness, a nonstop cosmic revolution is unfolding before our very eyes. There's a whole new universe waiting to be uncovered, and the latest space age is only just beginning!篇2The Exciting World of Space ExplorationHave you ever looked up at the night sky and wondered what's out there? I sure have! The mysteries of space have fascinated humans for centuries, and in recent years, we've madesome amazing discoveries and achievements that are helping us understand more about our universe than ever before.One of the coolest recent space achievements is the James Webb Space Telescope. This incredible telescope was launched in 2021 and it's the largest and most powerful space telescope ever built! It's so strong that it can see galaxies that formed over 13 billion years ago, just a few hundred million years after the Big Bang. With images and data from the Webb, scientists are learning more about how galaxies formed and evolved over billions of years.Another exciting space accomplishment is the Perseverance rover that landed on Mars in 2021. This car-sized rover is studying the climate and geology of Mars to search for signs of ancient microbial life. It even has a little helicopter drone named Ingenuity that flies around scouting locations for the rover! Perseverance has collected rock and soil samples that will eventually be returned to Earth for deeper study by scientists. Wouldn't it be amazing if we found evidence that life once existed on Mars?NASA also made history in 2022 when the DART spacecraft intentionally crashed into an asteroid as part of a planetary defense test mission. The aim was to see if a spacecraft impactcould successfully change the motion of an asteroid that might someday be headed towards Earth. It worked! After the impact, the orbit of the asteroid Dimorphos was altered, proving this could be an effective way to deflect a dangerous asteroid away from our planet if needed. That's pretty cool to think we now have a way to protect Earth from asteroids!Closer to home, we're learning more than ever before about our own Moon thanks to several recent lunar missions and the Artemis program to return humans to the lunar surface. NASA's Lunar Reconnaissance Orbiter has provided stunninghigh-resolution maps of the Moon's surface over the last decade. And in 2019, the Indian Space Agency's Chandrayaan-2 lander detected gaseous ammonia on the Moon for the first time, which could help reveal how the Moon was formed.Through initiatives like Artemis, NASA aims to establish a long-term human presence on and around the Moon in preparation for future crewed missions to Mars. In late 2022, the uncrewed Artemis I mission took the first step by successfully sending the new Orion crew capsule on a multi-week journey around the Moon and back. In the coming years, Artemis II will fly astronauts on a similar loop around the Moon, leading up to Artemis III when the first woman and next man will land on thelunar surface sometime after 2025. I can't wait to see the first new footprints on the Moon in over 50 years!Have you heard of SpaceX and their amazing reusable rockets? Traditional rockets are single-use and just get discarded after launch. But SpaceX's Falcon 9 rockets are designed to return to Earth and vertically land themselves so the most expensive parts can be reused on future flights. This lowers the cost of getting payloads into space tremendously compared to disposable rockets. Even cooler, SpaceX has developed a massive new reusable rocket called Starship that could one day transport crew and cargo for NASA's deep space exploration goals like landing astronauts on Mars.Another private company called Rocket Lab has pioneered techniques to make smaller, more efficient rockets to affordably launch smaller satellites. Thanks to companies like Rocket Lab, we're seeing a surge of new "cube sats" and other tiny satellites launched to study our planet, test new technologies, and more. With so many affordable satellites going up, space is becoming more accessible than ever to companies, schools, and even individual students to get experiments and projects into orbit!I haven't even mentioned all the incredible images and data we're getting from space telescopes like Hubble and Chandrathat are revealing new details about black holes, dark matter, exploding stars, and the evolution of our universe over 13.8 billion years. Or all the new Earth observation satellites carefully monitoring our planet's climate, weather, vegetation, and more from space. There's just so much happening in space exploration right now that it's hard to keep up!With plans for the first crewed missions to Mars in the 2030s, construction of new space stations orbiting the Moon, ongoing searches for habitable exoplanets, and who knows what other new discoveries, the future of space is brighter than ever. I can't wait to see what new frontiers we'll explore and what we'll learn next about our universe. The space age is only just beginning!篇3The Exciting World of Space ExplorationHi there! My name is Timmy and I'm a huge fan of everything related to space. From the twinkling stars in the night sky to the incredible rockets that blast off into the unknown, the universe has always fascinated me. Today, I want to share with you some of the awesome new things happening in space exploration. Get ready to have your mind blown!One of the coolest things that has happened recently is the launch of the James Webb Space Telescope. This incredible piece of technology was sent into space in December 2021, and it's already sending back some mind-boggling images! The Webb Telescope is the largest and most powerful space telescope ever built, and it can see farther into the universe than any other telescope before it.Using its powerful infrared cameras, the Webb Telescope has captured breathtaking images of distant galaxies, nebulae (those colorful clouds of gas and dust), and even some of the first galaxies that formed after the Big Bang! Just imagine – we're able to see objects that are billions of light-years away, and learn about the earliest days of the universe. It's like having a time machine that lets us peek into the past!Another exciting development in space exploration is the success of the Mars Perseverance Rover. This awesome little robot has been exploring the Red Planet since February 2021, and it's already made some amazing discoveries. One of its coolest achievements was successfully collecting rock and soil samples from Mars, which will eventually be brought back to Earth for studying.By analyzing these Martian samples, scientists hope to learn more about the planet's geology, climate history, and even whether life ever existed there. The Perseverance Rover has also captured some incredible images of the Martian landscape, including breathtaking panoramas and close-up shots of interesting rock formations.But perhaps the most thrilling recent event in space exploration has been the successful launch and return of the Artemis I mission. Artemis I was an uncrewed test flight of the powerful Space Launch System (SLS) rocket and the Orion spacecraft, which are designed to take humans back to the Moon in the coming years.After launching in November 2022, the Orion capsule traveled over 1.3 million miles, orbiting the Moon and testing out various systems before splashing down safely in the Pacific Ocean. This successful mission paves the way for Artemis II, which will have a crew on board, and eventually Artemis III, which aims to land the first woman and the next man on the lunar surface.Imagine how cool it would be to be one of those astronauts, walking on the Moon for the first time since the last Apollo mission in 1972! And who knows, maybe one day I'll get thechance to be an astronaut myself and explore the wonders of space firsthand.But even if I don't become an astronaut, there are still plenty of exciting things happening in space that I can follow and learn about. For example, private companies like SpaceX and Blue Origin are making huge strides in developing reusable rockets and making space travel more affordable.SpaceX's Starship system, which consists of a massive reusable rocket called Super Heavy and a spacecraft called Starship, is designed to eventually carry crew and cargo to the Moon, Mars, and beyond. And Blue Origin's New Glenn rocket is being developed to launch satellites and future human missions into space.It's amazing to think that we're living in a time when space travel and exploration are becoming more accessible and routine. Who knows what other groundbreaking discoveries and achievements lie ahead in the coming years?Maybe we'll find evidence of life on one of the moons of Jupiter or Saturn. Or perhaps we'll uncover clues about the existence of other Earth-like planets in distant solar systems. Heck, maybe we'll even make contact with an alien civilization!(Okay, that might be a bit of a stretch, but hey, a kid can dream, right?)Whatever happens, one thing is for sure – the future of space exploration is looking brighter and more exciting than ever before. With powerful new telescopes, rovers, rockets, and spacecraft at our disposal, we're unlocking the secrets of the cosmos at an unprecedented rate.And who knows, maybe someday humans will even establish permanent settlements on other planets or moons. Imagine living in a colony on Mars or the Moon, looking up at an alien sky filled with unfamiliar stars and planets. It's the stuff of science fiction, but with the rapid pace of technological progress, it might not be as far-fetched as it sounds.So there you have it, my friends – a glimpse into some of the latest and greatest achievements in space exploration. From the awe-inspiring images of the Webb Telescope to the groundbreaking missions to the Moon and Mars, it's an amazing time to be a space enthusiast like me.And who knows, maybe someday I'll be the one making history by stepping foot on another world or discovering something truly extraordinary in the vast expanse of the universe. For now, I'll just keep dreaming big, learning as much as I can,and marveling at the incredible accomplishments of the brilliant minds who are pushing the boundaries of space exploration.The universe is a vast and wondrous place, full of mysteries waiting to be uncovered. And with each new discovery and achievement, we're one step closer to unlocking its secrets. So buckle up and get ready for an out-of-this-world adventure – the future of space exploration is just getting started!。
Embarking on a journey is an experience that often leaves an indelible mark on ones memory.Heres a recount of a memorable trip that took place during the summer months.The AnticipationThe excitement began weeks before the departure.The meticulous planning involved selecting the destination,booking accommodations,and researching activities.The chosen location was a picturesque coastal town known for its pristine beaches and vibrant culture.The Journey BeginsThe day of departure arrived with the early morning sun casting a golden hue on the horizon.Luggage was packed with essentials:comfortable clothes,sunscreen,a camera to capture the moments,and a spirit of adventure.The drive to the airport was filled with anticipation and laughter,the air thick with the promise of new experiences.The FlightBoarding the plane,the feeling of being thousands of feet above the ground was exhilarating.The clouds below painted a mesmerizing tapestry of white and blue.The inflight meal was a delightful surprise,a blend of flavors that hinted at the culinary delights awaiting at the destination.Arrival and ExplorationTouching down,the first breath of the coastal air was invigorating.The town was a symphony of colors,sounds,and scents.The first day was spent exploring the local markets,sampling exotic fruits,and marveling at the craftsmanship of local artisans.Beachside BlissThe highlight of the trip was undoubtedly the beach.The sand was soft and warm underfoot,the sea a crystalclear azure that stretched as far as the eye could see.Days were spent basking in the sun,swimming in the cool waters,and building sandcastles that stood proudly until the tide came in.Cultural ImmersionThe evenings were dedicated to experiencing the local culture.Attending a traditionaldance performance was a highlight,the rhythmic beats of the drums resonating with the heartbeat of the town.Trying local cuisine at a familyrun restaurant was another unforgettable experience,each dish telling a story of the regions history and flavors.The Unexpected AdventureOne day,a spontaneous decision led to a hike through a nearby nature reserve.The trek was challenging but rewarding,with breathtaking views at the summit and encounters with wildlife that were both thrilling and humbling.The FarewellAs the trip drew to a close,there was a bittersweet feeling of satisfaction and longing. The journey back home was filled with reflections on the experiences shared and the memories created.The flight back was a quiet one,each person lost in their thoughts,the cameras memory card filled with images that would be cherished for a lifetime.Returning HomeArriving home,the transition from the adventurefilled days to the routine of daily life was a stark contrast.However,the memories of the trip served as a reminder of the beauty that lies in stepping out of ones comfort zone and embracing the unknown. This trip was more than just a vacation it was a journey of selfdiscovery,a celebration of lifes simple pleasures,and a testament to the power of shared experiences in forging lasting bonds.。
a r X i v :0705.2333v 1 [a s t r o -p h ] 16 M a y 2007Gamma Rays from the Galactic CentreA.D.Erlykin 1,2,A.W.Wolfendale 2(1)P.N.Lebedev Physical Institute,Moscow,Russia (2)Department of Physics,University of Durham,Durham,UK Abstract Recent results from the HESS gamma ray telescope have shown the presence of both a diffuse,extended,flux of gamma rays above ∼0.4TeV and discrete sources in and near the Galactic Centre.Here,we put forward a possible explanation in terms of the diffusion of cosmic ray protons from a succession of supernova remnants (SNR )in the SgrA*region of the Galaxy plus a contribution from SNR in the rest of the Galactic Centre Region,to be called the Galactic Centre Ridge (GCR ).Protons are favoured over electrons because the mG magnetic fields in the Region will attenuate energetic electrons severely.Prominent features are the need for ’anomalous diffusion’of the protons in the whole region and the adoption of low efficiency for SNR acceleration in the high density regions.The latter is related by us to the well-known low ’cosmic ray gradient’in the Galaxy.A corroborating feature is the close correlation of inferred cosmic ray intensity with the smoothed intensity of 5GHz radio radiation.We attribute this to the presence of the SNR in the GCR.1The Galactic Centre It is well known that the Galactic Centre Region (GCR )has remarkable properties,and it is not surprising that the Cosmic Ray (CR )view has singular interest.Concerning molecular gas,some 10%of such gas in the Galaxy is to be found in thecentral 200pc radius (Morris and Serabyn,1996,to be denoted I ).The magnitude is quoted as (5−10)·107M ⊙(I),with probably 4.4·107M ⊙in the region of concern here,r ≤200pc (Tsuboi et al.,1999).The mean density is very high, n >104cm −3,in many of the clouds and the filling factor similarly high:∼0.1.The mean temperature is elevated,being typically 70K (in the range 30K -200K )(I).Surrounding the molecular clouds is a very hot plasma of ‘temperature’10-15keV (I),a value which is so high as to need the presence in the past of very energetic activity,such as a giant Galactic1Centre explosion and/or the explosion of many SN within the central parsec over the past 104−105years(I).Many measurements have indicated the existence of a magneticfield of several mG, with both tangled and smooth components.A prominent feature is the presence offield ’tubes’nearly perpendicular to the Galactic Plane(I).SgrA*comprises a compact central object containing a radio source with aflat spec-trum.It is almost certain that a black hole of mass(2−3)×106M⊙is involved(I).Of many other unusual features associated with the GCR,mention should be made of the high velocity winds(500-1000kms−1)(Breitschwerdt et al.,2002;V¨o lk and Zirakashvili,2004)associated particularly with the region SgrB2(eg Sunyaev et al., 1993).Particular remarks should be directed to the’energetics’of the GCR;we are mindful of the fact that,locally,the energy densities of CR,starlight,magneticfields and gas motion are all equal at≃0.5eV cm−3(Wolfendale,1983).In the GCR we estimate, from the published data given in(I),that the energy densities of plasma,the far-infra-red radiation,magneticfields and gas motion are all several thousand eV cm−3(indeed,the magnetic energy density will be higher still over limited volumes).The features listed above all lead to particular interest in the gamma ray signal from the general region of the Galactic Centre.Early work by SAS II(Thompson et al.,1976), COSB(Mayer-Hasselwandler et al.,1982)and CGRO(Mayer-Hasselwandler et al.,1998; Hartmann et al.,1999)in the100MeV region showed that the CR intensity there was probably not very different from that locally,but the angular resolution was too poor for detailed study.More recently,CANGAROO(Tsuchiya et al.,2004),VERITAS (Kosack et al.,2004),HESS(Aharonian et al.,2004)and MAGIC(Albert et al.,2006) have observed the GC in sub-TeV and TeV gamma rays.Now,HESS,with its superior angular resolution(≃0.1◦)coupled with its higher energy range(from hundreds of GeV to tens of TeV),offers the possibility of another window on this dramatic region (Aharonian et al.,2006)and we shall base our analysis mainly on this latest work.22The cosmic ray aspectOver the years we have examined the implications of cosmic ray acceleration in supernova remnants(SNR)for a wide variety of CR phenomena.A strong case has been made for such acceleration providing the bulk of CR up to1015eV(eg Erlykin and Wolfendale, 2001)and perhaps-for a special class of SNR-beyond(Biermann,1993;Sveshnikova, 2003;Erlykin and Wolfendale,2005).Gamma ray astronomy provides a proxy indicator of CR in distant parts of the Galaxy by way of gamma ray production in CR-interstellar gas collisions and CR interaction with magnetic and photonfields.A problem is that the nature of the CR(nuclei or electrons) is not known,a priori,and also there are often difficulties with the determination of the necessary column density of gas.Nevertheless,in the absence of better ways of studying the origin of CR,we proceed,noting particularly that high energy electrons-those necessary for TeV gamma rays-will be severely inhibited by the mG magneticfields, whether they be primary or secondary(in any event,theflux of secondary electrons well away from the source will be very small).HESS has given contours of the TeV gamma ray emission from the exciting Galactic Centre Region(GCR),specifically,that bounded by−2o<l<+2o,−1.2o<b<1o (http://www.mpi-hd.mpg.de/hfm/HESS).The‘map’is characterized by‘point source’emission from the‘compound SNR’G0.9+0.1and from SgrA*,very close to the nominal GC.3The basic data3.1The gamma ray mapFollowing the analysis of the HESS group,we consider the region:|l|<1.6o and|b|<0.3o. Figure1shows the profile of the‘intensity’(actually the counts)as a function of longitude (Aharonian et al.,2006).The result of subtracting the two point sources(G0.9+0.1 and Sgr A*)is indicated.The workers used the known point spread function(PSF)for this subtraction.The background has been also subtracted.The authors point out that the diffuse gamma-ray emission diminishes with longitude in the studied region and fades away at|l|>1.2◦inspite of the fact that there is a3substantial amount of gas at least at positive longitudes of l>1.2◦.They explain this profile assuming that gamma rays are produced in CR-gas collisions and CR have a gaussian distribution around the GC with a bestfit width of0.8◦.In what follows we draw the physical scenario of the observed features.We examine the possibility that our SNR model has validity here,too,viz that SNR are the sources and that the CR propagate in a diffusive manner.Specifically,we assume that many SNR occurred near the GC during the last104−105years,(and extending back,perhaps,evenlonger)as already suggested.As in the HESS group scenario the gamma rays came from the interactions of CR protons from SNR with the ambient high density gas,essentially all the gamma rays from SgrA*coming from the burst of SNR,the remainder(from the GCR)coming either from the burst of SNR or the’conventional SN’in the GCR(which would surely be expected in view of the considerable amount of stellar activity).Figure1:The HESS results on gamma rays from the Galactic Centre Region(Aharonian et al.,2006). The histogram gives the profile of gamma ray intensity above0.38TeV for|b|<0.2◦.Two’point’sources have been removed,as indicated by dashed lines.The solid line is the column density of molecular hydrogen between the same latitude limits normalised to the same total area.The dashed line shows the gamma-rayflux expected if the CR density distribution can be described by a Gaussian centred at l=0◦and with rms0.8◦(following the analysis of the HESS group).43.2The distribution of target gas and the inferred CR intensityMany measurements have been made of the distribution of gas in the GC region,most notably using CO(eg Bania et al.,1977,Oka et al.,1998)and CS(Tsuboi et al.,1999). An apparent feature,common to all analyses,is the very high density of gas(H2)in the region.As the last authors have remarked,there are peculiar structures here which are ‘presumably related to the unique activity in the GC region’.The HESS group used the CS data to give the consequent column density of molecular hydrogen and we have done the same,although we have applied a correction for the loss of lower density molecular gas from the work of Dame et al.,2001for the region|l|<−1◦.At the beginning we tried tofind the general characteristics of CR in the GC region. Unlike the HESS group’s assumptions about the gaussian distribution of CR around the GC we adopted a uniform distribution in this area and started with the local value of the CR ing our emissivity of the yield of gamma rays per hydrogen atom for the local CR spectrum(Erlykin and Wolfendale,2003)we have derived R(l)-the ratio of the observed/expected gamma ray intensity with the result shown in Figure2.If the observed gamma rays originate indeed from CR-gas collisions the gas distribution is eliminated from R(l)and this ratio gives the actual CR longitudinal profile compared with the assumed uniform distribution.The possible contribution of electrons is ignored in this assumption following the arguments in§2.The mean value of R(l) averaged over the interval of−1.4◦<l<1.4◦is2.44±0.41 for the totalflux including the central source.Without the central source it is R(l) = 1.83±0.15.It is with the interpretation of this plot that we shall be mainly concerned.3.3The radio mapOf likely relevance is the radio map for the same region.Figure2shows the average intensity over|b|<0.3o derived by us from the5GHz data of Altenhof et al.,1979,that, for10GHz is very similar(Handa et al.,1987).Its relevance will be considered briefly here and in more detail in§5.3.Inspection of Figure2shows that there is a correlation between the excess CR intensity and the radio emission intensity and this is quantified in Figure3.The slope of the straight linefit is0.96±0.11and the corrrelation coefficient is0.85;there is thus strong evidence5Figure2:Ratio of observed to expected gamma ray intensity for Eγ>0.38TeV,the expectation beingthat the CR intensity is the same as that locally;the ratio is thus that of the proton intensity to that locally:R(l).The full line shows the ratio for the total gamma-ray intensity,the dashed line-the same,but with the central source subtracted,the dotted line-the profile of the radio intensity in arbitrary units.The contribution from CR electrons is ignored following the arguments in§2.Inspection of the basic data in Figure1shows that most of the peaks are significant at the2-3standard deviation level.for linearity.Although some of the radio photons come from discrete sources(’young’pulsars,etc)and SNR at the‘centers’of the condensed contours many come from surrounding regionsand are due to CR electrons(from old pulsars,SNR etc)undergoing synchrotron radi-ation in the strong magneticfields in the region,together with a’thermal contribution’, which in fact is greater than the non-thermal(ie from synchrotron radiation)at this frequency.In fact,the thermal contribution,too,is(statistically)correlated with the sites of SNR from reasons of energetics.Of importance is the fact that the positions of the peak intensities in the maps at5 GHz,10GHz,60µ(IRAS),10GHZ,5GHZ and2.7GHz(Effelsberg:http://www.mpifr.de/oldFigure3:Correlation of the CR intensity(as distinct from the gamma-ray intensity)with the integrated radio intensity(at5GHz)for|b|<3◦.The results relate to the GCR.and past)in the GCR is enhanced by the linear size distribution of the excesses in Figure 2,as will be demonstrated later.4Analysis of the data4.1General RemarksWe start with Figure1.It is interesting,and perhaps very significant,to note the large discrepancy in the region between l=+1◦and l=+2◦between the column density of gas and the measured gamma ray intensity-a discrepancy that would not exist if the CR intensity were constant.In other words,there is a significant fraction of the gas in the GCR(some18%)that is under-populated by CR.It is this mass of gas,beyond l=1◦, that makes the gas non-symmetric about the Galactic Centre.The question of symmetry in the various GCR properties is taken up again later.Moving to Figure2,a number of remarks can be made.(i)The likelihood of systematic errors in the inferred column density of molecularhydrogen means that the absolute values of the enhancement in CR intensity ratio7(denoted R(l))are uncertain.However,the shape of the longitude-dependence should be reasonable.(ii)There should be a trend of diminishing R(l)with increasing|l|if our contention about diffusion of CR from sources in SgrA*is correct.(iii)Some measure of correlation of R(l)with the integrated radio intensity should occur if,as has been remarked,there are SNR in the GCR itself.An alternative way of approaching this problem is in terms of CR diffusion-in high B regions there will be a smaller diffusion coefficient because of increased turbulence.4.2Overall CR excessInspection of Figure1shows that the gamma ray excess falls down slightly when receding from the Galactic Centre,ie with increasing|l|and,correspondingly,the CR intensity also falls.Certainly the GCR is a singular region with unique properties.Any extrapolation of its characteristics to the wider longitude range should be taken with care.However, taking into account the large errors in the observed intensity of the diffuse gamma rays and uncertainty in the column density of the gas we cannot rule out a weaker longitude dependence of the CR intensity in the wider longitude range of the Inner Galaxy,than is indicated in Figure2.The analysis of the diffuse gamma-ray profile at lower GeV energies obtained with the SASII satellite indicated a weak radial CR gradient in the Inner Galaxy,(Issa and Wolfendale,1981),as did the CGRO satellite(Strong and Mattox,1996).The CR intensity in the Inner Galaxy does not exceed the local value by a factor of more than 1.2.If our latter value of the excess equal to1.83±0.15can be extrapolated into a wider longitude region than|l|<1.6◦,it might mean that the CR gradient for sub-TeV and TeV energies is stronger than for GeV energies,as has been predicted by us(Erlykin and Wolfendale,2002).4.3The GC RegionOur model,to be tested,comprises SN which have exploded in the central region(to-gether,probably,with the’normal quota’of SNR associated with the gas in general),8providing protons which diffuse away and permeate the molecular gas,in which they pro-duce secondary pions and thereby gamma rays.It is supposed that recent SN provide the peak at the position of SgrA*itself(to be discussed later).In Figure4we show the gamma-ray profile expected from a single SN which exploded either104or105years ago.Calculations have been made for both‘normal’and‘anoma-lous’diffusion(the distinction relates to the nature of the’scattering centres’in the interstellar medium).Briefly,the difference between them can be reduced to two basic features:(i)the diffusion radius R d(t)for anomalous diffusion depends linearly on time as R d(t)∝t√while for normal diffusion R d(t)∝)2)−2.R dThe difference between these two diffusion modes is discussed in more detail in Lagutin,2001, Erlykin and Wolfendale,2002,Erlykin,Lagutin and Wolfendale,2003.The effective averaged gas density in our calculations for the region in question|l|< 1.6◦,|b|<0.3◦is100cm−3(this being much less than the high values of∼104cm−3quoted because of the presence in our studied volume of a large volume of low density material and the’filling factor’,ie the fraction of space occupied by the high density molecular gas).It is seen that there is no sharp peak in the centre even for the youngest SN with an age of104years.The fall of the intensity with longitude in the wings is too strong to be compatible with the experiment.If we reduce the age below104years the sharpness of the peak increases but the fall of the intensity in the wings increases too.Therefore,to get agreement with experiment both in the central peak and in the wings(Figures1and 2)we cannot use just a single SN and need the succession of SN explosions distributed in time.In Figure5we show the results of the calculation for a succession of SN in SgrA*. Two sets of SN rates are taken:102SN in104years and103SN in105years with the uniform temporal distribution of SN explosions within these time intervals.Since the average rate in both cases is1SN in100years the diffusion approximation for CR from9Figure4:Longitude dependence of the gamma ray intensity from a single source at longitude l,in a medium of density100cm−3at b=0◦.Two ages are considered,104and105years and two modes of diffusion:normal and anomalous.some young SN and large distances from the GC cannot be valid because the CR velocity cannot exceed the speed of light.We have introduced limitations for this effect and have found that the gamma-ray intensity atℓ=2◦decreased by∼1.6%.In all subsequent calculations we applied these limitaions.In Figure5the(important)sharp spike,which results mainly from SNR younger than about104years,from which the CR do not diffuse very far,is a consequence of anomalous diffusion.Normal diffusion gives a much weaker spike(see also Figure4). In practice,in view of the sources being in SgrA*itself,where the density is very much higher than100cm−3,the peak will be even higher.The other,later SN will have given particles which have diffused out to permeate more of the molecular material in the GCR.The extent to which the idealised’lateral distributions’in Figure5would be modified using the actual column density of gas(rather than gas of constant density),averaging over the galactic latitude interval|b|≤0.3◦and applying the correction for thefinite angular resolution of the telescope of0.1◦,can be seen in Figure6.The general trend is seen to be preserved.For the comparison we also provide the results of HESS observa-tions.The difference between the absolute values of calculated and observed intensities10Figure5:The angular profile of the gamma ray intensity in the GCR predicted for our model with n=100cm−3and either103SN in105years at the position of SgrA*,placed at the longitudeℓ=0◦,or 102SN in104years.Results are given for boh anomalous and normal diffusion.is discussed below.5Interpretation of the results5.1General RemarksGuidance as to the frequency of SN comes from remarks in a variety of works(eg I)that of order102SN in104years to103SN over the past105years would have been sufficient to provide the energy necessary for the very strong wind and other features visible in this unique region of the Galaxy.Production over a longer period seems unlikely,although it must be said that there is some evidence for a bout of star formation between3·106and 7·106years age(Krabbe et al.,1995).It must be admitted that the manner in which the particles diffuse in this region is debatable both by way of the diffusion coefficient to adopt and the manner of diffusion, viz‘normal’or‘anomalous’.We consider that,in view of the disturbed conditions in the region and highly non-uniform distribution of gas,the mode of diffusion in the very central region at least will be’anomalous’(Erlykin,Lagutin and Wolfendale,2003).Concerning11Figure 6:Angular profile of gamma ray intensity for the whole GCR for 103SNR in 105years and for the actual molecular gas distribution of Figure 1(allowed for in an approximate way ).The results of calculations are averaged over the galactic latitudes |b |≤0.3◦and smoothed taking into account the finite angular resolution of the telescope of 0.1◦.Normal and anomalous diffusion are presented by dotted and dashed lines respectively.The results of HESS observations are also shown by the full line for comparison.the diffusion coefficient,in the absence of clear information we adopt the ‘local’value (pertaining to the Galaxy as a whole).5.2SgrA*aloneIt is easiest to consider this region alone to start with.With only one SN,young enough that the particles are sufficiently confined to the region as to give gamma rays which are well within the point spread function (PSF )of the detector ≃0.1◦,the predicted flux can be taken from our earlier work (Erlykin,Wolfendale,2003)F γ(>1T eV )=35·10−12 E o1cm −3 df can,of course,be much less than unity if the physical conditions in the SNR differ considerably from the conventional ones,resulting in weaker shocks,etc.The result is Fγ(>1T eV)=5f×10−12cm−2s−1.Following the HESS work,we adopt0.38TeV as the threshold energy and,using the measured spectrum of gamma rays(with differential exponentγ=2.3),the observed totalflux from the GC including the point source at SgrA*isFγ(>0.38T eV)=24×10−12cm−2s−1Fγ(>1T eV)=7×10⁻¹²cm−2s−1Taken at face value,this would require,for one SN alone,f≃1.4.Thus,for100or1000 SN we would need f≈10−2or10−3It is evident that there is no shortage of energy in the SNR hypothesis.Later observations have given slightly different values of thefluxes and threshold energy but our arguments are unchanged.Figures5and6allow us to make a more accurate estimate.Theflux from the spike within|l|<0.2◦would qualify as that from the discrete source insofar as itsfinite width would not be detected in the presence of a PSF with the half width at half maximum of 0.1◦(which has a wide tail).Of the two situations considered,it is evident that102SN in104years gives too steep a’lateral distribution’(comparing Figure5with Figure2)but the shape for103SN in 105years is close.Here,for|l|<0.2◦,we predict aflux of5·10−9cm−2s−1for the case of anomalous diffusion.The observedflux is7·10−12cm−2s−1so that f≃1.4·10−3for this case.5.3The Galactic RidgeAs remarked already it is evident that the fall of predicted gamma ray intensity with increasing longitude is about right to explain the gamma ray profile for103SN in105 years.There is a problem,however,in that the’inner wings’of the predicted distribution, from|l|:0.05◦to0.4◦,are too strong.A likely explanation here is in terms of a non-uniform temporal distribution.An estimate of the expectedflux in the Ridge can be derived from Figure6:it is8.6·10−9cm−2s−1.With the efficiency factor of1.4·10−3 derived for the sources in SgrA*we have12·10−12cm−3s−1,to be compared with the13observed17·10−12cm−2s−1.The result is close,although we have to admit that many parameters involved in the calculations are uncertain.This is where the SNR,which undoubtedly must be present in the Ridge material itself,may assume importance.Their likely number can be estimated.as follows.For the Galaxy as a whole,with molecular mass M(H2)∼109M⊙(Dame et al.,2001)and SN rate10−2y−1,we have∼10−11M−1⊙y−1.It is likely that this value is also appropriate to the Ridge region so that in105y,with a mass of4.4·107M⊙,we expect44.In fact,the number may be nearer10in view of the dependence of SNR density on column density of molecular hydrogen being slower than linear,more nearly to the power0.6(using the summary of Fatemi and Wolfendale,1996for SNR,pulsars and N(H2)).Assuming that these SN give the same contribution to theflux in the wings as the central SN and using the calculatedflux in the Ridge for1000central SN of8.6·10−9cm−2s−1and observed flux of1.7·10−11cm−2s−1,the derived f-value is∼0.1.A measure of validity for the view of a significant,or even major,contribution from the’conventional’SNR comes from the CR-radio correlation(Figure3and§3.3).Three of the diffuse radio sources appear in the SNR catalogue of Green(2000)and in general we would expect the radio map to be a good indicator of past and present SNR.A similar situation arises for the radio map and identified SNR for the Large and Small Magellanic Clouds(Mills and Turtle,1984).A natural explanation would exist for the’bumps’in Figure2in terms of SNR,in view of the expected profiles of CR-produced gamma rays shown in Figure4;SNR of(typical)age a few104years would have profiles similar to the’bumps’in Figure2.Specifically,the mean half-width of the bumps which can be resolved is∼0.24◦and this is just what would be expected for about10SN having exploded in the last105years.So far,therefore,there seem to be two possibilities to explain the results.Firstly, there were103SN in105years in SgrA*,the CR diffusing through the Ridge causing the Ridge emission and the recent SN giving CR very close to SgrA*which caused the point source.The problem is that the needed gas density to get the observed ratio of Ridge flux to SgrA*’point source’flux is very low,by SgrA*standards.Secondly,perhaps the SNR in the Ridge itself were responsible for the CR there.The number of SN in SgrA*could then be smaller,with higher density gas allowed.The14problem with the high intensity predicted in the range l:0.05◦to3◦or4◦would then be minimized-it would be due simply to a statisticalfluctuation.5.4The efficiency-factor,fThere are many phenomena which could contribute to f being less then unity for the unusual conditions in the GCR.These are,mainly,1.The possibility that the majority of SN there are not of Type II-the main sourcesof SNR which accelerate CR to very high energies.2.The high gas density causes the Sedov radius(which is proportional to n−2on Galactocentric radius,R(eg Erlykin et al.,1996;Hunter,2001.)and we believe that this has relevance,here.As is well known,the gradient for CR is far less than that for the(assumed)parent SNR.A number of possibilities have been put forward,involving, for example,Galactic winds(Breitschwerdt et al.,2002;V¨o lk and Zirakashvili,2004)and radial dependent diffusion coefficients(Erlykin and Wolfendale,2002).The results from the present analysis of the GCR lead to our suggesting that the efficiency of CR production by SNR compared with the standard model where10%of the explosion energy is transformed into CR,is dependent on the nominal gas density of the ambient medium into which the SN expands.It will be apparent from the start that the low implied CR intensity at the GC despite the large number of SNR is in the spirit of a gas density dependent SNR efficiency.In Figure7we present the‘CR efficiency’,given here as the ratio of inferred CR intensity,I(CR)to the surface density of SNR(as used by us previously,Erlykin and Wolfendale,2005)versus the surface density of molecular hydrogen,σ(H2),as well as the GC values.The fall-offof efficiency withσ(H2)is very marked.5.6The preferred modelAt this stage it is not possible to decide between the two models but the mixed model (ie SN in both SgrA*and the Ridge)appears more likely.The f-values for the two situations are given in Figure7.Consideration can be given to each region in turn.SgrA*.One hundred SN is probably the smallest that can be allowed,and able to give the necessary energy injection for the high wind,plasma temperature,etc.Thus, for one thousand SN thefigure is1.4·10−3(not much smaller because much of the CR energy escapes from the central region).The Galactic Ridge.For10sources,we have f≃0.1.The values are plotted in Figure7.The abscissae are illustrative in that they are the approximate surface densities of gas for the regimes in question.Also shown in Figure7is the result for the source G0.9+0.1,which appears to be due to a single SNR.It should be remarked that the region in which the SN exploded is outside the region of high gas density and thus the efficiency might be expected to be comparatively high.16。