水土保持
97
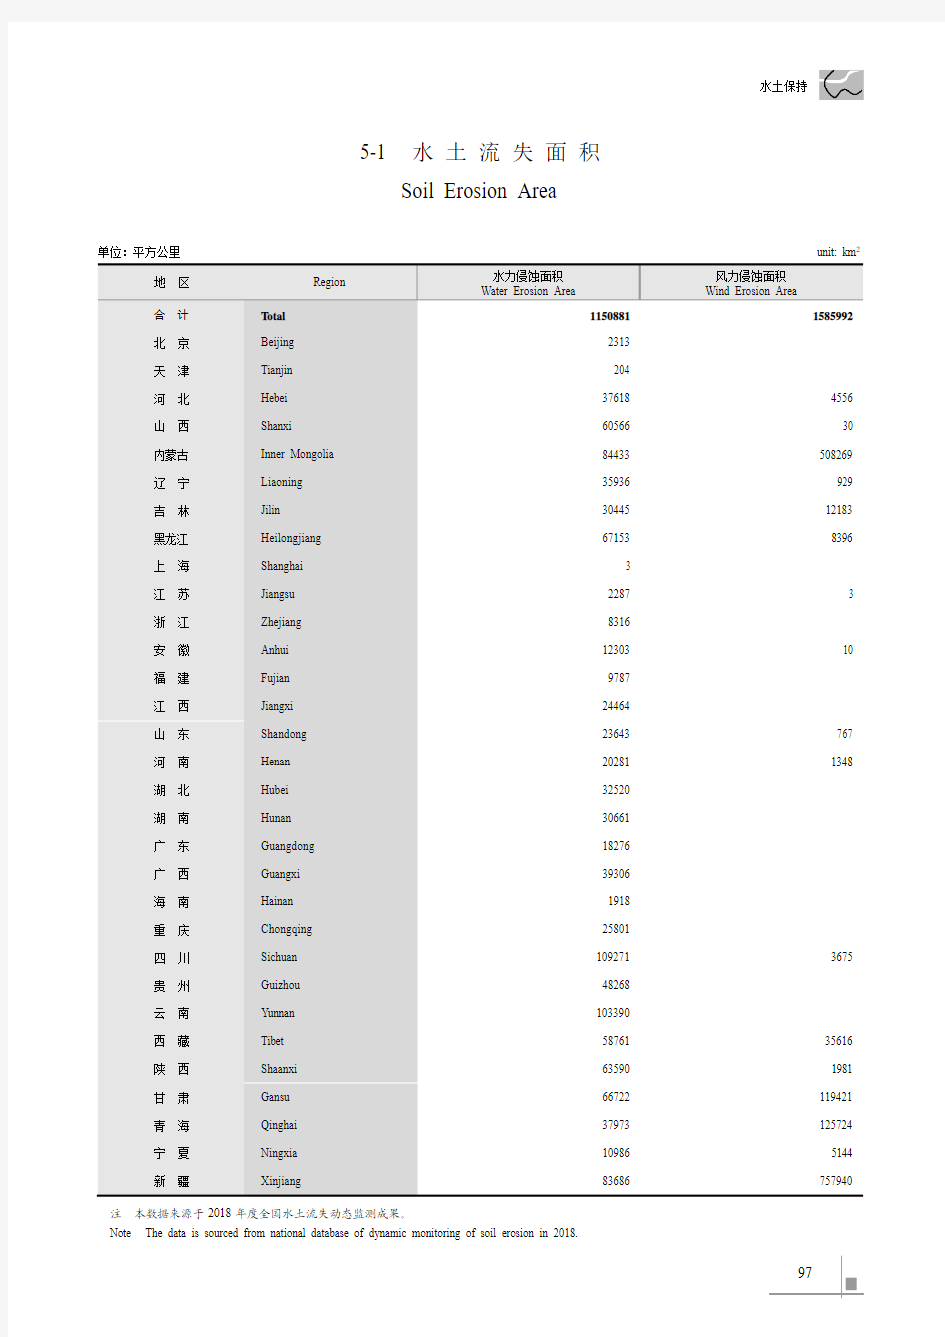
5-1 水 土 流 失 面 积
Soil Erosion Area
单位:平方公里
unit: km 2
地 区 Region
水力侵蚀面积 Water Erosion Area
风力侵蚀面积 Wind Erosion Area
合 计 T otal 1150881
1585992
北 京 Beijing 2313 天 津 Tianjin 204 河 北 Hebei 37618 4556 山 西 Shanxi 60566 30 内蒙古 Inner Mongolia 84433 508269
辽 宁 Liaoning 35936 929 吉 林 Jilin 30445 12183 黑龙江 Heilongjiang 67153
8396
上 海 Shanghai 3 江 苏 Jiangsu 2287 3 浙 江 Zhejiang 8316 安 徽 Anhui 12303 10 福 建 Fujian 9787 江 西 Jiangxi 24464 山 东 Shandong 23643 767 河 南 Henan 20281 1348
湖 北 Hubei 32520 湖 南 Hunan 30661 广 东 Guangdong 18276 广 西 Guangxi 39306 海 南 Hainan 1918 重 庆 Chongqing 25801 四 川 Sichuan 109271 3675
贵 州 Guizhou 48268 云 南 Yunnan 103390 西 藏 Tibet 58761 35616 陕 西 Shaanxi 63590 1981 甘 肃 Gansu 66722 119421 青 海 Qinghai 37973 125724 宁 夏 Ningxia 10986 5144 新 疆
Xinjiang
83686
757940
注 本数据来源于2018年度全国水土流失动态监测成果。
Note The data is sourced from national database of dynamic monitoring of soil erosion in 2018.
江河湖泊及水资源 1-16 历年水资源量 Water Resources by Years 年份Year 水资源总量地表地下 地表水与地下 水资源重复量 降水总量人均水资源量(亿立方米)水资源量水资源量(亿立方米)(亿立方米)(立方米每人)Total Available (亿立方米)(亿立方米)Duplicated Measurement Total Per Capita Water Resources Surface Water Resources Groundwater Resources between Surface Water Precipitation Water Resources (108m3) (108m3) (108m3) and Groundwater (108m3) (m3/person) (108m3) 1997 27855 26835 6942 5923 58169 2253 1998 34017 32726 9400 8109 67631 2723 1999 28196 27204 8387 7395 59702 2219 2000 27701 26562 8502 7363 60092 2194 2001 26868 25933 8390 7456 58122 2112 2002 28261 27243 8697 7679 62610 2207 2003 27460 26251 8299 7090 60416 2131 2004 24130 23126 7436 6433 56876 1856 2005 28053 26982 8091 7020 61010 2152 2006 25330 24358 7643 6671 57840 1932 2007 25255 24242 7617 6604 57763 1916 2008 27434 26377 8122 7065 62000 2071 2009 24180 23125 7267 6212 55966 1812 23
农村水电 1737-1 历年农村水电装机容量及年发电量 Installed Capacity and Power Generation of Rural Hydropower, by Year 年份 Year 农村水电装机容量 农村水电年发电量 农村水电新增装机容量 /千瓦 /万千瓦时 /千瓦 Installed Capacity Annual Electricity Generation Newly-increased of Rural Hydropower of Rural Hydropower Installed Capacity /kW /104 kWh /kW 2001 26262406 871410214194542002 28489286947244618836482003 30832992979163326188342004 34661348977954135913222005 385344451209034041272722006 431835511361294254595202007 473889971437008045931932008 512743711627590141941062009 551212111567247038070722010 592401912044425637935512011 621234301756686732774652012 656860712172924633996162013 711862682232771124606012014 73221047228149292553873注 2013年农村水电统计数据与全国第一次水利普查数据进行了校核。 Note Statistical data of rural hydropower is checked in accordance with the First National Census on Water.
下载说明:请下载该文档,下载完成后,请输入链接直接下载。百度云链接:https://www.doczj.com/doc/226289399.html,/s/1hq1QJM8 (由于文库上传不了统计年鉴的格式,请见谅!) 备注:每一个年份需要下载一次。(根据国家发布的版本,2008年及08年以后都有excel 版本和网页版本) 我会根据收到的财富值给您压缩密码。 数据年份:中国科技统计年鉴2001年—2013年。 2013年部分内容展示: 6-1 国家主要科技计划中央财政拨款 Appropriation for S&T by Central Government in the Main Programs of S&T 单位:万元(10 000 yuan) 项目Item 200 1 2005 2006 2007 2008 200 9 201 2011 201 2 863计划863 Program 731 53 3986 27.8 6 379 501 444 416. 1 559 200 51 15 00 511 500 5115 00 551 500 基础研究计划Basic Research Program 国家自然科学基金 National Natural Science Fund 159 835 2701 28 362 014 433 096 535 851 64 26 97 103 810 9 1404 342. 8 170 000 国家重点基础研究发 National Key Basic Research 600 00 1000 00 978 92 129 263 150 415 18 99 76 271 813 3092 44.5 267 819 展计划(973计划) Program of China 国家重大科学研究 National Major Scientific 375 26.9 5 353 18 395 85 70 02 4 128 187 1407 55.5 132 181 计划 Research Program of China 科技支撑计划/科技Key Technologies R&D Program 105 340 1624 40 288 790 542 337 506 556 50 00 00 500 000 5500 00 642 555 攻关计划
Rivers, Lakes and Water Resources 8 1-4 河流流域面积Drainage Area of Basins 流域名称River 流域面积占外流河、/平方千米内陆河流域 面积合计 /% Drainage Percentage Area to Total /km2/% 合计T otal 9506678 100.00 外流河Out-f lowing Rivers 6150927 64.70 黑龙江及绥芬河Heilong River and Suifen River 934802 9.83 辽河、鸭绿江及沿海诸河Liaohe River, Yalu River and Coastal Rivers 314146 3.30 海滦河Hai-Luan Rivers 320041 3.37 黄河Yellow River 752773 7.92 淮河及山东沿海诸河Huaihe River and Coastal Rivers in Shandong 330009 3.47 长江Yangtze River 1782715 18.75 浙闽台诸河Rivers in Zhejiang, Fujian and Taiwan 244574 2.57 珠江及沿海诸河Pearl River and Coastal Rivers 578974 6.09 元江及澜沧江Yuanjiang River and Lancang River 240389 2.53 怒江及滇西诸河Nujiang River and Rivers in West Yunnan 157392 1.66 雅鲁藏布江及藏南诸河Yarlung Zangbo River and Rivers in South Tibet 387550 4.08 藏西诸河Rivers in West Tibet 58783 0.62 额尔齐斯河Irtysh River 48779 0.51 内陆河Inland Rivers 3355751 35.30 内蒙古内陆河Inland Rivers in Inner Mongolia 311378 3.28 河西内陆河Inland Rivers in Hexi Corridor Region 469843 4.94 准噶尔内陆河Inland Rivers in Junggar Basin 323621 3.40 中亚细亚内陆河Inland Rivers in Central Asia 77757 0.82 塔里木内陆河Inland Rivers in Tarim Basin 1079643 11.36 青海内陆河Inland Rivers in Qinghai 321161 3.38 羌塘内陆河Inland Rivers in Qiangtang 730077 7.68 松花江、黄河、藏南闭流区 Closed-Drainage Area of Songhua River, Yellow River and Rivers in Southern Tibet 42271 0.44 注本表数据为2002—2005年进行的第二次水资源评价数据。 Note The data in this table are sourced from the second water resources evaluation between 2002 and 2005.
水土保持 97 5-1 水 土 流 失 面 积 Soil Erosion Area 单位:平方公里 unit: km 2 地 区 Region 水力侵蚀面积 Water Erosion Area 风力侵蚀面积 Wind Erosion Area 合 计 T otal 1150881 1585992 北 京 Beijing 2313 天 津 Tianjin 204 河 北 Hebei 37618 4556 山 西 Shanxi 60566 30 内蒙古 Inner Mongolia 84433 508269 辽 宁 Liaoning 35936 929 吉 林 Jilin 30445 12183 黑龙江 Heilongjiang 67153 8396 上 海 Shanghai 3 江 苏 Jiangsu 2287 3 浙 江 Zhejiang 8316 安 徽 Anhui 12303 10 福 建 Fujian 9787 江 西 Jiangxi 24464 山 东 Shandong 23643 767 河 南 Henan 20281 1348 湖 北 Hubei 32520 湖 南 Hunan 30661 广 东 Guangdong 18276 广 西 Guangxi 39306 海 南 Hainan 1918 重 庆 Chongqing 25801 四 川 Sichuan 109271 3675 贵 州 Guizhou 48268 云 南 Yunnan 103390 西 藏 Tibet 58761 35616 陕 西 Shaanxi 63590 1981 甘 肃 Gansu 66722 119421 青 海 Qinghai 37973 125724 宁 夏 Ningxia 10986 5144 新 疆 Xinjiang 83686 757940 注 本数据来源于2018年度全国水土流失动态监测成果。 Note The data is sourced from national database of dynamic monitoring of soil erosion in 2018.
水利建设投资 115 6-4 历年水利建设投资规模和进展 Investment and Progress of Water Project Construction by Year 单位:万元 unit: 104 yuan 年份 Year 在建项目实际 累计完成 累计新增 未完工程累计 需要总投资 投资 固定资产 # 当年新增 完成投资 Total Needed Accumulation of Accumulation of Newly- Completed Investment of Projects Completed Newly-increased increased Investment of Under-construction Investment Fixed Assets of the Present Year Uncompleted Project 2005 59195516 31451336204270985741035 11016751 2006 61205439 32795254229993085414850 9794480 2007 57498856 33186759229476927255913 10236968 2008 66787193 38436646252251838451275 13211463 2009 78208336 462082443129525415546720 14912990 2010 99662055 566935833871522118497877 17978362 2011 117692905 688774704243376819512353 2012 137031324 890595805775311027566037 2013 153460025 1014231765577091727804200 2014 199517592 1195046377021022133433685 2015 225806790 1459065228979918343734768 2016 235892045 141743152 91157375 40466678 注 本表只包括当年正式施工的水利工程设施项目和机构能力项目。 Note The data only includes projects of water infrastructures and capacity building formally initiated in the present year.
江河湖泊及水资源 23 1-16 历 年 水 资 源 量 Water Resources by Year 水资源总量 地表水资源量 地下水资源量 地表水与地下 水资源重复量 降水总量 人均水资源量 /亿立方米 /亿立方米 /亿立方米 /亿立方米 /亿立方米 /立方米每人 Total Available Surface Water Resources Groundwater Resources Duplicated Amount Total Per Capita Water Resources of Surface Water Precipitation Water Resources and Groundwater 年份 Year /108m 3 /108m 3 /108m 3 /108m 3 /108m 3 /(m 3/person) 1997 27855 26835 6942 5923 58169 2253 1998 34017 3272694008109676312723 1999 28196 2720483877395597022219 2000 27701 2656285027363600922194 2001 26868 2593383907456581222112 2002 28261 2724386977679626102207 2003 27460 2625182997090604162131 2004 24130 2312674366433568761856 2005 28053 2698280917020610102152 2006 25330 2435876436671578401932 2007 25255 2424276176604577631916 2008 27434 2637781227065620002071 2009 24180 23125 7267 6212 55966 1812 2010 30906 29798 8417 7308 65850 2310 2011 23257 2221472156171551331726 2012 29529 2837382967141651502186 2013 27958 268408081 6963 62674 2060 2014 27267 26264 7745 6742 1999 2015 27963 2690177976735625692039
水利建设投资 127 6-8 2015年水利建设到位投资和投资完成额(按地区分) Allocated and Completed Investment of Water Project Construction in 2015 (by Region) 单位:万元 unit: 104 yuan 计划 到位投资 完成投资 投资 合计 # 中央投资 地方投资 合计 # 中央投资 地方投资 Planned Total Central Local Total Central Local Investment Allocated Government Government Completed Government Government 地区 Region Investment Investment Investment Investment Investment Investment 合 计 Total 48263718 4740146018632804 22782082 54522165 22312410 10547144 北 京 Beijing 107094 1263586075265606167089 72570 32260天 津 Tianjin 283897 28843285352171811329999 102627 27197河 北 Hebei 2533870 258613893348111844603639755 1105828 292939山 西 Shanxi 1603633 13116103812486100291467048 459011 168653内蒙古 Inner Mongolia 796559 7735424610932868221132799 685940 256223辽 宁 Liaoning 1383555 10996677953132252991514051 875490 660092吉 林 Jilin 729824 645978440633113761909428 553719 205662黑龙江 Heilongjiang 2027612 202784214005915772513092561 2058264 1480628上 海 Shanghai 1305299 1044436308621003172937565 40654 28193江 苏 Jiangsu 2078153 214471139754417355042385669 502990 172650浙 江 Zhejiang 5006101 510001629277531852525432448 350992 84434安 徽 Anhui 1203609 11667126361985305141501905 799136 534788福 建 Fujian 2348398 229691840660516878602297437 426499 217027江 西 Jiangxi 1301336 12175075770805482951509264 790688 279661山 东 Shandong 2440202 234260748829618534472910771 607946 249243河 南 Henan 1435062 145384810499653756451566448 1066628 461957湖 北 Hubei 1648766 164124712163394126791610726 1153463 409934湖 南 Hunan 1272809 12868777833474512611476353 939150 437193广 东 Guangdong 2849057 274934742565322982752478818 484111 104929广 西 Guangxi 1321859 12863597456503412491877842 1058546 512540海 南 Hainan 397448 400385166856160319467061 255483 87595重 庆 Chongqing 1665083 17088355050838068661883644 648359 298851四 川 Sichuan 1645087 168889511346234916911895872 1334634 497955贵 州 Guizhou 1265736 12919807629744471011356491 860556 261550云 南 Yunnan 3108762 318075580207517329073413860 860200 273828西 藏 Tibet 638650 63722556839853003526128 479911 409894陕 西 Shaanxi 1723437 17239189153714109341949416 1023602 552894甘 肃 Gansu 1345595 14286745695662580421589331 817506 461911青 海 Qinghai 228693 22871514973473768366481 225663 115636宁 夏 Ningxia 388529 357050252297104753413273 288045 114716新 疆 Xinjiang 2180003 2164875 1197049 584506 2422635 1384199 856112 注 本年投资来源中只单列中央和地方政府投资,利用外资、企业和私人投资以及贷款等投资包含在合计项目中。 Note Only central and local government investment are listed separately in the sources of the investment in the present year and the investments of foreign capital, enterprises, private sector and bank loans are included in the total.