怎样写好英语图表分析作文
- 格式:doc
- 大小:414.00 KB
- 文档页数:30

图表分析型英语作文When writing an analytical essay based on a chart it is important to follow a structured approach that allows you to effectively communicate the information presented in the chart. Heres a stepbystep guide to help you write a wellorganized and insightful chart analysis essay in English1. IntroductionBegin with a brief introduction to the chart mentioning its title and the general subject it covers.State the purpose of the essay which is to analyze the data presented in the chart. ExampleThe chart titled Trends in Global Carbon Emissions provides a comprehensive overview of the changes in carbon emissions worldwide from 2000 to 2020. This essay aims to analyze the data presented in the chart to identify patterns and draw conclusions about the trends in carbon emissions.2. Overview of the ChartGive a general description of the chart including the type of chart bar line pie etc. the variables it represents and the time period or categories it covers.Mention any notable features or patterns that are immediately apparent.ExampleThe line chart displays the annual carbon emissions in millions of metric tons for five countries China the United States India Russia and Japan. The data spans two decades allowing for a clear visualization of the trends and fluctuations in emissions over time. 3. Detailed AnalysisBreak down the data into sections or categories for detailed analysis.Compare and contrast the data points highlighting any significant increases decreases or steady trends.Use specific data points to support your observations e.g. exact figures percentages or rankings.ExampleIn the initial years the United States led in carbon emissions peaking at 6000 metric tons in 2005. However Chinas emissions have since surged overtaking the U.S. in 2009 andreaching a high of 10500 metric tons by 2020. Indias emissions have also seen a steady increase starting from 1000 metric tons in 2000 to approximately 2500 metric tons in 2020.4. Interpretation of TrendsDiscuss the possible reasons behind the observed trends.Consider economic technological policy or environmental factors that could have influenced the data.ExampleThe significant rise in Chinas carbon emissions can be attributed to its rapid industrialization and economic growth. On the other hand the United States relatively stable emissions could be a result of the countrys investment in renewable energy sources and stricter environmental regulations.5. ConclusionSummarize the main findings of your analysis.Restate the trends and patterns you identified and briefly discuss their implications or significance.End with a thoughtprovoking statement or a call to action if appropriate.ExampleIn conclusion the chart reveals a clear shift in the global carbon emissions landscape with emerging economies like China and India experiencing substantial growth in emissions. This analysis underscores the urgent need for international cooperation and sustainable development strategies to mitigate the environmental impact of increasing emissions. 6. Recommendations OptionalIf relevant suggest recommendations for addressing the issues highlighted by the chart. These could include policy changes technological advancements or public awareness campaigns.ExampleTo address the growing concern of carbon emissions it is recommended that countries prioritize the development and adoption of clean energy technologies. Additionally international agreements and collaborations can play a crucial role in setting emission reduction targets and sharing best practices for sustainable development.Remember to use clear and concise language and ensure that your essay is wellstructuredwith smooth transitions between paragraphs. Use appropriate academic vocabulary and maintain an objective tone throughout the essay.。

调查图表分析作文英语模板Introduction:The given chart provides an insightful analysis of [topic]. This essay aims to delve into the data presented and offer a comprehensive analysis of the trends and patterns depicted in the chart.Overview of the Data:The chart illustrates [describe the main components of the chart]. It is evident from the chart that [provide an overview of the main trends or patterns observed].Detailing the Trends:1. Trend 1: 。
Explanation: [Describe the first trend observed in the chart].Example: [Provide specific data points or examples from the chart to support the trend].Implications: [Discuss the implications or significance of this trend].2. Trend 2: 。
Explanation: [Describe the second trend observed in the chart].Example: [Provide specific data points or examples from the chart to support the trend].Implications: [Discuss the implications or significance of this trend].3. Trend 3: 。

英语图表作文写作技巧Writing an English essay about chart analysis requires a structured approach and attention to detail. Here are some key techniques to consider:1. Understanding the Chart: Before writing, thoroughly analyze the chart or graph provided. Identify the type of chart (bar graph, line graph, pie chart, etc.) and understand the data it presents. Pay attention to labels, axes, units, and any trends or patterns.2. Introduction: Begin your essay with an introduction that provides context for the chart. State what the chart illustrates and its significance. Briefly outline the main points you will discuss in the essay.3. Describe the Data: In the body paragraphs, describe the data shown in the chart. Provide specific details such as numbers, percentages, or trends. Use appropriate vocabulary to describe the data accurately and clearly.4. Compare and Contrast: If the chart includes multiple sets of data, compare and contrast them. Identifysimilarities and differences between the data sets and explain their implications. Use comparative language suchas "more than," "less than," "similar to," etc.5. Interpret the Data: Analyze the meaning behind the data presented in the chart. Discuss any significant trends, outliers, or patterns. Offer explanations for why certain trends may be occurring, drawing on your knowledge of the subject matter.6. Provide Examples: Support your analysis with examples or real-world scenarios that relate to the data in the chart. This helps to make your points more concrete and provides additional context for the reader.7. Use Linking Words: Use linking words and phrases to connect your ideas and make your essay flow smoothly. Examples include "however," "therefore," "in addition," "on the other hand," etc.8. Conclusion: End your essay with a conclusion that summarizes the key points you've made and reiterates the significance of the data presented in the chart. You may also offer suggestions for further analysis or implications for the future.9. Proofread: Finally, proofread your essay carefully to ensure clarity, coherence, and correctness of language. Check for grammar and spelling errors, and make any necessary revisions.By following these techniques, you can effectivelywrite an essay analyzing an English chart or graph. Remember to approach the task systematically, and take the time to understand and interpret the data before crafting your response.。

怎样写好英语图表分析作⽂怎样写好英语图表分析作⽂(上)3824陕西省洋县中学⾼晓锋⽩⽟龙纵观近⼏年⾼考,英语书⾯表达⼤致分为材料作⽂、图表作⽂和开放作⽂。
且材料作⽂逐渐被图表作⽂取代,图表分析作⽂就是将数据、图像所包含的信息,转化为表意的说明⽂字。
图表分析作⽂通常⽐较复杂,学⽣不仅要弄清提⽰,还要看懂所给的图表和数据。
由于这类试题提⽰内容少,信息点分散,审题时⼀定要领会作者的出题意图,弄清主题再动笔:1.单纯描述解释图表信息,按图表所⽰内容如实表达,不加评论。
2.通过叙述图表(或图画)中的内容和数字变化来分析原因,发表议论。
(⼀) 柱状图(BAR CHART)⼈们⽇常⽣活中事物的变化情况通常可以⽤宽度相等的柱状图形来表⽰,柱状图的⾼度差别⽤来说明事物的动态发展趋势,同时要注意图例说明和坐标刻度所提⽰的信息。
例:你们班会的讨论主题是“上⼤学是⾼中⽣唯⼀的出路吗?”请你根据下⾯图表及汉语提⽰,写⼀篇短⽂,并阐述你的个⼈观点。
提⽰:1.增长学识,提⾼素养,利于择业。
2.成功的路不只⼀条。
3.学费⾼,就业难。
要求:1.词数:100~120左右。
2.开头语已为你写好(不计⼊词数)。
3.参考词汇:tuition n.学费qualities n.素养【解题分析】柱状图是⾼中英语课本中常见的图形,要求学⽣通过柱状图图中数据和提⽰内容写⼀短⽂,属于⽐较、对照类。
也可根据提⽰写为议论⽂。
通常我们采取三段式写法:第⼀段:描述图表,得出结论。
第⼆段:紧扣主题,根据图表⽐较分析原因,论证结论。
第三段:发表议论,提出⾃⼰的看法。
【提炼要点】分析柱状图数据信息。
从图中可看出,⿊⾊代表想上⼤学,占⼤多数,约60%;浅⿊⾊代表⽆所谓,占约30%;⽩⾊代表不想上⼤学,占约10%。
One possible versionIs It The Only Way Out To Go To College?We had a discussion about whether it is the only way out for senior students to go to college.Views vary from person to person.The majority of us consider it very necessary to go to college.They think it can widen their knowledge and improve their qualities.Only in this way can they find better jobs after graduation.Very few students,that is about ten percent of the students,think it no use going university,because the tuition is too high for their family to afford.What's more,it's rather hard for college graduates to seek satisfactory jobs.Thirty percent of the students,however,believe “All roads lead to Rome.” Therefore it doesn't make any difference whether they go to college or not.In my opinion,we can receive a better education at college so that we can serve our motherland.【语⾔亮点】①词汇。

雅思英语图表作文范文第1篇A类雅思各类图表作文要点及范文一.曲线图解题关键1曲线图和柱状图都是动态图,解题的切入点在于描述趋势。
2在第二段的开头部分对整个曲线进行一个阶段式的总分类,使写作层次清晰,同时也方便考官阅卷。
接下来再分类描述每个阶段的specifictrend,同时导入数据作为分类的依据。
3趋势说明。
即,对曲线的连续变化进行说明,如上升、下降、波动、持平。
以时间为比较基础的应抓住“变化”:上升、下降、或是波动。
题中对两个或两个以上的变量进行描述时应在此基础上进行比较,如变量多于两个应进行分类或有侧重的比较。
4极点说明。
即对图表中最高的、最低的点单独进行说明。
不以时间为比较基础的应注意对极点的描述。
5交点说明。
即对图表当中多根曲线的交点进行对比说明。
6不要不做任何说明就机械地导入数据,这不符合雅思的考试目的。
曲线图常用词汇动词—九大运动趋势一:表示向上:increase,rise,improve,grow,ascend,mount,aggrandize,goup,climb, take off, jump,shoot up暴涨,soar,rocket, skyrocket雅思英语图表作文范文第2篇It is said that countries are becoming similar to each other because of the global spread of the same products, which are now available for purchase almost anywhere. I strongly believe that this modern development is largely detrimental to culture and traditions worldwide.A country’s history, language and ethos are all inextricably bound up in its manufactured artefacts. If the relentless advance of international brands into every corner of the world continues, these bland packages might one day completely oust the traditional objects of a nation, which would be a loss of richness and diversity in the world, as well as the sad disappearance of t he manifestations of a place’s character. What would a Japanese tea ceremony be without its specially crafted teapot, or a Fijian kava ritual without its bowl made from a certain type of tree bark?Let us not forget either that traditional products, whether these be medicines, cosmetics, toy, clothes, utensils or food, provide employment for local people. The spread of multinational products can often bring in its wake a loss of jobs, as people urn to buying the new brand,perhaps thinking it more glamorous than the one they are used to. This eventually puts old-school craftspeople out of work.Finally, tourism numbers may also be affected, as travelers become disillusioned with finding every place just the same as the one they visited previously. To see the same products in shops the world over is boring, and does not impel visitors to open their wallets in the same way that trinkets or souvenirs unique to the particular area too.Some may argue that all people are entitled to have access to the same products, but I say that local objects suit local conditions best, and that faceless uniformity worldwide is an unwelcome and dreary prospect.Heres my full answer:The line graphs show the average monthly amount that parents in Britain spent on their children’s s porting activities and the number of British children who took part in three different sports from 2008 to is clear that parents spent more money each year on their children’s participation in sports over the six-year period. In terms of the number of children taking part, football was significantly more popular than athletics and 2008, British parents spent an average of around £20 per month on their children’s sporting activities. Parents’ spending on children’s sports increased gradually over the followi ng six years, and by 2014 the average monthly amount had risen to just over £ at participation numbers, in 2008 approximately 8 million British children played football, while only 2 million children were enrolled in swimming clubs and less than 1 million practised athletics. The figures for football participation remained relatively stable over the following 6 years. By contrast, participation in swimming almost doubled, to nearly 4 million children, and there was a near fivefold increase in the number of children doing athletics.剑桥雅思6test1大作文范文,剑桥雅思6test1大作文task2高分范文+真题答案实感。

英语作文图表作文(五篇范文)第一篇:英语作文图表作文图表分析作文1As is clearly shown in the table/ figure/ graph / chart, 图表总体描述 between 年代 and 年代.Especially, 突出的数据变化.There are three reasons for 具体表示急剧上升、下降或特殊现象的词.To begin with, 原因一.In addition / Moreover, 原因二.For example, 具体例证.Last but no least, 原因三.In short,总结上文.As far as I am concerned, / For my part, / As for me,作者自己的观点.On the one hand, 理由一.On the other hand, 理由二.In brief,总结上文.图表分析作文2The table / figure / graph / chart shows that 图表总述from 年代to年代.It is self-evident that突出的数据变化.Three possible reasons contribute to 具体表示急剧上升、下降或特殊现象的词或代词代替上文内容.One reason is that原因一.Another reason is that 原因二.For instance,举例证.What’s more原因三.As a result, 重述上文之趋势.However, in my opinion 作者观点.For one thing,理由一.For another, 理由二.T o sum up,总结上文.图表分析作文3It can be seen from the table / figure / graph / chart that图表总述between年代and年代.Especially,突出的数据变化.Why are there such great changes during 图表涉及的年头数years? There are mainly two reasons explaining具体表示急剧上升、下降或特殊现象的词或代词代替上文内容.First,原因一.In the old days,比较法说明过去的情况.But now,说明现在的情况.Second,原因二.As a result,总结上文.In my viewpoint,作者自己的观点.On the one hand,论点一.On the other hand,论点二.图表分析作文4As the table / figure / graph / chart shows,图表总述in the past years年代.Obviously,突出的数据变化.Why are there suchsharp contrasts during 图表涉及的年头 years?Two main factors contribute to具体表示急剧上升、下降或特殊现象的词或代词代替上文内容.First of all,原因一.In the past,比较法说明过去的情况.But now 说明现在的情况.Moreover,原因二.Therefore,总结上文.As I see it,作者自己的观点.For one thing,论点一.For another,论点二.图表作文补充句型• As is shown in the graph…如图所示…•The graph shows that…图表显示…•As can be seen from the table,…从表格中可以看出…•From the chart, we know that…从这张表中,我们可知…• All these data clearly prove the fact that… 所有这些数据明显证明这一事实,即…• The increase of ….In the ci ty has reached to 20%.….在这个城市的增长已达到20%.• In 1985, the number remained the same.1985年,这个数字保持不变.• There was a gradual decline in 1989.1989年,出现了逐渐下降的情况.第二篇:英语图表作文图表描述专题训练(一)这类作文时,注意以下几点:第一,审题时,除了要把握好图表的表层信息外,还要分析图标的深层含义,如原因、根源、可能的发展趋势等。
英语图表类作文写作方法英文回答:When it comes to writing an essay on a chart or graph, there are several key points to consider. First and foremost, it is important to analyze the data presented in the chart and understand its main trends or patterns. This will help you form a clear and concise thesis statement for your essay.For example, if the chart shows the population growthin a certain country over the past decade, you can identify the main trends, such as a steady increase or a sudden decline. This will serve as the basis for your thesis statement, which can be something like "The population of XYZ country has experienced a significant growth over the past decade."Once you have established your thesis statement, it is important to provide supporting evidence for your argument.This can be done by referring to specific data points or trends shown in the chart. For instance, you can mentionthat the population increased by a certain percentage each year or that there was a spike in population growth duringa specific period.Furthermore, it is crucial to provide analysis and interpretation of the data. This can involve explaining the reasons behind the trends shown in the chart or making predictions about future developments. For instance, youcan discuss the factors that contributed to the population growth, such as improved healthcare or immigration, and speculate on whether this trend will continue in the future.In addition to analyzing the data, it is important to structure your essay in a logical and coherent manner. This can be achieved by organizing your ideas into paragraphsand using appropriate transition words and phrases. For example, you can start a new paragraph by saying "Another important aspect to consider is..." or "On the other hand,it is worth noting that..."Lastly, it is important to conclude your essay by summarizing your main points and restating your thesis statement. This will provide a sense of closure and ensure that your essay is well-rounded. For example, you can conclude by saying "In conclusion, the chart clearly illustrates the significant population growth in XYZ country over the past decade, and it is likely that this trend will continue in the future."中文回答:写一篇关于图表或图形的文章时,有几个关键点需要考虑。
图表分析作文模板英语Chart Analysis Essay Template。
Introduction。
In today's data-driven world, the ability to interpret and analyze visual representations of information has become increasingly crucial. This essay aims to delve into the intricacies of a given chart, exploring its key features, underlying trends, and potential implications. By doing so, we hope to gain a deeper understanding of the information presented and its significance in the broader context.Description of the Chart。
The chart under scrutiny is a [type of chart, e.g., bar graph, line graph, pie chart, etc.], depicting [brief description of the main content or data represented]. Thex-axis represents [variable or category on the x-axis],while the y-axis corresponds to [variable or measurement on the y-axis]. The chart is color-coded, with [specific colors] used to distinguish between different data pointsor categories.Analysis of Key Features。
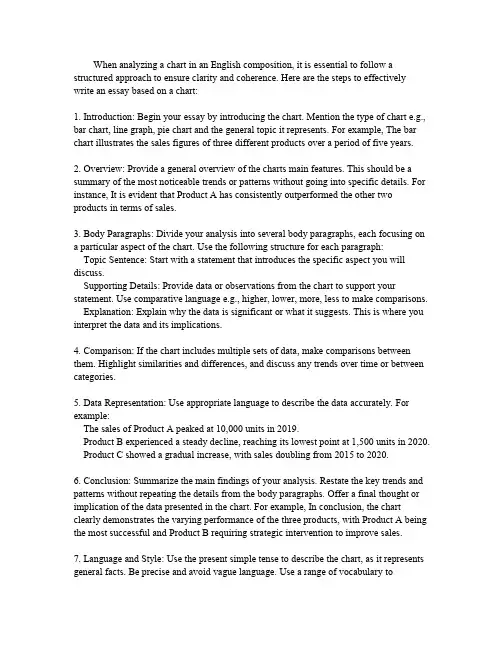
When analyzing a chart in an English composition,it is essential to follow a structured approach to ensure clarity and coherence.Here are the steps to effectively write an essay based on a chart:1.Introduction:Begin your essay by introducing the chart.Mention the type of chart e.g., bar chart,line graph,pie chart and the general topic it represents.For example,The bar chart illustrates the sales figures of three different products over a period of five years.2.Overview:Provide a general overview of the charts main features.This should be a summary of the most noticeable trends or patterns without going into specific details.For instance,It is evident that Product A has consistently outperformed the other two products in terms of sales.3.Body Paragraphs:Divide your analysis into several body paragraphs,each focusing ona particular aspect of the e the following structure for each paragraph:Topic Sentence:Start with a statement that introduces the specific aspect you will discuss.Supporting Details:Provide data or observations from the chart to support your e comparative language e.g.,higher,lower,more,less to make comparisons. Explanation:Explain why the data is significant or what it suggests.This is where you interpret the data and its implications.parison:If the chart includes multiple sets of data,make comparisons between them.Highlight similarities and differences,and discuss any trends over time or between categories.5.Data Representation:Use appropriate language to describe the data accurately.For example:The sales of Product A peaked at10,000units in2019.Product B experienced a steady decline,reaching its lowest point at1,500units in2020. Product C showed a gradual increase,with sales doubling from2015to2020.6.Conclusion:Summarize the main findings of your analysis.Restate the key trends and patterns without repeating the details from the body paragraphs.Offer a final thought or implication of the data presented in the chart.For example,In conclusion,the chart clearly demonstrates the varying performance of the three products,with Product A being the most successful and Product B requiring strategic intervention to improve sales.nguage and Style:Use the present simple tense to describe the chart,as it represents general facts.Be precise and avoid vague e a range of vocabulary todescribe changes e.g.,soared,plummeted,fluctuated and to compare data e.g.,exceeded, lagged behind,paralleled.8.Evidence and Citation:Ensure that all the data you mention is directly supported by the chart.Do not make assumptions or include information that is not evident from the chart.9.Review and Edit:After writing your essay,review it for clarity,coherence,and accuracy.Check for grammatical errors and ensure that your analysis is logical and wellstructured.By following these guidelines,you can write a comprehensive and analytical English composition based on a chart,effectively communicating the datas significance and implications.。
![图表分析型英语作文[1]](https://uimg.taocdn.com/8e9da73ccec789eb172ded630b1c59eef8c79ae2.webp)
图表分析型英语作文Sample 1 More Candidates for Civil Servants1.根据下图描述报考公务员人数变化的趋势2.分析导致这种趋势的原因3.你的建议As is shown in the bar chart, the number of applicants for civil servants has increased abruptly—by about 10 times, from 100,000 in 2003 to 1,000,000 in 2005.Several factors may contribute to the rush. First and foremost, working as civil servants in China is relatively stable, and Chinese people have a traditional preference for maintaining a life-long career. The rising interest could also be attributed to the unique social status. Comparatively speaking , civil servants are generally highly respected by common people in China. Last, we should not neglect the benefits such as the welfare in government departments.Compared with the striking number of applicants for becoming civil servants, the vacancies issued by the government are scarce.Thus, it is suggested that applicants should weigh their own advantages and disadvantages in case that they would blindlySample 2 College Students’ Booklist1.这是一所大学里学生所购书籍的变化2.你对于学生选择书记类别变化的评价3.哪类书籍你买得比较多?说明原因.198519952005 Philosophy & Society45%23%13%Novels33%17%5%Foreign Language11%31%39%Computer Science2%19%30%Others9%10%13% The table shows the changes of students’ choices of various kinds of books from1985 to 2005. Obviously enough, the number of novels and books of philosophy and society has declined gradually, with that of foreign languages books and computer science ones enjoying much more popularity.Though different readers have their own particular tastes, this phenomenon involves several complicated factors.Firstly, nowadays, most of the college students tend to buy more books concerning foreign languages learning and computer-science, mainly because there is a pressing need of foreign languages and computer skills for their future employment. Secondly, novels are still popular though the selling number decreased thanks to the availability of the Internet. Most of popular books could be read on line.I always buy books of computer science, firstly because it is my major. Secondly, it is well known that computer science often witnesses the fastest changes, thus in order to keep up with the pace, I have to constantly arm myself with new information.enjoy much more popularity. tend to do sth. 倾向于books concerning (有关于) foreign languages learning…thanks to the availability of the Internet. 多亏了网络的便利性on line 在线it is well known that computer science often witnesses (见证了) the fastest changeskeep up with the pace 跟上步伐I have to constantly arm myself with new information.Sample 3 Directions: For this part, you are allowed 30 minutes to write a composition on the topic How People Spend Their Holidays. You should write at least 120 words, and base your composition on the table and the outline given below:1、根据上表,简要描述1990年、1995年、2000年某城市人们度假方式的情况及其变化;2、请说明发生这些变化的原因;3、得出结论。
如何写英文图表作文全文共3篇示例,供读者参考篇1How to Write an Essay on English ChartsIntroductionWhen writing an essay on English charts, it is important to understand the purpose of the charts and how to effectively analyze and interpret the data presented in them. By following a few simple steps, you can create a well-organized and coherent essay that effectively communicates the information contained in the charts.Step 1: Understand the ChartsBefore you begin writing your essay, take some time to carefully study the charts you are working with. Pay attention to the data presented in the charts, as well as any labels or titles that may help explain the information.Step 2: Identify Key Trends and PatternsOnce you have a good understanding of the charts, look for any key trends or patterns in the data. This may includeidentifying changes over time, comparing different categories, or noting any outliers or unusual data points.Step 3: Choose a TopicBased on your analysis of the charts, choose a specific topic or question that you would like to explore in your essay. This could be related to a specific trend or pattern you identified, or a broader question about the data presented in the charts.Step 4: Develop a Thesis StatementOnce you have chosen a topic, develop a thesis statement that clearly states the main argument or point of your essay. This will help guide your writing and ensure that your essay remains focused and coherent.Step 5: Outline Your EssayBefore you begin writing, create an outline for your essay that includes an introduction, body paragraphs, and a conclusion. Use your thesis statement to guide the organization of your essay and make sure that each paragraph relates back to your main argument.Step 6: Provide Evidence and AnalysisIn the body of your essay, provide evidence from the charts to support your main argument. This may include specific data points, trends, or patterns that you identified in your analysis. Make sure to analyze and interpret the evidence you present, rather than just listing facts.Step 7: Draw ConclusionsIn the conclusion of your essay, summarize the main points you have made and draw conclusions based on the evidence you presented. Consider how the data in the charts supports your thesis statement and what implications it may have for the topic you are exploring.Step 8: Revise and EditAfter you have written your essay, take the time to revise and edit your work. Check for clarity, coherence, and organization, as well as any errors in grammar or spelling. Make sure that your essay effectively communicates your ideas and presents a compelling argument based on the data in the charts.ConclusionWriting an essay on English charts may seem daunting at first, but by following these steps, you can create awell-organized and coherent essay that effectivelycommunicates the information contained in the charts. By understanding the data, identifying key trends, and developing a clear argument, you can create a persuasive and informative essay that engages your reader and effectively conveys the information presented in the charts.篇2How to Write an English Chart EssayWriting an English chart essay can be a challenging task, but with the right approach and strategies, you can effectively convey information and insights about the data presented in the chart. In this guide, we will outline the steps and techniques to help you write a well-structured and informative English chart essay.Step 1: Understand the ChartBefore you start writing your essay, it is important to thoroughly understand the chart you are analyzing. Take your time to examine the data presented in the chart, the labels, axes, and any other relevant information. Make sure you fully grasp the key trends, patterns, and correlations in the data.Step 2: Identify the Main PointsOnce you have a good understanding of the chart, identify the main points or messages that the data is conveying. Think about the key insights and trends that are most significant and interesting. This will help you focus your essay and provide a clear direction for your analysis.Step 3: Structure Your EssayA well-structured essay is essential for effectively presenting your analysis of the chart. Here is a basic structure that you can follow:Introduction: Begin your essay with a brief description of the chart and its significance. Clearly state the main points that you will be discussing in your analysis.Body: Divide your analysis into separate paragraphs, each focusing on a specific aspect of the chart. Start by presenting the data and then provide your interpretation and analysis. Use specific examples and evidence to support your arguments.Conclusion: Summarize the key findings from your analysis and discuss the implications of the data presented in the chart. Make sure to restate your main points and provide a final thought or recommendation.Step 4: Use Clear and Concise LanguageWhen writing your essay, use clear and concise language to communicate your ideas effectively. Avoid using jargon or overly complex vocabulary that may confuse the reader. Be precise in your descriptions and explanations, and make sure to provide clear transitions between paragraphs.Step 5: Include Visual ReferencesIncorporating visual references in your essay can help illustrate key points and enhance the reader's understanding of the chart. You can include excerpts from the chart or create your own visual aids to support your analysis. Make sure to provide a clear caption or explanation for each visual reference.Step 6: Proofread and ReviseAfter you have completed your essay, take the time to proofread and revise your work. Check for spelling and grammar errors, as well as the overall coherence and clarity of your writing. Make any necessary revisions to improve the flow and organization of your essay.By following these steps and techniques, you can write a compelling and informative English chart essay that effectively conveys the insights and trends in the data presented. Remember to take your time to carefully analyze the chart,clearly structure your essay, use clear and concise language, and incorporate visual references to support your analysis. With practice and perseverance, you can enhance your skills in writing chart essays and effectively communicate complex data to your readers.篇3How to Write an English Essay on Charts and GraphsIn academic writing, charts and graphs are often used to illustrate data and make information more understandable for readers. Writing an essay based on charts and graphs requires careful analysis and interpretation of the data presented. When writing an English essay on charts and graphs, there are several key steps to follow to ensure that your essay is clear, coherent, and well-supported.1. Understand the data: Before you begin writing your essay, take the time to carefully study the charts and graphs you will be analyzing. Make sure you understand the data presented, including what the axes represent, the units of measurement, and any patterns or trends that are apparent in the data.2. Develop a thesis statement: Once you have a solid understanding of the data, you can start to develop a thesisstatement that summarizes the main point or argument you will be making in your essay. Your thesis statement should be specific and concise, and it should tie back to the data presented in the charts and graphs.3. Organize your essay: As with any essay, it is important to organize your thoughts and ideas in a clear and logical manner. Start with an introduction that provides background information on the topic and introduces the charts and graphs you will be analyzing. Then, move on to the body of your essay, where you will provide a detailed analysis of the data presented in the charts and graphs. Finally, conclude your essay with a summary of your findings and any recommendations or implications that arise from the data.4. Use evidence to support your analysis: In order to fully analyze the data presented in the charts and graphs, you will need to provide evidence to support your claims. This evidence can take the form of specific data points, trends, or patterns that you have identified in the data. Make sure to cite your sources accurately and provide sufficient evidence to back up your analysis.5. Consider alternative interpretations: When analyzing charts and graphs, it is important to consider alternativeinterpretations of the data. Think about how different factors or variables may affect the data and consider how these factors could change the conclusions you have drawn. By exploring different interpretations, you can strengthen your analysis and provide a more well-rounded view of the data.6. Proofread and revise: Finally, before submitting your essay, make sure to proofread and revise your work carefully. Check for spelling and grammar errors, ensure that your argument is clear and well-supported, and make any necessary revisions to improve the overall quality of your essay.Overall, writing an English essay on charts and graphs can be a challenging but rewarding task. By carefully analyzing the data, developing a strong thesis statement, organizing your essay effectively, using evidence to support your analysis, considering alternative interpretations, and proofreading and revising your work, you can create a well-written and persuasive essay that effectively communicates your findings to your readers.。
英语作文图表分析范文(汇总30篇)(经典版)编制人:__________________审核人:__________________审批人:__________________编制单位:__________________编制时间:____年____月____日序言下载提示:该文档是本店铺精心编制而成的,希望大家下载后,能够帮助大家解决实际问题。
文档下载后可定制修改,请根据实际需要进行调整和使用,谢谢!并且,本店铺为大家提供各种类型的经典范文,如工作总结、工作计划、合同协议、条据文书、策划方案、句子大全、作文大全、诗词歌赋、教案资料、其他范文等等,想了解不同范文格式和写法,敬请关注!Download tips: This document is carefully compiled by this editor. I hope that after you download it, it can help you solve practical problems. The document can be customized and modified after downloading, please adjust and use it according to actual needs, thank you!Moreover, our store provides various types of classic sample essays for everyone, such as work summaries, work plans, contract agreements, doctrinal documents, planning plans, complete sentences, complete compositions, poems, songs, teaching materials, and other sample essays. If you want to learn about different sample formats and writing methods, please stay tuned!英语作文图表分析范文(汇总30篇)英语作文图表分析范文第1篇图表类写作模版(1)模版1According to the chart / graph / diagram / table, we clearly learn that _________.As early as _________,___________.Then,_________.Last,__________.In contrast, by _________,__________.There are many reasons accounting for _________.Firstly, _________.Secondly,__________.Finally,_________.As a result,_________.As far as I am concerned,_________.For one thing,__________.For another,________.In brief, I hold that__________.(2)模版2What is shown in the chart / graph / diagram / table above indicates that in recent years, more and more people payattention to _________.The number of those who _________has increased ________,and furthermore,____________.There are two factors responsible for the changes.In the first place,_________.Moreover,__________.Yet, it is noticeable that __________.From the analysis, we can safely draw the conclusion that__________.It is possible that in the future,the tendency will__________.(3)模版3As is shown in the chart / graph / diagram / table above,__________has charged drastically in the past _________.While ___________,now the percentage of__________is __________.Meanwhile,the number of _________has soared up to ________.There are mainly two possible reasons contributing to the rapid changes.The first is that _________.Secondly,__________.In my point of view, the changes have a great influence on _________.At the same time,_______.To sum up ,_________.英语作文图表分析范文第2篇1、图形种类及概述法:泛指一份数据图表: a data graph/chart/diagram/illustration/table饼图:pie chart直方图或柱形图:bar chart / histogram趋势曲线图:line chart / curve diagram表格图:table流程图或过程图:flow chart / sequence diagram程序图:processing/procedures diagram2、常用的描述用法The table/chart diagram/graph shows (that)According to the table/chart diagram/graphAs (is)shown in the table/chart diagram/graphAs can be seen from the table/chart/diagram/graph/figures,figures/statistics shows (that)……It can be seen from the figures/statisticsWe can see from the figures/statisticsIt is clear from the figures/statisticsIt is apparent from the figures/statisticstable/chart/diagram/graph figures (that)……table/chart/diagram/graph shows/describes/illustrates how……3、图表中的数据(Data)具体表达法数据(Data)在某一个时间段固定不变:fiXed in time在一系列的时间段中转变:changes over time持续变化的data在不同情况下:增加:increase / raise / rise / go up ……减少:decrease / grow down / drop / fall ……波动:fluctuate / rebound / undulate / wave ……稳定:remain stable / stabilize / level off ……最常用的两种表达法:动词+副词形式(Verb+Adverb form)形容词+名词形式(Adjective+Noun form)英语作文图表分析范文第3篇雅思考试学术类图表作文分析考试学术类图表作文要求考生观察一幅图表并用自己的语言呈现出图表中的信息。
英文图表分析英语作文The bar chart shows the percentage of people in different age groups who use social media. It is clear that the younger age groups have a much higher percentage of social media users compared to the older age groups. 。
Looking at the data, we can see that 95% of people aged 18-29 use social media, while only 40% of those aged 65 and above use social media. This indicates a clear generational divide in social media usage.It is interesting to note that the percentage of social media users decreases steadily as age increases. For example, 80% of people aged 30-49 use social media, while only 65% of those aged 50-64 use social media.The data suggests that social media usage is most prevalent among younger people, and decreases as people get older. This could be due to a number of factors, such as younger people being more tech-savvy and comfortable withusing social media, while older people may be less interested or less familiar with it.In conclusion, the bar chart clearly illustrates the differences in social media usage across different age groups. It is evident that younger people are much more likely to use social media compared to older people.。
英文图表作文分析1.图表分析作文的种类图表就是数字、图像传达信息的一种形式,图表分析作文就是将这些数字、图像所包含的信息转换成传神表意的说明文字。
图表的种类很多,一般把各种数字资料,按照一定的顺序,通过表格形式表现出来的叫表(table),利用点、线、图等把信息资料通过图像表现出来的叫图(graph或chart),常用的图形有柱形图(bar graph),曲线图(line graph),圆形图(circular graph),图解图(diagram),饼形或百分比图(pie or percentage graph),象形图(pictorial graph),流程图(flow chart)等等。
2.图表分析作文的写作要领2.1. 读懂标题,然后根据主题进行分析。
虽然文章的中心思想和细节是通过图表来表示的,但同一张图表,如果命题不同,作者观察、分析问题的角度就有所不同,写出的短文也可能完全不同。
请看下面两个圆形图:上面两张图如果命题为“The Similarities and Differences of the Two Marketing Concepts”,本文可以首先对两张图分别进行说明,对两种观念的异同进行比较,然后得出结论;如果命题为“The Development of Marketing Concept”,本文的重点则偏重于市场营销观念的变化及其变化的原因。
写作时可首先指出两种观念的重点虽然明显不同,但后者显然脱胎于前者,然后再分析这种观念变化的原因。
请比较下面两篇文章:例文①:The Similarities and Differences of the Two Marketing ConceptsLet us take a look at the two circular graphs and compare the similarities and differences of the two marketing concepts.The concepts illustrated in Fig.1and Fig.2 are roughly the same in their main business mentality and tactics.Both are new and advanced concepts in business administration.Moreover,both lay stress on an orientation predominated by market demand.The latter,however,is also quite different from the former.First,the marketing focal point in Fig.1 is not the same as the in Fig.2.In the former,meeting consumers' needs and making a profit form the basis of business operations,while in the latter social long-term interests are also taken into account.Second,the former only considers two aspects of the problem in supplying products and services. But in contrast,the latter has to achieve a better balance between the three aspects—business profit,consumer demand and public social interests.Therefore,the latter is more advanced and more beneficial to social development.In addition,it has a more practical and revolutionary significance.例文②:The Developm ent of Marketing ConceptLet us take a look at the two circular graphs and analyze the causes for the development of marketing concepts.Fig.2 is quite different from Fig.1,but is obviously born out of Fig.1.The former refers to the concept predominated by market demand,whose stress is laid on the link between consumer demand and business profit,while the latter stands for the one led by society and market demand,which emphasizes the balance between social public interests,consumer demand and business profit.Some reasons may account for the development of marketing concept.First,consumer demand is not always in agreement with social long-term interests.For example,when household appliances with great power consumption do not accord with the demands of economy on electricity,companies should consider improving on the product from social long-term interests.Second,meeting consumer demand on short-term basis is no longer business standard of conduct.A company,which can meet bothconsumers current demands and social long-term interests is more welcomed.Finally,in commodity production,companies should pay attention to environmental protection and ecological balance,because they are closely related to consumers and society.It is just because of these that comes the development of marketing concept.2.2.仔细分析图表,尽可能正确理解图表的真正含义。
大学英语四六级图表类作文的写作方法大学英语四六级图表类作文的写作方法第一段:说明图表开篇句:As the bar chart shows, the number of people below the poverty line decreased dramatically during the years of 1978 to 1997.扩展句:1、As early as 1978, about 250 million people were under the poverty line.2、Then seven years later, the number became three fifths that of 1978.3、And arriving in the year 1997, the number was reduced to 50 millions.第二段:解释图表变化原因主题句:Several factors contribute to the sharp decrease of the below-poverty population.扩展句:1、 The reform and opening following 1978 enabled the peasants to become much better off.2、And with the development of Chinese economy, that policy also omproved city dwellers lives greatly.3、 Furthermore, the high-tech introduced made it possible for the countrys economy as a whole to take off.4、 All these result in the great fall of the Chinese population below the poverty line.第三段:提出解决办法结尾句:However, a further decrease in the number of poverty-stricken people is faced with some problems.扩展句:1、With quite few employees being laid off, the effect of which is not only discouraging, but also challenging.。
图表分析作文英文1. The chart shows the percentage of different age groups in a population. It is clear that the largest age group is the 25-34 age range, accounting for 30% of the population. This is followed by the 15-24 age group, which makes up 25% of the population. The smallest age group is the 65 and over category, comprising only 5% of the population.2. Moving on to the next chart, it illustrates the distribution of income levels among households. Interestingly, the majority of households fall into the middle-income bracket, with 40% of households earning between $30,000 and $60,000 per year. On the other hand, the lowest income bracket, with earnings below $20,000 per year, accounts for 20% of households, while the highest income bracket, with earnings above $100,000 per year, represents 15% of households.3. Now let's turn our attention to the bar graph, whichdisplays the consumption of different food groups. Unsurprisingly, grains and cereals are the most consumed food group, with 40% of the population regularly consuming them. Fruits and vegetables come in second place, with 30% of the population including them in their diet. Dairy products and meat are consumed by 20% and 15% of the population respectively, while sweets and snacks are the least consumed, with only 10% of the population indulging in them.4. The final chart provides information on the modes of transportation used by people for their daily commute. Itis evident that the majority of people prefer to useprivate cars, accounting for 50% of the population. Public transportation, including buses and trains, is the second most popular mode of transportation, used by 30% of the population. Walking and cycling are chosen by 10% of the population, while motorcycles and scooters are used by 5% of the population. Surprisingly, only a small percentage of the population, around 5%, use taxis or ride-sharing services.5. In conclusion, these charts provide valuableinsights into the demographics, income distribution,dietary habits, and transportation choices of a population. It is clear that there is a wide range of age groups, income levels, food preferences, and transportation preferences within the population. This diversityhighlights the different needs and lifestyles ofindividuals within the society.。
怎样写好英语图表分析作文(上)3824陕西省洋县中学高晓锋白玉龙纵观近几年高考,英语书面表达大致分为材料作文、图表作文和开放作文。
且材料作文逐渐被图表作文取代,图表分析作文就是将数据、图像所包含的信息,转化为表意的说明文字。
图表分析作文通常比较复杂,学生不仅要弄清提示,还要看懂所给的图表和数据。
由于这类试题提示内容少,信息点分散,审题时一定要领会作者的出题意图,弄清主题再动笔:1.单纯描述解释图表信息,按图表所示内容如实表达,不加评论。
2.通过叙述图表(或图画)中的内容和数字变化来分析原因,发表议论。
(一) 柱状图(BAR CHART)人们日常生活中事物的变化情况通常可以用宽度相等的柱状图形来表示,柱状图的高度差别用来说明事物的动态发展趋势,同时要注意图例说明和坐标刻度所提示的信息。
例:你们班会的讨论主题是“上大学是高中生唯一的出路吗?”请你根据下面图表及汉语提示,写一篇短文,并阐述你的个人观点。
提示:1.增长学识,提高素养,利于择业。
2.成功的路不只一条。
3.学费高,就业难。
要求:1.词数:100~120左右。
2.开头语已为你写好(不计入词数)。
3.参考词汇:tuition n.学费qualities n.素养【解题分析】柱状图是高中英语课本中常见的图形,要求学生通过柱状图图中数据和提示内容写一短文,属于比较、对照类。
也可根据提示写为议论文。
通常我们采取三段式写法:第一段:描述图表,得出结论。
第二段:紧扣主题,根据图表比较分析原因,论证结论。
第三段:发表议论,提出自己的看法。
【提炼要点】分析柱状图数据信息。
从图中可看出,黑色代表想上大学,占大多数,约60%;浅黑色代表无所谓,占约30%;白色代表不想上大学,占约10%。
One possible versionIs It The Only Way Out To Go To College?We had a discussion about whether it is the only way out for senior students to go to college.Views vary from person to person.The majority of us consider it very necessary to go to college.They think it can widen their knowledge and improve their qualities.Only in this way can they find better jobs after graduation.Very few students,that is about ten percent of the students,think it no use going university,because the tuition is too high for their family to afford.What's more,it's rather hard for college graduates to seek satisfactory jobs.Thirty percent of the students,however,believe “All roads lead to Rome.” Therefore it doesn't make any difference whether they go to college or not.In my opinion,we can receive a better education at college so that we can serve our motherland.【语言亮点】①词汇。
如:consider,widen,afford,seek,satisfactory。
②句式。
如:形式宾语:The majority of us consider it very necessary to go to college.倒装:Only in this way can they find better jobs after graduation.主语从句:it's rather hard for college graduates to seek satisfactory jobs.谚语:All roads lead to Rome.③过渡词。
如:that is about ten percent of the students,what's more,however,in my opinion。
【技巧点拨】1.读懂柱状图坐标刻线及图例说明与文字,比较柱状高低和颜色表示内容及数据。
2.学会看趋势、找规律,从整体看图表有何发展变化,找出特点、规律。
3.引用图表包含信息,使你的文章“由图而发”,言之有据。
【常用句式】1. As can be seen from the chart,...As is shown in the chart,...2. The chart shows that about 60 percent of students want to go to college...3. From the graph/data/results/information above,it can be seen/concluded/shown /estimated...4.The graph shows the changes in the number of...over the period from...to...pared with...,the number of the students of...实战演练观察下列图表,请以“Changes in the Ownership of House”为主题,为校报写一篇短文。
注意:短文应包括以下内容:1.根据图示描述该市住房产权的变化。
2.分析产生这些变化的原因。
3.说明这些变化对个人和社会产生的影响。
要求:1.首句已经为你写好。
2.词数100左右。
One possible versionOwnership of Houses in a Big City in ChinaAs can be seen from the chart,ownership of houses in a big city in China changed in the past ten years. In 1995,75 percent of the houses were stateowned. Five years later,the rate of stateowned houses to private ones was 3 to 2. But from then on,the ownership of houses changed rapidly and so far 80 percent of houses have been private.What caused the changes?There might have been two main reasons. First,from 1995 up to now,the people's living standards have been improving. Most of them can afford to buy the houses. Second,most people do not save a lot of money in the bank for their children as their parents did in the past. They want to have their own home and enjoy life.Such changes have had a great effect on the development of society. It does good to both the citizens and the government.真题体验(2006湖北)受某英文报的委托,你最近对高中生的英语阅读兴趣做了一次调查。
请根据以下信息,用英语为该报写一篇100词左右的短文。
短文的标题及首句已为你写好。
调查内容:在新闻、故事、科普、学习方法四种英文文章中,学生最喜欢哪一种调查范围:湖北省的10所中学调查对象:高中生调查人数:1,000调查方式:访谈调查结果:(见下图)One possible versionReading Interests of SeniorMiddle School StudentsRecently,a survey has been done to find out the reading interests of senior middle school students. In this survey,one thousand senior middle school students from ten schools in Hubei Province were interviewed. They were asked which they liked reading most among the four categories of English articles,news,stories,popular science articles and articles about learning methods.The survey shows that more than half of the students like to read news most. Twentysix percent of the students say that English stories are their favorite. Only seven percent of the students are most interested in reading articles about learning methods. However,the number of students who enjoy reading popular science articles doubles that of those who prefer reading articles about learning methods.(二) 曲线图(LINE GRAPH)曲线图常用来表示事物的变化趋势。