Moody's Seasoned Aaa Corporate Bond Yield
- 格式:xls
- 大小:42.00 KB
- 文档页数:21
Bond MarketIn finance, loan contract issued by local, state, and national governments and by private corporations, specifying an obligation to return borrowed funds. The issuer promises to pay interest on the debt when due (usually semiannually) at a stipulated percentage of the face value and to redeem the face value of the bond at maturity in legal tender. Bonds usually indicate a debt of substantial size and are issued in more formal fashion than promissory notes, ordinarily under seal. Government bonds may be backed by taxes, or they may be revenue bond s, backed only by revenue from the specific project (toll roads, airports, etc.) to which they are committed. Bonds are rated based on the issuer's creditworthiness. The ratings, assigned by independent rating agencies, generally run from AAA to D; bonds with ratings from AAA to BBB are regarded as suitable for investment.High-yield Bond:In finance, a high-yield bond(non-investment-grade bond, speculative-grade bond, or junk bond) is a bond that is rated below investment grade at the time of purchase. These bonds have a higher risk of default or other adverse credit events, but typically pay higher yields than better quality bonds in order to make them attractive to investors.Flows and levelsGlobal issue of high-yield bonds more than doubled in 2003 to nearly $146 billion in securities issued from less than $63 billion in 2002, although this is still less than the record of $150 billion in 1998. Issue is disproportionately centered in the United States, although issuers in Europe, Asia and South Africa have recently turned to high-yield debt in connection with refinancings and acquisitions. In 2006, European companies issued over €31 billion of high-yield bonds. 2010 is set to be a record year for European Junk Bond issuance, with as much as €50bn expected.RiskThe holder of any debt is subject to interest rate risk and credit risk, inflationary risk, currency risk, duration risk, convexity risk, repayment of principal risk, streaming income risk, liquidity risk, default risk, maturity risk, reinvestment risk, market risk, political risk, and taxation adjustment risk. Interest rate risk refers to the risk of the market value of a bond changing in value due to changes in the structure or level of interest rates or credit spreads or risk premiums. The credit risk of a high-yield bond refers to the probability and probable loss upon a credit event (i.e., the obligor defaults on scheduled payments or files for bankruptcy, or the bond is restructured), or a credit quality change is issued by a rating agency including Fitch, Moody's, or Standard & Poors.A credit rating agency attempts to describe the risk with a credit rating such as AAA. In North America, the five major agencies are Standard and Poor's, Moody's, Fitch Ratings, Dominion Bond Rating Service and A.M. Best. Bonds in other countries may be rated by US rating agencies or by local credit rating agencies. Rating scales vary; the most popular scale uses (in order of increasing risk) ratings of AAA, AA, A, BBB, BB, B, CCC, CC, C, with the additional rating D for debt already in arrears. Government bonds and bonds issued by government sponsored enterprises (GSE's) are often considered to be in a zero-risk category above AAA; and categories like AA and A may sometimes be split into finer subdivisions like "AA−" or "AA+".Bonds rated BBB− and higher are called investment grade bonds. Bonds rated lower than investment grade on their date of issue are called speculative grade bonds, derisively referred to as "junk" bonds.The lower-rated debt typically offers a higher yield, making speculative bonds attractive investment vehicles for certain types of financial portfolios and strategies. Many pension funds and other investors (banks, insurance companies), however, are prohibited in their by-laws from investing in bonds which have ratings below a particular level. As a result, the lower-rated securities have a different investor base than investment-grade bonds.The value of speculative bonds is affected to a higher degree than investment grade bonds by the possibility of default. For example, in a recession interest rates may drop, and the drop in interest rates tends to increase the value of investment grade bonds; however, a recession tends to increase the possibility of default in speculative-grade bonds.Usage: Corporate debtThe original speculative grade bonds were bonds that once had been investment grade at time of issue, but where the credit rating of the issuer had slipped and the possibility of default increased significantly. These bonds are called "fallen angels".The investment banker Michael Milken realized that fallen angels had regularly been valued less than what they were worth. His time with speculative grade bonds started with his investment in these. Only later did he and other investment bankers at Drexel Burnham Lambert, followed by those of competing firms, begin organizing the issue of bonds that were speculative grade from the start. Speculative grade bonds thus became ubiquitous in the 1980s as a financing mechanism in mergers and acquisitions. In a leveraged buyout(LBO) an acquirer would issue speculative grade bonds to help pay for an acquisition and then use the target's cash flow to help pay the debt over time.In 2005, over 80% of the principal amount of high-yield debt issued by U.S. companies went toward corporate purposes rather than acquisitions or buyouts.In emerging markets, such as China and Vietnam, bonds have become increasingly important as term financing options, since access to traditional bank credits has always been proved to be limited, especially if borrowers are non-state corporates. The corporate bond market has been developing in line with the general trend of capital market, and equity market in particular.Debt repackaging and subprime crisisHigh-yield bonds can also be repackaged into collateralized debt obligations (CDO), thereby raising the credit rating of the senior tranches above the rating of the original debt. The senior tranches of high-yield CDOs can thus meet the minimum credit rating requirements of pension funds and other institutional investors despite the significant risk in the original high-yield debt.When such CDOs are backed by assets of dubious value, such as subprime mortgage loans, and lose market liquidity, the bonds and their derivatives are also referred to as "toxic debt". Holding such "toxic" assets has led to the demise of several investment banks such as Lehman Brothers and other financial institutions during the subprime mortgage crisis of 2007-09 andled the US Treasury to seek congressional appropriations to buy those assets in September 2008 to prevent a systemic crisis of the banks.Such assets represent a serious problem for purchasers because of their complexity. Having been repackaged maybe several times, it is difficult and time-consuming for auditors and accountants to determine their true value. As the recession of 2008-9 bites, their value is decreasing further as more debtors default, so they represent a rapidly depreciating asset. Even those assets that might have gone up in value in the long-term are now depreciating rapidly, quickly becoming "toxic" for the banks that hold them. Toxic assets, by increasing the variance of banks' assets, can turn otherwise healthy institutions into zombies. Potentially insolvent banks have made too few good loans creating a debt overhang problem. Alternatively, potentially insolvent banks with toxic assets will seek out very risky speculative loans to shift risk onto their depositors and other creditors.On March 23, 2009, U.S. Treasury Secretary Timothy Geithner announced a Public-Private Investment Partnership(PPIP) to buy toxic assets from banks' balance sheets. The major stock market indexes in the United States rallied on the day of the announcement rising by over six percent with the shares of bank stocks leading the way. PPIP has two primary programs. The Legacy Loans Program will attempt to buy residential loans from banks' balance sheets. The Federal Deposit Insurance Corporation will provide non-recourse loan guarantees for up to 85 percent of the purchase price of legacy loans. Private sector asset managers and the U.S. Treasury will provide the remaining assets. The second program is called the legacy securities program which will buy mortgage backed securities (RMBS) that were originally rated AAA and commercial mortgage-backed securities (CMBS) and asset-backed securities (ABS) which are rated AAA. The funds will come in many instances in equal parts from the U.S. Treasury's Troubled Asset Relief Program monies, private investors, and from loans from the Federal Reserve's Term Asset Lending Facility (TALF). The initial size of the Public Private Investment Partnership is projected to be $500 billion. Economist and Nobel Prize winner Paul Krugman has been very critical of this program arguing the non-recourse loans lead to a hidden subsidy that will be split by asset managers, banks' shareholders and creditors. Banking analyst Meredith Whitney argues that banks will not sell bad assets at fair market values because they are reluctant to take asset write downs. Removing toxic assets would also reduce the volatility of banks' stock prices. Because stock is akin to a call option on a firm's assets, this lost volatility will hurt the stock price ofdistressed banks. Therefore, such banks will only sell toxic assets at above market prices.2010 European sovereign debt crisisOn 27 April 2010, the Greek debt rating was decreased to "junk" status by Standard & Poor's amidst fears of default by the Greek Government.They also cut Portugal's credit ratings by two notches to A, over concerns about Portugal's state debt and public finances on 28 April.Credit default swap (CDS)A credit default swap (CDS) is often referred to as a form of insurance that protects a lender if a borrower of capital defaults on a loan. When a lender purchases a CDS from an insurance company, the liability of the loan becomes a credit that may be swapped for cash upon the loan defaulting. The difference between a traditional insurance policy and a CDS is that anyone can purchase one, even those who have no direct interest in the loan being repaid. This type of investor is commonly referred to as a speculator. If the borrower defaults on the loan, not only does the lender receive payment by the insurance company, the speculator receives money as well. Although the lender can be protected by a CDS, it is always in the lender's best interest that the loan be repaid by the borrower. In contrast, the only way for a speculator to profit is if the borrower defaults. Only then will the speculator receive credit that, in turn, can be swapped for a cash payment from the insurance company. A CDS purchased by a speculator is often referred to as a "bet to fail" because of its dependence on a borrower to default on a loan.A more technical way of looking at it is that a credit default swap (CDS) is a swap contract and agreement in which the protection buyer of the CDS makes a series of payments (often referred to as the CDS "fee" or "spread") to the protection seller and, in exchange, receives a payoff if a credit instrument (typically a bond or loan) experiences a credit event. It is a form of reverse trading.A credit default swap is a bilateral contract between the buyer and seller of protection. The CDS will refer to a "reference entity" or "reference obligor", usually a corporation or government. The reference entity is not a party to the contract. The protection buyer makes quarterly premium payments—the "spread"—to the protection seller. If the reference entity defaults, the protection seller pays the buyer the par value of the bond inexchange for physical delivery of the bond, although settlement may also be by cash or auction. A default is referred to as a "credit event" and includes such events as failure to pay, restructuring and bankruptcy. Most CDSs are in the $10–$20 million range with maturities between one and 10 years.A holder of a bond may “buy protection” to hedge its risk of default. In this way, a CDS is similar to credit insurance, although CDS are not similar to or subject to regulations governing casualty or life insurance. Also, investors can buy and sell protection without owning any debt of the reference entity. These “naked credit default swaps” allow traders to speculate on debt issues and the creditworthiness of reference entities. Credit default swaps can be used to create synthetic long and short positions in the reference entity. Naked CDS constitute most of the market in CDS.In addition, credit default swaps can also be used in capital structure arbitrage.Credit default swaps have existed since the early 1990s, but the market increased tremendously starting in 2003. By the end of 2007, the outstanding amount was $62.2 trillion, falling to $38.6 trillion by the end of 2008.Most CDSs are documented using standard forms promulgated by the International Swaps and Derivatives Association (ISDA), although some are tailored to meet specific needs. Credit default swaps have many variations. In addition to the basic, single-name swaps, there are basket default swaps (BDS), index CDS, funded CDS (also called a credit linked notes), as well as loan only credit default swaps (LCDS). In addition to corporations or governments, the reference entity can include a special purpose vehicle issuing asset backed securities.Credit default swaps are not traded on an exchange and there is no required reporting of transactions to a government agency. During the 2007-2010 financial crisis the lack of transparency became a concern to regulators, as was the trillion dollar size of the market, which could pose a systemic risk to the economy. In March 2010, the Depository Trust & Clearing Corporation(DTCC) Trade Information Warehouse (see Sources of Market Data) announced it would voluntarily give regulators greater access to its credit default swaps database.Read more: /topic/credit-default-swap#ixzz1OU8aEsZQ。
金融英语单词1、Investment banking 投资银行2、Invest 投资3、Investor 投资者4、Speculate 投机5、Speculator 投机者6、Speculation 投机交易7、Surplus 盈余;顺差8、Budget surplus 预算盈余9、Trade surplus 贸易顺差10、Deficit 赤字;不足额11、Government deficit 政府赤字12、Trade deficit 贸易逆差13、Balance of payment 国际收支14、Strategy 战略;策略15、Strategic 战略上的,战略的16、Strategist 战略家,军事家17、Analyze vt.分析,研究18、Analysis n.分析19、Analyst 分析师20、Chief executive officer (CEO) 首席执行官;总裁21、Infrastructure 基础设施22、Standard of living 生活水平;生活标准23、Public transportation 公共交通;公共运输24、Mass transit 大众运输25、Incentive 动机;刺激;诱因26、Supply demand 供给需求27、Policyholder 投保人28、Rate of return 收益率29、Expected rate of return 预期收益率30、Interest 利息31、Interest rate 利率32、Dividend 股息,红利33、Profit 利润34、Loss 缺失35、Financial intermediary 金融中介机构36、Primary market 一级市场37、Secondary market 二级市场38、Financial instrument 金融工具39、Trust company 信托公司40、Credit union 信用合作社41、Mutual funds 共同基金42、Mortgage broker 贷款经纪人43、Pension fund 养老基金44、Insurance company 保险公司45、Venture capital Company 风险投资公司46、Joint venture 合资企业,联合经营47、Stock exchange 证券交易所48、Transaction 交易49、Listed company 上市公司50、Commodity 商品;期货51、Crude oil 原油52、Physical market 现货市场53、Intangible (notional) market 无形市场54、Nasdaq 纳斯达克55、Over the counter market OTC 场外交易场所56、Debt 债务;负债57、Equity 权益;股本58、Share 股份59、Stock 股票60、Common share 一般股61、Preferred share 优先股62、Money market 货币市场63、Capital market 资本市场64、Banker’s acceptance 银行承兑65、Commercial paper 商业票据66、Operating bank loan 营业贷款67、Marketability 适销性68、Liquidity 流淌性;变现能力69、Liquid 流淌70、Security 证券71、Broker 经纪人72、Brokerage 回扣;佣金73、Capital structure 资本结构74、Corporation 股份公司75、Default 违约76、Derivatives 金融衍生品77、Market maker 做市商78、Market risk 市场风险79、Offer (ask) 出售报价80、Bid 买入81、Portfolio 投资组合[pɔ:t'fəuljəu, ,pəut-]82、Price transparency 价格透亮度83、Private placement 私募配售84、Risk averse 规避风险85、Risk premium 风险溢价86、Risk profile 风险分析图87、Bankrupt 破产88、Bankruptcy 破产89、Asset 总资产90、Liability 责任;负债91、Face value, par 面值92、Principal 本金93、Maturity 到期94、Coupon rate 票面利率95、Discount 贴现96、Premium 溢价;盈利;升水['pri:miəm]97、Current yield 当期收益率98、Yield to maturity YTM 到期收益率99、Issuer 发行人;证券发行者100、Rating agency 评级公司101、Standard & Poor’s 标普102、Moody’s 穆迪103、Fitch 惠誉评级104、Bonds 债券105、Corporate bond 公司债券106、Municipal bond 市政债券;地点债券107、Convertible bond 可转债108、Zero coupon bonds 零息债券109、Junk bonds 垃圾债券110、Bull market 牛市111、Bear market 熊市112、Capital gain 资本利得113、Capital loss 资本缺失114、Credit risk 信用风险115、Fixed interest rate 固定利率116、Floating interest rate 浮动利率117、Foreign bonds 外国债券118、International bonds 国际债券119、Yield 收益(率)120、Yield curve 收益曲线121、Initial public offering IPO 首次公布发行122、American depositary shares ADS 美国存托股票123、American depositary receipt ADR 美国存托凭证124、Blue chip 蓝筹股125、Red chip 红筹股126、Growth stock 增长型股票127、Value stock 价值型股票128、Over valued 高估129、Under valued 低估130、Fundamental analysis 差不多分析131、Technical analysis 技术分析132、Business cycle 经济周期;商业周期133、Recovery 复苏时期134、Booming 繁荣时期135、Recession 衰退时期136、Depression 萧条时期137、The Great Depression 大萧条138、Financial statement (report) 财务报表139、Balance sheet 资产负债表140、Income statement 损益表141、Revenue 收入142、Outstanding 逾期未付143、Earnings per share EPS 每股收益144、Gross domestic product GDP 国内生产总值145、Gross national product GNP 国民生产总值146、Inflation rate 通胀率147、Merger and acquisition 并购148、Multinational Corporation 跨国公司149、Payout ratio 派息率150、Price earnings ratio P/E ratio 市盈率,本益比151、Private company 私人持股公司152、Public company 股票上市公司153、Stock symbols 证券交易代码154、Listing 挂牌;上市155、Delisting 退市156、Index 指数157、Indicator 指标158、Syndicate 银团159、Underwriting 承销160、Future 期货161、Option 期权162、Put option 看跌期权163、Call option 看涨期权164、Forward 远期165、Swap 互换;掉期166、Underlying commodity 基础商品167、Counterparty risk 交易对手违约风险168、Foreign exchange risk 外汇风险169、Sovereign risk 主权风险;政治风险170、Insurance 保险171、Life insurance 人身保险;人寿险172、Property insurance 财产保险173、Automobile insurance 汽车保险174、Money laundering 洗钱['lɔ:ndəriŋ, 'lɑ:n-]。
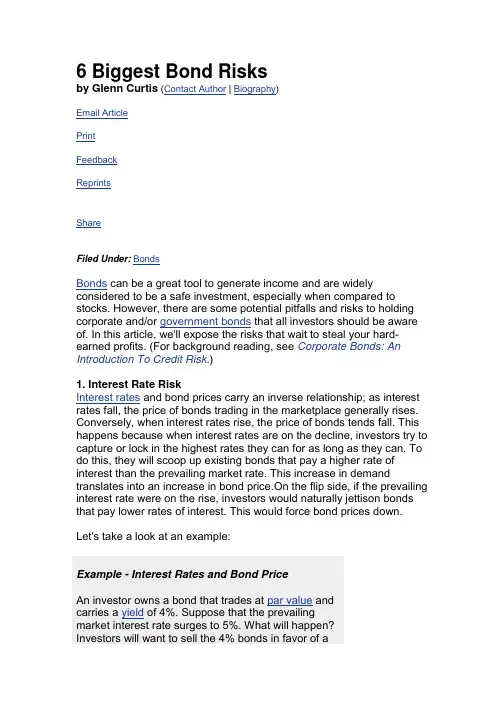
6 Biggest Bond Risksby Glenn Curtis (Contact Author | Biography)Email ArticlePrintFeedbackReprintsShareFiled Under:BondsBonds can be a great tool to generate income and are widely considered to be a safe investment, especially when compared to stocks. However, there are some potential pitfalls and risks to holding corporate and/or government bonds that all investors should be aware of. In this article, we'll expose the risks that wait to steal your hard-earned profits. (For background reading, see Corporate Bonds: An Introduction To Credit Risk.)1. Interest Rate RiskInterest rates and bond prices carry an inverse relationship; as interest rates fall, the price of bonds trading in the marketplace generally rises. Conversely, when interest rates rise, the price of bonds tends fall. This happens because when interest rates are on the decline, investors try to capture or lock in the highest rates they can for as long as they can. To do this, they will scoop up existing bonds that pay a higher rate of interest than the prevailing market rate. This increase in demand translates into an increase in bond price.On the flip side, if the prevailing interest rate were on the rise, investors would naturally jettison bonds that pay lower rates of interest. This would force bond prices down.Let's take a look at an example:Example - Interest Rates and Bond PriceAn investor owns a bond that trades at par value andcarries a yield of 4%. Suppose that the prevailingmarket interest rate surges to 5%. What will happen?Investors will want to sell the 4% bonds in favor of abond that returns 5%, which in turn forces the 4%bonds' price below par. (For more on the relationshipbetween interest rates and bond prices, see GetAcquainted With Bond Price/Yield Duo.)2. Reinvestment RiskAnother risk that bond investors face is reinvestment risk, which is the risk of having to reinvest proceeds at a lower rate than the rate the funds were previously earning. One of the main ways this risk presents itself is when interest rates fall over time and callable bonds are exercised by the issuers.The callable feature allows the issuer to redeem the bond prior to maturity. As a result, the bondholder receives the principal payment, which is often at a slight premium to the par value.However, the downside to a bond call is that the investor is then left with a pile of cash that he or she may not be able to reinvest at a comparable rate. This reinvestment risk can have a major adverse impact on an individual's investment returns over time.In order to compensate for this risk, investors receive a higher yield on the bond than they would on a similar bond that isn't callable. Active bond investors can attempt to mitigate reinvestment risk in their portfolios by staggering the potential call dates of their differing bonds. This limits the chance that many bonds will be called at once. (For more on callable bonds, read Callable Bonds: Leading A Double Life.)3. Inflation RiskWhen an investor buys a bond, he or she essentially commits to receiving a rate of return, either fixed or variable, for the duration of the bond or at least as long as it is held.But what happens if the cost of living and inflation increase dramatically, and at a faster rate than income investment? When that happens, investors will see their purchasing power erode and may actually achieve a negative rate of return (again factoring in inflation).Put another way, suppose that an investor earns a rate of return of 3% on a bond. If inflation grows to 4% after the purchase of the bond, the investor's true rate of return (because of the decrease in purchasing power) is -1%.4. Credit/Default RiskWhen an investor purchases a bond, he or she is actually purchasing acertificate of debt. Simply put, this is borrowed money that must be repaid by the company over time with interest. Many investors don't realize that corporate bonds aren't guaranteed by the full faith and credit of the U.S. government but are dependent on the corporation's ability to repay that debt.Investors must consider the possibility of default and factor this risk into their investment decision. As one means of analyzing the possibility of default, some analysts and investors will determine a company's coverage ratio before initiating an investment. They will analyze the corporation's income statement and cash flow statement, determine its operating income and cash flow, and then weigh that against its debt service expense. The theory is the greater the coverage (or operating income and cash flow) in proportion to the debt service expenses, the safer the investment.5. Rating DowngradesA company's ability to operate and repay its debt (and individual debt) issues is frequently evaluated by major ratings institutions such as Standard & Poor's or Moody's. Ratings range from 'AAA' for high credit quality investments to 'D' for bonds in default. The decisions made and judgments passed by these agencies carry a lot of weight with investors. (To learn more, read What Is A Corporate Credit Rating?)If a company's credit rating is low or its ability to operate and repay is questioned, banks and lending institutions will take notice and may charge the company a higher rate of interest for future loans. This can have an adverse impact on the company's ability to satisfy its debts with current bondholders and will hurt existing bondholders who might have been looking to unload their positions.6. Liquidity RiskWhile there is almost always a ready market for government bonds, corporate bonds are sometimes entirely different animals. There is arisk that an investor might not be able to sell his or her corporate bonds quickly due to a thin market with few buyers and sellers for the bond.Low interest in a particular bond issue can lead to substantial price volatility and possibly have an adverse impact on a bondholder's total return (upon sale). Much like stocks that trade in a thin market, you may be forced to take a much lower price than expected to sell your position in the bond.The Bottom LineBonds may generate an income stream for investors and, depending on the issue(s), they may also help mitigate overall portfolio risk. Keepthe six major risks of bond investing in mind before dabbling in these individual issues. (For everything you wanted to know about bonds and were afraid to ask, see our Bond Basics Tutorial.)by Glenn Curtis (Contact Author | Biography)Glenn Curtis started his career as an equity analyst at Cantone Research, a New Jersey-based regional brokerage firm. He has since worked as an equity analyst and a financial writer at a number of print/web publications and brokerage firms including Registered Representative Magazine, Advanced Trading Magazine, , , and Prudential Securities. Curtis has also held Series 6,7,24 and 63 securities licenses.Filed Under:Bonds。
Moody’s Analytics Professional Services巴塞尔新资本协议下的违约损失率模型开发与债项评级的解决方案2009年2月介绍大纲巴塞尔新资本协议:关于违约损失率的相关要求违约损失率的影响因素和模型违约损失率模型开发与债项评级的解决方案–中国的挑战–主要问题–解决方案的框架结构–业务流程改进解决方案–模型开发的初步工作:专家模型和模型因素的分析–问题的讨论2Moody’s Analytics Professional Services巴塞尔新资本协议:违约损失率的相关要求标准法和内部评级法:抵押品管理标准法和内评初级法规定有资格的抵押品应该具备以下特点:法律地位明确能够客观估值(可以采取盯市价格)良好的流动性价值波动性较低和交易对象的信用相关性较低有资格的抵押品种类:金融抵押品(标准法和内评初级法)应收账款(内评初级法)商用房地产/居住用房地产(内评初级法)其它抵押品(内评初级法)4标准法:认可抵押品类型标准法认可的抵押品:–现金类,包括存款证明或者银行发行的类似现金的工具。
–黄金–债券类,包括公认的外部信用评级机构评定的债券(国家公共部门发行BB-,其它机构BBB+以上)和未经外部信用评级机构的债券(银行发行、交易所交易、优先债务等)。
–股票类,包括纳入主要市场指数中的股票和可转换债券等。
–证券和基金类,包括集体投资可转让证券和共同基金。
标准法中综合法认可的抵押品(在简化法基础上):–不属于主要市场成份股,但在认可交易所交易的股份–集体投资可转让证券和共同基金(每日公开报价)–满足一定标准的银行发行的未经外部评级机构评估的债券5标准法:信用风险缓释的调整一、简化法(风险权重)根据替代原则将抵押或者担保部分与风险暴露部分分开计算权重。
二、综合法(风险暴露和风险权重)考虑抵押品无法按面值变现的风险和银行无法对抵押品行使物权的风险–未来贷款期限内抵押价值的波动性–抵押部分和风险暴露部分的价值变化–抵押品标价货币和贷款货币不一致产生的汇率风险风险缓释调整后风险暴露=Max {0, [E x (1 + H e) –C x (1 –H c–H fx)]}H e: 风险暴露本身价值波动的调整折扣H c: 抵押品价值波动的调整折扣H fx: 货币错配的调整折扣(1)标准监管折扣(2)银行自行估计的折扣67内部评级法初级法:违约损失率的标准内评初级法不直接调整风险权重,而是调整PD ,LGD ,和EAD 。

Fundamentals of Corporate Finance, 12e (Ross)Chapter 7 Interest Rates and Bond Valuation1) Allison just received the semiannual payment of $35 on a bond she owns. Which term refers to this payment?A) CouponB) Face valueC) DiscountD) Call premiumE) Yield2) Bert owns a bond that will pay him $45 each year in interest plus $1,000 as a principal payment at maturity. What is the $1,000 called?A) CouponB) Face valueC) DiscountD) YieldE) Dirty price3) A discount bond's coupon rate is equal to the annual interest divided by the:A) call price.B) current price.C) face value.D) clean price.E) dirty price.4) A bond's principal is repaid on the ________ date.A) couponB) yieldC) maturityD) dirtyE) clean5) The bond market requires a return of 9.8 percent on the 5-year bonds issued by JW Industries. The 9.8 percent is referred to as the:A) coupon rate.B) face rate.C) call rate.D) yield to maturity.E) current yield.6) The current yield is defined as the annual interest on a bond divided by the:A) coupon rate.B) face value.C) market price.D) call price.E) par value.7) A $1,000 par value corporate bond that pays $60 annually in interest was issued last year. Which one of these would apply to this bond today if the current price of the bond is $996.20?A) The bond is currently selling at a premium.B) The current yield exceeds the coupon rate.C) The bond is selling at par value.D) The current yield exceeds the yield to maturity.E) The coupon rate has increased to 7 percent.8) Which one of these equations applies to a bond that currently has a market price that exceeds par value?A) Market value < Face valueB) Yield to maturity = Current yieldC) Market value = Face valueD) Current yield > Coupon rateE) Yield to maturity < Coupon rate9) All else constant, a bond will sell at ________ when the coupon rate is ________ the yield to maturity.A) a premium; less thanB) a premium; equal toC) a discount; less thanD) a discount; higher thanE) par; less than10) DLQ Inc. bonds mature in 12 years and have a coupon rate of 6 percent. If the market rate of interest increases, then the:A) coupon rate will also increase.B) current yield will decrease.C) yield to maturity will be less than the coupon rate.D) market price of the bond will decrease.E) coupon payment will increase.11) Which one of the following applies to a premium bond?A) Yield to maturity > Current yield > Coupon rateB) Coupon rate = Current yield = Yield to maturityC) Coupon rate > Yield to maturity > Current yieldD) Coupon rate < Yield to maturity < Current yieldE) Coupon rate > Current yield > Yield to maturity12) Which one of the following relationships applies to a par value bond?A) Yield to maturity > Current yield > Coupon rateB) Coupon rate > Yield to maturity > Current yieldC) Coupon rate = Current yield = Yield to maturityD) Coupon rate < Yield to maturity < Current yieldE) Coupon rate > Current yield > Yield to maturity13) Which one of the following relationships is stated correctly?A) The coupon rate exceeds the current yield when a bond sells at a discount.B) The call price must equal the par value.C) An increase in market rates increases the market price of a bond.D) Decreasing the time to maturity increases the price of a discount bond, all else constant.E) Increasing the coupon rate decreases the current yield, all else constant.14) Round Dot Inns is preparing a bond offering with a coupon rate of 6 percent, paid semiannually, and a face value of $1,000. The bonds will mature in 10 years and will be sold at par. Given this, which one of the following statements is correct?A) The bonds will become discount bonds if the market rate of interest declines.B) The bonds will pay 10 interest payments of $60 each.C) The bonds will sell at a premium if the market rate is 5.5 percent.D) The bonds will initially sell for $1,030 each.E) The final payment will be in the amount of $1,060.15) A newly issued bond has a coupon rate of 7 percent and semiannual interest payments. The bonds are currently priced at par. The effective annual rate provided by these bonds must be:A) 3.5 percent.B) greater than 3.5 percent but less than 7 percent.C) 7 percent.D) greater than 7 percent.E) less than 3.5 percent.16) The price sensitivity of a bond increases in response to a change in the market rate of interest as the:A) coupon rate increases.B) time to maturity decreases.C) coupon rate decreases and the time to maturity increases.D) time to maturity and coupon rate both decrease.E) coupon rate and time to maturity both increase.17) Which one of the following bonds is the least sensitive to interest rate risk?A) 3-year; 4 percent couponB) 3-year; 6 percent couponC) 5-year; 6 percent couponD) 7-year; 6 percent couponE) 7-year; 4 percent coupon18) As a bond's time to maturity increases, the bond's sensitivity to interest rate risk:A) increases at an increasing rate.B) increases at a decreasing rate.C) increases at a constant rate.D) decreases at an increasing rate.E) decreases at a decreasing rate.19) You own a bond that pays an annual coupon of 6 percent that matures five years from now. You purchased this 10-year bond at par value when it was originally issued. Which one of the following statements applies to this bond if the relevant market interest rate is now 5.8 percent?A) The current yield to maturity is greater than 6 percent.B) The current yield is 6 percent.C) The next interest payment will be $30.D) The bond is currently valued at one-half of its issue price.E) You will realize a capital gain on the bond if you sell it today.20) You expect interest rates to decline in the near future even though the bond market is not indicating any sign of this change. Which one of the following bonds should you purchase now to maximize your gains if the rate decline does occur?A) Short-term; low couponB) Short-term; high couponC) Long-term; zero couponD) Long-term; low couponE) Long-term; high coupon21) A premium bond that pays $60 in interest annually matures in seven years. The bond was originally issued three years ago at par. Which one of the following statements is accurate in respect to this bond today?A) The face value of the bond today is greater than it was when the bond was issued.B) The bond is worth less today than when it was issued.C) The yield to maturity is less than the coupon rate.D) The coupon rate is less than the current yield.E) The yield to maturity equals the current yield.22) Which one of these statements is correct?A) Most long-term bond issues are referred to as unfunded debt.B) Bonds often provide tax benefits to issuers.C) The risk of a company financially failing decreases when the company issues bonds.D) All bonds are treated equally in a bankruptcy proceeding.E) A debenture is a senior secured debt.23) Hot Foods has an investment-grade bond issue outstanding that pays $30 semiannual interest payments. The bonds sell at par and are callable at a price equal to the present value of all future interest and principal payments discounted at a rate equal to the comparable Treasury rateplus .50 percent. Which one of the following correctly describes this bond?A) The bond rating is B.B) Market value is less than face value.C) The coupon rate is 3 percent.D) The bond has a "make whole" call price.E) The interest payments are variable.24) Last year, Lexington Homes issued $1 million in unsecured, noncallable debt. This debt pays an annual interest payment of $55 and matures six years from now. The face value is $1,000 and the market price is $1,020. Which one of these terms correctly describes a feature of this debt?A) Semiannual couponB) Discount bondC) NoteD) Trust deedE) Collateralized25) Callable bonds generally:A) grant the bondholder the option to call the bond any time after the deferment period.B) are callable at par as soon as the call-protection period ends.C) are called when market interest rates increase.D) are called within the first three years after issuance.E) have a sinking fund provision.26) An example of a negative covenant that might be found in a bond indenture is a statement that the company:A) shall maintain a current ratio of 1.1 or higher.B) cannot lease any major assets without bondholder approval.C) must maintain the loan collateral in good working order.D) shall provide audited financial statements in a timely manner.E) shall maintain a cash surplus of $100,000 at all times.27) Protective covenants:A) apply to short–term debt issues but not to long–term debt issues.B) only apply to privately issued bonds.C) are a feature found only in government–issued bond indentures.D) only apply to bonds that have a deferred call provision.E) are primarily designed to protect bondholders.28) Which one of these is most apt to be included in a bond's indenture one year after the bond has been issued?A) Current yieldB) Written record of all the current bond holdersC) List of collateral used as bond securityD) Current market priceE) Price at which a bondholder can resell a bond to another bondholder29) Road Hazards has 12-year bonds outstanding. The interest payments on these bonds are sent directly to each of the individual bondholders. These direct payments are a clear indication that the bonds can accurately be defined as being issued:A) at par.B) in registered form.C) in street form.D) as debentures.E) as callable bonds.30) A bond that is payable to whomever has physical possession of the bond is said to be in:A) new–issue condition.B) registered form.C) bearer form.D) debenture status.E) collateral status.31) Jason's Paints just issued 20-year, 7.25 percent, unsecured bonds at par. These bonds fit the definition of which one of the following terms?A) NoteB) DiscountedC) Zero–couponD) CallableE) Debenture32) A note is generally defined as:A) a secured bond with an initial maturity of 10 years or more.B) a secured bond that initially matures in less than 10 years.C) any bond secured by a blanket mortgage.D) an unsecured bond with an initial maturity of 10 years or less.E) any bond maturing in 10 years or more.33) A sinking fund is managed by a trustee for which one of the following purposes?A) Paying bond interest paymentsB) Early bond redemptionC) Converting bonds into equity securitiesD) Paying preferred dividendsE) Reducing bond coupon rates34) A bond that can be paid off early at the issuer's discretion is referred to as being which type of bond?A) Par valueB) CallableC) SeniorD) SubordinatedE) Unsecured35) A $1,000 face value bond can be redeemed early at the issuer's discretion for $1,030, plus any accrued interest. The additional $30 is called the:A) dirty price.B) redemption value.C) call premium.D) original–issue discount.E) redemption discount.36) A deferred call provision:A) requires the bond issuer to pay the current market price, minus any accrued interest, should the bond be called.B) allows the bond issuer to delay repaying a bond until after the maturity date should the issuer so opt.C) prohibits the issuer from ever redeeming bonds prior to maturity.D) prohibits the bond issuer from redeeming callable bonds prior to a specified date.E) requires the bond issuer pay a call premium that is equal to or greater than one year's coupon should the bond be called.37) A call–protected bond is a bond that:A) is guaranteed to be called.B) can never be called.C) is currently being called.D) is callable at any time.E) cannot be called at this point in time.38) The items included in an indenture that limit certain actions of the issuer in order to protect a bondholder's interests are referred to as the:A) trustee relationships.B) bylaws.C) legal bounds.D) trust deed.E) protective covenants.39) Which one of the following statements concerning bond ratings is correct?A) Investment grade bonds are rated BB or higher by Standard & Poor's.B) Bond ratings assess both interest rate risk and default risk.C) Split-rated bonds are called crossover bonds.D) The highest rating issued by Moody's is AAA.E) A "fallen angel" is a term applied to all "junk" bonds.40) A "fallen angel" is a bond that has moved from:A) being publicly traded to being privately traded.B) being a long-term obligation to being a short-term obligation.C) being a premium bond to being a discount bond.D) senior status to junior status for liquidation purposes.E) investment grade to speculative grade.41) Bonds issued by the U.S. government:A) are considered to be free of interest rate risk.B) generally have higher coupons than comparable bonds issued by a corporation.C) are considered to be free of default risk.D) pay interest that is exempt from federal income taxes.E) are called "munis."42) Treasury bonds are:A) issued by any governmental agency in the U.S.B) issued only on the first day of each fiscal year by the U.S. Department of Treasury.C) bonds that offer the best tax benefits of any bonds currently available.D) generally issued as semiannual coupon bonds.E) totally risk free.43) Municipal bonds:A) are totally risk free.B) generally have higher coupon rates than corporate bonds.C) pay interest that is federally tax free.D) are rarely callable.E) are free of default risk.44) The break-even tax rate between a taxable corporate bond yielding 7 percent and a comparable nontaxable municipal bond yielding 5 percent can be expressed as:A) .05/(1 − t*) = .07.B) .05 − (1 − t*) = .07.C) .07 + (1 − t*) = .05.D) .05 (1 − t*) = .07.E) .05 (1 + t*) = .07.45) A zero coupon bond:A) is sold at a large premium.B) pays interest that is tax deductible to the issuer at the time of payment.C) can only be issued by the U.S. Treasury.D) has more interest rate risk than a comparable coupon bond.E) provides no taxable income to the bondholder until the bond matures.46) Which one of the following risks would a floating-rate bond tend to have less of as compared to a fixed-rate coupon bond?A) Real rate riskB) Interest rate riskC) Default riskD) Liquidity riskE) Taxability risk47) The collar of a floating-rate bond refers to the minimum and maximum:A) call periods.B) maturity dates.C) market prices.D) coupon rates.E) yields to maturity.48) Last year, you purchased a TIPS at par. Since that time, both market interest rates and the inflation rate have increased by .25 percent. Your bond has most likely done which one of the following since last year?A) Decreased in value due to the change in inflation ratesB) Experienced an increase in its bond ratingC) Maintained a fixed real rate of returnD) Increased in value in response to the change in market ratesE) Increased in value due to a decrease in time to maturity49) Recently, you discovered a convertible, callable bond with a semiannual coupon of 5 percent. If you purchase this bond you will have the right to:A) force the issuer to repurchase the bond prior to maturity.B) convert the bond into equity shares.C) defer all taxable income until the bond matures.D) convert the bond into a perpetuity paying 5 percent.E) have the principal amount adjusted for inflation.50) Samantha owns a reverse convertible bond. At maturity, the principal amount will be repaid in:A) shares of stock.B) cash while the interest is paid in shares of stock.C) the form of a newly issued bond.D) either shares of stock or a newly issued bond.E) either cash or shares of stock.51) Nadine is a retired widow who is financially dependent upon the interest income produced by her bond portfolio. Which one of the following bonds is the least suitable for her to own?A) 6-year, high-coupon, put bondB) 5-year TIPSC) 10-year AAA coupon bondD) 5-year floating rate bondE) 7-year income bond52) Al is retired and his sole source of income is his bond portfolio. Although he has sufficient principal to live on, he only wants to spend the interest income and thus is concerned about the purchasing power of that income. Which one of the following bonds should best ease Al's concerns?A) 6-year coupon bondsB) 5-year TIPSC) 20-year coupon bondsD) 5-year municipal bondsE) 7-year income bonds53) Kurt has researched T-Tek and believes the firm is poised to vastly increase in value. He has decided to purchase T-Tek bonds as he needs a steady stream of income. However, he still wishes that he could share in the firm's success along with the shareholders. Which one of the following bond features will help him fulfill his wish?A) Put provisionB) Positive covenantC) WarrantD) Crossover ratingE) Call provision54) A bond that has only one payment, which occurs at maturity, defines which one of these types of bonds?A) DebentureB) CallableC) Floating-rateD) JunkE) Zero coupon55) A highly illiquid bond that pays no interest but might entitle its holder to rental income from an asset is most apt to be a:A) NoNo bond.B) put bond.C) contingent callable bond.D) structured note.E) sukuk.56) Which one of the following is the price at which a dealer will sell a bond?A) Call priceB) Asked priceC) Bid priceD) Bid–ask spreadE) Par value57) If you sell a bond with a coupon of 6 percent to a dealer when the market rate is 7 percent, which one of the following prices will you receive?A) Call priceB) Par valueC) Bid priceD) Asked priceE) Bid–ask spread58) The difference between the price that a dealer is willing to pay and the price at which he or she will sell is called the:A) equilibrium.B) premium.C) discount.D) call price.E) spread.59) A bond is quoted at a price of $1,011. This price is referred to as the:A) call price.B) face value.C) clean price.D) dirty price.E) maturity price.60) Rosita paid a total of $1,189, including accrued interest, to purchase a bond that has 7 of its initial 20 years left until maturity. This price is referred to as the:A) quoted price.B) spread price.C) clean price.D) dirty price.E) call price.61) U. S. Treasury bonds:A) are highly illiquid.B) are quoted as a percentage of par.C) are quoted at the dirty price.D) pay interest that is federally tax-exempt.E) must be held until maturity.62) A six-year, $1,000 face value bond issued by Taylor Tools pays interest semiannually on February 1 and August 1. Assume today is October 1. What will be the difference, if any, between this bond's clean and dirty prices today?A) No differenceB) One months' interestC) Two months' interestD) Four months' interestE) Five months' interest63) Today, June 15, you want to buy a bond with a quoted price of 98.64. The bond pays interest on January 1 and July 1. Which one of the following prices represents your total cost of purchasing this bond today?A) Clean priceB) Dirty priceC) Asked priceD) Quoted priceE) Bid price64) Which one of the following rates represents the change, if any, in your purchasing power as a result of owning a bond?A) Risk-free rateB) Realized rateC) Nominal rateD) Real rateE) Current rate65) Which one of the following statements is correct?A) The risk-free rate represents the change in purchasing power.B) Any return greater than the inflation rate represents the risk premium.C) Historical real rates of return must be positive.D) Nominal rates exceed real rates by the amount of the risk-free rate.E) The real rate must be less than the nominal rate given a positive rate of inflation.66) The Fisher effect primarily emphasizes the effects of ________ on an investor's rate of return.A) defaultB) market movementsC) interest rate changesD) inflationE) the time to maturity67) You are trying to compare the present values of two separate streams of cash flows that have equivalent risks. One stream is expressed in nominal values and the other stream is expressed in real values. You decide to discount the nominal cash flows using a nominal annual rate of 8 percent. What rate should you use to discount the real cash flows?A) 8 percentB) EAR of 8 percent compounded monthlyC) Comparable risk-free rateD) Comparable real rateE) Nominal rate minus the risk-free rate68) Real rates are defined as nominal rates that have been adjusted for which of the following?A) InflationB) Default riskC) Accrued interestD) Interest rate riskE) Both inflation and interest rate risk69) Interest rates that include an inflation premium are referred to as:A) annual percentage rates.B) stripped rates.C) effective annual rates.D) real rates.E) nominal rates.70) The Fisher effect is defined as the relationship between which of the following variables?A) Default risk premium, inflation risk premium, and real ratesB) Nominal rates, real rates, and interest rate risk premiumC) Interest rate risk premium, real rates, and default risk premiumD) Real rates, inflation rates, and nominal ratesE) Real rates, interest rate risk premium, and nominal rates71) The pure time value of money is known as the:A) liquidity effect.B) Fisher effect.C) term structure of interest rates.D) inflation factor.E) interest rate factor.72) Which one of the following premiums is compensation for the possibility that a bond issuer may not pay a bond's interest or principal payments as expected?A) Default riskB) TaxabilityC) LiquidityD) InflationE) Interest rate risk73) The interest rate risk premium is the:A) additional compensation paid to investors to offset rising prices.B) compensation investors demand for accepting interest rate risk.C) difference between the yield to maturity and the current yield.D) difference between the market interest rate and the coupon rate.E) difference between the coupon rate and the current yield.74) A Treasury yield curve plots Treasury interest rates relative to:A) market rates.B) comparable corporate bond rates.C) the risk-free rate.D) inflation rates.E) time to maturity.75) Which one of the following risk premiums compensates for the inability to easily resell a bond prior to maturity?A) Default riskB) TaxabilityC) LiquidityD) InflationE) Interest rate risk76) The taxability risk premium compensates bondholders for which one of the following?A) Yield decreases in response to market changesB) Lack of coupon paymentsC) Possibility of defaultD) A bond's unfavorable tax statusE) Decrease in a municipality's credit rating77) Which bond would you generally expect to have the highest yield?A) Risk-free Treasury bondB) Nontaxable, highly liquid bondC) Long-term, high-quality, tax-free bondD) Short-term, inflation-adjusted bondE) Long-term, taxable junk bond78) Which one of the following statements is false concerning the term structure of interest rates?A) Expectations of lower inflation rates in the future tend to lower the slope of the term structure of interest rates.B) The term structure of interest rates includes both an inflation premium and an interest rate risk premium.C) The term structure of interest rates and the time to maturity are always directly related.D) The real rate of return has minimal, if any, effect on the slope of the term structure of interest rates.E) The interest rate risk premium increases as the time to maturity increases.79) The yields on a corporate bond differ from those on a comparable Treasury security primarily because of:A) interest rate risk and taxes.B) taxes and default risk.C) default and interest rate risks.D) liquidity and inflation rate risks.E) default, inflation, and interest rate risks.80) The 7 percent bonds issued by Modern Kitchens pay interest semiannually, mature in eight years, and have a $1,000 face value. Currently, the bonds sell for $987. What is the yield to maturity?A) 6.97 percentB) 6.92 percentC) 6.88 percentD) 7.22 percentE) 7.43 percent81) You own a bond that pays $64 in interest annually. The face value is $1,000 and the current market price is $1,021.61. The bond matures in 11 years. What is the yield to maturity?A) 6.12 percentB) 6.22 percentC) 6.46 percentD) 6.71 percentE) 5.80 percent82) New Homes has a bond issue with a coupon rate of 5.5 percent that matures in 8.5 years. The bonds have a par value of $1,000 and a market price of $1,022. Interest is paid semiannually. What is the yield to maturity?A) 6.36 percentB) 6.42 percentC) 5.61 percentD) 5.74 percentE) 5.18 percent83) Oil Wells offers 5.65 percent coupon bonds with semiannual payments and a yield to maturity of 6.94 percent. The bonds mature in seven years. What is the market price per bond if the face value is $1,000?A) $949.70B) $929.42C) $936.48D) $902.60E) $913.4884) Roadside Markets has 8.45 percent coupon bonds outstanding that mature in 10.5 years. The bonds pay interest semiannually. What is the market price per bond if the face value is $1,000 and the yield to maturity is 7.2 percent?A) $1,199.80B) $999.85C) $903.42D) $1,091.00E) $1,007.5285) Luxury Properties offers bonds with a coupon rate of 8.8 percent paid semiannually. The yield to maturity is 11.2 percent and the maturity date is 11 years from today. What is the market price of this bond if the face value is $1,000?A) $850.34B) $896.67C) $841.20D) $846.18E) $863.3086) Redesigned Computers has 6.5 percent coupon bonds outstanding with a current market price of $548. The yield to maturity is 13.2 percent and the face value is $1,000. Interest is paid annually. How many years is it until these bonds mature?A) 17.84 yearsB) 14.19 yearsC) 17.41 yearsD) 16.16 yearsE) 18.32 years87) World Travel has 7 percent, semiannual, coupon bonds outstanding with a current market price of $1,023.46, a par value of $1,000, and a yield to maturity of 6.72 percent. How many years is it until these bonds mature?A) 12.26 yearsB) 12.53 yearsC) 18.49 yearsD) 24.37 yearsE) 25.05 years88) A 13-year, 6 percent coupon bond pays interest semiannually. The bond has a face value of $1,000. What is the percentage change in the price of this bond if the market yield to maturity rises to 5.7 percent from the current rate of 5.5 percent?A) −1.79 percentB) −1.38 percentC) −1.64 percentD) 1.79 percent。
This week, Moody's Investors Service lowered its credit rating for Japanese government debt. The credit rating agency downgraded Japan one step from Aa2 to Aa3.本周,穆迪投资者服务公司(Moody's Investors Service)将日本国债信用评级从Aa2下调一档至Aa3。
Finance Minster Yoshihiko Noda said trust in the economy "will not be shaken" by Wednesday's action.日本财务大臣野田佳彦(Yoshihiko Noda)表示,人们对日本经济的信任不会因为周三的下调而动摇。
Moody's said it acted because of Japan's large budget deficits and buildup in government debt since the two thousand nine global recession. Japan's public debt is twice the size of its economy. Japan has the world's third-largest economy.穆迪(Moody's)表示下调日本评级的原因是由于2009年全球经济衰退以来日本巨大的预算赤字和不断累计的政府债务。
日本公共债务是其经济规模的两倍。
日本是全球第三大经济体。
Moody's said another reason was Japan's political situation. Japan has had five prime ministers since two thousand six. The current prime minister, Naoto Kan, is expected to resign soon.穆迪表示另一个原因是由于日本的政治局势。

CREDIT POLICYMARCH 4, 2015Annual Default Study: Corporate Default andRecovery Rates, 1920-2014Summary Rating RationaleThis report comprises Moody's 28th annual default study in which we update statistics on thedefault, loss, and rating transition experience of corporate bond and loan issuers for 2014, as well as for the historical period since 1920. This study covers financial institutions, non-financial corporates, and utilities which have long-term debt ratings. Briefly, we find that:»Fifty-three Moody’s-rated corporate issuers defaulted in 2014, down from 69 in 2013. In contrast, default volume was up in 2014 consisting of $41.4 billion in bonds and $27.5 billion in loans. In comparison, there were $37.6 billion of bonds and $17.9 billion of loans which defaulted in 2013.»Defaults were recorded in a number of industries led by the Capital Industries, which registered 20 (or 38% of) defaults. Across regions, 31 of the defaulted issuers were from North America. The remaining defaults were from Europe, Latin America, Asia, and Africa. Measured by default volume, North America had the largest volume with $52.8 billion in defaulted bonds and loans.»Moody’s global speculative-grade default rate ended 2014 at 2.0%, down from 2013’s year-end level of 3.0% and corresponding closely to our year-ago forecast of 2.3%. The default rate for all Moody’s-rated corporate issuers closed at 1.0% at the end of 2014, also lower than the 1.4% level at year-end 2013, and again close to our year-ago forecast of 1.1%. » Measured on a dollar volume basis, Moody’s global speculative-grade bond default rate finished 2014 at 1.8%, up from 1.2% at the end of 2013. Among all Moody’s-rated issuers, the volume-weighted default rate edged up to 0.4% in 2014 from 0.3% in 2013. »Moody’s global speculative-grade default rate forecasting model now predicts that the speculative-grade default rate will rise in 2015 and finish the year at 2.7%. The forecast, if realized, will be higher than 2014’s closing level of 2.0% but well below the long-term average of 4.5% since 1983.THIS REPORT WAS REPUBLISHED ON 20 MARCH 2015 WITH MINOR CHANGES IN DEFAULT RATES FOR GOVERNMENT RELATED ISSUERS AND THOSE GROUPS WHICH INCLUDE SUCH ISSUERS.»Following the recovery of the US and European economy, credit quality improved in 2014 with the number of upgrades slightly outpacing downgrades for the first time since the global financial crisis. However, it should be noted that about one fifth of 2014’s upgrades were from the US utility sector driven by Moody’s updated view on the reliability and credit supportiveness of US utility regulations. Excluding those utility upgrades, downgrades would have again outpaced upgrades in 2014, but there were still more upgrades and fewer downgrades in 2014 than in 2013.»Measured by post-default trading prices, the average recovery rate for senior unsecured bonds was 43.3% in 2014, close to 2013’s 43.8%.IntroductionFor the fifth consecutive year, corporate credit conditions have been quite benign. Despite a weak global economic recovery and significant geopolitical risks, healthy corporate fundamentals and a fertile primary market have helped to maintain a low corporate default rate in 2014. Indeed, many lower rated issuers were able to access the debt market with issuer-friendly terms and refinance their debt with longer-term maturities. Issuance of leveraged loans and high yield bonds remained strong in 2014.Although defaults were relatively few last year, 2014 was not without issues. While high yield spreads steadily declined in the first six months, they trended higher in the second half, accompanied by increased volatility. Spreads widened for a number of reasons. First came the worry of Fed’s QE withdrawal in July. This was followed by geopolitical concerns stemming from the escalation of the Russia-Ukraine conflict and an ongoing slowdown in China’s economy, with particularly weak data last summer. Finally, the sharp decline in oil prices cooled down investor sentiment for risky assets.Another notable characteristic of 2014 was the divergence in economic growth across regions. On the positive side, the US economy continued to improve, albeit weakly, with its GDP increasing by 2.4% in 20141 and the unemployment rate declining from 6.8% to 5.6%.2 The economic recovery in Europe was at an even slower pace last year, dampened by country-specific structural challenges, ongoing muted global output and trade growth, and geopolitical tensions. More recently, the risk of a Greek exit from the euro has returned. Moreover, the impact of the unfolding deep recession in Russia on Europe is as yet uncertain. In Asia, China’s GDP growth slowed while Japan’s economy contracted in the second and third quarter. Though Japan’s growth was positive in the fourth quarter, markets remain concerned about the fragility of its recovery.Lackluster global growth has translated into expectations of further weakness in demand for oil in an already oversupplied market. Oil prices fell by nearly 50 percent in the second half of the year with West Texas Intermediate ending 2014 at a five-year low of $53 per barrel. Looking ahead, many investors wonder whether the slow economic growth and political volatility signal an end of the current benign credit cycle. With this question in mind, we’ve updated Moody’s 28th Annual Default Study by documenting the default and recovery experience of corporate debt issuers for 2014 as well as for the historical period since 1920.3 We also discuss Moody's default rate forecast for 2015 and review the performance of Moody's ratings.1See BEA's news release on Jan 30th 2015. 2Per United States Department of Labor.3The analysis of default and rating transitions in this report is limited to Moody’s-rated financial and non-financial corporate issuers, including utility companies. Consistent with prior year studies, this report’s default and transition rate statistics only cover issuers that have Moody’s-rated bonds and/or loans and default refers to debt default. Unless otherwise specified, ratings in this report are issuer level, senior unsecured equivalent ratings which are derived from Moody’s Senior Rating Algorithm .This publication does not announce a credit rating action. For any credit ratings referenced in this publication, please see the ratings tab on the issuer/entity page on for the most updated credit rating action information and rating history.Defaults remained benign in 2014Majority of defaults took place in Q2 and Q3A low interest rate environment and accommodative monetary policies continued to provide sufficientliquidity to the market, allowing high yield borrowers to access debt markets at favorable terms.Worldwide, only 53 Moody’s-rated corporate issuers defaulted in 2014, down from 69 in 2013 and slightlybelow our one-year ago forecast of 61 defaults. Most of the 2014 defaults were recorded in the second andthird quarters when 38 companies defaulted, accounting for 72% of defaults for the whole year. In 2014, atotal of $68.9 billion of debt went into default, which comprised $41.4 billion of bonds and $27.5 billion ofloans. In comparison, the default volume was lower at $55.5 billion in 2013, consisting of $37.6 billion ofbonds and $17.9 billion of loans. The largest default in 2014 was Energy Future Holdings Corp (EFH,formerly TXU) which filed for bankruptcy with several of its subsidiaries in April.4 With approximately $40billion of debt at default, EFH was the second largest defaulter in history among Moody’s-rated non-financial corporations.5From a geographic standpoint, 31 (or 58% of) defaulted issuers were from North America in 2014. Europeaccounted for another 11 defaults and the remainder came from Latin America (five), Asia Pacific (five), andAfrica (one). Compared to 2013, default counts decreased in North America , Europe and Latin America butincreased in Asia Pacific and Africa. The most notable change was in Europe, where defaults fell more than50% from 24 in 2013 to 11 in 2014. In terms of volume, defaulted debt totaled $68.9 billion in 2014, upfrom $55.5 billion a year prior. Of that, $52.8 billion was from North America, though as noted above $40billion is attributable to just one corporate family (EFH); default volume was $7.9 billion in Europe. Outsideof the corporate debt market (and hence outside the scope of this report), 2014 also recorded a sovereigndefault by the Argentine government as it failed to honor the coupon payments on Argentine foreignlegislation bonds which were restructured in 2005 and 2010.In terms of default types, last year’s defaults were generally evenly distributed among distressed exchanges(36%), bankruptcies (34%), and payment defaults (30%). Exhibit 1 presents the annual default counts anddefaulted debt volumes for the period 1970-2014.4Oncor Electric Delivery Company LLC, which is 80% owned by EFH, was not part of the filing.5The largest defaulter remains General Motors, which had roughly $50 billion of debt when it filed for bankruptcy in June 2009.Most defaults came from Capital industries but Energy is the biggest contributorby volumeOf the 53 defaults last year, 38% were by issuers in the Capital Industries sector.6 This was followed byissuers in the Technology sector, which contributed 17% of defaults in 2014. When measured by defaultvolume, however, the Energy & Environment sector topped the list by accounting for more than half of thetotal defaulted volume. The next highest share of default volume came from the Capital Industries sector,which contributed 20% of defaulted debt. Exhibit 2 shows the distribution of 2014 defaults by broadindustries.Although the Capital Industries sector accounted for 38% of defaults last year, it was not the sector withthe highest rate of default. That distinction belongs to the Technology industry, which had a 2.0% defaultrate in 2014 (see Exhibit 3).EXHIBIT 3Default rate highest in the Technology SectorBroad Industry Default Rates*Banking 0.8%Capital Industries 1.7%Consumer Industries 0.5%Energy & Environment 1.3%Non-Bank Finance 0.4%Media & Publishing 1.1%Retail & Distribution 1.8%Government Related Issuers 0.0%Technology 2.0%Transportation 0.7%Utilities 0.0%*Issuer-Weighted6The Capital Industries sector includes automotive, capital equipment, chemicals, plastics, & rubber, construction & building, containers, packaging, & glass, forest products & paper, metals & mining, and business service industries.Speculative-grade default rate declined to 2.0%As there were fewer defaults in 2014 than in 2013, the trailing twelve-month issuer-weighted default ratefor all Moody’s-rated issuers closed at 1.0% in 2014, down from 1.4% in 2013. Among speculative-gradeissuers, the default rate also fell to 2.0% from 3.0% (see Exhibit 4). The recent default rate has remainedlow relative to the historical average of 4.5% since 1983. Measured on a dollar volume basis, Moody’sspeculative-grade corporate bond default rate rose to 1.8% in 2014 from 1.2% in 2013. The increase in thedollar-weighted bond default rate mainly stemmed from a few sizable defaults including Energy Future andMomentive Performance Materials.7 For all of Moody’s-rated issuers, the volume-weighted default rateedged higher to 0.4% in 2014 from 0.3% in 2013.Rating drift trended up during Q1-Q3 before dipping in Q4Credit quality among Moody’s-rated issuers improved in 2014 with the number of rating upgrades slightlyoutpacing downgrades for the first time since the global financial crisis. However, it should be noted thatapproximately one fifth of 2014’s rating upgrades were from the US Utility sector in January, which resultedfrom Moody’s updating its view on the reliability and credit supportiveness of US utility regulations.8Excluding those utility upgrades, rating downgrades would have again outpaced upgrades in 2014, but itwould still be true that there were more upgrades and fewer downgrades in 2014 than in 2013.Among the four quarters in 2014, credit quality, as measured by rating changes, showed an upward trend inthe first three quarters9 as indicated by the issuer-weighted quarterly rating drift (the percentage ofupgrades minus that of downgrades).10 In the fourth quarter however, rating drift turned negative reflectinggeopolitical and economic concerns (see Exhibit 5).7Momentive Performance Materials had over $3 billion of debt when it filed for bankruptcy in April.8See Moody’s Special Comment US utility sector upgrades driven by stable and transparent regulatory frameworks, Feb 2014.9Not counting those US Utility upgrades in January. First quarter’s rating drift was 1.6% if we include those Utility upgrades.10Issuer-weighted measures which reflect the direction rather than magnitude of rating changes.Across regions and sectors, we find that the credit quality of European financial institutions began to deteriorate in the second half of 2014 after some stabilization in the first half. Nevertheless, the rating drift in the European financial sector in 2014, though still negative, was much improved over the double dips in 2011 and 2012. This can be seen in Exhibit 6, which shows the recent quarterly rating drifts by region and sector. Banks contributed the large majority of the downgrades among European financial institutions in 2014. In addition to deteriorated credit profiles, some of the European bank ratings were lowered following the downgrades of their corresponding sovereign ratings or Moody’s reassessment of the likelihood of systemic support.2014’s recovery rates broadly higher than their historical averagesIn Exhibit 7, we present the average recovery rates for debt defaulted in the past two years and put them in context with the historical averages. Last year’s recovery rates were for the most part correlated with the priority of claim in the capital structure, with a higher priority of claim enjoying a higher average rate of recovery. The only exception was that senior subordinated bonds recovered at a slightly higher rate of 46.9% relative to the senior unsecured bonds’ 43.3%, though that senior subordinated average is based ononly four defaults (see Exhibit 19 for more details).11 Exhibit 7 further shows that 2014’s recoveries weremostly in line with their 2013 levels and higher compared to their long-term averages. For example, theaverage recovery rate for first lien loans was 78.4% in 2014 versus 66.6% for the period of 1982-2014, whilethe senior unsecured bond recovery rates averaged 43.3% last year, compared to the historical average of37.4%.EXHIBIT 7Average corporate debt recovery rates measured by post-default trading pricesIssuer-weighted Volume-weightedLien Position 2014 2013 1982-2014 2014 2013 1982-20141st Lien Bank Loan 78.4% 75.1% 66.6% 80.6% 67.7% 62.5%2nd Lien Bank Loan* 10.5% 78.7% 31.8% 10.5% 69.2% 28.5%Sr. Unsecured Bank Loan n.a. n.a. 47.1% n.a. n.a. 40.2%Sr. Secured Bond 59.5% 59.8% 52.8% 76.5% 59.5% 52.4%Sr. Unsecured Bond 43.3% 43.8% 37.4% 34.3% 29.2% 33.6%Sr. Subordinated Bond* 46.9% 20.7% 31.1% 28.3% 26.6% 26.0%Subordinated Bond** 38.8% 26.4% 31.4% 38.0% 33.7% 26.3%Jr. Subordinated Bond n.a. n.a. 24.7% n.a. n.a. 17.1%* The average recovery rates for 2014's and 2013's second lien bank loans and senior subordinated bonds were each based on fewer than five defaults.** The average recovery rates for 2014's subordinated bonds were based on fewer than five defaults.The above recovery data are based on trading prices at or post default.12 An alternative recovery measure isbased on ultimate recoveries, or the value creditors realize at the resolution of a default event. For example,for issuers filing for bankruptcy, the ultimate recovery is the present value of the cash and/or securities thatthe creditors actually receive when the issuer exits bankruptcy, typically 1-2 years following the initialdefault date.13In Exhibit 8, we present data on ultimate recovery rates for North American non-financial companiesincluded in Moody’s Ultimate Recovery Database (“URD”).14 The average “firm-wide” recovery rate15 for thefive default resolutions was 65.4% in 2014 compared to 66.2% for the 20 companies which emerged fromdefault in 2013. During both 2014 and 2013, the family recovery rate exceeded the historical average rateof 54.9%. The higher family recovery can be mostly attributed to the fact that out of the five defaultresolutions, four were pre-arranged bankruptcies, which have historically been characterized by higherfamily recovery rates than regular bankruptcies. In 2013, we observed a similar pattern, which featured 55%(or eleven) pre-packs of the entire sample of companies that emerged in that year. However, consideringthe small sample size of default resolutions in 2014, we cannot draw any statistical conclusions about anunusual nature of family recovery rates during this period.11 Average recovery rates of senior unsecured bonds and other debts can be based on different defaulters because some defaulters may have senior unsecured bonds and no other debts.Among those 2014 defaulters which have recovery estimates on both senior unsecured and senior subordinated bonds, the recovery estimates for the senior unsecured bonds are consistently higher than the senior subordinated bonds of the same issuers. Please see Exhibit 19 for more details.12For distressed exchanges, we take trading prices at default. For other types of defaults, we take trading prices approximately one month after default.13For details, see Moody’s Specia l Comment Moody’s Ultimate Recovery Database, April 2007.14The analysis on ultimate recovery is provided by David Keisman and Julia Chursin. The data are from Moody’s Ultimate Recovery Database which includes robust detailed recovery information for over 5,100 loans and bonds from more than 1,000 North American corporate defaulters since 1987.15For a given issuer, the firm-wide recovery rate is the weighted-average recovery rate across all of the issuer’s debts where the weights are the size of the debts.EXHIBIT 8Average corporate debt recovery rates measured by ultimate recoveries, 1987-2014Emergence Year Default YearLien Position 2014 2013 1987-2014 2014 2013 1987-2014Loans* 81.0% 76.7% 80.2% 68.4% 76.6% 80.2%Senior Secured Bonds** 57.1% 84.2% 63.0% 59.4% 56.9% 63.0%Senior Unsecured Bonds*** 44.6% 61.3% 48.8% 0.0% 34.4% 48.8%Subordinated Bonds 0.0% 21.0% 28.2% 0.0% 21.0% 28.2%* 2014 Loans' recovery rate is based on seven observations (by year of default) and 14 observations (by year of emergence).** Unusually high recoveries of 2013’s Sr. Secured Bonds stem from a small sample of 17 observations, which were a part of only seven defaults (byyear of emergence), with debt instruments from the American Airlines bankruptcy skewing the average recovery rate toward the higher side.*** Average recovery rate of Sr. Unsecured Bonds which emerged in 2013 is impacted by a high proportion of American Airlines Sr. Unsecured Bonds (53% of the entire sample) , that recovered fully upon emergence from bankruptcy.Moody’s credit ratings are opinions of relative expected credit losses, which are a function of both theprobability of default and severity of default (“LGD”). Exhibit 9 shows annual average credit loss rates from1982 through 2014 for Moody’s-rated corporate issuers. The chart indicates that the average credit lossrate among all Moody’s-rated issuers declined to 0.6% in 2014 from 0.8% in 2013. To put this in historicalperspective, the average annual credit loss rate for Moody’s-rated issuers since 1982 is 1.0%.Default rate expected to rise modestly in 2015At the beginning of 2014 Moody’s default rate forecasting model (“Credit Transition Model” or “CTM”)predicted that the global speculative-grade default rate would finish at 2.3% by the end of the year. Themodel’s prediction turned out to be fairly close to the realized rate of 2.0%.16Looking forward, CTM forecasts that the global speculative-grade default rate will rise modestly in 2015,ranging from 2.0% - 2.7% over the next 11 months (see the light blue line in Exhibit 10). The global rate isexpected to finish 2015 at 2.7%, which if realized, will be higher than 2014’s closing level of 2.0% but wellbelow the 4.5% historical average. The upward pressure primarily stems from widening spreads,16See Moody’s December Default Report, Jan 2014.geopolitical concerns, lackluster economic growth outside of the US, and potential interest rate actions bythe Fed. On the other hand, an improving US economy, together with healthy corporate earnings andmanageable maturity profiles, should keep the default rate low by historical standards. In addition,monetary policy continues to be accommodative globally and market access for speculative-gradecompanies is expected to remain in place as investors continue to search for yield.The above-mentioned 2.7% default rate projection, which implies approximately 76 defaults globally, ismade under our baseline scenario. It assumes that the US unemployment rate will ease slightly from itscurrent level of 5.6% to 5.2% by the fourth quarter of 2015 while the high yield spread will widen to 575bps from 460 bps.17While the recent drop in energy prices has raised concerns of rising default risk in the overall high yieldmarket, we believe this should not lead to a spike in the near term default risk for Moody’s speculative-grade universe.18 Whereas Moody’s Liquidity Stress Index indicates a sharp rise in the Energy sector to 9.6%as of mid-February from 4.5% in December, the non-energy LSI remained unchanged at 2.9% from January,which was a 19-month low.19 Similarly, recent rating distribution and watchlist/outlook assignments showsome heat among Oil & Gas companies, but there are no particular warning signs pointing to increasedstress in the overall high yield market (see Exhibit 11). Although declining oil prices are deleterious for E&Pand related companies, they represent a positive for consumer, transportation and a few materials-relatedindustries. Overall, we believe lower oil prices will give the US and Indian economies a boost in the nexttwo years, though they are unlikely to lift global growth significantly as headwinds from the euro area,China, Brazil, and Japan hold back economic activity.2017 These a re option-adjusted, three-month moving averages.18More discussion on the credit impact of lower oil prices on the energy and other sectors can be found at https:///Pages/Credit-Impact-of-Lower-Oil-Prices.aspx19See Moody’s SGL Monitor - Liquidity Pressure Confined to Energy, February 2015.20See Moody’s Global Macro Outlook 2015-16 - Lower oil price fails to spur global growth, February 2015.EXHIBIT 11Recent rating distribution and watchlist/outlook assignments in the speculative-grade universeSectorAs ofShare of Caa-C isusers within theSG universeShare of Caa-C issuers on watch for downgrade or with negativeoutlookBeginning of 2014 24.7% 17.0% Oil & Gas Beginning of 2015 27.3% 18.5% Mid-Feb 2015 29.4% 28.6%Beginning of 2014 27.1% 24.9% All Sectors Beginning of 2015 29.3% 24.3%Mid-Feb 201529.6%25.4%Although our baseline scenario remains relatively benign, we acknowledge that there is risk associated with the economic conditions, in particular outside of the US. In Europe, for example, downside risks include policy uncertainty and reform fatigue which could lead investors to reassess the degree of risk in the region and result in a tightening in financing conditions; uncertainties from geopolitical developments in Ukraine, Russia, and the Middle East; negative effects on the Russian economy from declining oil prices; and aslowdown in the Chinese economy that would result in weaker demand for European exports. We cannot rule out the risk that the region falls back into recession. In our pessimistic scenario, the global economy will contract with the unemployment rate climbing to 9.7% and the high yield bond spread widening to 940 bps. In that case, the global high yield default rate is expected to rise to 9.9%, which will more than double the long-term average of 4.5% but still be well below the 2008-2009 peak of 13.9% (see the dark blue line in Exhibit 11).Across industries, default rates for all of Moody’s-rated issuers are expected to be highest in theEnvironmental sector in the US and in the Aerospace & Defense sector in Europe by the end of this year. Exhibit 12 shows the baseline one-year default rate forecasts across industries in both the US and Europe, sorted by the US rates in descending order.21 In each region, the same economic assumptions are applied to all industries, so the only factors driving the different forecasted default rates are the underlying rating histories and current ratings of the issuers in those industries.EXHIBIT 12One-year corporate default rate forecasts by industryIndustryUSEuropeIndustryUSEuropeEnvironmental Industries* 5.9% Transportation: Cargo 1.3% 0.8% Services: Consumer 4.3% 1.8% Capital Equipment1.2% 0.8% Hotel, Gaming, & Leisure 3.8%2.0% Healthcare & Pharmaceuticals 1.2% 1.2% Metals & Mining3.6% 1.5% High Tech Industries 1.2% 0.7% Services: Business 3.0% 1.6%Utilities: Oil & Gas 1.0% 0.5% Consumer goods: Durable* 2.8% Construction & Building 1.0% 1.2% Retail 2.8% 2.0%Chemicals, Plastics, & Rubber 0.9% 0.7%Wholesale* 2.8% Energy: Electricity* 0.8% Aerospace & Defense 2.7% 3.8% Transportation: Consumer 0.6% 0.9%Containers, Packaging, & Glass 2.5% 2.2% Media: Diversified & Production* 0.5% Media: Advertising, Printing & Publishing2.4%1.2%FIRE: Insurance0.5%2.1%21The industry default rate forecasts include both investment-grade and speculative-grade issuers.EXHIBIT 12One-year corporate default rate forecasts by industryIndustryUSEuropeIndustryUSEuropeConsumer goods: Non-durable* 2.4% Forest Products & Paper* 0.4% Energy: Oil & Gas 2.0% 0.8% FIRE: Real Estate 0.4% 1.2% Beverage, Food, & Tobacco 1.7% 1.4% Banking0.4% 0.9% FIRE: Finance1.5%0.6% Sovereign & Public Finance 0.1% 0.1% Media: Broadcasting & Subscription 1.4% 0.8% Utilities: Electric 0.0%0.2% Telecommunications 1.3% 1.0% Utilities: Water* 0.2%Automotive1.3%0.6%* Default rate forecasts are not reported in these sectors in either Europe or the US due to small sample size (fewer than ten issuers).Rating accuracy metricsMoody’s ratings have historically proven to be effective predictors of default. This can be seen in Exhibit 13, which plots the median ratings of over 1,900 corporate issuers which defaulted from 1983 to 2014. The chart demonstrates that, historically, Moody’s-rated issuers have been downgraded to the B1 level as early as five years prior to default. The comparable rating was lower at B3 among issuers which defaulted in 2014. The median rating one year prior to default for all defaulters in 2014 was Caa2, two notches lower than that rating measured over the entire period 1983-2014.The data in Exhibit 13 above demonstrate that Moody’s corporate ratings are correlated with subsequent default experience. To further demonstrate the ability of ratings to separate issuers with low credit risk from those with high credit risk, we use the Average Position of defaults (“AP”) to evaluate the accuracy of Moody’s ordinal rating systems (see Exhibit 14).22 AP measures the average position for defaulters with position defined as the percentage of issuers with higher or equal ratings. A greater AP indicates a more discriminatory rating system as there are more issuers rated higher than the defaulters, or equivalently that defaulters are generally found in lower rating categories. Exhibit 14 reveals that between 1983 and 2014, the Average Position of defaulters has been consistently high during the entire period, with an average of22For a detailed discussion of average default position and the mathematical derivation of the accuracy ratio from the average default position, please refer to Moody’s Special Comment, Measuring Ratings Accuracy Using Average Default Position , Feb 2011.。
Rating Symbols and Definitions APRIL 2014MARch 2008table of ContentsPreface (2)Moody’s Standing Committee onRating Symbols and Definitions (3)Credit Rating Services (4)Moody’s Global Rating Scales (4)Linkage Between the Global Long-Termand Short-Term Rating Scales (6)Obligations and Issuers Rated on theGlobal Long-Term and Short-Term Rating Scales (7)US Municipal Short-Term Debt andDemand Obligation Ratings (10)National Scale Long-Term Ratings (12)National Scale Short-Term Ratings (13)Probability of Default Ratings (15)Other Permissible Services (16)Assessments of Infonavit’s Third PartyCollection Agencies (16)Bond Fund Ratings (17)Common Representative Quality Assessments (18)Contract Enforceability Indicatorsfor Mexican States (19)Credit Estimates (20)Equity Fund Assessments (21)Indicative Assessment Services (21)Indicative Ratings (22)Investment Manager Quality Assessments (22)Market Risk Ratings (23)Money Market Fund (mf) Ratings (24)National Scale Stock Ratings (25)Originator Assessments (25)Q-Scores (25)Rating Assessment Services (25)Servicer Quality Assessments (26)Trustee Quality Assessments (27)Other Rating Symbols (28)Expected ratings - e (28)Provisional Ratings - (P) (28)Refundeds - # (28)Withdrawn - WR (28)Not Rated - NR (28)Not Available - NAV (28)Terminated Without Rating - TWR (28)Inputs to Rating Services (29)Baseline Credit Assessments (29)Bank Financial Strength Ratings (30)Loss Given Default Assessments (32)Structured Credit Assessments (SCAs) (33)Other Definitions (34)Rating Outlooks (34)Rating Reviews (34)Confirmation of a Rating (35)Affirmation of a Rating (35)Anticipated/Subsequent Ratings Process (35)Rating Agency Conditions (RACs) (35)Covenant Quality Assessments (36)Speculative Grade Liquidity Ratings (36)Definition of Default (36)Definition of Impairment (37)Definition of Loss-Given-Default (38)Long-Term Credit Ratings for Defaultedor Impaired Securities (38)Credit Rating Methodologies (39)Key Rating Assumptions (40)Special Comments (42)Country Ceilings for Bonds and OtherForeign Currency Obligations (42)Country Ceilings for Foreign CurrencyBank Deposits (42)Country Ceiling for Bonds and OtherLocal Currency Obligations (43)Local Currency Deposit Ceiling (43)Hybrid Security Baskets (43)Timely Payment Indicator (TPI) (43)Rating SymbolS and definitionS Moody’s Investors servIce 1PrefaceIn the spirit of promoting transparency and clarity, Moody’s Standing Committee on Rating Symbolsand Definitions offers this updated reference guide which defines Moody’s various ratings symbols, ratingscales and other ratings-related definitions.Since John Moody devised the first bond ratings almost a century ago, Moody’s rating systems haveevolved in response to the increasing depth and breadth of the global capital markets. Much of theinnovation in Moody’s rating system is a response to market needs for clarity around the componentsofcredit risk or to demands for finer distinctions in rating classifications.The Standing Committee on Rating Symbols and Definitions, one of several at Moody’s that focuses oncredit policy issues, is comprised of structured finance, corporate finance, public finance, and financialinstitutions credit analysts, as well as representatives from the Credit Policy group. The names, directtelephone numbers and e-mail addresses of the members of the Standing Committee are listed below.I invite you to contact us with your comments.Ken EmeryChair, Standing Committee on Rating Symbols and Definitions2 Moody’s Investors servIce Rating SymbolS and definitionSRating SymbolS and definitionS Moody’s Investors servIce 3Ken Emery - Chair+1.212.553.4415Senior Vice President, Credit Policy Group kenneth.emery@Richard Cantor+1.212.553.3628Chief Credit Officer, Moody’s Investors Service richard.cantor@Henry Charpentier+34.91.768.8216Managing Director, Structured Finance Group henry.charpentier@Jack Dorer+1.212.553.1332Managing Director, US Public Finance Group jack.dorer@David Fanger+1.212.553.4342Senior Vice President, Financial Institutions Group david.fanger@Joseph Grohotolski+1.212.553.4619Vice President, Senior Compliance Officer joseph.grohotolski@Matthew Jones+1.415.274.1735Senior Vice President, U.S. Public Finance Group matthew.jones@John Kriens+1.212.553.1175Vice President, Information Technology John.Kriens@Marie Menendez+1.212.553.4126Senior Vice President, Corporate Finance Group marie.menendez@Bart Oosterveld+1.212.553.7914Managing Director, Sovereign Risk Group bart.oosterveld@David Rosa+4420.7772.5341Senior Vice President, Credit Policy Group david.rosa@Russell Solomon+1.212.553.4301Senior Vice President, Corporate Finance Group russell.solomon@Celina Vansetti-Hutchins+1.212.553.4845Managing Director, Financial Institutions Group celina.vansetti-hutchins@Alastair Wilson+44.207.772.1372Chief Credit Officer, Europe alastair.wilson@ moody’s Standing Committee on Rating Symbols and definitionsCredit Rating ServicesMoody’s Global Rating ScalesRatings assigned on Moody’s global long-term and short-term rating scales are forward-lookingopinions of the relative credit risks of financial obligations issued by non-financial corporates, financialinstitutions, structured finance vehicles, project finance vehicles, and public sector entities. Long-termratings are assigned to issuers or obligations with an original maturity of one year or more and reflectboth on the likelihood of a default on contractually promised payments and the expected financial losssuffered in the event of default.1 Short-term ratings are assigned to obligations with an original maturityof thirteen months or less and reflect the likelihood of a default on contractually promised payments.2Moody’s differentiates structured finance ratings from fundamental ratings (i.e., ratings on nonfinancialcorporate, financial institution, and public sector entities) on the global long-term scale by adding (sf) toall structured finance ratings. The (sf) indicator was introduced on August 11, 2010 and explained in aspecial comment entitled, “Moody’s Structured Finance Rating Scale.” The addition of (sf) to structuredfinance ratings should eliminate any presumption that such ratings and fundamental ratings at the sameletter grade level will behave the same. The (sf) indicator for structured finance security ratings indicatesthat otherwise similarly rated structured finance and fundamental securities may have different riskcharacteristics. Through its current methodologies, however, Moody’s aspire to achieve broad expectedequivalence in structured finance and fundamental rating performance when measured over a long periodof time.1 F or certain structured finance, preferred stock and hybrid securities in which payment default events are either notdefined or do not match investors’ expectations for timely payment, the ratings reflect the likelihood of impairment(as defined below in this publication) and the expected financial loss in the event of impairment.2 F or certain structured finance, preferred stock and hybrid securities in which payment default events are either notdefined or do not match investors’ expectations for timely payment, the ratings reflect the likelihood of impairment(as defined below in this publication).4 Moody’s Investors servIce Rating SymbolS and definitionSRating SymbolS and definitionS Moody’s Investors servIce56 Moody’s Investors servIceRating SymbolS and definitionSLinkage Between the Global Long-Term and Short-Term Rating ScalesThe following table indicates the long-term ratings consistent with different short-term ratings when such long-term ratings exist.3LONG-TERMRATINGSHORT-TERM RATING3 S tructured finance short-term ratings are usually based either on the short-term rating of a support provider or on an assessment of cash flows available to retire the financial obligation.Obligations and Issuers Rated on the Global Long-Term and Short-Term Rating Scales LONG-TERM AND SHORT-TERM OBLIGATION RATINGSMoody’s assigns ratings to long-term and short-term financial obligations. Long-term ratings are assigned to issuers or obligations with an original maturity of one year or more and reflect both on the likelihood of a default on contractually promised payments and the expected financial loss suffered in the event of default. Short-term ratings are assigned to obligations with an original maturity of thirteen months or less and reflect the likelihood of a default on contractually promised payments.BANK DEPOSIT RATINGSBank Deposit Ratings are opinions of a bank’s ability to repay punctually its foreign and/or domestic currency deposit obligations and, in the case of long-term deposit ratings, also reflect the expected financial loss of the default. Bank Deposit Ratings do not apply to deposits that are subject to a public or private insurance scheme; rather, the ratings apply to uninsured deposits, but they may in some cases incorporate the possibility that official support might in certain cases extend to uninsured as well as insured deposits. Foreign currency deposit ratings are subject to Moody’s country ceilings for foreign currency deposits. This may result in the assignment of a different (and typically lower) rating for the foreign currency deposits relative to the bank’s rating for domestic currency deposits.CORPORATE FAMILY RATINGSMoody’s Corporate Family Ratings (CFRs) are long-term ratings that reflect the likelihood of a default on a corporate family’s contractually promised payments and the expected financial loss suffered in the event of default. A CFR is assigned to a corporate family as if it had and a single class of debt and a single consolidated legal entity structure. CFRs are generally employed for speculative grade obligors, but may also be assigned to investment grade obligors. The CFR normally applies to all affiliates under the management control of the entity to which it is assigned. For financial institutions or other complex entities, CFRs may also be assigned to an association or group where the group may not exercise full management control, but where strong intra-group support and cohesion among individual group members may warrant a rating for the group or association. A CFR does not reference an obligation or class of debt and thus does not reflect priority of claim.COUNTERPARTY RATINGSCounterparty Ratings are assigned to structured financial operating companies and are founded upon an assessment of their ability and willingness to honor their obligations under financial contracts. COUNTERPARTY INSTRUMENT RATINGSCounterparty Instrument Ratings are assigned to a financial contract and measure the risk posed to a counterparty arising from a special purpose vehicle’s (SPV’s) default with respect to its obligations under the referenced financial contract.CREDIT DEFAULT SWAPS RATINGSCredit Default Swaps Ratings measure the risk associated with the obligations that a credit protection provider has with respect to credit events under the terms of the transaction. The ratings do not address potential losses resulting from an early termination of the transaction, nor any market risk associated with the transaction.Rating SymbolS and definitionS Moody’s Investors servIce 7ENHANCED RATINGSEnhanced Ratings only pertain to US municipal securities. An enhanced rating is Moody’s publishedassessment of a particular obligation’s credit quality absent any insurance or wrap from a financialguarantor, but reflecting the underlying issue’s standalone credit quality as well as any credit supportprovided by a state credit enhancement program.INSURANCE FINANCIAL STRENGTH RATINGSInsurance Financial Strength Ratings are opinions of the ability of insurance companies to pay punctuallysenior policyholder claims and obligations and also reflect the expected financial loss suffered in theevent of default . Specific obligations are considered unrated unless they are individually rated becausethe standing of a particular insurance obligation would depend on an assessment of its relative standingunder those laws governing both the obligation and the insurance company.INSURED RATINGSAn insured or wrapped rating is Moody’s assessment of a particular obligation’s credit quality given thecredit enhancement provided by a financial guarantor. Moody’s insured ratings apply a credit substitutionmethodology, whereby the debt rating matches the higher of (i) the guarantor’s financial strength ratingand (ii) any published underlying or enhanced rating on the security.ISSUER RATINGSIssuer Ratings are opinions of the ability of entities to honor senior unsecured financial counterpartyobligations and contracts. As such, Issuer Ratings incorporate any external support that is expected toapply to all current and future issuance of senior unsecured financial obligations and contracts, such asexplicit support stemming from a guarantee of all senior unsecured financial obligations and contracts,and/or implicit support for issuers subject to joint default analysis (e.g. banks and government-relatedissuers). Issuer Ratings do not incorporate support arrangements, such as guarantees, that apply only tospecific (but not to all) senior unsecured financial obligations and contracts.MEDIUM-TERM NOTE PROGRAM RATINGSMoody’s assigns provisional ratings to medium-term note (MTN) programs and definitive ratings to theindividual debt securities issued from them (referred to as drawdowns or notes).MTN program ratings are intended to reflect the ratings likely to be assigned to drawdowns issued fromthe program with the specified priority of claim (e.g. senior or subordinated). To capture the contingentnature of a program rating, Moody’s assigns provisional ratings to MTN programs. A provisional rating isdenoted by a (P) in front of the rating and is defined elsewhere in this document.The rating assigned to a drawdown from a rated MTN or bank/deposit note program is definitive innature, and may differ from the program rating if the drawdown is exposed to additional credit risksbesides the issuer’s default, such as links to the defaults of other issuers, or has other structural featuresthat warrant a different rating. In some circumstances, no rating may be assigned to a drawdown.Moody’s encourages market participants to contact Moody’s Ratings Desks or visit directly if they have questions regarding ratings for specific notes issued under a medium-term noteprogram. Unrated notes issued under an MTN program may be assigned an NR (not rated) symbol.8 Moody’s Investors servIce Rating SymbolS and definitionSSTRUCTURED FINANCE INTEREST ONLY SECURITY (IO) RATINGSA structured finance IO is a stream of cash flows that is a fraction of the interest flows from one or multiple referenced securities or assets in a structured finance transaction. IO ratings address the likelihood and degree to which payments made to the IO noteholders will be impacted by credit losses to the security, securities or assets referenced by the IO. Such IO securities do not have a principal balance. Other non-credit risks, such as a prepayment of the referenced securities or assets, are not addressed by the rating, although they may impact payments made to the noteholders.UNDERLYING RATINGSAn underlying rating is Moody’s assessment of a particular obligation’s credit quality absent any insurance or wrap from a financial guarantor or other credit enhancement.For US municipal securities, the underlying rating will reflect the underlying issue’s standalone credit quality absent any credit support provided by a state credit enhancement program.US BANK OTHER SENIOR OBLIGATION RATINGSRatings on US Banks’ Other Senior Obligations (OSOs) are opinions of a US bank’s ability to repay punctually its foreign deposits and International Banking Facility deposits, as well as other seniornon-depository obligations, including bank notes, letter-of-credit supported obligations, federal funds and financial contracts. US law provides that foreign deposits and senior unsecured obligations, including bank notes, will rank behind domestic deposit obligations of US banks in the event of liquidation. A rating distinction between domestic deposits and OSOs will be reflected in those cases where there is a material susceptibility for impairment at a future time.US Municipal Short-Term Debt and Demand Obligation RatingsSHORT-TERM OBLIGATION RATINGSWhile the global short-term ‘prime’ rating scale is applied to US municipal tax-exempt commercial paper, these programs are typically backed by external letters of credit or liquidity facilities and their short-term prime ratings usually map to the long-term rating of the enhancing bank or financial institution and not to the municipality’s rating. Other short-term municipal obligations, which generally have different funding sources for repayment, are rated using two additional short-term rating scales (i.e., the MIG and VMIG scales discussed below).The Municipal Investment Grade (MIG) scale is used to rate US municipal bond anticipation notes of up to three years maturity. Municipal notes rated on the MIG scale may be secured by either pledged revenues or proceeds of a take-out financing received prior to note maturity. MIG ratings expire at the maturity of the obligation, and the issuer’s long-term rating is only one consideration in assigning the MIG rating. MIG ratings are divided into three levels—MIG 1 through MIG 3—while speculative grade short-term obligations are designated SG.DEMAND OBLIGATION RATINGSIn the case of variable rate demand obligations (VRDOs), a two-component rating is assigned: a long or short-term debt rating and a demand obligation rating. The first element represents Moody’s evaluation of risk associated with scheduled principal and interest payments. The second element represents Moody’s evaluation of risk associated with the ability to receive purchase price upon demand (“demand feature”). The second element uses a rating from a variation of the MIG scale called the Variable Municipal Investment Grade (VMIG) scale. The rating transitions on the VMIG scale, as shown in the diagram below, differ from those on the Prime scale to reflect the risk that external liquidity support generally will terminate if the issuer’s long-term rating drops below investment grade.US MUNICIPAL SHORT- TERM VS. LONG-TERM RATINGSSHORT-TERM DEMAND OBLIGATIONLONG-TERMRATING* For SBPA-backed VRDBs, The rating transitions are higher to allow for distance to downgrade tobelow investment grade due to the presence of automatic termination events in the SBPAs.National Scale Long-Term RatingsMoody’s long-term National Scale Ratings (NSRs) are opinions of the relative creditworthiness of issuers and financial obligations within a particular country. NSRs are not designed to be compared among countries; rather, they address relative credit risk within a given country. Moody’s assigns national scale ratings in certain local capital markets in which investors have found the global rating scale provides inadequate differentiation among credits or is inconsistent with a rating scale already in common use in the country.In each specific country, the last two characters of the rating indicate the country in which the issuer is located (e.g., Aaa.br for Brazil).National Scale Short-Term RatingsMoody’s short-term NSRs are opinions of the ability of issuers in a given country, relative to other domestic issuers, to repay debt obligations that have an original maturity not exceeding one year. Short-term NSRs in one country should not be compared with short-term NSRs in another country, or with Moody’s global ratings.There are four categories of short-term national scale ratings, generically denoted N-1 through N-4 as defined below.In each specific country, the first two letters indicate the country in which the issuer is located (e.g., BR-1 through BR-4 for Brazil).Moody’s currently maintains long-term and short-term NSRs for the following countries:»Argentina (.ar)»Bolivia (.bo)»Brazil (.br)»Colombia (.co)»Czech Republic (.cz)»Kazakhstan (.kz)»Lebanon (.lb)»Mexico (.mx)»Russia (.ru)»Slovakia (.sk)»South Africa (.za)»T unisia (.tn)»T urkey (.tr)»Ukraine (.ua)»Uruguay (.uy)Probability of Default RatingsA probability of default rating (PDR) is a corporate family-level opinion of the relative likelihood that any entity within a corporate family will default on one or more of its long-term debt obligations. For families in default on all of their long-term debt obligations (such as might be the case in bankruptcy), a PDR of D-PD is assigned. For families in default on a limited set of their debt obligations, the PDR is appended by the indicator “/LD”, for example, Caa1-PD/LD.A D-PD probability of default rating is not assigned (or /LD symbol appended) until a failure to pay interest or principal extends beyond any grace period specified by the terms of the debt obligation.A D-PD probability of default rating is not assigned (or /LD indicator appended) for distressed exchanges until they have been completed, as opposed to simply announced.Adding or removing the “/LD” indicator to an existing PDR is not a credit rating action.other Permissible ServicesAssessments of Infonavit’s Third Party Collection AgenciesMoody’s Assessments of Infonavit’s Third Party Collection Agencies are opinions regarding these agencies’ ability to collect on Infonavit’s mortgage loans. The assessments are provided to independent collection agencies that are contracted by Infonavit to collect on mortgage loans when the loan cannot be serviced via payroll deduction. They are assigned to agencies that service low delinquency pools or/and high delinquency pools. The assessment to these Infonavit service providers applies only in the context of Infonavit’s primary servicing operations. As a result, these assessments are not stand-alone servicer/vendor quality ratings and do not refer to the ability of these third party collection agencies to service other types of loans.Moody’s maintains Assessments of Infonavit’s Third Party Collection Agencies only in Mexico.The Instituto del Fondo Nacional de la Vivienda para los T rabajadores (Infonavit) is the Mexican federal institute for workers housing, which originates and securitizes mortgage loans. While initially Infonavit loans are repaid via payroll deduction, once the borrower ceases to work for a company in the private sector the loan is serviced by Infonavit using a network of independent collection agencies.»Strong»Above Average»Average»Below Average»WeakNote: Where appropriate, a “+” or “-” modifier will be appended to the “Above Average”, “Average”, and “Below Average” category and a “-” modifier will be appended to the “Strong” category. A “+” modifier indicates the agency ranks inthe higher end of the designated category. A “-” modifier indicates the agency ranks in the lower end of thedesignated category.Bond Fund RatingsBond Fund Ratings are opinions of the credit quality of investments within mutual funds and similar in-vestment vehicles which principally invest in medium- and long-term fixed income obligations. As such, these ratings primarily reflect Moody’s assessment of the creditworthiness of the assets held by the fund. Other risks, such as liquidity, operational, interest rate, currency and any other market risk, are excluded from the rating. In addition, as the ratings are intended to represent opinions on a fund’s underlying assets, they specifically do not consider the historic, current, or prospective performance of a fund with respect to appreciation, volatility of net asset value, or yield.Common Representative Quality AssessmentsMoody’s Common Representative Quality (CRQ) Assessments are opinions regarding an organization’s ability to represent the interests of investors, relative to other common representatives within a given country. The assessments represent Moody’s assessment of a common representative’s organizational structure and other management characteristics, including its human resources allocation, information technology, and operational controls and procedures.The assessment definitions are as follows, with an “nn” modifier signifying the relevant country (e.g. CRQ1.mx for Mexico). Moody’s currently maintains common representative assessments for Mexico.Contract Enforceability Indicators for Mexican StatesContract enforceability indicators are opinions of the relative effectiveness of Mexican states in enforcing disputed commercial contracts and mortgages. The indicators provide an ordinal ranking and do not address the absolute effectiveness of state judicial systems. Contract enforceability indicators are assigned to individual states based on a standardized weighting of results generated by independent, questionnaire-based, studies conducted by the Instituto Tecnológico Autonomy de México (ITAM), a Mexican university, and Gaxiola Calvo Sobrino y Asociados (GCSA), a Mexican law firm. As the indicators are derived primarily from public opinion polls, which may vary due to changes in participants and/or perceptions, they are not directly comparable from one study to another. Accordingly, the indicators are point-in-time assessments and are not monitored between studies.Credit EstimatesA Credit Estimate (CE) is an unpublished point-in-time opinion of the approximate credit quality of individual securities, financial contracts, issuers, corporate families or loans. CEs are not Moody’s Credit Ratings and are not assigned by rating committees. Had Moody’s conducted an analysis commensurate with a full Moody’s Credit Rating, the result may have been significantly different. Additionally, CEs are not monitored but are often updated from time to time.CEs are widely used in the process of assessing elements of credit risk in transactions for which a traditional Moody’s Credit Rating is to be determined. CEs are provided in the context of granular pools (where no one obligor represents an exposure of more than 3% of the total pool), chunky pools (where individual exposures represent 3% or more of the total pool) or single-name exposures.CEs are typically assigned based on an analysis that uses public information (which at times may be limited) or information supplied by various third parties and usually does not involve any participation from the underlying obligor.CEs are not expressed through the use of Moody’s traditional 21-point, Aaa-C alphanumeric long-term rating scale; rather, they are expressed on a simple numerical 1-21 scale. They are calibrated, however, to be broadly comparable to Moody’s alphanumeric rating scale and Moody’s Rating Factors, which are used in CDO analysis.Equity Fund AssessmentsMoody’s equity fund assessments are opinions of the relative investment quality of investment funds, which principally invest in common stock or in a combination of common stock and fixed-income securities. Investment quality is judged based on the fund’s historical performance relative to funds employing a similar investment strategy, as well as on the quality of the fund manager.The assessments are not opinions on prospective performance of a fund with respect to asset appreciation, volatility of net asset value or yield.Indicative Assessment ServicesAn Indicative Assessment or IAS is a confidential, unpublished, unmonitored, point-in-time opinionof the potential Credit Rating(s) of, and based solely on, one or more hypothetical Scenario(s) (defined below)communicated to MIS in writing by an applicant in relation to an entity/issuer that does not currently have a public Credit Rating from MIS. Indicative Assessments are not equivalent to and do not represent traditional MIS Credit Ratings. However, Indicative Assessments are expressed on MIS’s traditional rating scale.SCENARIOA Scenario is:(a) a proposed credit transforming transaction, project and/or debt issuance which materially alters theissuer’s current state (including acquisitions, disposals, share buybacks, listings, initial public offerings and material restructurings), or a materially different variation on such a transaction, project and/or debt issuance, including a material change in the overall size of the debt being contemplated; or (b) a materially different variation on the proposed debt issuance that has previously been the subject ofan Indicative Rating, including a material change in the overall size of debt being contemplated.。