Subways_2014
- 格式:pdf
- 大小:5.50 MB
- 文档页数:47
2014年大连中考英语试题及答案(文字版)第I卷选择题(共74分)I.单项填空(本题共16小题,每小题1分,共16分)从各题所给的四个选项中,选出可以填入空白处的最佳选项.1。
Jim is good baskball player。
He plays in our school team。
A.a B。
an C.the D。
/2。
In America,people start celebrating the New Year 31st December。
A。
in B。
at C.on D。
for3.Many Asian elephants live in India but you can find in other coutries as well。
A。
him B.them C。
her D.it4。
Look at the nice !I’ve decided to wear it to the party。
A。
doll B。
cup C。
poster D。
dress5.In a green school,everyone agrees to be about the environment.A。
nervous B.careful C.honest D。
rude6。
May I your bike,please? I’ll give it back to you soon。
A。
touch B.bring C。
borrow D。
buy7.The British Museum is very serious.Visitors keep quiet.A.mayB.mightC.can D。
must8.-Who plays the violin ,Sally or Kylie?-Sally。
But she gave the chance to Kylie。
A.well B。
better C.best D。
the best9。
高一英语完成句子试题1.【1】由于“舌尖上的中国”第二季的介绍,这家特色小面馆发生了很大的变化。
Thanks to A Bite of China II, great changes have _______ _______in this small local noodle restaurant.【答案】taken place【解析】考查固定短语。
这里考查固定短语搭配take place发生。
【2】西班牙队在World Cup 2014中以失败告终。
Spain football team ended _______ _______in World Cup 2014.【答案】in failure【解析】考查固定短语。
本题考查固定短语end in failure以失败而告终。
【3】你看见了左边的那条通向大亚湾的路吗?You see the road on the right _______ _______Daya Bay?【答案】leading to【解析】考查非谓语动词。
这里考查现在分词作定语,the road与lead to之间为主动关系。
【4】无论内马尔走到哪里,总是有许多足球迷等着想见他。
_______ Neymar goes, there are many football fans _______to see him.【答案】Wherever; waiting【解析】考查非谓语动词。
Wherever作地点状语,第二空用现在分词作定语,名词fans与wait 之间为主动关系。
【5】本周日是否沿东江绿道骑车得看天气而定。
Whether we will cycle along the East River Greenway this Sunday all _______ _______the weather.【答案】depends on【解析】考查主谓一致。
主语为主语从句,故谓语动词用单数形式。
2015英语专业四级真题及答案解析TEST FOR ENGLISH MAJORS (2015 -GRADE FOUR-PART I DICTATIONPART II LISTENING COMPREHENSIONSECTION A CONVERSATIONSConversation one1. Why is the trip to Mars a one-way trip?A. The return trip is too expensive.B. There is no technology to get people back.C. People don’t want to return.D. The return trip is too risky.2. According to the man, what is more important for those recruits?A. Intelligence.B. Health.C. Skills.D. Calmness.3. What is the last part of the conversation about?A. The kind of people suitable for the trip.B. Interests and hobbies of the speakers.C. Recruitment of people for the trip.D. Preparation for the trip to Mars.Conversation Two4. What is showrooming?A. Going to the high street.B. Visiting everyday shops.C. Buying things like electrical goods.D. Visiting shops and buying online.5. According to the conversation, the man had bought all the following things online EXCEPTA. shoesB. CDsC. cameraD. food6. According to the conversation, the percentage of people who showroomed while Christmas shopping wasA. 3%B. 33%C. 42%D. 24%7. One reason for people to showroom is that theyA. want to know more about pricingB. can return the product laterC. want to see the real thing firstD. can bargain for a lower shop priceConversation Three8. What is the conversation mainly about?A. How to avoid clashes of exams.B. How to schedule exams.C. How to use the faculty lounge.D. How to choose the courses.9. What does the student have to do first in order to take the exams?A. To choose a date on the draft schedule.B. To find the information on the bulletin board.C. To draw up the final schedule.D. To arrange an invigilator.10. According to the conversation, the Dean willA. sign the sheet in the faculty loungeB. take care of the bulletin boardC. consult the studentsD. finalize the exam scheduleSECTION B PASSAGESPassage One11. Which of the following cities has the oldest Chinatown in North America?A. New York.B. San Francisco.C. Boston.D. San Diego.12. The Chinatown in San Francisco attracts tourists a year.A. 20 ,000B. 100 ,000C. 7 millionD. 17 million13. Where can tourists see the fish markets?A. In Stockton Street.B. In Grant Avenue.C. In Portsmouth Square.D. In Bush Street.Passage Two14. Which of the following is NOT mentioned in the passage?A. Obesity can damage one’s health.B. Obesity is a growing problem all over the world.C. Obesity is directly related to one’s habit.D. Obesity has affected both boys and girls.15. The purpose of the three-year study is to .A. find out why some children find it difficult to go to sleepB. learn more about the link between sleep and weightC. identify the ways parents reduce their kids’ weightD. see if there is difference in sleep patterns over the period16. According to the study, the daily healthy sleep time for the 3rd to 6thgraders should be around ___ hours.A. 8B. 9C. 10D. 1117. According to the passage, obesity is most likely related to __ .A. sleep timeB. genderC. raceD. parentsPassage Three18. According to a number of students, __ __ is the main factor for early-age smoking.A. genderB. personalityC. environmentD. money19. Which of the following statements is CORRECT?A. Very few continue smoking throughout their teenage years.B. Most early-age smokers soon stop experimenting.C. Some early-age smokers never go beyond experimenting.D. Children quickly become regular smokers by carrying cigarettes.20. All the following are features of smokers EXCEPT ___ .A. strong peer influenceB. low sense of achievementC. high sense of rebellionD. close family relationshipSECTION C NEWS BROADCASTNews Item 121. Why were some children offered only fruit and milk for lunch?A. The school stopped providing school lunch.B. Their parents failed to pay for school lunch.C. Some parents preferred fruit and milk for lunch.D. These children chose to have something different.22. How did parents react to the school’s way of handling the situation?A. They were upsetB. They were furious.C. They were surprised.D. They were sad.News Item 223. According to the news, what is the main advantage of the digital key?A. Guests can pay without going to the front desk.B. Guests can go direct to their rooms.C. Guests can check out any time.D. Guests can make room reservations.24. The hotel company intends to have the system in ___ of its hotels in the next three months.A. 2B. 3C. 100D. 150News Item 325. According to the court ruling, Shrien Dewani _ ___ .A. will return to the U.K. for medical treatmentB. will remain in South Africa for medical treatmentC. will stand trial in South Africa once proved fitD. will be extradited even if he is unfit to stand trial26. What was Dewani accused of?A. Having his wife killed.B. Killing his wife in the U.K.C. Being involved in a taxi accident.D. Hiring a crew of hit men. News Item 427. The U.N. new vote would allow all the following EXCEPT ___ .A. the use of force by European Union troopsB. the suspension of an existing arms embargoC. the extension of U.N. peacekeeping missionD. the ban on travel and freeze of assetsNews Item 528. What is the news mainly about?A. Causes of early death in Russia.B. Behavior of alcoholics.C. Causes of alcohol poisoning.D. Number of death over 10 years.News Item 629. The total investment in film-making in Britain in 2012 was __ __ .A. £945 millionB. £1.07 billionC. £500,000D. £87,00030. Hollywood studios prefer to make films in Britain because ___ .A. The UK is a good film locationB. The cast usually comes from BritainC. Hollywood emphasizes qualityD. Production cost can be reducedPART III CLOZEElectricity is such a part of our everyday lives and so much ta ken for granted nowadays 31 ___ werarely think twice when we switch on the light or turn on the TV set. At night, roads are brightly lit,enabling people and32 ___ to move freely. Neon lighting used in advertising has become part of the 33 ___ of every modern city. In the home, many 34 ___ devices are powered by electricit y. 35 ___when we turn off the bedside lamp and are 36 ___ asleep, electr icity is working for us, 37 ___ ourrefrigerators, heating our water, or keeping our rooms air-conditio ned. Every day, trains, buses andsubways take us to and from work. We rarely 38 ___ to conside r why or how they run——39 ___ something goes wrong.In the summer of 1959, something 40 ___ go wrong with the pow er-plant that provided New Yorkwith electricity. For a great many hours, life came almost toa 41 ___. Trains refused to move and the people in them satin the dark, 42 ___ to do anything; lifts stopped working, so that 43 ___ you were lucky enough not to be 44. ___ betwee n two floors, you had the unpleasant task of finding your way down 45 ___ of stairs. Famous streets like Broadway and Fifth Avenue in a(n) 46 ___ became asgloomy and uninviting 47 ___ the most remote back streets. Peop le were afraid to leave their houses,48 ___ . although the police had been ordered to 49 ___ in case of emergency, they were just asconfused and50 ___ as anybody else.31. A. that B. thus C. as D. so32. A. car B. truck C. traffic D. pedestrians33. A. appearance B. character C. distinction D. surface34. A. money-saving B. time-saving C. energy-saving D. labor-saving35. A. Only B. Rarely C. Even D. Frequently36. A. fast B. quite C. closely D. quickly37. A. moving B. starting C. repairing D. driving38. A. trouble B. bother C. hesitate D. remember39. A. when B. if C. until D. after40. A. did B. would C. could D. Should41. A. pause B. terminal C. breakdown D. standstill42. A. incompetent B. powerless C. hesitant D. helpless43. A. although B. when C. as D. even if44. A. trapped B. placed C. positioned D. locked45. A. steps B. levels C. flights D. floors46. A. time B. instant C. point D. minute47. A. like B. than C. for D. as48. A. for B. and C. but D. or49. A. stand aside B. stand down C. standby D. stand in50. A. aimless B. helpless C. unfocused D. undecidedPART IV GRAMMAR AND VOCABULARY51. When you have finished with that book, don’t forget to put it backon the shelf, ____?A. don’t youB. do youC. will youD. won’t you52. Mary is __ ___ hardworking than her sister, but she failed in theexam.A. no lessB. no moreC. not lessD. not so53. Which of the following statements is INCORRECT?A. Only one out of six were present at the meeting.B. Ten dollars was stolen from the cash register.C. Either my sister or my brother is wrong.D. Five miles seem like a long walk to me.54. Which of the italicized parts expresses a future tense?A. My friend teaches chemistry in a school.B. I’ll give it to you after I return.C. What is the matter with you?D. London stands on the River Thames.55. It is not so much the language ____ the cultural background thatmakes the film difficult to understand.A. butB. norC. likeD. as56. There is no doubt ____ the committee has made the right decision on the housing project.A. whyB. thatC. whetherD. when57. All the President’s Men ____ one of the important books forscholars who study the Watergate Scandal.A. remainsB. remainedC. remainD. is remaining58. If you explained the situation to your lawyer, he ___ __ able toadvise you much better than I can.A. will beB. wasC. would beD. were59. Which of the following is a stative verb (静态动词)?A. DrinkB. CloseC. RainD. Belong60. Which of the following italicized parts indicates a subject-verb relation?A. The man has a large family to support.B. She had no wish to quarrel with her brother.C. He was the last guest to leave.D. Mary needs a friend to talk to.61. The following are all correct response s to “Who told the newsto the teacher?” EXCEPT __ ___?A. Bob did itB. Bob did soC. Bob did thatD. Bob did.62. Which of the following is INCORRECT?A. Another two girlsB. Few wordsC. This workD. A bit of flowers63. Which of the following italicized words does NOT indicate willingness?A. What will you do when you graduate?B. They will be home by now.C. Who will go with me?D. Why will you go there alone?64. When one has good health, ___ should feel fortunateA. youB. sheC. heD. we65. There ____ nothing more for discussion, the meeting came to an end half an hour earlier.A. to beB. to have beenC. beD. being66. Two of her brothers were _ __ during the Second World War.A. called upB. called onC. called forD. called out67. Bottles from this region sell __ ____ at about $50 a case.A. entirelyB. totallyC. wholesaleD. together68. The product contains no ____ colours, flavours, or preservatives.A. fakeB. artificialC. falseD. wrong69. Davis accepted the defeat in the semi-final with good grace. Theunderlined part is closest in meaning to ___ ___.A. cheerfullyB. wholeheartedlyC. politelyD. quietly70. __ ___ and business leaders were delighted at the decision to holdthe national motor fair in the city.A. CivilB. CivilizedC. CivilianD. Civic71. The city council is planning a huge road-building programme toease congestion. The underlined part means __ ___.A. calmB. relieveC. comfortD. still72. His unfortunate appearance was offset by an attractivepersonality. The underlined part means all the following EXCEPT ____.A. improvedB. made up forC. balancedD. compensated for73. The doctor said that the gash in his check required stitches. The underlined part means ____.A. lumpB. depressionC. swellingD. cut74. During the economic crisis, they had to cut back production and __ ___ workers.A. lay offB. lay intoC. lay downD. lay aside75. The university consistently receives a high __ ____ for the quality of its teaching and research.A. standardB. evaluationC. ratingD. comment76. To mark its one hundredth anniversary, the university held aseries of activities including conferences, film shows, etc. Theunderlined part means __ ___.A. signifyB. celebrateC. symbolizeD. suggest77. His fertile mind keeps turning out new ideas. The underlined part means _ ____.A. abundantB. unbelievableC. productiveD. generative78. The local news paper has a ___ __ of 100,000 copies a day.A. spreadB. circulationC. motionD. flow79. These issues were discussed at length during the meeting. The underlined part means __ ___.A. eventuallyB. subsequentlyC. lastlyD. fully80. A couple of young people were giving out leaflets in front of thedepartment store. The underlined part means __ ___.A. distributingB. handlingC. dividingD. arrangingPART V READING COMPREHENSIONText AInundated by more information than we can possibly hold in our head, we're increasingly handing off the job of remembering to search engines and smart phones. Google is even reportedly working on eyeglasses that could one day recognize faces and supply details about whoever you're looking at. But new research shows that outsourcing our memory –and expecting that information will be continually and instantaneously available --is changing our cognitivehabits.Research conducted by Betsy Sparrow, an assistant professor of psychology at Columbia University, has identified three new realities about how we process information in the Internet age. First, her experiments showed that when we don't know the answer to a question, we now think about where we can find the nearest Web connection instead of the subject of the question itself.A second revelation is that when we expect to be able to find information again later on, we don't remember it as well as when we think it might become unavailable. And then there is the researchers' final observation: the expectation that we'll he able to locate inf orination down the line leads us to form a memory not of the fact itself but of where we'II be able to find it.But this handoff comes with a downside. Skills like critical thinking and analysis must develop in the context of facts: we need something to think and reason about, after all. And these facts can't be Googled as we go;they need to be stored in the original hard drive, our long-term memory. Especially in the case of children, "factual knowledge must precede skill," says Daniel Willingham, a professor of psychology, at the University of Virginia -- meaning that the days of drilling the multiplication table and memorizing the names of the Presidents aren't over quite yet. Adults, too, need to recruit a supply of stored knowledge in order to situate and evaluate new information they encounter. You can't Google context.Last, there's the possibility, increasingly terrifying to contemplate,that our machines fail us. As Sparrow puts it, "The experience of losing our Internet connection becomes more and more like losing a friend." If you're going to keep your memory on your smart phone, better make sure it's fully charged.81. Google’s eyeglasses are supp osed to _ __.[A]improve our memory [B]function like memory[C]help us see faces better [D]work like smart phones82. According to the passage, “cognitive habits” refers to _ __.[A] how we deal with information [B] functions of human memory[C] the amount of information [D] the availability of information83. Which of the following statements about Sparrow’s research is CORRECT?[A] We remember people and things as much as before.[B] We remember more Internet connections than before.[C] We pay equal attention to location and content of information.[D]We tend to remember location rather than the core of facts.84. What does the author mean by “context”?[A]It refers to long-term memory. [B]It refers to a new situation.[C]It refers to a store of knowledge. [D]It refers to the search engine.85. What is the implied message of the author?[A]Web connections aid our memory.[B]People differ in what to remember.[C]People keep memory on smart phones.[D]People need to exercise their memory.Text BI was a second-year medical student at the university, and was on my second day of rounds at a nearby hospital. My university's philosophy was to get students seeing patients early in their education. Nice idea,but it overlooked one detail:second-year students know next to nothing about medicine.Assigned to my team that day was an attending - a senior faculty member who was there mostly to make patients feel they weren't in the hands of amateurs. Many attendings were researchers who didn't have much recent hospital experience. Mine was actually an arthritis specialist. Also along was a resident (the real boss, with a staggering mastery of medicine, at least to a rookie like myself). In addition there were two interns(住院实习医生). These guys were just as green as I was,but in a scarier way: they had recentlygraduated from the medical school, so they were technically MDs.I began the day at 6:30 am. An intern and I did a quick check of our eight patients; later, we were to present our findings to the resident and then to the attending. I had three patients and the intern had the other five - piece of cake.But when I arrived in the room of 71-year-old Mr. Adams,he was sitting up in bed, sweating heavily and panting (喘气). He'd just had a hip operation and looked terrible. I listened to his lungs with my stethoscope, but they sounded clear. Next I checked the logof his vital signs and saw that his respiration and heart rate had been climbing, but his temperature was steady. It didn't seem like heart failure, nor did it appear to be pneumonia. So I asked Mr. Adams what he thought was going on."It's really hot in here, Doc," he replied.So I attributed his condition to the stuffy room and told him the rest of the team would return in a few hours. He smiled and feebly waved goodbye. At 8:40 am., during our team meeting, "Code Blue Room 307!" blared from the loudspeaker. I froze.That was Mr. Adams's room.When we arrived, he was motionless.The autopsy (尸体解剖) later found Mr. Adams had suffered a massive pulmonary embolism (肺部栓塞). A blood clot had formed in his leg, worked its way to his lungs, and cut his breathing capacity in half. His symptoms had been textbook: heavy perspiration and shortness of breath despite clear lungs. The only thing was: I hadn't read that chapter in the textbook yet. And I was too scared, insecure, and proud to ask a real doctor for help. This mistake has haunted me for nearly 30 years, but what's particularly frustrating is that the same medical education system persists. Who knows how many people have died or suffered harm at the hands of students as naive as I, and how many more will?86. Why was the author doing rounds in a hospital?[A]He himself wanted to have practice.[B]Students of all majors had to do so.[C]It was part of his medical training.[D]He was on a research team.87. We learn that the author’s team members had __.[A]much practical experience [B]adequate knowledge[C]long been working there [D]some professional deficiency88. While the author was examining Mr. Adams, all the followingsymptoms caught his attention EXCEPT __ __.[A]moving difficulty [B]steady temperature[C]faster heart rate [D]breathing problem89. “His symptoms had been textbook” means that his symptoms were _ ___.[A]part of the textbook [B]no longer in the textbook[C]recently included in the textbook [D]explained in the textbook90. At the end of the passage, the author expresses __ __ about the medical education system.[A]optimism [B]hesitation [C]concern [D]supportTEXT CThe war on smoking, now five decades old and counting, is one of the nation's greatest public health success stories - but not for everyone. As a whole, the country has made amazing progress. In 1964, four in ten adults in the US smoked; today fewer than two in ten do. But some states - Kentucky, South Dakota and Alabama to name just a few - seem to have missed the message that smoking is deadly.Their failure is the greatest disappointment in an effort to save lives that was started on Jan. 11, 1964, by the first Surgeon General's Report onSmoking and Health. Its finding that smoking is a cause of lung cancer and other diseases was major news then. The hazards of smoking were just starting to emerge.The report led to cigarette warning labels, a ban on TV ads and eventually an anti-smoking movement that shifted the nation's attitude on smoking. Then, smokers were cool. Today, many are outcasts, rejected by restaurants, bars, public buildings and even their own workplaces. Millions of lives have been saved.The formula for success is no longer guesswork: Adopt tough warning labels, air public service ads, fund smoking cessation programs and impose smoke-free laws. But the surest way to prevent smoking, particularly amongprice-sensitive teens, is to raise taxes. If you can stop them from smoking, you've won the war. Few people start smoking after turning 19.The real-life evidence of taxing power is powerful. The 10 states with the lowest adult smoking rates slap an average tax of $2.42 on every pack -- three times the average tax in the states with the highest smoking rates. New York has the highest cigarette tax in the country, at $4.35 per pack, and just 12 percent of teens smoke, far below the national average of 18 percent. Compare that with Kentucky, where taxes are low (60 cents), smoking restrictions are weak and the teen smoking rate is double New York's. Other low-tax states have similarly dismal records.Enemies of high tobacco taxes cling to the tired argument that they falldisproportionately on the poor. True, but so do the deadly effects of smoking, far worse than a tax. The effect of the taxes is amplified further when the revenue is used to fund initiatives that help smokers quit or persuade teens not to start.Anti-smoking forces have plenty to celebrate this week, having helped avoid 8 million premature deaths in the past 50 years. But as long as 3,000 adolescents and teens take their first puff each day, the war is not won.91. What does "counting" mean in the context?[A] Continuing. [B] Including. [C] Calculating. [D] Relying on.92. According to the context, "Their failure" refers to__ _____.[A] those adults who continue to smoke[B] those states that missed the message[C] findings of the report[D] hazards of smoking93. The following are all efforts that led to the change of attitude on smoking EXCEPT_____.[A] rejecting by the public [B] cigarette warning labels[C] anti-smoking campaigns [D] anti-smoking legislation94. According to the author, raising tax on cigarettes___ ____.[A] is unfair to the poor [B] is an effective measure[C] increases public revenue [D] fails to solve the problem95. What is the passage mainly about?[A] How to stage anti-smoking campaigns.[B] The effects of the report on smoking and health.[C] Tax as the surest path to cut smoking.[D] The efforts to cut down on teenage smoking.TEXT DAttachment Parenting is not Indulgent Parenting. Attachment parents do not "spoil" their children. Spoiling is done when a child is given everything that they want regardless of what they need and regardless of what is practical. Indulgent parents give toys for tantrums(发脾气), ice cream for breakfast. Attachment parents don't give their children everything that they want, they give their children everything that they need. Attachment parents believe that love and comfort are free and necessary. Not sweets or toys.Attachment Parenting is not "afraid of tears" parenting. Our kids cry. The difference is that we understand that tantrums and tears come from emotions and not manipulation. And ourchildren understand this too, They cry and have tantrums sometimes, of course. But they do this because their emotions are so overwhelming that they need to get it out. They do not expect to be "rewarded" for their strong negative emotions; they simply expect that we will listen. We pick up our babies when they cry, and we respond to the tears of our older children because we believe firmly that comfort is free, love is free, and that when a child has need for comfort and love, it is our job to provide those things. We are not afraid of tears. We don't avoid them. We hold our children through them and teach them that when they are hurt or frustrated we are here to comfort them and help them work through their emotions.Attachment Parenting is not Clingy Parenting. I do not cling to my children, In feet, I'm pretty free-range. As soon as they can move they usually move away from me and let me set up a chase as they crawl, run, skip and hop on their merry way to explore the world, Sure, I carry them and hug them and chase them and kiss them and rock them and sleep with them, But this is not me following them everywhere and pulling them back to me. This is me being a home base. The "attachment" comes from their being allowed to attach to us, not from us attaching to them like parental leeches.Attachment Parenting is not Selfish Parenting. It is also not selfless parenting, We are not doing it for us, and we are not doing it to torment ourselves,Attachment parenting is not Helicopter Parenting. I don't hover, I supervise,I follow, I teach, I demonstrate, I explain. I don't slap curious hands away, I show how to do things safely, I let my child do the things that my child wishes to do, first with help and then with supervision and finally with trust, I don't insist that my 23 month old hold my hand when we walk on the sidewalk because I know that I can recall him with my voice because he trusts me to allow him to explore and he trusts me to explain when something is dangerous and to help him satisfy his curiosities safely.Most of the negative things that I hear about "attachment parents" are completely off-base and describe something that is entirely unlike Attachment Parenting. Attachment Parenting is child-centric and focuses on the needs of the child. Children need structure, rules, and boundaries. Attachment Parents simply believe that the child and the parent are allies, not adversaries, And that children are taught, not trained.96. What makes attachment parents different from indulgent parents is that they .A. show more love to their childrenB. think love is more importantC. prefer both love and toys in parentingD. dislike ice cream or sweets97. According to the author, what should parents do when their kids cry?。
2014上半年豆瓣电影【口碑榜】Top502014年7月5日,豆瓣电影口碑榜公布了2014第27周榜单结果,至此,口碑榜已经完成了2014上半年的更新。
根据这半年的上榜条目,我们整理了最受好评的前50部影片,供你参考。
为了让这份榜单更纯粹,我们过滤了以下类型的条目:短片、微电影、动漫剧场版、特别篇以及部分2013范畴的电影。
榜单根据影片“评分+评分人数+已上映天数”等元素综合排序。
韩国电影《辩护人》登顶半年最佳,《布达佩斯大饭店》《达拉斯卖家俱乐部》分别位列第2、第3。
前10名里有七部美国电影,日韩法国电影各一部,0部华语片,排名最高的华语片为第28名的《天注定》。
以下为完整榜单:1 辩护人9.0分변호인/ 剧情/ 韩国/ 2013-12-18导演: 杨宇锡主演: 宋康昊/ 吴达洙/ 金英爱/ 郭道元/ 任时完重要的不是这个电影拍的如何,而是韩国电影人在拍这样的电影,韩国观众在看这样的电影,没有审查阻止、禁止、扼止你拍,没有无形之手阻止、禁止、扼止你看,这,就是民主。
韩国电影这20年的迅猛发展,离不开韩国电影人的勇气和毅力!(via 老晃)2 布达佩斯大饭店8.8分The Grand Budapest Hotel / 剧情喜剧/ 美国德国/ 2014-03-07导演: 韦斯·安德森主演: 拉尔夫·费因斯/ 托尼·雷沃罗利/ 艾德里安·布洛迪/ 威廉·达福/ 裘德·洛/ 爱德华·诺顿/ 西尔莎·罗南/ 蒂尔达·斯文顿/ 比尔·默瑞/ 蕾雅·赛杜/ 欧文·威尔逊《布达佩斯大饭店》里的各种对称,安德森的各种讲究,从色彩到布局甚至是时间线和情感线上均有始有终,新世界和旧世界如齿轮一样完美暗合,不失为一种优雅。
在梦境之上再造梦境,在废墟之上再建废墟,明明颓唐又万分克制,难怪会为你入迷。
(via 眠去)3 达拉斯买家俱乐部8.6分Dallas Buyers Club / 剧情/ 美国/ 2013-11-01导演: 让-马克·瓦雷主演: 马修·麦康纳/ 詹妮弗·加纳/ 杰瑞德·莱托/ 史蒂夫·茨恩一流的表演,除口音尚可辨识,麦康纳已经完全成为了剧中人,莱托的表现也非常惊人,值得敬佩。
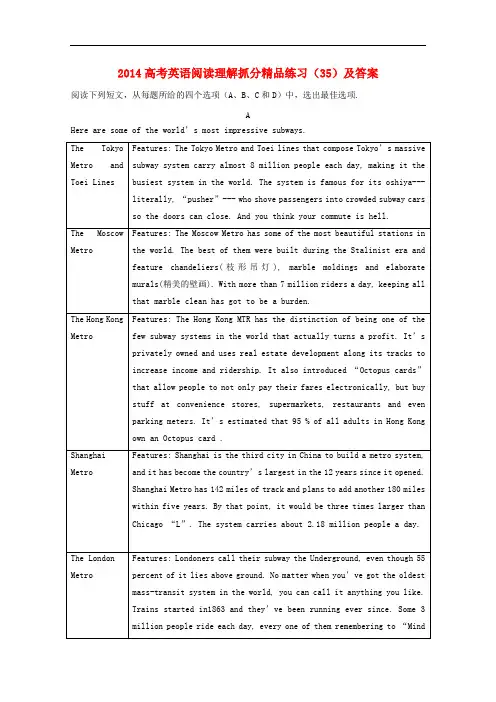
2014高考英语阅读理解抓分精品练习(35)及答案阅读下列短文,从每题所给的四个选项(A、B、C和D)中,选出最佳选项.AHere are some of the world’s most impressive subways.the gap”.1. Which one can provide the riders some wonderful decorations at the stations?A. The Tokyo Metro and Toei LinesB. The Moscow MetroC. The London MetroD. The Hong Kong MTR2. ________ is done with the purpose of making money.A. The Tokyo Metro and Toei LinesB. The Moscow MetroC. The London MetroD. The Hong Kong MTR3. We can learn from the passage that Shanghai Metro ________.A. carries the most people each dayB. is the world’s largestC. may be larger than the Chicago “L” in the futureD. is the busiest in the world4. How many subways carry more than 5 million people per day?A. 2B. 3C. 4D. 5参考答案1. B。
文中只介绍了莫斯科地铁有吊灯、壁画等一些精美的装饰,其余未提及。
2. D。
在对香港地铁的介绍中提到了turns a profit,意思是赚钱。
3. C。
在对上海地铁的介绍中提到了4. A。

metro,subway和underground
metro是个名词,它的意思是“ 地铁,地下铁路”,其复数形式为metros。
the Metro是巴黎和华盛顿市的地铁名称。
subway是个名词,其含义为“ 地铁,地铁交通;(穿越马路等的)地下人行道”,其复数形式为subways。
在北美英语中,通常用subway表示“地铁”,说英国英语的人指美国城市的地铁亦用subway,而指其他欧洲国家的地铁则用metro。
underground既可以是名词,也可以是形容词,还可以是副词。
当其为名词时,意思是“地铁”,通常在英国英语中,人们会使用underground来表示地铁。
当其为副词时,意思是“地下;地面下;秘密地,暗中”。
当其为形容词时,意思是“地下的;秘密的;非法的”。
2014届高考英语二轮复习阅读理解强化训练70i.、阅读理解(本大题共4小题,共0分)A1.C(2013湖北卷)We’ve reached a strange—some would say unusual—point. While fighting world hunger continues to be the matter of vital importance according to a recent report from the World Health Organization (WHO), more people now die from being overweight, or say, from being extremely fat, than from being underweight. It’s the good life that’s more likely to kill us these days.Worse, nearly l8 million children under the age of five around the world are estimated to be overweight. What’s going on?We really don’t have many excuses for our weight problems. The dangers of the problem have been drilled into us by public-health campaigns since 2001 and the message is getting through—up to a point.In the 1970s, Finland, for example, had the highest rate of heart disease in the world and being overweight was its main cause. Not any more. A public-health campaign has greatly reduced the number of heart disease deaths by 80 per cent over the past three decades.Maybe that explains why the percentage of people in Finland taking diet pills doubled between 2001 and 2005, and doctors even offer surgery of removing fat inside and change the shape of the body. That has become a sort of fashion. No wonder it ranks as the world’s most body-conscious country.We know what we should be doing to lose weight—but actually doing it is another matter. By far the most popular excuse is not taking enough exercise. More than half of us admit we lack willpower.Others blame good food. They say: it’s just too inviting and it makes them overeat. Still others lay the blame on the Americans, complaining that pounds have piled on thanks to eating too much American-style fast food.Some also blame their parents—their genes. But unfortunately, the parents are wronged because they’re normal in shape, or rather slim.It’s a similar story around the world, although people are relatively unlikely to have tried to lose weight. Parents are eager to see their kids shape up. Do asI say—not as I do.59. What is the “strange” point mentioned in the first sentence?A. The good life is a greater risk than the bad life.B. Starvation is taking more people’s lives in the world.C. WHO report shows people’s unawareness of food safety.D. Overweight issue remains unresolved despite WHO’s efforts.60. Why does the author think that people have no excuse for being overweight?A. A lot of effective diet pills are available.B. Body image has nothing to do with good food.C. They have been made fully aware of its dangers.D. There are too many overweight people in the world.61. The example of Finland is used to illustrate ______.A. the cause of heart diseaseB. the fashion of body shapingC. the effectiveness of a campaignD. the history of a body-conscious country62. Which would be the best title for the passage?A. Actions or Excuses?B. Overweight or Underweight?C. WHO in a DilemmaD. No Longer Dying of Hunger【答案解析】C篇【文章大意】肥胖现在成了一个社会问题,给人们带来很多严重危害。

2014年第86届奥斯卡获奖影片名单完整版
美国时间2014年3月2日早上已在好莱坞高地中心杜比数字影院举行,美国广播公司将进行实况直播,本届奥斯卡由美国著名脱口秀主持人Ellen DeGeneres主持,奥斯卡还没开始,已引起全世界影迷强烈关注。
最佳影片《为奴十二年》
最佳导演阿方索·卡隆
最佳男主角马修·麦康纳
最佳女主角凯特·布兰切特
最佳男配角杰瑞德·莱托
最佳女配角露皮塔·尼永奥
最佳动画长片《冰雪奇缘》
最佳外语片《绝美之城》
最佳原创剧本《她》
最佳改编剧本《为奴十二年》
最佳配乐《地心引力》
最佳原创歌曲《
最佳视觉效果《地心引力》
最佳音响效果《地心引力》
最佳音效剪辑格伦·弗里曼托
最佳电影剪辑阿方索·卡隆
最佳艺术指导凯瑟琳·马丁、贝弗利·邓恩最佳服装设计《了不起的盖茨比》
最佳摄影《地心引力》
最佳化妆与发型《达拉斯买家俱乐部》
最佳真人短片《氦》
最佳动画短片《哈布洛先生》
最佳纪录长片《离巨星二十英尺》
最佳纪录短片《。
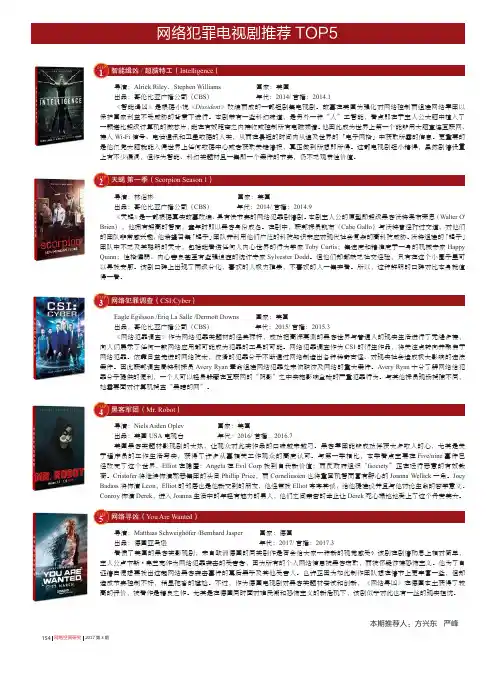
154网络空间研究2017第3期网络犯罪电视剧推荐TOP5本期推荐人:方兴东 严峰导演:Alrick Riley 、Stephen Williams 国家:美国出品:哥伦比亚广播公司(CBS ) 年代:2014/首播:2014.1《智能缉凶》是根据小说《Dissident 》改编而成的一部短剧集电视剧。
故事在美国为强化对网络控制而组建网络军团以保护国家利益不受威胁的背景下进行。
本剧带有一些科幻味道,是另外一种“人”工智能,看点即在于主人公大脑中植入了一颗堪比超级计算机的微芯片,能在有效距离之内接收或控制所有电磁频谱。
他因此成为世界上第一个能够用大脑直连互联网、接入Wi-Fi 信号、电话通讯和卫星数据的人类,从而在最短的时间内从遍及世界的「电子网格」中获取所需的信息。
更重要的是他仅凭大脑就能入侵世界上任何数据中心或者获取关键情报,真正做到所想即所得。
这部电视剧短小精悍,虽然剧情设置上有不少漏洞,但作为智能、科幻类题材且一集即一个案件的节奏,仍不乏观赏性价值。
导演:林诣彬 国家:美国出品:哥伦比亚广播公司(CBS ) 年代:2014/首播:2014.9《天蝎》是一部根据真实故事改编、具有快节奏的网络犯罪剧情剧。
本剧主人公的原型即超级黑客沃特·奥布莱恩(Walter O' Brien ),他拥有超高的智商,童年时即以黑客身份成名。
在剧中,联邦探员凯布(Cabe Gallo )与沃特曾经打过交道,对他们的团队非常感兴趣,他希望召集「蝎子」团队并利用他们广泛的科技知识来应对现代社会复杂的高科技威胁。
沃特组建的「蝎子」团队中不乏及其聪明的天才,包括能看透任何人内心世界的行为学家Toby Curtis ;集速度和精准度于一身的机械专家Happy Quinn ;性格懦弱、内心善良甚至有些强迫症的统计专家Sylvester Dodd 得一看。
Eagle Egilsson /Eriq La Salle /Dermott Downs 国家:美国出品:哥伦比亚广播公司(CBS ) 年代:2015/首播:2015.3向人们展示了任何一款网络应用都可能成为犯罪的工具的可能。
2015英语专业四级真题及答案解析TEST FOR ENGLISH MAJORS (2015 -GRADE FOUR-PART I DICTATIONPART II LISTENING COMPREHENSIONSECTION A CONVERSATIONSConversation one1. Why is the trip to Mars a one-way trip?A. The return trip is too expensive.B. There is no technology to get people back.C. People don’t want to return.D. The return trip is too risky.2. According to the man, what is more important for those recruits?A. Intelligence.B. Health.C. Skills.D. Calmness.3. What is the last part of the conversation about?A. The kind of people suitable for the trip.B. Interests and hobbies of the speakers.C. Recruitment of people for the trip.D. Preparation for the trip to Mars.Conversation Two4. What is showrooming?A. Going to the high street.B. Visiting everyday shops.C. Buying things like electrical goods.D. Visiting shops and buying online.5. According to the conversation, the man had bought all the following things online EXCEPTA. shoesB. CDsC. cameraD. food6. According to the conversation, the percentage of people who showroomed while Christmas shopping wasA. 3%B. 33%C. 42%D. 24%7. One reason for people to showroom is that theyA. want to know more about pricingB. can return the product laterC. want to see the real thing firstD. can bargain for a lower shop priceConversation Three8. What is the conversation mainly about?A. How to avoid clashes of exams.B. How to schedule exams.C. How to use the faculty lounge.D. How to choose the courses.9. What does the student have to do first in order to take the exams?A. To choose a date on the draft schedule.B. To find the information on the bulletin board.C. To draw up the final schedule.D. To arrange an invigilator.10. According to the conversation, the Dean willA. sign the sheet in the faculty loungeB. take care of the bulletin boardC. consult the studentsD. finalize the exam scheduleSECTION B PASSAGESPassage One11. Which of the following cities has the oldest Chinatown in North America?A. New York.B. San Francisco.C. Boston.D. San Diego.12. The Chinatown in San Francisco attracts tourists a year.A. 20 ,000B. 100 ,000C. 7 millionD. 17 million13. Where can tourists see the fish markets?A. In Stockton Street.B. In Grant Avenue.C. In Portsmouth Square.D. In Bush Street.Passage Two14. Which of the following is NOT mentioned in the passage?A. Obesity can damage one’s health.B. Obesity is a growing problem all over the world.C. Obesity is directly related to one’s habit.D. Obesity has affected both boys and girls.15. The purpose of the three-year study is to .A. find out why some children find it difficult to go to sleepB. learn more about the link between sleep and weightC. identify the ways parents reduce their kids’ weightD. see if there is difference in sleep patterns over the period16. According to the study, the daily healthy sleep time for the 3rd to 6th graders should be around ___ hours.A. 8B. 9C. 10D. 1117. According to the passage, obesity is most likely related to __ .A. sleep timeB. genderC. raceD. parentsPassage Three18. According to a number of students, __ __ is the main factor for early-age smoking.A. genderB. personalityC. environmentD. money19. Which of the following statements is CORRECT?A. Very few continue smoking throughout their teenage years.B. Most early-age smokers soon stop experimenting.C. Some early-age smokers never go beyond experimenting.D. Children quickly become regular smokers by carrying cigarettes.20. All the following are features of smokers EXCEPT ___ .A. strong peer influenceB. low sense of achievementC. high sense of rebellionD. close family relationshipSECTION C NEWS BROADCASTNews Item 121. Why were some children offered only fruit and milk for lunch?A. The school stopped providing school lunch.B. Their parents failed to pay for school lunch.C. Some parents preferred fruit and milk for lunch.D. These children chose to have something different.22. How did parents react to the school’s way of handling the situation?A. They were upsetB. They were furious.C. They were surprised.D. They were sad.News Item 223. According to the news, what is the main advantage of the digital key?A. Guests can pay without going to the front desk.B. Guests can go direct to their rooms.C. Guests can check out any time.D. Guests can make room reservations.24. The hotel company intends to have the system in ___ of its hotels in the next three months.A. 2B. 3C. 100D. 150News Item 325. According to the court ruling, Shrien Dewani _ ___ .A. will return to the U.K. for medical treatmentB. will remain in South Africa for medical treatmentC. will stand trial in South Africa once proved fitD. will be extradited even if he is unfit to stand trial26. What was Dewani accused of?A. Having his wife killed.B. Killing his wife in the U.K.C. Being involved in a taxi accident.D. Hiring a crew of hit men.News Item 427. The U.N. new vote would allow all the following EXCEPT ___ .A. the use of force by European Union troopsB. the suspension of an existing arms embargoC. the extension of U.N. peacekeeping missionD. the ban on travel and freeze of assetsNews Item 528. What is the news mainly about?A. Causes of early death in Russia.B. Behavior of alcoholics.C. Causes of alcohol poisoning.D. Number of death over 10 years.News Item 629. The total investment in film-making in Britain in 2012 was __ __ .A. £945 millionB. £1.07 billionC. £500,000D. £87,00030. Hollywood studios prefer to make films in Britain because ___ .A. The UK is a good film locationB. The cast usually comes from BritainC. Hollywood emphasizes qualityD. Production cost can be reducedPART III CLOZEElectricity is such a part of our everyday lives and so much taken for granted nowadays 31 ___ we rarely think twice when we switch on the light or turn on the TV set. At night, roads are brightly lit, enabling people and32 ___ to move freely. Neon lighting used in advertising has become part of the 33 ___ of every modern city. In the home, many 34 ___ devices are powered by electricity. 35 ___ when we turn off the bedside lamp and are 36 ___ asleep, electricity is working for us, 37 ___ ourrefrigerators, heating our water, or keeping our rooms air-conditioned. Every day, trains, buses and subways take us to and from work. We rarely 38 ___ to consider why or how they run——39 ___ so mething goes wrong.In the summer of 1959, something 40 ___ go wrong with the power-plant that provided New York with electricity. For a great many hours, life came almost to a 41 ___. Trains refused to move and the people in them sat in the dark, 42 ___ to do anything; lifts stopped working, so that 43 ___ you were lucky enough not to be 44. ___ between two floors, you had the unpleasant task of finding your way down 45 ___ of stairs. Famous streets like Broadway and Fifth Avenue in a(n) 46 ___ became as gloomy and uninviting 47 ___ the most remote back streets. People were afraid to leave their houses, 48 ___ . although the police had been ordered to 49 ___ in case of emergency, they were just as confused and50 ___ as anybody else.31. A. that B. thus C. as D. so32. A. car B. truck C. traffic D. pedestrians33. A. appearance B. character C. distinction D. surface34. A. money-saving B. time-saving C. energy-saving D. labor-saving35. A. Only B. Rarely C. Even D. Frequently36. A. fast B. quite C. closely D. quickly37. A. moving B. starting C. repairing D. driving38. A. trouble B. bother C. hesitate D. remember39. A. when B. if C. until D. after40. A. did B. would C. could D. Should41. A. pause B. terminal C. breakdown D. standstill42. A. incompetent B. powerless C. hesitant D. helpless43. A. although B. when C. as D. even if44. A. trapped B. placed C. positioned D. locked45. A. steps B. levels C. flights D. floors46. A. time B. instant C. point D. minute47. A. like B. than C. for D. as48. A. for B. and C. but D. or49. A. stand aside B. stand down C. standby D. stand in50. A. aimless B. helpless C. unfocused D. undecidedPART IV GRAMMAR AND VOCABULARY51. When you have finished with that book, don’t forget to put it back on the shelf, ____?A. don’t youB. do youC. will youD. won’t you52. Mary is __ ___ hardworking than her sister, but she failed in the exam.A. no lessB. no moreC. not lessD. not so53. Which of the following statements is INCORRECT?A. Only one out of six were present at the meeting.B. Ten dollars was stolen from the cash register.C. Either my sister or my brother is wrong.D. Five miles seem like a long walk to me.54. Which of the italicized parts expresses a future tense?A. My friend teaches chemistry in a school.B. I’ll give it to you after I return.C. What is the matter with you?D. London stands on the River Thames.55. It is not so much the language ____ the cultural background that makes the film difficult to understand.A. butB. norC. likeD. as56. There is no doubt ____ the committee has made the right decision on the housing project.A. whyB. thatC. whetherD. when57. All the President’s Men ____ one of the important books for scholars who study the Watergate Scandal.A. remainsB. remainedC. remainD. is remaining58. If you explained the situation to your lawyer, he ___ __ able to advise you much better thanI can.A. will beB. wasC. would beD. were59. Which of the following is a stative verb (静态动词)?A. DrinkB. CloseC. RainD. Belong60. Which of the following italicized parts indicates a subject-verb relation?A. The man has a large family to support.B. She had no wish to quarrel with her brother.C. He was the last guest to leave.D. Mary needs a friend to talk to.61. The following are all correct responses to “Who told the news to the teacher?” EXCEPT __ ___?A. Bob did itB. Bob did soC. Bob did thatD. Bob did.62. Which of the following is INCORRECT?A. Another two girlsB. Few wordsC. This workD. A bit of flowers63. Which of the following italicized words does NOT indicate willingness?A. What will you do when you graduate?B. They will be home by now.C. Who will go with me?D. Why will you go there alone?64. When one has good health, ___ should feel fortunateA. youB. sheC. heD. we65. There ____ nothing more for discussion, the meeting came to an end half an hour earlier.A. to beB. to have beenC. beD. being66. Two of her brothers were _ __ during the Second World War.A. called upB. called onC. called forD. called out67. Bottles from this region sell __ ____ at about $50 a case.A. entirelyB. totallyC. wholesaleD. together68. The product contains no ____ colours, flavours, or preservatives.A. fakeB. artificialC. falseD. wrong69. Davis accepted the defeat in the semi-final with good grace. The underlined part is closest in meaning to ___ ___.A. cheerfullyB. wholeheartedlyC. politelyD. quietly70. __ ___ and business leaders were delighted at the decision to hold the national motor fair inthe city.A. CivilB. CivilizedC. CivilianD. Civic71. The city council is planning a huge road-building programme to ease congestion. Theunderlined part means __ ___.A. calmB. relieveC. comfortD. still72. His unfortunate appearance was offset by an attractive personality. The underlined partmeans all the following EXCEPT ____.A. improvedB. made up forC. balancedD. compensated for73. The doctor said that the gash in his check required stitches. The underlined part means ____.A. lumpB. depressionC. swellingD. cut74. During the economic crisis, they had to cut back production and __ ___ workers.A. lay offB. lay intoC. lay downD. lay aside75. The university consistently receives a high __ ____ for the quality of its teaching and research.A. standardB. evaluationC. ratingD. comment76. To mark its one hundredth anniversary, the university held a series of activities includingconferences, film shows, etc. The underlined part means __ ___.A. signifyB. celebrateC. symbolizeD. suggest77. His fertile mind keeps turning out new ideas. The underlined part means _ ____.A. abundantB. unbelievableC. productiveD. generative78. The local news paper has a ___ __ of 100,000 copies a day.A. spreadB. circulationC. motionD. flow79. These issues were discussed at length during the meeting. The underlined part means _____.A. eventuallyB. subsequentlyC. lastlyD. fully80. A couple of young people were giving out leaflets in front of the department store. Theunderlined part means __ ___.A. distributingB. handlingC. dividingD. arrangingPART V READING COMPREHENSIONText AInundated by more information than we can possibly hold in our head, we're increasingly handing off the job of remembering to search engines and smart phones. Google is even reportedly working on eyeglasses that could one day recognize faces and supply details about whoever you're looking at. But new research shows that outsourcing our memory – and expecting that information will be continually and instantaneously available --is changing our cognitive habits.Research conducted by Betsy Sparrow, an assistant professor of psychology at Columbia University, has identified three new realities about how we process information in the Internet age. First, her experiments showed that when we don't know the answer to a question, we now think about where we can find the nearest Web connection instead of the subject of the question itself. A second revelation is that when we expect to be able to find information again later on, we don't remember it as well as when we think it might become unavailable. And then there is the researchers' final observation: the expectation that we'll he able to locate inf orination down the line leads us to form a memory not of the fact itself but of where we'II be able to find it.But this handoff comes with a downside. Skills like critical thinking and analysis must develop in the context of facts: we need something to think and reason about, after all. And these facts can't be Googled as we go;they need to be stored in the original hard drive, our long-term memory. Especially in the case of children, "factual knowledge must precede skill," says Daniel Willingham, a professor of psychology, at the University of Virginia -- meaning that the days of drilling the multiplication table and memorizing the names of the Presidents aren't over quite yet. Adults, too, need to recruit a supply of stored knowledge in order to situate and evaluate new information they encounter. You can't Google context.Last, there's the possibility, increasingly terrifying to contemplate, that our machines fail us. As Sparrow puts it, "The experience of losing our Internet connection becomes more and more like losing a friend." If you're going to keep your memory on your smart phone, better make sure it's fully charged.81. Google’s eyeglasses are supposed to _ __.[A]improve our memory[B]function like memory[C]help us see faces better[D]work like smart phones82. According to the passage, “cognitive habits” refers to _ __.[A] how we deal with information[B] functions of human memory[C] the amount of information[D] the availability of information83. Which of the following statements about Sparrow’s research is CORRECT?[A] We remember people and things as much as before.[B] We remember more Internet connections than before.[C] We pay equal attention to location and content of information.[D]We tend to remember location rather than the core of facts.84. What does the author mean by “context”?[A]It refers to long-term memory.[B]It refers to a new situation.[C]It refers to a store of knowledge.[D]It refers to the search engine.85. What is the implied message of the author?[A]Web connections aid our memory.[B]People differ in what to remember.[C]People keep memory on smart phones.[D]People need to exercise their memory.Text BI was a second-year medical student at the university, and was on my second day of rounds at a nearby hospital. My university's philosophy was to get students seeing patients early in their education. Nice idea,but it overlooked one detail:second-year students know next to nothing about medicine.Assigned to my team that day was an attending - a senior faculty member who was there mostly to make patients feel they weren't in the hands of amateurs. Many attendings were researchers who didn't have much recent hospital experience. Mine was actually an arthritis specialist. Also along was a resident (the real boss, with a staggering mastery of medicine, at least to a rookie like myself). In addition there were two interns(住院实习医生). These guys were just as green as I was,but in a scarier way: they had recently graduated from the medical school, so they were technically MDs.I began the day at 6:30 am. An intern and I did a quick check of our eight patients; later, wewere to present our findings to the resident and then to the attending. I had three patients and the intern had the other five - piece of cake.But when I arrived in the room of 71-year-old Mr. Adams,he was sitting up in bed, sweating heavily and panting (喘气). He'd just had a hip operation and looked terrible. I listened to his lungs with my stethoscope, but they sounded clear. Next I checked the logof his vital signs and saw that his respiration and heart rate had been climbing, but his temperature was steady. It didn't seem like heart failure, nor did it appear to be pneumonia. So I asked Mr. Adams what he thought was going on."It's really hot in here, Doc," he replied.So I attributed his condition to the stuffy room and told him the rest of the team would return in a few hours. He smiled and feebly waved goodbye.At 8:40 am., during our team meeting, "Code Blue Room 307!" blared from the loudspeaker.I froze.That was Mr. Adams's room.When we arrived, he was motionless.The autopsy (尸体解剖) later found Mr. Adams had suffered a massive pulmonary embolism (肺部栓塞). A blood clot had formed in his leg, worked its way to his lungs, and cut his breathing capacity in half. His symptoms had been textbook: heavy perspiration and shortness of breath despite clear lungs. The only thing was: I hadn't read that chapter in the textbook yet. And I was too scared, insecure, and proud to ask a real doctor for help.This mistake has haunted me for nearly 30 years, but what's particularly frustrating is that the same medical education system persists. Who knows how many people have died or suffered harm at the hands of students as naive as I, and how many more will?86. Why was the author doing rounds in a hospital?[A]He himself wanted to have practice.[B]Students of all majors had to do so.[C]It was part of his medical training.[D]He was on a research team.87. We learn that the author’s team members had __.[A]much practical experience[B]adequate knowledge[C]long been working there [D]some professional deficiency88. While the author was examining Mr. Adams, all the following symptoms caught hisattention EXCEPT __ __.[A]moving difficulty [B]steady temperature[C]faster heart rate [D]breathing problem89. “His symptoms had been textbook” means that his symptoms were _ ___.[A]part of the textbook[B]no longer in the textbook[C]recently included in the textbook[D]explained in the textbook90. At the end of the passage, the author expresses __ __ about the medical education system.[A]optimism[B]hesitation[C]concern[D]supportTEXT CThe war on smoking, now five decades old and counting, is one of the nation's greatest public health success stories - but not for everyone.As a whole, the country has made amazing progress. In 1964, four in ten adults in the US smoked; today fewer than two in ten do. But some states - Kentucky, South Dakota and Alabama to name just a few - seem to have missed the message that smoking is deadly.Their failure is the greatest disappointment in an effort to save lives that was started on Jan. 11, 1964, by the first Surgeon General's Report on Smoking and Health. Its finding that smoking is a cause of lung cancer and other diseases was major news then. The hazards of smoking were just starting to emerge.The report led to cigarette warning labels, a ban on TV ads and eventually an anti-smoking movement that shifted the nation's attitude on smoking. Then, smokers were cool. Today, many are outcasts, rejected by restaurants, bars, public buildings and even their own workplaces. Millions of lives have been saved.The formula for success is no longer guesswork: Adopt tough warning labels, air public service ads, fund smoking cessation programs and impose smoke-free laws. But the surest way to prevent smoking, particularly among price-sensitive teens, is to raise taxes. If you can stop them from smoking, you've won the war. Few people start smoking after turning 19.The real-life evidence of taxing power is powerful. The 10 states with the lowest adult smoking rates slap an average tax of $2.42 on every pack -- three times the average tax in the states with the highest smoking rates.New York has the highest cigarette tax in the country, at $4.35 per pack, and just 12 percent of teens smoke, far below the national average of 18 percent. Compare that with Kentucky, where taxes are low (60 cents), smoking restrictions are weak and the teen smoking rate is double New York's. Other low-tax states have similarly dismal records.Enemies of high tobacco taxes cling to the tired argument that they fall disproportionately on the poor. True, but so do the deadly effects of smoking, far worse than a tax. The effect of the taxes is amplified further when the revenue is used to fund initiatives that help smokers quit or persuade teens not to start.Anti-smoking forces have plenty to celebrate this week, having helped avoid 8 million premature deaths in the past 50 years. But as long as 3,000 adolescents and teens take their first puff each day, the war is not won.91. What does "counting" mean in the context?[A] Continuing. [B] Including.[C] Calculating. [D] Relying on.92. According to the context, "Their failure" refers to__ _____.[A] those adults who continue to smoke[B] those states that missed the message[C] findings of the report[D] hazards of smoking93. The following are all efforts that led to the change of attitude on smoking EXCEPT_____.[A] rejecting by the public[B] cigarette warning labels[C] anti-smoking campaigns[D] anti-smoking legislation94. According to the author, raising tax on cigarettes___ ____.[A] is unfair to the poor [B] is an effective measure[C] increases public revenue [D] fails to solve the problem95. What is the passage mainly about?[A] How to stage anti-smoking campaigns.[B] The effects of the report on smoking and health.[C] Tax as the surest path to cut smoking.[D] The efforts to cut down on teenage smoking.TEXT DAttachment Parenting is not Indulgent Parenting. Attachment parents do not "spoil" their children. Spoiling is done when a child is given everything that they want regardless of what they need and regardless of what is practical. Indulgent parents give toys for tantrums(发脾气), ice cream for breakfast. Attachment parents don't give their children everything that they want, they give their children everything that they need. Attachment parents believe that love and comfort are free and necessary. Not sweets or toys.Attachment Parenting is not "afraid of tears" parenting. Our kids cry. The difference is that we understand that tantrums and tears come from emotions and not manipulation. And ourchildren understand this too, They cry and have tantrums sometimes, of course. But they do this because their emotions are so overwhelming that they need to get it out. They do not expect to be "rewarded" for their strong negative emotions; they simply expect that we will listen. We pick up our babies when they cry, and we respond to the tears of our older children because we believefirmly that comfort is free, love is free, and that when a child has need for comfort and love, it is our job to provide those things. We are not afraid of tears. We don't avoid them. We hold our children through them and teach them that when they are hurt or frustrated we are here to comfort them and help them work through their emotions.Attachment Parenting is not Clingy Parenting. I do not cling to my children, In feet, I'm pretty free-range. As soon as they can move they usually move away from me and let me set up a chase as they crawl, run, skip and hop on their merry way to explore the world, Sure, I carry them and hug them and chase them and kiss them and rock them and sleep with them, But this is not me following them everywhere and pulling them back to me. This is me being a home base. The "attachment" comes from their being allowed to attach to us, not from us attaching to them like parental leeches.Attachment Parenting is not Selfish Parenting. It is also not selfless parenting, We are not doing it for us, and we are not doing it to torment ourselves,Attachment parenting is not Helicopter Parenting. I don't hover, I supervise, I follow, I teach, I demonstrate, I explain. I don't slap curious hands away, I show how to do things safely, I let my child do the things that my child wishes to do, first with help and then with supervision and finally with trust, I don't insist that my 23 month old hold my hand when we walk on the sidewalk because I know that I can recall him with my voice because he trusts me to allow him to explore and he trusts me to explain when something is dangerous and to help him satisfy his curiosities safely.Most of the negative things that I hear about "attachment parents" are completely off-base and describe something that is entirely unlike Attachment Parenting. Attachment Parenting ischild-centric and focuses on the needs of the child. Children need structure, rules, and boundaries. Attachment Parents simply believe that the child and the parent are allies, not adversaries, And that children are taught, not trained.96. What makes attachment parents different from indulgent parents is that they .A. show more love to their childrenB. think love is more importantC. prefer both love and toys in parentingD. dislike ice cream or sweets97. According to the author, what should parents do when their kids cry?A. Providing comfort and love.B. Trying to stop kids crying.C. Holding them till they stop.D. Rewarding kids with toys.98. What does “free-range” mean according to the passage?A. Fond of providing a home base.B. Ready to play games with my kids.C. Curious to watch what games they play.D. Willing to give kids freedom of movement.99. Which of the following is NOT attachment parenting?A. Fostering their curiosity.B. Standing by and protecting.C. Showing them how things are done.D. Helping them do the right thing.100. What does the passage mainly discuss?A. How to foster love in children.B. How to build child confidence.C. Different types of parenting.D. Parent-child relationships.答案解析:PART I DICTATIONMale and Female Roles in MarriageIn the traditional marriage, the man worked to earn money for the family. / The woman stayed at home to care for the children and her husband. / In recent years, many couples continue to have a traditional relationship of this kind. / Some people are happy with it. But others think differently. / There are two major differences in male and female roles now. / One is that both men and women have many more choices. / They may choose to marry or stay single. / They may choose to work or to stay at home. / A second difference is that, within marriage many decisions are shared. / If a couple has children, the man may take care of them /some of the time, all of the time or not at all. / The woman may want to stay at home / or she may want to go to work. / Men and women now decide these things together in a marriage.听写指导:由题目可以判定,文章围绕男性和女性在婚姻中的角色展开,第一段介绍了传统婚姻中两性的角色,而第二段对当今社会中两性在婚姻中的角色进行了具体的论述。
东方卫视子午线2014节目表【实用版】目录1.东方卫视子午线 2014 节目表简介2.2014 年东方卫视子午线的主要节目3.节目特点和亮点4.观众反馈和影响正文东方卫视子午线 2014 节目表是一款集合了东方卫视 2014 年各类节目的时间表。
东方卫视作为中国知名的地方卫视之一,其子午线节目一直以来都备受观众喜爱。
在 2014 年,东方卫视子午线推出了一系列精彩纷呈的节目,涵盖了新闻、访谈、娱乐、纪实等多个领域。
2014 年东方卫视子午线的主要节目有:1.《东方新闻》:每天准时为您报道世界各地的新闻事件,聚焦热点,深入解析。
2.《星尚》:一档集时尚、美容、生活于一体的时尚生活节目,引领都市潮流。
3.《极限挑战》:一档挑战极限、展示团队精神的真人秀节目,由多位明星参与,备受关注。
4.《中国梦之声》:一档大型音乐选秀节目,选拔优秀的音乐人才,为观众带来视听盛宴。
5.《笑傲江湖》:一档以相声、小品为主的喜剧类节目,邀请众多喜剧名家登台献艺。
这些节目在 2014 年的东方卫视子午线中各具特色,亮点频出。
新闻类节目及时报道国内外热点事件,让观众掌握最新资讯;时尚生活类节目为观众提供潮流资讯,关注生活品质;真人秀节目则挑战极限,展示团队精神,吸引了大量观众的目光;音乐选秀节目则为有音乐梦想的年轻人提供了展示才华的舞台;喜剧类节目则让观众在欢笑中度过愉快的时光。
这些节目在播出后,得到了观众的广泛好评和喜爱。
观众纷纷表示,这些节目内容丰富、形式多样,满足了不同年龄层、不同兴趣的观众需求。
同时,这些节目在传播正能量、弘扬社会主义核心价值观方面也起到了积极作用。
总之,2014 年的东方卫视子午线节目表为观众带来了丰富多彩的电视节目,满足了观众的收视需求。
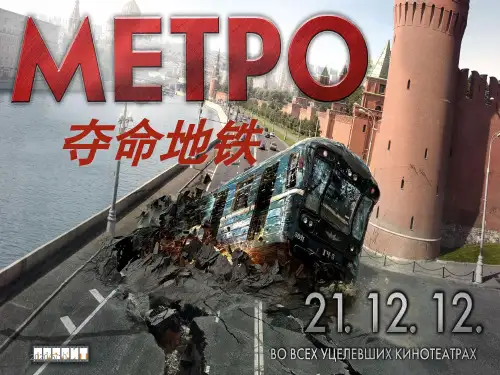
The subway,also known as the underground or metro,is a crucial part of urban transportation in many major cities around the world.It offers a fast,efficient,and often environmentally friendly way to navigate through congested city centers.Heres a comprehensive essay on the topic of subways,highlighting their various aspects:Introduction to SubwaysSubways are rapid transit systems that operate mostly underground,providing a convenient mode of transportation for millions of people daily.They are characterized by their high frequency of service,which allows for quick and punctual travel within a city.History of SubwaysThe first subway system was the London Underground,which began operations in1863. Since then,many other cities have developed their own underground rail networks.The New York City Subway,for instance,is one of the largest and most extensive in the world,with its first line opening in1904.Benefits of Subways1.Efficiency:Subways can transport a large number of passengers quickly and efficiently, reducing traffic congestion on city streets.2.Reliability:Being underground,subways are less affected by weather conditions, making them a reliable mode of transportation.3.Economical:Compared to other forms of public transport,subways can be more costeffective for both the operators and the passengers.4.Environmental Impact:Subways produce fewer emissions than cars,contributing to a reduction in air pollution.Challenges Faced by Subways1.Cost of Construction:Building a subway system is a significant financial undertaking, often requiring substantial public investment.2.Maintenance:Subways require regular maintenance to ensure safety and efficiency, which can be costly.3.Crowding:During peak hours,subways can become extremely crowded,leading to a less comfortable travel experience.4.Safety Concerns:Subways need to be secure to prevent accidents and ensure passenger safety.Subway Systems Around the WorldTokyo:Known for its punctuality and cleanliness,Tokyos subway system is a model of efficiency.Paris:The Paris Métro is famous for its art nouveau entrances and extensive coverage of the city.Moscow:The Moscow Metro is renowned for its opulent stations,often referred to as the Peoples Palaces.Future of SubwaysWith urban populations growing,the demand for efficient public transportation is increasing.Subways are expected to continue expanding and integrating with other forms of transport,such as buses and trams,to create comprehensive transportation networks. ConclusionSubways play a vital role in the daily lives of city dwellers,offering a quick and practical way to move around.Despite the challenges they face,subways remain an essential part of urban infrastructure,and their development is likely to continue as cities seek to improve mobility and reduce environmental impact.Personal Experience with SubwaysAs a commuter,I have personally experienced the benefits and drawbacks of using subways.The speed and convenience of the subway have saved me time,but I have also witnessed the challenges of overcrowding during rush hours.Despite these issues,I appreciate the role subways play in connecting people and places within the city.。
湖南省怀化市2014届高三英语3月第一次模拟考试题牛津译林版PartⅠListening Comprehension (30 marks)Section A (22.5 marks)Directions: In this section, you will hear six conversations between two speakers. For each conversation, there are several questions and each question is followed by three choices marked A, B and C. Listen carefully and then choose the best answer for each question.You will hear each conversation TWICE.Example:Where are the two speakers going to meet?A. At home.B. In a shop.C. In a restaurant.The answer is C.Conversation 11. How long does the next train take to get to London?A. One hour.B. One hour and a half.C. Two hours.2. How much do you need to pay if you buy two round tickets?A. $60.B. $85.C. $110.Conversation 23. Why does the woman think that New York is the only place to live?A. It has a large population.B. It offers a colorful and exciting life.C. It’s interesting and quiet.4. Where does the man most probably live?A. In the countryside.B. In a big city.C. In America. Conversation 35. What does the man make an appointment with Mrs. Green for?A. An examination.B. A survey.C. An interview.6. What is the probable relationship between Mrs. Green and the woman?A. Boss and secretary.B. Friends.C. Mother and daughter. Conversation 47. What did the boy talk about with his father?A. His studies in college.B. His new classmates.C. His plan to work.8. Why was his father worried?A. It won’t be easy for his son to find a job.B. His son may not pass the final exam.C. His son changes jobs so frequently.9. What did the girl suggest the boy do?A. Listen to his father.B. Talk with his mother.C. Just do what he had planned.Conversation 510. Where did the woman meet the man?A. At the Beijing bus station.B. At the Beijing train station.C. At the woman’s apartment.11. How long was the man’s trip?A. Two hours.B. Nine hours.C. Nineteen hours.12. Why did the man choose to take a bus?A. To save money.B. To be environmentally friendly.C. To enjoy the country view.Conversation 613. Where are they probably talking now?A. In an office.B. In the street.C. In a reading room.14. Why does the woman go there?A. She wanted to further her study there.B. She tried to find a job.C. She tried to make friends with the man.15. What didn’t the man ask about the woman?A. Her major.B. Her spoken English.C. Her family.Section B (7.5 marks)Directions: In this section, you will hear a short passage. Listen carefully and then fill in the numbered blanks with the information you have heard. Fill in each blank with NO MOREPart ⅡLanguage Knowledge (45 marks)Section A (15 marks)Directions: Beneath each of the following sentences there are four choices marked A, B, C and D. Choose the one answer that best completes the sentence.21. He is of confidence, , in my opinion, is most important in society.A. howB. thatC. whatD. which22. — Tom! I forgot to bring my notebook this morning.—Don’t worry! I it for you.A. will getB. getsC. am gettingD. am going to get23. Microblogs experienced rapid growth in 2013 in China, with its operators, users and visitorsseveral times.A. increaseB. increasedC. increasingD. to increase24. Look at the timetable. Hurry up! Flight 9013 to Changsha off at 7:30.A. tookB. takesC. will be takenD. has taken25. Keep yourself open we can experience the great joy that friendship can bring.A. as ifB. so thatC. even thoughD. ever since26. We used to mistake that heavy objects fell faster than light .A. the onesB. thoseC. onesD. these27. By the end of last week, nearly 80 percent of the work .A. have finishedB. had been finishedC. will be finishedD. was finished28. Focused on your heart asks you to do, you’ll realize your dream one day.A. thatB. whichC. whatD. it29. Lady Gaga has put off her concerts because of the difficulties by the ongoing strikes.A. causedB. causingC. to be causedD. having caused30. Cindy, to be here at 8 o’clock.A. is sureB. is sure thatC. will be sureD. be sure31. necessary experience for my future career, I take an active part in social activities incollege.A. To gainB. GainC. GainingD. Having gained32. You get two tickets of Despicable Me Ⅱ, as I have promised .A. mayB. canC. needD. shall33. A recent survey shows that the number of children who from the countryside with theirparents nearly 320,000 in Beijing.A. comes; areB. come; isC. come; areD. comes; is34. I first met Lily five years ago. She ___ as a nurse in a hospital at the time.A. was workingB. has workedC. had been workingD. had worked35. Never to him that he could be admitted to the famous university.A. occurred itB. it did occurC. did it occurD. it occurredSection B (15 marks)Directions: Beneath each of the following sentences there are four choices marked A, B, Cand D. Choose the one answer that best completes the sentence.I’d been travelling for long hours on a lonely country road when I had a flat tyre. So I had to36 and get the tools to fix the problem. It certainly wasn’t 37doing this with a white shirt and suit on.Nightfall was approaching. Suddenly a car pulled up beside me. Aman got out and offered to 38 me. Seeing tattoos (纹身) on his arm,I became 39 as thoughts of robberies flashed through my mind. But40 I could say anything, he had already begun to take the tools tochange the 41 . While watching him, I happened to look back at his car and noticedsomeone sitting in the passenger seat. This 42 me.Then, without warning, it began to rain. He suggested that I wait in his car because my carwas unsafe. As the rain increased, I unwillingly agreed. When I settled into the back seat, awoman’s voice came from the front seat. I replied with much 43 when seeing an old womanthere. It must be his mother, I thought. To my surprise, the old woman was a neighbor of the manwho was helping me. ―Jeff insisted on stopping when he saw you 44 the tyre.‖ ―I amgrateful for his help,‖ I said. ―Me too!‖ she said with a smile. He helped drive her to see herhusband twice a week in a nursing home. She also said that he 45 at the church and taughtdisadvantaged students for free.Finally, Jeff helped me change the tyre. I tried to offer him money and of course he refused it.As we shook hands to say goodbye I apologized for my stupid 46 at the first sight of him,and this incident warned us that we shouldn’t judge people by the way they 47 .Section C (12 marks )Directions: Complete the following passage by filling in each blank with one word that bestfits the context.Why is reading so important? Joseph Addison on ce said, ―Reading is to the mind what36.A. stopB. moveC. seeD. look 37.A. difficultB. easyC. badD. polite 38.A. liftB. carryC. driveD. help 39.A. discouragedB. disappointedC. frightenedD. astonished 40.A. asB. beforeC. untilD. when 41.A. tyreB. suitC. shirtD. tools 42.A. puzzledB. embarrassedC. calmedD. concerned 43.A. fearB. reliefC. satisfactionD. delight 44.A. taking onB. fighting forC. picking outD. struggling with 45.A. volunteeredB. studiedC. grewD. performed 46.A. ignoranceB. wordsC. reactionD. comment 47. A. drove B. walked C. behavedD. lookedexercise is 48 the body.‖ I am sure you 49 have heard this quote. Reading is a great hobby, 50 makes you discover yourself. Reading good stories can help you solve some problems in your own life. Besides, reading 51 sets a good example to younger generations.Sadly, people nowadays seem to have totally lost interest in this activity. Children are busy with computer games, 52 adults use their cell phones or computers to search for information. 53 seems that people have forgotten 54 importance of reading. Anybody can use the Internet to look for information, but the sources are 55 as reliable as a book.To open a book is always beneficial! Don’t spend all your spare time on the computer screen or cell phones.Part ⅢReading Comprehension (30 marks)Directions: Read the following three passages. Each passage is followed by several questions or unfinished statements. For each of them there are four choices marked A, B, C and D. Choose the one that fits best according to the information given in the passage.AIt is generally believed that we are getting cleaned when we step under a shower. We are, but we’re also giving a home to lots of tiny little creatures we didn’t even know about. A s howerhead carries thousands of bacteria called Mycobacterium.These can cause problems like coughs and tiredness, and a general feeling of poorliness (身体不舒服). When you turn on the water, the bacteria go from the showerhead onto and into your body.This is a finding of Norman R. Pace and his team at the University of Colorado, in the US. The scientists investigated bacteria in all kinds of human environment, including showers.Pace's team looked at 45 showerheads in nine American cities. They discovered that 30 percent of them had large amounts of flying Mycobacterium.But Pace said that they pose few threats to the health.Only those with a weak immune system might need to worry.He told the New York Times that the bacteria are not as unpleasant as might be thought.He said that having a shower is no more dangerous than anything else we do in the morning.But for those who feel sick about the idea of all those microorganisms (微生物), he had some advice. Let the water run for 30 seconds before getting into the shower. Why? The number of bacteria is smaller than that when the water is just turned on. If that seems like a waste of water, he added that you could also change your showerhead every few months.However, Pace had good news too. He has also been testing the air in US subways. Apart from iron particles (粒子), which are ground off the track by the wheels of trains, subway air is fresh. The reason is that a train’s movement pumps fresh outdoor air into the tunnels.Pace explained that he wanted to understand the natural microbial environments of public places. This kind of knowledge might help discover the microbes to be used in a bioterrorist (生物恐怖分子) attack.56. From the finding of Norman R. Pace, after taking a shower, we might cough or feel tiredbecause .A. it’s easy to get a cold when taking a bathB. the showerhead carries many bacteria causing illnessC. we don’t get cleane d while showeringD. we don’t get a weak immune system57. According to the passage, which of the following is TRUE?A. Hot water could kill most of bacteria in showerheads.B. Of 45 showerheads surveyed in nine cities, 30 carried large amounts of Mycobacterium.C. Changing showerheads is the only way to avoid microorganisms.D. Shower water contains much less bacteria after being left to run for 30 seconds.58. We can learn from the third paragraph that .A. having a shower in the morning is more dangerous than at other timeB. the bacteria always threat people’s healthC. there is no reason to fear microorganisms for people with strong immune systemD. it is better to do some exercise in the morning than have a shower59. The underli ned word ―pose‖ in the third paragraph probably means ―______‖.A. causeB. avoidC. describeD. promise60. What contributes to fresh air in US subways?A. The train’s movement.B. Iron particles.C. Train wheels.D. Air conditioners on the trains.BThe younger daughter of former New York Mayor Richard White has moved her wedding from New Year’s Eve to this Thursday so her mother, who has been fighting against cancer for 11years, can take part in theceremony, a family spokesmansaid on Wednesday, Oct, 12, 2013.Elizabeth Lally White, who turns28 on Thursday, will marry SamPeterson in Spiaggia, a restaurant on North Michigan Avenue. Thereception also will be held at the restaurant, which had been previously scheduled to host the couple’s engagement party on Thursday.Lally White’s mother, Maggie, 68, was reported to have caught breast cancer in 2002. She had an operation in her leg in April and she was hospitalized twice in the weeks following the procedure for treatment of flu-like symptoms that doctors said were not related to the cancer. Maggie, who has used a walker or a wheelchair during most public appearances in recent years, is well beyond the average survival time for someone with breast cancer.―As the mayor himself has said, she had a pretty difficult summer.‖ said Jacquelyn Heard, who served Mayor White’s press secretary for years and followed him to the same international law firm that he joined after leaving office in May. ―She was not able to get around the way that she normally would do. This year, she has had quite a few setbacks and they’ve been pretty well documented. Lally White decided to reschedule the wedding so that her mom can participate in the festivities (庆祝活动).‖ Heard said. Lally Whit e is a doctoral candidate at De-Paul University and plans to work with autistic (孤独症) children, and Sam Peterson works in insurance, Heard said.Richard and Maggie White married in 1972 and had three children in addition to Lally —Nora, Patrick and Kevin. But Kevin was born with a disease and died in 1981 at 33 months.61. When was Elizabeth Lally White born?A. In 1983.B. In 1987.C. In 1985.D. In 1984.62. What can we infer from Paragraph 2?A. Maggie, 68, is recovering now.B. Maggie caught breast cancer in 2002.C. The cancer caused some flu-like symptoms on Maggie.D. Average breast cancer patients lived a life shorter than Maggie.63. Why did Lally White reschedule her wedding?A. She was afraid that her mother couldn’t participate her wedding on New Year’s Eve.B. She was eager to work with autistic children after wedding.C. Her family will move out of New York.D. Her mother will accept operation because of her disease.64. How many children did the former mayor and his wife give birth to?A. 3.B. 4.C. 5.D. 6.65. What does the passage mainly talk about?A. The political life of former Mayor.B. The brave wife of former Mayor.C. The wedding of former Mayor’s daughter.D. The family life of former Mayor.CAlthough cats may be one of the most popular pets today, little is known about how and when humans and cats set up their close relationship.The earliest evidence for human–cat interaction dates back to prehistoric Cyprus(史前塞浦路斯), where the remains of a wild cat and a human — dated 9,500 years old — were found buried together.A new study in the Proceedings of the National Academy of Sciences has confirmed the first direct evidence of a human–domestic cat relationship among Chinese farmers 5,300 years ago. Researchers studied the bones of cats, dogs, deer and other animals unearthed in an excavation (挖掘) near a village in Central China. By using some ways, scientists showed that the cats were living on a mostly millet(黍)–based diet, just like the domesticated dogs and pigs from the site."The most reasonable explanation for a high consumption of millet–based food is that the cats had formed a stable and mutual relationship with humans and could easily feed on rodents (啮齿动物) around human villages, find leftover food or even have been fed by people intentionally," said Hu Yaowu from the Chinese Academy of Sciences in Beijing, whose research focuses on the relationship between humans and domesticated animals."It is very interesting for us to find the consumption of millet-based foods by the cats, since this kind of evidence had long been missing.‖ Hu explains. Since cats usually eat meat, such a diet would be unexpected, unless the cats were being fed by people, the study argues. The researchers also found that one of the cats survived to reach old age, implying that it had a safe place to live and enough to eat.Why the farmers wanted to keep cats nearby or make them "pets" could be answered by other evidence. Chinese archaeologists found some storage containers were specifically designed to keep out rodents — a vermin (害兽) that cats could certainly have helped with.The simplified theory is that rats were attracted to the food of farmers, and so were harmful to farmers. Cats were attracted to the rats, and so farmers formed a mutually beneficial relationship with cats, taking care of them in return for pest control.66. The evidence found in the remains dating back to prehistoric Cyprus means .A. human made cats pets as early as 9,500 years agoB. human interacted with cats very earlyC. cats didn’t appear un til prehistoric CyprusD. when cats became domesticated67. Apart from cats, Hu Yaowu and his teams may also study .A. the preventions of pests from grainsB. the history of Chinese farmingC. the dogs and pigsD. the ways to keep pets68. Which of the following is NOT the evidence of Chinese farms’ keeping cats?A. Cats didn’t feed on meat.B. The cats consumed large amounts of millet–based foods.C. One of the cats survived to reach old age.D. Some storage containers were specifically designed to keep out rodents.69. What are the reasons for farmers to keep cats?A. Helping keep other domesticated animals.B. Not letting cats eat food.C. Supplying meat for human.D. Helping reduce the amount of pests.70. In which part of a newspaper would be the passage most probably appear .A. EntertainmentB. EnvironmentC. Human and ScienceD. Life and fashionPart Ⅳ Writing (45 marks)Section A (10 marks)Directions: Read the following passage. Fill in the numbered blanks by using theinformation fromthe passage.Write NO MORE THAN THREE WORDS for each answer.Food makes us feel good, but some people eat when they aren’t r eally hungry and eat tosimply feel good. This kind of eating habit is called emotional eating, Array which does not affect adults but also young children. It isn’t a goodthing.A child’s eating habits can develop right from childhood. As weknow, a baby cries out if he doesn’t get milk at the usual time of the day. However, sometimes parents immediately stick a bottle in a child’s mouth without trying to find out if the child is really hungry. In fact, children may cry for other reasons. Even as children grow up and start going to school, parents sometimes give them a chocolate bar if they become really unhappy. As the children further grow up, they may become used to having a snack whenever they’re upset or low.Therefore, they’d like to eat an emotional snack when they have the feeling of unhappiness and boredom. Even when they don’t get high grades, aren’t popular at school or made fun of by others, they will want something to eat. After having the snack, they feel a lot better.Emotional eating in young children is a thing that needs to be taken seriously. To protect your children from emotional eating, you should satisfy your child’s emotional needs in the best possible way. This includes spending time with your child every day, taking an interest in his school work, helping your child study, providing a health environment without tension at home, etc. Don’t make the child lose face by scolding him. Develop confidence in your child. Make your child eat enough once in a while. Reward him for his achievements.All this will help your little one develop a healthy eating habit. And always remember loveand care is the key to help you child out of trouble and grow up happily.Section B (10 marks)Directions: Read the following passage. Answer the questions according to the information given in the passage.We lived in a very quiet neighborhood. One evening I heard a loud crash in the street. Earlier that evening my wife had asked me to go to the store to get some soft drinks. It seemed like this would be a good time to let my teenager daughter Holly practice her driving.At dinner my son talked about how much he liked my truck. I enjoyed having it, but I said, ―Guy, my heart is not set on that truck. I like it but it is just metal and won’t lastforever. Never set your heart on anything that won’t last.‖After hearing the loud noise, the whole family ran outside. My son shouted,―Dad! Dad, Holly crashed your truck.‖My heart sank and my mind was flooded with conflicting thoughts. Wasanyone hurt? Who else was involved? As I ran to the door, I heard a voice in myheart say, ―Here is a chance to show Holly what you really love. She’ll neverforget it.‖The accident had occurred in my own driveway. Holly had crashed my truckinto our other vehicle, the family van (搬运车). In her inexperience, she had confused the brakes and the gas pedal. Holly was unhurt physically, but when I reached her, she was crying and saying, ―Oh, Dad, I’m sorry. I know how much you love this truck.‖ I held her in my arms as she cried.Later that week a friend stopped by and asked what had happened to my truck. I told her the story. Her eyes moistened(湿润) and she said, ―Th at happened to me when I was a girl. I borrowed my dad’s car and ran into a log that had fallen across the road. I ruined the car. When I got home my Dad knocked me to the ground and began to kick me.‖ Over 40 years later, she still felt the pain of that night. It was a deep wound on her soul.I remember how sad Holly was the night and how I comforted her. One day, when Holly thinks back on her life, I want her to know that I love her a thousand times more than any piece of property. I repaired the van, but the dent (凹痕) in my truck is still there today. Every day it reminds me of what really matters in my life.81. Why did the father permit his daughter to drive his truck? (No more than 5 words) (2 marks)82. How did the accident happen? (No more than 11 words) (3 marks)83. What happened to the author’s friend after she ruined her dad’s car?(No more than 11 words) (2 marks) 84. What does the writer try to tell us according to the passage? (No more than 10 words) (3 marks)Section C (25 marks)Directions: Write an English composition according to the instructions given below in Chinese.假设你的笔友Tony因上期高三期末数学考试未及格而倍受打击,情绪低落。
北京城市学院学位英语考试题库2014级本科大学英语1卷Section A: Pronunciation and Intonation(每小题0.5分,共5分)Directions:In this section you will hear ten statements. Each statement will be spoken only ONCE. After each statement there will be a pause. During the pause, you must choose which of the two words you hear in each statement. Then mark the corresponding letter on the Answer Sheet with a single line through the center.注意:此部分试题请在答题卡上作答。
1. A. fool B. full2. A. fate B. fight3. A. let B. net4. A. thought B. sort5. A. sip B. zip6. A. high B. white7. A. duck B. dark8. A. loyal B. low9. A. warned B. warmed10.A. league B. leakSection B: Listening Strategy(每小题1分,共10分)Directions: In this section y ou will hear 10 statements. Each statement will be spoken TWICE. After each statement there will be a pause. During the pause, you must fill in the blank with an appropriate word you hear in the statement. Then write your answer on the corresponding part of the Answer Sheet.注意:此部分试题请在答题卡上作答。
Subways and Urban Growth:Evidence from Earth∗Marco Gonzalez-NavarroUniversity of Toronto†Matthew A.TurnerBrown University‡24November2014Abstract:We investigate the relationship between the extent of a city’s subway network,its population and its spatial configuration.To accomplish this investigation,for a sample of the632 largest cities in the world,we construct panel data describing the extent of each of the138subway systems in these cities,their population,and measures of centralization calculated from lights at night data.These data indicate that large cities are more likely to have subways,but that subways have at most a small effect on urban population growth.Consistent with economic theory and with other studies of the effects of transportation improvements on cities,our data also indicate that subways cause cities to be more decentralized.Key words:subways,public transit,urban growth,urban decentralization.jel classification:l91,r4,r11,r14∗We are grateful to Fern Ramoutar,Mohamed Salat,Mahdy Saddradini and Farhan Yahya for their assistance compiling the subway data.We are also grateful to seminar participants at Brown University,lse and perc,and to Victor Aguirragabiria,Dwayne Benjamin and Frank Kleibergen for helpful comments and conversations.Turner gratefully acknowledgesfinancial support from sshrc,financial support and hospitality of the Property and Environ-ment Research Center,and the Enaudi Institute of Economics and Finance during part of the time that this research was conducted.Gonzalez-Navarro is grateful forfinancial support from the World Bank Urbanisation in Developing Countries Programme and the Ontario Work Study Plan.Both authors are grateful forfinancial support from the Societe du Grand Paris.†121St.George Street Toronto,on m5s2e8,Canada.email:marco.gonzalez.navarro@utoronto.ca.tel:+1(416) 9785-692.‡Department of Economics,Box B,Brown University,Providence,ri02912.email:matthew_turner@.1.IntroductionWe investigate the relationship between the extent of a city’s subway network,its population and its spatial configuration.To accomplish this investigation,for a sample of the632largest cities in the world,we construct panel data describing the extent of each of the138subway systems in these cities,their population,and measures of centralization calculated from lights at night data.These data indicate that large cities are more likely to have subways,but that subways have at most a small effect on urban population growth.Consistent with economic theory and with other studies of the effects of transportation improvements on cities,our data also indicate that subways cause cities to be more decentralized.Our investigation is important for three reasons.First,understanding the effect of subways on cities is important if we are to evaluate proposals to build or extend subway systems.In2010Earth was home to7,886subway stations and about10,700km of subway routes spread across138cities. Subway construction and expansion projects range from merely expensive to truly breathtaking. Among the16subway systems examined by Baum-Snow and Kahn(2005),construction costs range from about25m to550m usd2005per km.On the basis of the mid-point of this range, 287m per km,construction costs for the current stock are about3trillion dollars.The Second Avenue subway extension,currently under construction in New York city,is estimated to cost almost1.6b usd2010per km,while Metropolitan Toronto is considering a45b dollar(us)public transit expansion and Paris is considering a public transit expansion almost as large.These costs are high enough that subway projects generally require large subsidies.To justify these subsidies,proponents often assert the ability of a subway system to have a transformative effect on the city and to encourage employment growth.A statement by the agency responsible for Toronto’s transit expansion is typical:"Effective transit and transportation solutions can bolster our global competitiveness,protect our environment,and improve our quality of life.Expanding transportation can help create thousands of new green and well-paid jobs,and save billions of dollars in time,energy and other efficiencies."1There is little evidence that subways have such transformative effects.Indeed,to date,there has been no city level statistical analysis of the effect of subway extent on any outcome other than ridership.If subways truly transform cities,as their proponents claim,then we should expect a migration of people into these cities.That our data do not provide evidence for such a migration suggests that the evaluation of prospective subway projects should rely more on the demand for mobility and less on the ability of subways to promote growth.Understanding the effect of subways on cities is also important to policy makers interested in the process of urbanization in the developing world.Over the coming decades,we expect an enormous migration of rural population towards major urban areas.As a consequence,we can reasonably expect demands for urban infrastructure that are large relative to the ability of local 1/en/regionalplanning/bigmove/big_move.aspx(accessed July28,2014).and national governments to supply it.In order to assess trade-offs between different types of infrastructure in these cities,understanding the implications of each for welfare is clearly import-ant.Since people move to more attractive places and away from less attractive ones(broadly defined),our investigation of the relationship between subways and population growth will help to inform these decisions.That subways have no measurable effect on population growth suggests that infrastructure spending plans in developing world cities should give serious consideration to non-subway infrastructure.Finally,there is an active academic literature investigating the effect of transportation infra-structure on the growth and configuration of cities.In spite of their prominence in policy debates, subways have so far escaped the attention of this literature.This primarily reflects the relative rarity of subways.Most cities have roads so a single country can provide a large enough sample to analyze the effects of roads on cities.Subways are too scarce for this.To conduct a statistical ana-lysis of the effect of subways on cities requires data from,at least,several countries.An important contribution of this paper is to overcome this data problem by collecting data that describe all of the world’s subway networks.In addition,with few exceptions,the current literature on the effects of infrastructure is static or considers panel data that is too short to investigate the dynamics of infrastructure’s effects on cities.Because our panel spans the60year period from1950until2010, we are able to investigate such dynamic responses to the provision of subways.To estimate the causal effects of subways on urban growth and urban form,we must grapple with the fact that subway systems and stations are not constructed at random times and places. While much of the recent literature investigating the effects of infrastructure on cities relies on quasi-random variation to resolve this problem,a natural experiment to explain city level variation in subways seems unlikely.Instead,to solve this problem we exploit the panel nature of our data in two ways.First,our panel is long enough to allow us to estimate city specific intercepts and trends.If there are city specific levels or trends correlated with subways,then including city specific intercepts and trends can result in causal estimates.However,it remains possible that subway expansions occur in non-random years,even after controlling for city effects.This might occur if,for example,cities build subways only after a sequence of years with improbably high growth or if there are short term populationfluctuations as a consequence of subway construction activity.To resolve the inference problems created by this sort of equilibrium process for subway provision,we develop an econometric framework which models them explicitly.Practically,this leads us to instrument for current subways with long lags of subways.Implementing this econometric model does not substantively change the conclusions based on less sophisticated estimators.2.LiteratureA Subways and urban growthWith a few exceptions that we describe below,the literature that analyzes the effects of subways on cities consists entirely of analyses of a single city.Nevertheless,this literature is large and we here focus our attention on the small set of papers which attempt to resolve the problem of non-random assignment of subways.More complete surveys are available in Billings(2011)and Gibbons and Machin(2005).Gibbons and Machin(2005)examine housing prices in London during the periods1997-1999 and2000-2001.These two year periods bracket two expansions of the London underground,six new stations and an extension of the Docklands light rail.Gibbons and Machin(2005)calculate various difference-in-differences estimates of the effect of these transit expansions on housing prices.Theyfind that houses near a new transit station appreciate about5%relative to houses further away,where a house within2km is‘near’a subway ing a refinement of this estimator that allows distance to vary continuously,theyfind that moving one km away from a subway station decreases values by about2%for thefirst two km,and about zero thereafter.Billings(2011)conducts a similar exercise for a new light rail line in Charlotte,North Carolina. Charlotte opened a new light rail system in November2007.2This system extended along one line,for about15km,with15stations along the route.Like Gibbons and Machin(2005),Billings (2011)estimates the effect of subways on housing prices using a difference-in-differences estimator, where‘before’and‘after’refer to housing prices in the periods before and after the opening of the system.However,‘near’and‘far’are defined slightly differently.First,distance is defined as distance to the subway line rather than distance to a station.Given that stations are about1km apart this is probably not important.Second,houses‘far’from the station are restricted to be close to alternate corridors that were candidates for a transit network that was ultimately not built, on the grounds that houses in alternate corridors are likely to resemble those in the successful corridor in unobserved ways.Despite the differences in milieu and method,Billings(2011)arrives at estimates quite close to those of Gibbons and Machin(2005):single family houses within1.6km of the transit line see their prices increase by about4%while condominiums see their prices rise by about11%.Note that,like Gibbons and Machin(2005),Billings(2011)observes that changes result from subway construction over the course of just a few years.Each of these papers makes a credible attempt to overcome the fact that subway systems are not located randomly within cities.However,neither provides us with much information about the relationship between subways and growth.If subways affect the growth of cities,then they may affect it everywhere,both near and far from the station.Such citywide effects are,by construction, invisible to the differences-in-differences methodology.2The Charlotte light rail system is not completely isolated from pedestrian and automobile traffic and so does not appear in our data as a subway.Therefore,while the existing literature makes some progress on the problem of non-random as-signment of subways to places,it does so at a high cost.The difference-in-differences methodology cannot tell us about the effect of changes in the overall level of activity within a city and,unless we are specifically interested in reorganizing economic activity across neighborhoods within a city,it is such changes in the overall level which are of primary policy interest and which are the object of our investigation.B Other infrastructure and urban growthThe literature relating highway and railroad infrastructure to urban growth has developed rapidly over the past several years and is surveyed in Redding and Turner(2015).For our purposes,it can be divided into studies of the effects of infrastructure on the internal structure of cities and studies of the evolution of city level population or employment.Baum-Snow(2007)investigates the effect of radial highways on population decentralization for a sample of large US cities between1950and1990.He relies on an early plan of the highway network that was drawn for military purposes as a source of quasi-random variation in highway placement.Hefinds that,over the whole40year course of his study period,a single radial highway causes about a9%decrease in central city population.Importantly,he is able to measure partial effects over20year time periods.Baum-Snow,Brandt,Henderson,Turner,and Zhang(2012) conduct a similar exercise.For a sample of Chinese cities between1990and2010,Baum-Snow et al.(2012)investigate the effect of highways and railroads on the decentralization of population, employment and production.They rely on historical networks predating economic reforms of the1990s as a source of quasi-random variation in highway and rail placement.Theyfind that radial highways contribute to the decentralization of population,that railroads contribute to the decentralization of production,and that ring road capacity contributes to the decentralization of both.Again,Baum-Snow et al.(2012)find measurable effects over the whole of their20year study period and also over ten year sub-intervals.Garcia-López(2012)examines the effect of radial highways on Spanish cities between1992and2007and alsofinds that highways decentralize population,again over a10-20year horizon.Probably more relevant to the present investigation,for a sample of US cities between1980-and 2000Duranton and Turner(2012)use a research design similar to Baum-Snow(2007)to investigate the relationship between urban employment growth and a city’s stock of interstate highways.They find that a10%increase in highways in a city causes about a1.5%increase in the population of a city ing a similar research design,Garcia-López,Holl,and Viladecans-Marsal (2013)finds that highways cause about the same rate of population growth in Spanish cities.In addition to investigating the effects of highways using city level variation,both Baum-Snow (2007)and Garcia-López(2012)examine population density within cities as a function of distance to a highway.Theyfind that population tends to be denser near highways and decreases with distance to a highway.Like highways,subways are intended to provide mobility for people andthe available evidence suggests that both highways and subways usually attract economic activity, broadly defined.Therefore,to the extent that subways affect urban form and growth,we can reasonably expect to observe these effects over a10-20year period.This is close to the duration of our panel for lights at night and is shorter than the period for which we observe population.The relationship between highways and railroads and urban growth is better understood than is the relationship between subways and urban growth for two reasons.First,highways and rail-roads are pervasive and so even medium sized countries can provide statistically useful samples of cities.Second,the literature has devised credible instrumental variables strategies to deal with the non-random assignment of highways and railroads to cities.An analysis of subways,on the other hand,requires data from many countries to construct a reasonably large sample and there is little hope for quasi-random variation in the assignment of subways.Two important contributions of the present investigation are to overcome the data problem and to develop an identification strategy that relies on time series variation in panel data.Subways and city level outcomesThe only studies(of which we are aware)to investigate the effects of subways on city level outcomes are primarily or completely interested in ridership.3On the basis of a single cross-section of about50cities,Gordon and Willson(1984)conduct a city level regression to predict riders per mile of track as a function of city population density and country level per capita gdp.Theyfind that these two variables are excellent predictors of ridership.Barnes(2005)provides evidence from a few cities in the US for an unsurprising refinement of this intuition.People are much more likely to take transit for trips to a central business district than for trips to other locations.Finally, Baum-Snow and Kahn(2005)provide evidence from16US cities for a similar relationship between density and transit use,although their small sample size limits the precision of their results.They also show that ridership in catchment areas for new stations attains almost the same level as in the catchment areas of old stations over their30year study period.On a more cautionary note, and consistent with thefinding in Gordon and Willson(1984)that ridership decreases with income and increases with density,Baum-Snow and Kahn(2005)find that most US transit expansions have only small effects on ridership,a conclusion echoed in Gomez-Ibanez(1996)for time series data on the use of Boston’s transit system.Aside from suggesting that pessimism about the growth of transit ridership is in order,these papers illustrate two points important to our analysis.First,they demonstrate the incompleteness of our understanding of the relationship between subways and the fortunes of cities.For practical purposes,there is no systematic evidence to support the claims of subway proponents that sub-3We note the literature on modal choice using individual level data.This important literature is only tangentially related to our present inquiry.A survey is available in Small and Verhoef(2007).Table1:Descriptive statistics for the world’s subway systems and cities in2010World Africa Asia Aus.Europe N.America S.America All citiesN632733416579956 Total Stations7,886512,97702,7821,598478 Total route km10,686564,22403,5582,219628 Population2,4272,1042,5112,4291,9212,4412,825 log(Pop.)14.32914.29614.32514.57214.22714.34414.450∆log(Pop.)0.1800.2480.1980.1070.0460.1430.189∆2t log(Pop.)-0.010-0.014-0.008-0.006-0.005-0.013-0.015 Mean light in25km disk622452658411658 Corr.lights&pop.0.570.560.580.850.690.710.92 Subway cities in2010N1381530403014 Stations575156705334∆Stations 3.758 4.250 4.568 3.965 2.658 2.423∆2t Stations0.6910.000 1.3740.3250.1150.435 log(Stations) 3.551 3.932 3.505 3.872 3.332 3.252∆2t log(Stations)0.2040.1010.3050.1580.1400.117∆2t log(Stations)-0.0470.000-0.054-0.018-0.066-0.088 Route km775680897445 Pop.per route km61196752565141 Pop.per station822161063290185 Pop.4,70611,0315,95122604,8146,300 log(Pop.)14.93416.21615.15314.38015.05115.344∆log(Pop.)0.1130.1240.1440.0450.1230.170∆2t log(Pop.)-0.011-0.014-0.012-0.005-0.013-0.017 Mean light in25km disk12221211795171109 Corr.lights&pop.0.670.670.690.780.91 Population levels reported in thousands.Lights data are based on radiance calibrated lights at night imagery.All entries describing levels report2010values.Entries describing changes are averages over the period from1950to2010.ways transform cities.Second,they point to the importance of putting subways in dense places and of allowing dense development in areas served by subways.3.DataTo investigate the effect of subways on the evolution of a city’s population and its spatial structure we require data describing subways,population and spatial structure for a panel of cities.We construct such data from three principal sources.Our population data are the un World Cities Data,our subway data are the result of primary data collection and our description of urban spatial structure derives from lights at night data.In addition to our three main data sources,for each of the cities in our sample we construct several time-invariant control variables.They are continent of city,capital city status,distance to the ocean,distance to nearest land border and distance to the nearest major navigable river.The un World Cities Data reports continent and capital city ing GIS software,we calculate country,distance to the ocean,to the nearest navigable river and to the nearest land border on the basis of shapefiles describing oceans,rivers and international boundaries.We also use the Penn World Table measure of country level gdp per capita as a time varying control in many of our regressions.A Population dataOur data are organized around the un World Cities Data.4Produced by the United Nations, Department of Economic and Social Affairs,Population Division,these data describe population counts for all cities whose population exceeds750,000at any time during1950-2010.Constructing international data describing city level population is subject to two problems,the availability of population data and cross-country differences in the definitions of cities.Population data are generally available from decennial or quinquennial censuses.However,census years do not synchronize neatly across countries.To resolve this problem,the un World Cities Data interpolate to construct annual values.Therefore,because few countries conduct censuses more often than everyfive years,successive annual population changes must sometimes reflect linear interpolation of the same proximate census years.To avoid making inferences from such imputed population changes,we restrict attention to observations drawn everyfifth year,e.g.,1950,1955, ...,and refer to each such observation as a‘city-year’.This decreases the likelihood that sequential city-years are calculated by interpolation from the same two underlying censuses.Resolving the problem of differential city definitions relies on the judgement of the un researchers who assembled the data.In private correspondence,these researchers assured us that they understood 4Downloaded from /unup/GIS-Files/gis_1.htm,February2013.Figure1:Lights and subways in2010for six citiesTibilisi:1.1m pop,21stations Toulouse:0.9m pop and37stationsBoston:4.7m pop,74stations Singapore:5.1m pop,78stationsMexico City:20.1m pop and147stations Beijing:15m pop and124stations Note:Images show2010radiance calibrated lights at night,2010subway route maps and all subway stations constructed prior to2013.The gray/pink ellipses in eachfigure are projected 5km and25km radius circles to show scale and light gray/blue is water.this problem and endeavored to make their‘cities’as consistent as possible across countries and time.The top panel of Table1describes our population data.Our sample consists of632cities,more than half in Asia.In2010,the mean size of a city in our sample is about2.4million.There is little variation in mean size across continents,although cities in South America tend to be larger while cities in Europe tend to be smaller.Between1950and2010,the meanfive year growth rate of a city in our sample is about18%.This rate falls by about1%everyfive years.Not surprisingly,cities in Africa,Asia and South America grow faster than in North America and Europe.Europeans cities are the obvious outlier and grow more slowly than cities elsewhere.The growth rate of cities is declining on all continents and this decline is somewhat slower in Europe.The bottom panel of Table1describes our population data for the138cities in our sample with a subway in2010.At4.7m people on average,these cities are dramatically larger than non-subway cities.Cairo is the single African city with a subway,and so the Africa column in the bottom panel of table1is really a‘Cairo column’.Australia has no subway cities n and South American subway cities are larger than those in North America and dramatically larger than those in Europe.The growth rate for an average subway city is about13%,somewhat slower than in the whole sample.As for the whole sample,European subway cities are growing more slowly than other subway cities.Also similar to the whole population of cities,growth rates are declining by about1%everyfive years and this decline is somewhat slower in Europe.B Subways dataOur data describe the latitude,longitude and date of opening of every subway station in the world.These data were compiled manually between January2012and February2014using the following process.First,using online sources such as /and links therein,together with links on wikipedia,we complied a list of all subway stations worldwide. Next,for each station on our list,we record opening date,station name,line name,terminal station indicator,transfer station indicator,city and country.This process leads us to enumerate subway stations in161cities.Of these,138are large enough to appear in the un World Cities Data and are the main subject of our analysis.5For our purposes,a‘subway’is defined as an electric powered urban rail that is completely isolated from interactions with automobile traffic and pedestrians.This excludes most streetcars, because they interact with vehicle traffic at stoplights and crossings,although we include under-ground streetcar segments.In order to focus on intra-urban subway transportation systems,we also exclude heavy rail commuter lines.We do not distinguish between surface,underground or 5The23cities with subways in2010that do not occur in our population data are:Bielefeld,Bilbao,Bochum,Catania, Dortmund,Duisburg,Dusseldorf,Essen,Frankfurt,Genova,Hannover,Kitakyushu,Kryvyrih,Lausanne,Mulheim, Naha,Nuremberg,Palma,Perugia,Rennes,Rouen,Seville and Wuppertal.Figure 2:Growth of subway systems for the whole world and by continentNote:In each graph,the dashed line indicates the number of cities with a subway system and the solid line indicates the total number of operational stations.Australia has no subway systems and is omitted.Figure3:Stations in a subway system by time since system openingNote:Vertical axis is log of operation stations in a system.Horizontal axis is years since station opening.Dots indicate individual city-years.aboveground subway lines as long as exclusive right of way condition is satisfied.These subways systems typically operate frequently,e.g.,10minute headways or less during daytimes,and are quick and reliable,and are used mostly for the intra-urban transportation of people.For the most part,our subways data describe public transit systems that would ordinarily be described as ‘subways’,e.g.,the Paris metro and the New York city subway,and only such systems.As with any such definition,the inclusion or exclusions of particular marginal cases in our sample may be controversial.We use our data to construct three measures of subway extent for each city-year.Most simply, we count the number of operational stations in each year.Since our data also enumerate subway lines,we also count the number of operational subway lines in each city in each year.Finally,by connecting stations on each subway line by the shortest possible route,we approximate the route of each subway line.Taking the union of all such lines in a city approximates each city’s network. Calculating the length of this network gives us the length of each system.In this way we arrive at our three primary measures of subway extent for each city-year;operational stations,operational lines and route kilometers.Figure1illustrates our subway data for six cities.Thefigure shows all stations operational prior to2013as black dots.The network maps,on which the2010calculation of route km is based,are shown as black lines.Stations that opened after2010are not connected to the network.In each panel of thefigure,a gray circle or ellipse describes a circle of25km radius to show scale.That this circle is distorted in Northerly cities is a consequence of our map projection.To show the configuration of each city,the background shows lights at night in2010.In the top row,with2010 populations of1.1m and0.9m Tibilsi(Georgia)and Toulouse(France)are among the smallest cities。