曼昆微观经济学原理答案!(英文版)
- 格式:doc
- 大小:423.50 KB
- 文档页数:28
✍ how to define and measure consumer surplus.✍ the link between sellers’ costs of producing a good and the supply curve.✍ how to define and measure producer surplus.✍ that the equilibrium of supply and demand maximizes total surplus in a market. CONTEXT AND PURPOSE:Chapter 7 is the first chapter in a three-chapter sequence on welfare economics and market efficiency. Chapter 7 employs the supply and demand model to develop consumer surplus and producer surplus as a measure of welfare and market efficiency. These concepts are then utilized in Chapters 8 and 9 to determine the winners and losers from taxation and restrictions on international trade.The purpose of Chapter 7 is to develop welfare economics—the study of how the allocation of resources affects economic well-being. Chapters 4 through 6 employed supply and demand in a positive framework, which focused on the question, “What is the equilibrium price and quantity in a market?” This chapter now addresses the normative question, “Is the equilibrium price and quantity in a market the best possible solution to the resource allocation problem, or is it simply the price and quantity that balance supply and demand?” Students will discover that under most circumstances the equilibrium price and quantity is also the one that maximizes welfare.KEY POINTS:? Consumer surplus equals buyers’ willingness to pay for a good minus the amount they actually pay for it, and it measures the benefit buyers get from participating in a market.Consumer surplus can be computed by finding the area below the demand curve and above the price.? Producer surplus equals the amount sellers receive for their goods minus their costs of production, and it measures the benefit sellers get from participating in a market. Producer surplus can be computed by finding the area below the price and above the supply curve.? An allocation of resources that maximizes the sum of consumer and producer surplus is said to be efficient. Policymakers are often concerned with the efficiency, as well as the equality, of economic outcomes.? The equilibrium of supply and demand maximizes the sum of consumer and producer surplus.That is, the invisible hand of the marketplace leads buyers and sellers to allocate resources efficiently.? Markets do not allocate resources efficiently in the presence of market failures such as market power or externalities.CHAPTER OUTLINE:I. Definition of welfare economics: the study of how the allocation of resources affects economic well-being.A. Willingness to Pay1. Definition of willingness to pay: the maximum amount that a buyer will pay for a good.2. Example: You are auctioning a mint-condition recording of Elvis Presley’s first album. Four buyers show up. Their willingness to pay is as follows:for John. Because John is willing to pay more than he has to for the album,he derives some benefit from participating in the market.3. Definition of consumer surplus: the amount a buyer is willing to pay for a good minus the amount the buyer actually pays for it.4. Note that if you had more than one copy of the album, the price in the auction would end up being lower (a little over $70 in the case of two albums) and both John and Paul would gain consumer surplus.B. Using the Demand Curve to Measure Consumer Surplus1. We can use the information on willingness to pay to derive a demand curve for the rare2. . Because the demand curve shows the buyers’ willingness to pay, we can use the demand curve to measure consumer surplus.C. How a Lower Price Raises Consumer Surplusare paying less for the product than before (area A on the graph).b. Because the price is now lower, some new buyers will enter the market and receive consumer surplus on these additional units of output purchased (area B on the graph).D. What Does Consumer Surplus Measure?1. Remember that consumer surplus is the difference between the amount that buyers are willing to pay for a good and the price that they actually pay.2. Thus, it measures the benefit that consumers receive from the good as the buyers themselves perceive it.III. Producer SurplusA. Cost and the Willingness to Sell1. Definition of cost: the value of everything a seller must give up to produce a good .2. Example: You want to hire someone to paint your house. You accept bids for the work from four sellers. Each painter is willing to work if the price you will pay exceeds her opportunity cost. (Note that this opportunity cost thus represents willingness to sell.) The costs are: ALTERNATIVE CLASSROOM EXAMPLE:Review the material on price ceilings from Chapter 6. Redraw the market for two-bedroom apartments in your town. Draw in a price ceiling below the equilibriumprice.Then go through:✍ consumer surplus before the price ceiling is put into place.✍ consumer surplus after the price ceiling is put into place.You will need to take some time to explain the relationship between the producers’ willingness to sell and the cost of producing the good. The relationship between cost and the supply curve is not as apparent as the relationship between the demand curve and willingness to pay. It is important to stress that consumer surplus is measured in monetary terms. Consumer surplus gives us a way to place a monetary cost on inefficient market outcomes (due to government involvement or market failure).except for Grandma. Because Grandma receives more than she would require to paint the house, she derives some benefit from producing in the market.4.Definition of producer surplus: the amount a seller is paid for a good minus the seller’s cost of providing it.5. Note that if you had more than one house to paint, the price in the auction would end up being higher (a little under $800 in the case of two houses) and both Grandma and Georgia would gain producer surplus.B. Using the Supply Curve to Measure Producer Surplus1. We can use the information on cost (willingness to sell) to derive a supply curve for2. marginal seller . Because the supply curve shows the sellers’ cost (willingness to sell), we can use the supply curve to measure producer surplus.are receiving more for the product than before (area C on the graph).b. Because the price is now higher, some new sellers will enter the market and receive producer surplus on these additional units of output sold (area D on the graph).D. Producer surplus is used to measure the economic well-being of producers, much like consumer surplus is used to measure the economic well-being of consumers.ALTERNATIVE CLASSROOM EXAMPLE:Review the material on price floors from Chapter 6. Redraw the market for anagricultural product such as corn. Draw in a price support above the equilibriumprice.Then go through:✍ producer surplus before the price support is put in place.✍ producer surplus after the price support is put in place.Make sure that you discuss the cost of the price support to taxpayers.IV.Market EfficiencyA. The Benevolent Social Planner1. The economic well-being of everyone in society can be measured by total surplus, which is the sum of consumer surplus and producer surplus:Total Surplus = Consumer Surplus + Producer SurplusTotal Surplus = (Value to Buyers – Amount Paid by Buyers) +(Amount Received by Sellers – Cost to Sellers)Because the Amount Paid by Buyers = Amount Received bySellers:2. Definition of efficiency: the property of a resource allocation of maximizing the total surplus received by all members of society .3. Definition of equality: the property of distributing economic prosperity uniformly the members of society .a. Buyers who value the product more than the equilibrium price will purchase the product; those who do not, will not purchase the product. In other words, the free market allocates the supply of a good to the buyers who value it most highly, as measured by their willingness to pay.b. Sellers whose costs are lower than the equilibrium price will produce the product; those whose costs are higher, will not produce the product. In other words, the free market allocates the demand for goods to the sellers who can produce it at the lowest cost.to the marginal buyer is greater than the cost to the marginal seller so total surplus would rise if output increases.b. At any quantity of output greater than the equilibrium quantity, the value of the product to the marginal buyer is less than the cost to the marginal seller so total surplus would rise if output decreases.3. Note that this is one of the reasons that economists believe Principle #6: Markets are usually a good way to organize economic activity.It would be a good idea to remind students that there are circumstances whenthe market process does not lead to the most efficient outcome. Examplesinclude situations such as when a firm (or buyer) has market power over priceor when there are externalities present. These situations will be discussed inlater chapters.Pretty Woman, Chapter 6. Vivien (Julia Roberts) and Edward (Richard Gere)negotiate a price. Afterward, Vivien reveals she would have accepted a lowerprice, while Edward admits he would have paid more. If you have done a goodjob of introducing consumer and producer surplus, you will see the light bulbsgo off above your students’ heads as they watch this clip.C. In the News: Ticket Scalping1. Ticket scalping is an example of how markets work to achieve an efficient outcome.2. This article from The Boston Globe describes economist Chip Case’s experience with ticket scalping.D. Case Study: Should There Be a Market in Organs?1. As a matter of public policy, people are not allowed to sell their organs.a. In essence, this means that there is a price ceiling on organs of $0.b. This has led to a shortage of organs.2. The creation of a market for organs would lead to a more efficient allocation of resources, but critics worry about the equity of a market system for organs.V. Market Efficiency and Market FailureA. To conclude that markets are efficient, we made several assumptions about how markets worked.1. Perfectly competitive markets.2. No externalities.B. When these assumptions do not hold, the market equilibrium may not be efficient.C. When markets fail, public policy can potentially remedy the situation. SOLUTIONS TO TEXT PROBLEMS:Quick Quizzes1. Figure 1 shows the demand curve for turkey. The price of turkey is P1 and the consumer surplus that results from that price is denoted CS. Consumer surplus is the amount a buyer is willing to pay for a good minus the amount the buyer actually pays for it. It measures the benefit to buyers of participating in a market.Figure 1 Figure 22. Figure 2 shows the supply curve for turkey. The price of turkey is P1 and the producer surplus that results from that price is denoted PS. Producer surplus is the amount sellers are paid for a good minus the sellers’ cost of providing it (measured by the supply curve). It measures the benefit to sellers of participating in a market.Figure 33. Figure 3 shows the supply and demand for turkey. The price of turkey is P1, consumer surplus is CS, and producer surplus is PS. Producing more turkeys than the equilibrium quantity would lower total surplus because the value to the marginal buyer would be lower than the cost to the marginal seller on those additional units.Questions for Review1. The price a buyer is willing to pay, consumer surplus, and the demand curve are all closely related. The height of the demand curve represents the willingness to pay of the buyers. Consumer surplus is the area below the demand curve and above the price, which equals the price that each buyer is willing to pay minus the price actually paid.2. Sellers' costs, producer surplus, and the supply curve are all closely related. The height of the supply curve represents the costs of the sellers. Producer surplus is the area below the price and above the supply curve, which equals the price received minus each seller's costs of producing the good.Figure 43. Figure 4 shows producer and consumer surplus in a supply-and-demand diagram.4. An allocation of resources is efficient if it maximizes total surplus, the sum of consumer surplus and producer surplus. But efficiency may not be the only goal of economic policymakers; they may also be concerned about equity the fairness of the distribution of well-being.5. The invisible hand of the marketplace guides the self-interest of buyers and sellers into promoting general economic well-being. Despite decentralized decision making and self-interested decision makers, free markets often lead to an efficient outcome.6. Two types of market failure are market power and externalities. Market power may cause market outcomes to be inefficient because firms may cause price and quantity to differ from the levels they would be under perfect competition, which keeps total surplus from being maximized. Externalities are side effects that are not taken into account by buyers and sellers. As a result, the free market does not maximize total surplus.Problems and Applications1. a. Consumer surplus is equal to willingness to pay minus the price paid. Therefore, Melissa’s willingness to pay must be $200 ($120 + $80).b. Her consumer surplus at a price of $90 would be $200 ? $90 = $110.c. If the price of an iPod was $250, Melissa would not have purchased one because the price is greater than her willingness to pay. Therefore, she would receive no consumer surplus.2. If an early freeze in California sours the lemon crop, the supply curve for lemons shifts to the left, as shown in Figure 5. The result is a rise in the price of lemons and a decline in consumer surplus from A + B + C to just A. So consumer surplus declines by the amount B + C.Figure 5 Figure 6In the market for lemonade, the higher cost of lemons reduces the supply of lemonade, as shown in Figure 6. The result is a rise in the price of lemonade and a decline in consumer surplus from D + E + F to just D, a loss of E + F. Note that an event that affects consumer surplus in one market often has effects on consumer surplus in other markets.3. A rise in the demand for French bread leads to an increase in producer surplus in the market for French bread, as shown in Figure 7. The shift of the demand curve leads to an increased price, which increases producer surplus from area A to area A + B + C.Figure 7The increased quantity of French bread being sold increases the demand for flour, as shown in Figure 8. As a result, the price of flour rises, increasing producer surplus from area Dto D + E + F. Note that an event that affects producer surplus in one market leads to effects on producer surplus in related markets.Figure 84. a.Figure 9b. When the price of a bottle of water is $4, Bert buys two bottles of water. His consumer surplus is shown as area A in the figure. He values his first bottle of water at $7, but pays only $4 for it, so has consumer surplus of $3. He values his second bottle of water at $5, but pays only $4for it, so has consumer surplus of $1. Thus Bert’s total consumer surplus is $3 + $1 = $4, which is the area of A in the figure.c. When the price of a bottle of water falls from $4 to $2, Bert buys three bottles of water, an increase of one. His consumer surplus consists of both areas A and B in the figure, an increase in the amount of area B. He gets consumer surplus of $5 from the first bottle ($7 value minus $2 price), $3 from the second bottle ($5 value minus $2 price), and $1 from the third bottle ($3 value minus $2 price), for a total consumer surplus of $9. Thus consumer surplus rises by $5 (which is the size of area B) when the price of a bottle of water falls from $4 to $2.5. a.Figure 10b. When the price of a bottle of water is $4, Ernie sells two bottles of water. His producer surplus is shown as area A in the figure. He receives $4 for his first bottle of water, but it costs only $1 to produce, so Ernie has producer surplus of $3. He also receives $4 for his second bottle of water, which costs $3 to produce, so he has producer surplus of $1. Thus Ernie’s total producer surplus is $3 + $1 = $4, which is the area of A in the figure.c. When the price of a bottle of water rises from $4 to $6, Ernie sells three bottles of water, an increase of one. His producer surplus consists of both areas A and B in the figure, an increase by the amount of area B. He gets producer surplus of $5 from the first bottle ($6 price minus $1 cost), $3 from the second bottle ($6 price minus $3 cost), and $1 from the third bottle ($6 price minus $5 price), for a total producer surplus of $9. Thus producer surplus rises by $5 (which is the size of area B) when the price of a bottle of water rises from $4 to $6.6. a. From Ernie’s supply schedule and Bert’s demand schedule, the quantityequilibrium quantity of two.b. At a price of $4, consumer surplus is $4 and producer surplus is $4, as shown in Problems 3 and 4 above. Total surplus is $4 + $4 = $8.c. If Ernie produced one less bottle, his producer surplus would decline to $3, as shown in Problem 4 above. If Bert consumed one less bottle, his consumer surplus would decline to $3, as shown in Problem 3 above. So total surplus would decline to $3 + $3 = $6.d. If Ernie produced one additional bottle of water, his cost would be $5, but the price is only $4, so his producer surplus would decline by $1. If Bert consumed one additional bottle of water, his value would be $3, but the price is $4, so his consumer surplus would decline by $1. So total surplus declines by $1 + $1 = $2.7. a. The effect of falling production costs in the market for stereos results in a shift to the right in the supply curve, as shown in Figure 11. As a result, the equilibrium price of stereos declines and the equilibrium quantity increases.Figure 11b. The decline in the price of stereos increases consumer surplus from area A to A + B + C + D, an increase in the amount B + C + D. Prior to the shift in supply, producer surplus was areas B + E (the area above the supply curve and below the price). After the shift in supply, producer surplus is areas E + F + G. So producer surplus changes by the amount F + G – B, which may be positive or negative. The increase in quantity increases producer surplus, while the decline in the price reduces producer surplus. Because consumer surplus rises by B + C + D and producer surplus rises by F + G – B, total surplus rises by C + D + F + G.c. If the supply of stereos is very elastic, then the shift of the supply curve benefits consumers most. To take the most dramatic case, suppose the supply curve were horizontal, as shown in Figure 12. Then there is no producer surplus at all. Consumers capture all the benefits of falling production costs, with consumer surplus rising from area A to area A + B.Figure 128. Figure 13 shows supply and demand curves for haircuts. Supply equals demand at a quantity of three haircuts and a price between $4 and $5. Firms A, C, and D should cut the hair of Ellen, Jerry, and Phil. Oprah’s willingness to pay is too low and firm B’s costs are too high, so they do not participate. The maximum total surplus is the area between the demand and supply curves, which totals $11 ($8 value minus $2 cost for the first haircut, plus $7 value minus $3 cost for the second, plus $5 value minus $4 cost for the third).Figure 139. a. The effect of falling production costs in the market for computers results in a shift to the right in the supply curve, as shown in Figure 14. As a result, the equilibrium price of computers declines and the equilibrium quantity increases. The decline in the price of computers increases consumer surplus from area A to A + B + C + D, an increase in the amount B + C + D.Figure 14 Figure 15Prior to the shift in supply, producer surplus was areas B + E (the area above thesupply curve and below the price). After the shift in supply, producer surplus isareas E + F + G. So producer surplus changes by the amount F + G – B, whichmay be positive or negative. The increase in quantity increases producer surplus,while the decline in the price reduces producer surplus. Because consumer surplusrises by B + C + D and producer surplus rises by F + G – B, total surplus rises byC +D + F + G.b. Because typewriters are substitutes for computers, the decline in the price of computers means that people substitute computers for typewriters, shifting the demand for typewriters to the left, as shown in Figure 15. The result is a decline in both the equilibrium price and equilibrium quantity of typewriters. Consumer surplus in the typewriter market changes from area A + B to A + C, a net change of C – B. Producer surplus changes from area C + D + E to area E, a net loss of C + D. Typewriter producers are sad about technological advances in computers because their producer surplus declines.c. Because software and computers are complements, the decline in the price and increase in the quantity of computers means that the demand for software increases, shifting the demand for software to the right, as shown in Figure 16. The result is an increase in both the price and quantity of software. Consumer surplus in the software market changes from B + C to A + B, anet change of A – C. Producer surplus changes from E to C + D + E, an increase of C + D, so software producers should be happy about the technological progress in computers.Figure 16d. Yes, this analysis helps explain why Bill Gates is one the world’s richest people, because his company produces a lot of software that is a complement with computers and there has been tremendous technological advance in computers.10. a. With Provider A, the cost of an extra minute is $0. With Provider B, the cost of anextra minute is $1.b. With Provider A, my friend will purchase 150 minutes [= 150 – (50)(0)]. WithProvider B, my friend would purchase 100 minutes [= 150 – (50)(1)].c. With Provider A, he would pay $120. The cost would be $100 with Provider B.Figure 17d. Figure 17 shows the friend’s demand. With Provider A, he buys 150 minutes andhis consumer surplus is equal to (1/2)(3)(150) – 120 = 105. With Provider B, hisconsumer surplus is equal to (1/2)(2)(100) = 100.e. I would recommend Provider A because he receives greater consumer surplus.11. a. Figure 18 illustrates the demand for medical care. If each procedure has a price of $100, quantity demanded will be Q1 procedures.Figure 18b. If consumers pay only $20 per procedure, the quantity demanded will be Q2 procedures. Because the cost to society is $100, the number of procedures performed is too large to maximize total surplus. The quantity that maximizes total surplus is Q1 procedures, which is less than Q2.c. The use of medical care is excessive in the sense that consumers get procedures whose value is less than the cost of producing them. As a result, the economy’s total surplus is reduced.d. To prevent this excessive use, the consumer must bear the marginal cost of the procedure. But this would require eliminating insurance. Another possibility would be that the insurance company, which pays most of the marginal cost of the procedure ($80, in this case) could decide whether the procedure should be performed. But the insurance company does not get the benefits of the procedure, so its decisions may not reflect the value to the consumer.。
WHAT’S NEW IN THE SEVENTH EDITION:The section on ”A Financial Crisis Takes Us for a Ride Along t he Phillips Curve” has been updated.LEARNING OBJECTIVES:By the end of this chapter, students should understand:why policymakers face a short-run trade-off between inflation and unemployment.why the inflation-unemployment trade-off disappears in the long run.how supply shocks can shift the inflation-unemployment trade-off.the short-run cost of reducing inflation.how policymakers’ credibility might affect the cost of reducing inflation.CONTEXT AND PURPOSE:Chapter 22 is the final chapter in a three-chapter sequence on the economy’s short-run fluctuations around its long-term trend. Chapter 20 introduced aggregate supply and aggregate demand. Chapter 21 developed how monetary and fiscal policies affect aggregate demand. Both Chapters 20 and 21 addressed the relationship between the price level and output. Chapter 22 will concentrate on a similar relationship between inflation and unemployment.The purpose of Chapter 22 is to trace the history of economists’ thinking about the relationship between inflation and unemployment. Students will see why there is a temporary trade-off between inflation and unemployment, and why there is no permanent trade-off. This result is an extension of the results produced by the model of aggregate supply and aggregate demand where a change in the price level induced by a change in aggregate demand temporarily alters output but has no permanent impact on output.389390❖Chapter 22/The Short-Run Trade-off between Inflation and UnemploymentKEY POINTS:∙ The Phillips curve describes a negative relationship between inflation and unemployment. By expanding aggregate demand, policymakers can choose a point on the Phillips curve with higher inflation and lower unemployment. By contracting aggregate demand, policymakers can choose apoint on the Phillips curve with lower inflation and higher unemployment.∙ The trade-off between inflation and unemployment described by the Phillips curve holds only in the short run. In the long run, expected inflation adjusts to changes in actual inflation, and the short-run Phillips curve shifts. As a result, the long-run Phillips curve is vertical at the natural rate ofunemployment.∙ The short-run Phillips curve also shifts because of shocks to aggregate supply. An adverse supply shock, such as an increase in world oil prices, gives policymakers a less favorable trade-off between inflation and unemployment. That is, after an adverse supply shock, policymakers have to accept a higher rate of inflation for any given rate of unemployment, or a higher rate of unemployment for any given rate of inflation.∙ When the Fed contracts growth in the money supply to reduce inflation, it moves the economy along the short-run Phillips curve, which results in temporarily high unemployment. The cost of disinflation depends on how quickly expectations of inflation fall. Some economists argue that a crediblecommitment to low inflation can reduce the cost of disinflation by inducing a quick adjustment of expectations.CHAPTER OUTLINE:I. The Phillips CurveA. Origins of the Phillips Curve1. In 1958, economist A. W. Phillips published an article discussing the negative correlationbetween inflation rates and unemployment rates in the United Kingdom.2. American economists Paul Samuelson and Robert Solow showed a similar relationshipbetween inflation and unemployment for the United States two years later.3. The belief was that low unemployment is related to high aggregate demand, and highaggregate demand puts upward pressure on prices. Likewise, high unemployment is relatedto low aggregate demand, and low aggregate demand pulls price levels down.4. Definition of Phillips curve: a curve that shows the short-run trade-off betweeninflation and unemployment.Chapter 22/The Short-Run Trade-off between Inflation and Unemployment❖ 3915. Samuelson and Solow believed that the Phillips curve offered policymakers a menu ofpossible economic outcomes. Policymakers could use monetary and fiscal policy to chooseany point on the curve.B. Aggregate Demand, Aggregate Supply, and the Phillips Curve1. The Phillips curve shows the combinations of inflation and unemployment that arise in theshort run as shifts in the aggregate-demand curve move the economy along the short-runaggregate-supply curve.2. The greater the aggregate demand for goods and services, the greater the economy’s outputand the higher the price level. Greater output means lower unemployment. The higher theprice level in the current year, the higher the rate of inflation.3. Example: The price level is 100 (measured by the Consumer Price Index) in the year 2020.There are two possible changes in the economy for the year 2021: a low level of aggregatedemand or a high level of aggregate demand.a. If the economy experiences a low level of aggregate demand, we would be at a short-run equilibrium like point A. This point also corresponds with point A on the Phillips curve.Note that when aggregate demand is low, the inflation rate is relatively low and theunemployment rate is relatively high.b. If the economy experiences a high level of aggregate demand, we would be at a short-run equilibrium like point B. This point also corresponds with point B on the Phillips curve.Note that when aggregate demand is high, the inflation rate is relatively high and theunemployment rate is relatively low.392❖Chapter 22/The Short-Run Trade-off between Inflation and Unemployment Figure 24. Because monetary and fiscal policies both shift the aggregate-demand curve, these policiescan move the economy along the Phillips curve.a. Increases in the money supply, increases in government spending, or decreases in taxesall increase aggregate demand and move the economy to a point on the Phillips curvewith lower unemployment and higher inflation.b. Decreases in the money supply, decreases in government spending, or increases in taxesall lower aggregate demand and move the economy to a point on the Phillips curve withhigher unemployment and lower inflation.II. Shifts in the Phillips Curve: The Role of ExpectationsA. The Long-Run Phillips Curve1. In 1968, economist Milton Friedman argued that monetary policy is only able to choose acombination of unemployment and inflation for a short period of time. At the same time,economist Edmund Phelps wrote a paper suggesting the same thing.2. In the long run, monetary growth has no real effects. This implies that it cannot affect thefactors that determine the economy’s long-run unemployment rate.Chapter 22/The Short-Run Trade-off between Inflation and Unemployment ❖ 3933. Thus, in the long run, we would not expect there to be a relationship between unemployment and inflation. This must mean that, in the long run, the Phillips curve is vertical.4. The vertical Phillips curve occurs because, in the long run, the aggregate supply curve is vertical as well. Thus, increases in aggregate demand lead only to changes in the price leveland have no effect on the economy’s level of output. Thus, in the long run, unemployment will not change when aggregate demand changes, but inflation will.5. The long-run aggregate-supply curve occurs at the economy’s natural level of output. Thismeans that the long-run Phillips curve occurs at the natural rate of unemployment.394❖Chapter 22/The Short-Run Trade-off between Inflation and UnemploymentB. The Meaning of “Natural”1. Friedman and Phelps considered the natural rate of unemployment to be the rate towardwhich the economy gravitates in the long run.2. The natural rate of unemployment may not be the socially desirable rate of unemployment.3. The natural rate of unemployment may change over time.C. Reconciling Theory and Evidence1. The conclusion of Friedman and Phelps that there is no long-run trade-off between inflationand unemployment was based on theory, while the correlation between inflation andunemployment found by Phillips, Samuelson, and Solow was based on actual evidence.2. Friedman and Phelps believed that an inverse relationship between inflation andunemployment exists in the short run.3. The long-run aggregate-supply curve is vertical, indicating that the price level does notinfluence output in the long run.4. But, the short-run aggregate-supply curve is upward sloping because of misperceptionsabout relative prices, sticky wages, and sticky prices. These perceptions, wages, and pricesadjust over time, so that the positive relationship between the price level and the quantity ofgoods and services supplied occurs only in the short run.5. This same logic applies to the Phillips curve. The trade-off between inflation andunemployment holds only in the short run.6. The expected level of inflation is an important factor in understanding the difference betweenthe long-run and the short-run Phillips curves. Expected inflation measures how much peopleexpect the overall price level to change.7. The expected rate of inflation is one variable that determines the position of the short-runaggregate-supply curve. This is true because the expected price level affects the perceptionsof relative prices that people form and the wages and prices that they set.8. In the short run, expectations are somewhat fixed. Thus, when the Fed increases the moneysupply, aggregate demand increases along the upward sloping short-run aggregate-supplycurve. Output grows (unemployment falls) and the price level rises (inflation increases).9. Eventually, however, people will respond by changing their expectations of the price level.Specifically, they will begin expecting a higher rate of inflation.Chapter 22/The Short-Run Trade-off between Inflation and Unemployment ❖ 395D. The Short-Run Phillips Curve1. We can relate the actual unemployment rate to the natural rate of unemployment, the actual inflation rate, and the expected inflation rate using the following equation:a. Because expected inflation is already given in the short run, higher actual inflation leadsto lower unemployment.b. How much unemployment changes in response to a change in inflation is determined by the variable a, which is related to the slope of the short-run aggregate-supply curve.2. If policymakers want to take advantage of the short-run trade-off between unemployment and inflation, it may lead to negative consequences.a. Suppose the economy is at point A and policymakers wish to lower the unemploymentrate. Expansionary monetary policy or fiscal policy is used to shift aggregate demand tothe right. The economy moves to point B, with a lower unemployment rate and a higherrate of inflation.b. Over time, people get used to this new level of inflation and raise their expectations ofinflation. This leads to an upward shift of the short-run Phillips curve. The economy ends up at point C, with a higher inflation rate than at point A, but the same level ofunemployment.396 ❖ Chapter 22/The Short-Run Trade-off between Inflation and UnemploymentE. The Natural Experiment for the Natural-Rate Hypothesis1. Definition of the natural-rate hypothesis: the claim that unemployment eventually returns to its normal, or natural rate, regardless of the rate of inflation .2. Figure 6 shows the unemployment and inflation rates from 1961 to 1968. It is easy to see the inverse relationship between these two variables.3. Beginning in the late 1960s, the government followed policies that increased aggregate demand.a. Government spending rose because of the Vietnam War.b. The Fed increased the money supply to try to keep interest rates down.4. As a result of these policies, the inflation rate remained fairly high. However, even thoughinflation remained high, unemployment did not remain low.a. Figure 7 shows the unemployment and inflation rates from 1961 to 1973. The simple inverse relationship between these two variables began to disappear around 1970.b. Inflation expectations adjusted to the higher rate of inflation and the unemployment rate returned to its natural rate of around 5% to 6%.III. Shifts in the Phillips Curve: The Role of Supply ShocksA. In 1974, OPEC increased the price of oil sharply. This increased the cost of producing many goods and services and therefore resulted in higher prices.1. Definition of supply shock : an event that directly alters firms’ costs and prices,shifting the economy’s aggregate -supply curve and thus the Phillips curve .2. Graphically, we could represent this supply shock as a shift in the short-run aggregate-supplycurve to the left.3. The decrease in equilibrium output and the increase in the price level left the economy with stagflation.Chapter 22/The Short-Run Trade-off between Inflation and Unemployment ❖ 397B. Given this turn of events, policymakers are left with a less favorable short-run trade-off between unemployment and inflation.1. If they increase aggregate demand to fight unemployment, they will raise inflation further.2. If they lower aggregate demand to fight inflation, they will raise unemployment further. C. This less favorable trade-off between unemployment and inflation can be shown by a shift of theshort-run Phillips curve. The shift may be permanent or temporary, depending on how people adjust their expectations of inflation.D. During the 1970s, the Fed decided to accommodate the supply shock by increasing the supply of money. This increased the level of expected inflation. Figure 9 shows inflation and unemploymentin the United States during the late 1970s and early 1980s.IV. The Cost of Reducing InflationA. The Sacrifice Ratio1. To reduce the inflation rate, the Fed must follow contractionary monetary policy.a. When the Fed slows the rate of growth of the money supply, aggregate demand falls.b. This reduces the level of output in the economy, increasing unemployment.c. The economy moves from point A along the short-run Phillips curve to point B, which hasa lower inflation rate but a higher unemployment rate.Price Unemployment Rate398❖Chapter 22/The Short-Run Trade-off between Inflation and Unemploymentd. Over time, people begin to adjust their inflation expectations downward and the short-run Phillips curve shifts. The economy moves from point B to point C, where inflation islower and the unemployment rate is back to its natural rate.2. Therefore, to reduce inflation, the economy must suffer through a period of highunemployment and low output.3. Definition of sacrifice ratio: the number of percentage points of annual output lostin the process of reducing inflation by one percentage point.4. A typical estimate of the sacrifice ratio is five. This implies that for each percentage pointinflation is decreased, output falls by 5%.B. Rational Expectations and the Possibility of Costless Disinflation1. Definition of rational expectations: the theory according to which people optimallyuse all the information they have, including information about governmentpolicies, when forecasting the future.2. Proponents of rational expectations believe that when government policies change, peoplealter their expectations about inflation.3. Therefore, if the government makes a credible commitment to a policy of low inflation,people would be rational enough to lower their expectations of inflation immediately. Thisimplies that the short-run Phillips curve would shift quickly without any extended period ofhigh unemployment.C. The Volcker Disinflation1. Figure 11 shows the inflation and unemployment rates that occurred while Paul Volckerworked at reducing the level of inflation during the 1980s.2. As inflation fell, unemployment rose. In fact, the United States experienced its deepest recession since the Great Depression.3. Some economists have offered this as proof that the idea of a costless disinflation suggested by rational-expectations theorists is not possible. However, there are two reasons why we might not want to reject the rational-expectations theory so quickly.a. The cost (in terms of lost output) of the Volcker disinflation was not as large as many economists had predicted.b. While Volcker promised that he would fight inflation, many people did not believe him.Few people thought that inflation would fall as quickly as it did; this likely kept the short-run Phillips curve from shifting quickly.D. The Greenspan Era1. Figure 12 shows the inflation and unemployment rate from 1984 to 2005, called the Greenspan era because Alan Greenspan became the chairman of the Federal Reserve in 1987.2. In 1986, OPEC’s agreement with its members b roke down and oil prices fell. The result of this favorable supply shock was a drop in both inflation and unemployment.3. The rest of the 1990s witnessed a period of economic prosperity. Inflation gradually dropped, approaching zero by the end of the decade. Unemployment also reached a low level, leadingmany people to believe that the natural rate of unemployment had fallen.4. The economy ran into problems in 2001 due to the end of the dot-com stock market bubble,the 9-11 terrorist attacks, and corporate accounting scandals that reduced aggregate demand. Unemployment rose as the economy experienced its first recession in a decade.5. But a combination of expansionary monetary and fiscal policies helped end the downturn,and by early 2005, the unemployment rate was close to the estimated natural rate.6. In 2005, President Bush nominated Ben Bernanke as the Fed chairman. E. A Financial Crisis Takes Us for a Ride Along the Phillips Curve1. In his first couple of years as Fed chairman, Bernanke faced some significant economicchallenges.a. One challenge arose from problems in the housing and financial markets.b. The resulting financial crisis led to a large drop in aggregate demand and high rates of unemployment.c. Figure 13 shows the implications of these events for inflation and unemployment.d. From 2007 to 2009, as the decline in aggregate demand raised unemployment, it alsoreduced the inflation rate from about 3 percent to about 1 percent.e. From 2010 to 2012, unemployment fell and the inflation rate rose from about 1 percentto about 2 percent.f. In essence, the economy first rode down the Phillips curve and then rode back up.g. Note that expected inflation and the position of the short-run Phillips curve wererelatively stable during this period.SOLUTIONS TO TEXT PROBLEMS:Quick Quizzes1. The Phillips curve is shown in Figure 1.Figure 1To see how policy can move the economy from a point with high inflation to a point with lowinflation, suppose the economy begins at point A in Figure 2. If policy is used to reduceaggregate demand (such as a decrease in the money supply or a decrease in governmentpurchases), the aggregate-demand curve shifts from AD1 to AD2, and the economy movesfrom point A to point B with lower inflation, a reduction in real GDP, and an increase in theunemployment rate.Figure 22. Figure 3 shows the short-run Phillips curve and the long-run Phillips curve. The curves aredifferent because in the long run, monetary policy has no effect on unemployment, which tends toward its natural rate. However, in the short run, monetary policy can affect the unemployment rate. An increase in the growth rate of money raises actual inflation above expected inflation, causing firms to produce more since the short-run aggregate supply curve is positively sloped, which reduces unemployment temporarily.Figure 33. Examples of favorable shocks to aggregate supply include improved productivity and adecline in oil prices. Either shock shifts the aggregate-supply curve to the right, increasing output and reducing the price level, moving the economy from point A to point B in Figure 4.As a result, the Phillips curve shifts to the left, as the figure shows.Figure 44. The sacrifice ratio is the number of percentage points of annual output lost in the process ofreducing inflation by 1 percentage point. The credibility of the Fed’s commitment to reduceinflation might affect the sacrifice ratio because it affects the speed at which expectations ofinflati on adjust. If the Fed’s commitment to reduce inflation is credible, people will reducetheir expectations of inflation quickly, the short-run Phillips curve will shift downward, andthe cost of reducing inflation will be low in terms of lost output. But if the Fed is not credible,people will not reduce their expectations of inflation quickly, and the cost of reducinginflation will be high in terms of lost output.Questions for ReviewFigure 51. Figure 5 shows the short-run trade-off between inflation and unemployment. The Fed canmove the economy from one point on this curve to another by changing the money supply.An increase in the money supply reduces the unemployment rate and increases the inflation rate, while a decrease in the money supply increases the unemployment rate and decreases the inflation rate.Figure 62. Figure 6 shows the long-run trade-off between inflation and unemployment. In the long run,there is no trade-off, as the economy must return to the natural rate of unemployment on the long-run Phillips curve. In the short run, the economy can move along a short-run Phillips curve, like SRPC1 shown in the figure. But over time (as inflation expectations adjust) the short-run Phillips curve will shift to return the economy to the long-run Phillips curve, for example shifting from SRPC1 to SRPC2.3. The natural rate of unemployment is natural because it is beyond the influence of monetarypolicy. The rate of unemployment will move to its natural rate in the long run, regardless of the inflation rate.The natural rate of unemployment might differ across countries because countries havevarying degrees of union power, minimum-wage laws, collective-bargaining laws,unemployment insurance, job-training programs, and other factors that influence labor-market conditions.4. If a drought destroys farm crops and drives up the price of food, the short-run aggregate-supply curve shifts to the left and the short-run Phillips curve shifts to the right, because the costs of production have increased. The higher short-run Phillips curve means the inflation rate will be higher for any given unemployment rate.5. When the Fed decides to reduce inflation, the economy moves down along the short-runPhillips curve, as shown in Figure 7. Beginning at point A on short-run Phillips curve SRPC1, the economy moves down to point B as inflation declines. Once people's expectations adjust to the lower rate of inflation, the short-run Phillips curve shifts to SRPC2, and the economy moves to point C. The short-run costs of disinflation, which arise because the unemployment rate is temporarily above its natural rate, could be reduced if the Fed's action was credible, so that expectations would adjust more rapidly.Figure 7Quick Check Multiple Choice1. b2. d3. c4. a5. b6. dProblems and Applications1. Figure 8 shows two different short-run Phillips curves depicting these four points. Points aand d are on SRPC1 because both have expected inflation of 3%. Points b and c are onSRPC2 because both have expected inflation of 5%.Figure 82. a. A rise in the natural rate of unemployment shifts both the long-run Phillips curve and theshort-run Phillips curve to the right, as shown in Figure 9. The economy is initially onLRPC1 and SRPC1 at an inflation rate of 3%, which is also the expected rate of inflation.The increase in the natural rate of unemployment shifts the long-run Phillips curve toLRPC2 and the short-run Phillips curve to SRPC2, with the expected rate of inflationremaining equal to 3%.Figure 9b. A decline in the price of imported oil shifts the short-run Phillips curve to the left, asshown in Figure 10, from SRPC1 to SRPC2. For any given unemployment rate, theinflation rate is lower, because oil is such a significant aspect of production costs in the economy.Figure 10c. A rise in government spending represents an increase in aggregate demand, so it movesthe economy along the short-run Phillips curve, as shown in Figure 11. The economy moves from point A to point B, with a decline in the unemployment rate and an increase in the inflation rate.Figure 11d. A decline in expected inflation causes the short-run Phillips curve to shift to the left, asshown in Figure 12. The lower rate of expected inflation shifts the short-run Phillips curve from SRPC1 to SRPC2.Figure 12Figure 133. a. Figure 13 shows how a reduction in consumer spending causes a recession in both anaggregate-supply/aggregate-demand diagram and a Phillips-curve diagram. In bothdiagrams, the economy begins at full employment at point A. The decline in consumerspending reduces aggregate demand, shifting the aggregate-demand curve to the leftfrom AD1 to AD2. The economy initially remains on the short-run aggregate-supply curve AS1, so the new equilibrium occurs at point B. The movement of the aggregate-demand curve along the short-run aggregate-supply curve leads to a movement along short-run Phillips curve SRPC1, from point A to point B. The lower price level in the aggregate-supply/aggregate-demand diagram corresponds to the lower inflation rate in the Phillips-curve diagram. The lower level of output in the aggregate-supply/aggregate-demanddiagram corresponds to the higher unemployment rate in the Phillips-curve diagram.b. As expected inflation falls over time, the short-run aggregate-supply curve shifts to theright from AS1 to AS2, and the short-run Phillips curve shifts to the left from SRPC1 toSRPC2. In both diagrams, the economy eventually gets to point C, which is back on thelong-run aggregate-supply curve and long-run Phillips curve. After the recession is over, the economy faces a better set of inflation-unemployment combinations.Figure 144. a. Figure 14 shows the economy in long-run equilibrium at point a, which is on both thelong-run and short-run Phillips curves.b. A wave of business pessimism reduces aggregate demand, moving the economy to pointb in the figure. The unemployment rate increases and the inflation rate declines. If theFed undertakes expansionary monetary policy, it can increase aggregate demand,offsetting the pessimism and returning the economy to point a, with the initial inflationrate and unemployment rate.c. Figure 15 shows the effects on the economy if the price of imported oil rises. The higherprice of imported oil shifts the short-run Phillips curve to the right from SRPC1 to SRPC2.The economy moves from point a to point c, with a higher inflation rate and higherunemployment rate. If the Fed engages in expansionary monetary policy, it can returnthe economy to its original unemployment rate at point d, but the inflation rate will behigher. If the Fed engages in contractionary monetary policy, it can return the economy to its original inflation rate at point e, but the unemployment rate will be higher. Thissituation differs from that in part (b) because in part (b) the economy stayed on thesame short-run Phillips curve, but in part (c) the economy moved to a higher short-runPhillips curve, which gives policymakers a less favorable trade-off between inflation and unemployment.。
曼昆经济学原理英⽂版⽂案加习题答案29章THE MONETARY SYSTEMWHAT’S NEW IN THE S EVENTH EDITION:There is a new In the News box on ―Why Gold?‖LEARNING OBJECTIVES:By the end of this chapter, students should understand:what money is and what functions money has in the economy.what the Federal Reserve System is.how the banking system helps determine the supply of money.what tools the Federal Reserve uses to alter the supply of money.CONTEXT AND PURPOSE:Chapter 16 is the first chapter in a two-chapter sequence dealing with money and prices in the long run. Chapter 16 describes what money is and develops how the Federal Reserve controls the quantity of money. Because the quantity of money influences the rate of inflation in the long run, the followingchapter concentrates on the causes and costs of inflation.The purpose of Chapter 16 is to help students develop an understanding of what money is, what forms money takes, how the banking system helps create money, and how the Federal Reserve controls the quantity of money. An understanding of money is important because the quantity of money affects inflation and interest rates in the long run, and production and employment in the short run.KEY POINTS:The term money refers to assets that people regularly use to buy goods and services.Money serves three functions. As a medium of exchange, it is the item used to make transactions. Asa unit of account, it provides the way in which prices and other economic values are recorded. As astore of value, it offers a way to transfer purchasing power from the present to the future.264Chapter 16/The Monetary System ? 265Commodity money, such as gold, is money that has intrinsic value: It would be valued even if it were not used as money. Fiat money, such as paper dollars, is money without intrinsic value: It would be worthless if it were not used as money.In the U.S. economy, money takes the form of currency and various types of bank deposits, such as checking accounts. The Federal Reserve, the central bank of the United States, is responsible for regulating the U.S. monetary system. The Fed chairman is appointed by the president and confirmed by Congress every four years. The chairman is the lead member of the Federal Open Market Committee, which meets about every six weeks to consider changes in monetary policy.Bank depositors provide resources to banks by depositing their funds into bank accounts. These deposits are part of a bank’s liabilities. Bank owners also provide resources (called bank capital) for the bank. Because of leverage (the use of borrowed funds for investment), a small change in the value of a bank’s assets can lead to a large change in the value of the bank’s capital. To protect depositors, bank regulators require banks to hold a certain minimum amount of capital.The Fed controls the money supply primarily through open-market operations. The purchase of government bonds increases the money supply, and the sale of government bonds decreases the money supply. The Fed also uses other tools to control the money supply. It can expand the money supply by decreasing the discount rate, increasing its lending to banks, lowering reserverequirements, or decreasing the interest rate on reserves. It can contract the money supply by increasing the discount rate, decreasing its lending to banks, raising reserve requirements or increasing the interest rate on reserves.When individuals deposit money in banks and banks loan out some of these deposits, the quantity of money in the economy increases. Because the banking system influences the money supply in this way, the Fed’s control of the money supply is imperfect.The Federal Reserve has in recent years set monetary policy by choosing a target for the federal funds rate, a short-term interest rate at which banks make loans to one another. As the Fed achieves its target, it adjusts the money supply. CHAPTER OUTLINE:I. The Meaning of Money266?Chapter 16/The Monetary SystemA. Definition of money: the set of assets in an economy that people regularly use to buygoods and services from other people.B. The Functions of Money1. Money serves three functions in our economy.a. Definition of medium of exchange: an item that buyers give to sellers when theywant to purchase goods and services.b. Definition of unit of account: the yardstick people use to post prices and recorddebts.c. Definition of store of value: an item that people can use to transfer purchasingpower from the present to the future.2. Definition of liquidity: the ease with which an asset can be converted into theeconomy’s medium of exchange.a. Money is the most liquid asset available.b. Other assets (such as stocks, bonds, and real estate) vary in their liquidity.c. When people decide how to allocate their wealth, they must balance the liquidity of each possible asset against t he asset’s usefulness as a store of value.C. The Kinds of Money1. Definition of commodity money: money that takes the form of a commodity withintrinsic value.2. Definition of fiat money: money without intrinsic value that is used as moneybecause of government decree.3. In the News: Why Gold?a. Historically, societies have used gold, rather than other commodities, for commodity money.b. This article from NPR Morning Edition describes why gold is the best choice for commodity money.D. Money in the U.S. Economy1. The quantity of money circulating in the United States is sometimes called the money stock.2. Included in the measure of the money supply are currency, demand deposits, and other monetary assets.a. Definition of currency: the paper bills and coins in the hands of the public.b. Definition of demand deposits: balances in bank accounts that depositors canaccess on demand by writing a check.Chapter 16/The Monetary System?2673. Figure 1 shows the monetary assets included in two important measures of the money supply, M1 and M2.4. FYI: Why Credit Cards Aren’t Moneya. Credit cards are not a form of money; when a person uses a credit card, he or she issimply deferring payment for the item.b. Because using a debit card is like writing a check, the account balances that lie behind debit cards are included in the measures of money.5. Case Study: Where Is All the Currency?a. If we divide the amount of outstanding currency in the United States by the adult population, we find that the average adult should have approximately $4,490 in currency.b. Of course, most adults carry a much smaller amount.c. One explanation is that a great deal of U.S. currency may be held in other countries.d. Another explanation is that large amounts of currency may be held by criminals because transactions that use currency leave no paper trail.II. The Federal Reserve SystemA. Definition of Federal Reserve (Fed): the central bank of the United States.B. Definition of central bank: An institution designed to oversee the banking system and regulate the quantity of money in the economy.268?Chapter 16/The Monetary SystemC. The Fed’s Organization1. The Fed is run by a Board of Governors with 7 members who serve 14-year terms.a. The Board of Governors has a chairman who is appointed for a four-year term.b. The current chairman is Ben Bernanke.Chapter 16/The Monetary System ? 2692. The Federal Reserve System is made up of 12 regional Federal Reserve Banks located in major cities around the country.3. One job performed by the Fed is the regulation of banks to ensure the health of the nation’s banking system.a. The Fed monitors each bank's financial condition and facilitates bank transactions byclearing checks.b. The Fed also makes loans to banks when they want to borrow.4. The second job of the Fed is to control the quantity of money available in the economy.a. Definition of money supply: the quantity of money available in the economy .b. Definition of monetary policy: the setting of the money supply by policymakersin the central bank .D. The Federal Open Market Committee1. The Federal Open Market Committee (FOMC) consists of the 7 members of the Board ofGovernors and 5 of the 12 regional bank presidents. 2. The primary way in which the Fed increases or decreases the number of dollars in theeconomy is through open market operations (which involve the purchase or sale of U.S. government bonds).a. If the Fed wants to increase the supply of money, it creates dollars and uses them topurchase government bonds from the public through the nation's bond markets.b. If the Fed wants to lower the supply of money, it sells government bonds from itsportfolio to the public. Money is then taken out of the hands of the public and the supply of money falls.III. Banks and the Money Supply270 ? Chapter 16/The Monetary SystemA. The Simple Case of 100-Percent-Reserve Banking 1. Example: Suppose that currency is the only form of money and the total amount of currencyis $100. 2. A bank is created as a safe place to store currency; all deposits are kept in the vault until thedepositor withdraws them.a. Definition of reserves: deposits that banks have received but have not loanedout . b. Under the example described above, we have 100-percent-reserve banking.3. The financial position of the bank can be described with a T-account:4. The money supply in this economy is unchanged by the creation of a bank.a. Before the bank was created, the money supply consisted of $100 worth of currency.b. Now, with the bank, the money supply consists of $100 worth of deposits.5. This means that, if banks hold all deposits in reserve, banks do not influence the supply of money. B. Money Creation with Fractional-Reserve Banking1. Definition of fractional-reserve banking: a banking system in which banks hold onlya fraction of deposits as reserves .2. Definition of reserve ratio: the fraction of deposits that banks hold as reserves .3. Example: Same as before, but First National decides to set its reserve ratio equal to 10% andlend the remainder of the deposits.4. The bank’s T -account would look like this:Chapter 16/The Monetary System ? 2715. When the bank makes these loans, the money supply changes.a. Before the bank made any loans, the money supply was equal to the $100 worth ofdeposits.b. Now, after the loans, deposits are still equal to $100, but borrowers now also hold $90worth of currency from the loans.c. Therefore, when banks hold only a fraction of deposits in reserve, banks create money. 6. Note that, while new money has been created, so has debt. There is no new wealth createdby this process. C. The Money Multiplier1. The creation of money does not stop at this point.2. Borrowers usually borrow money to purchase something and then the money likely becomesredeposited at a bank.3. Suppose a person borrowed the $90 to purchase something and the funds then getredeposited in Second National Bank. Here is this bank’s T -account (assuming that it also sets its reserve ratio to 10%):4.If the $81 in loans becomes redeposited in another bank, this process will go on and on. 5. Each time the money is deposited and a bank loan is created, more money is created.6. Definition of money multiplier: the amount of money the banking system generateswith each dollar of reserves .7. In our example, the money supply increased from $100 to $1,000 after the establishment of fractional-reserve banking.ALTERNATIVE CLASSROOM EXAMPLE:Reserve ratio = 12.5%Money multiplier = 1/0.125 = 8272?Chapter 16/The Monetary SystemD. Bank Capital, Leverage, and the Financial Crisis of 2008–20091. In reality, banks also get funds from issuing debt and equity.2. Definition of bank capital: the resources a bank’s owners have put into theinstitution.3. A more realistic balance sheet for a bank:4. Definition of leverage: the use of borrowed money to supplement existing funds for purposes of investment.5. Definition of leverage ratio: the ratio of assets to bank capital.a. The leverage ratio is $1,000/$50 = 20.b. A leverage ratio of 20 means that, for every dollar of capital that has been contributed by the owners, the bank has $20 of assets.c. Because of leverage, a small chang e in assets can lead to a large change in owner’s equity.6. Definition of capital requirement: a government regulation specifying a minimumamount of bank capital.7. In 2008 and 2009, many banks realized they had incurred sizable losses on some of their assets.IV. The Fed’s Tools of Monetary ControlA. How the Fed Influences the Quantity of Reserves1. Open-Market Operationsa. Definition of open-market operations: the purchase and sale of U.S. governmentbonds by the Fed.b. If the Fed wants to increase the supply of money, it creates dollars and uses them to purchase government bonds from the public in the nation's bond markets.c. If the Fed wants to lower the supply of money, it sells government bonds from its portfolio to the public in the nation's bond markets. Money is then taken out of the handsof the public and the supply of money falls.d. If the sale or purchase of government bonds affects the amount of deposits in the banking system, the effect will be made larger by the money multiplier.Chapter 16/The Monetary System?273e. Open market operations are easy for the Fed to conduct and are therefore the tool of monetary policy that the Fed uses most often.2. Fed Lending to Banksa. The Fed can also lend reserves to banks.b. Definition of discount rate: the interest rate on the loans that the Fed makes tobanks.c. A higher discount rate discourages banks from borrowing from the Fed and likely encourages banks to hold onto larger amounts of reserves. This in turn lowers themoney supply.d. A lower discount rate encourages banks to lend their reserves (and borrow from the Fed). This will increase the money supply.e. In recent years, the Fed has set up new mechanisms for banks to borrow from the Fed.B. How the Fed Influences the Reserve Ratio1. Reserve Requirementsa. Definition of reserve requirements: regulations on the minimum amount ofreserves that banks must hold against deposits.b. This can affect the size of the money supply through changes in the money multiplier.c. The Fed rarely uses this tool because of the disruptions in the banking industry that would be caused by frequent alterations of reserve requirements. (It is also not effective when banks hold a lot of excess reserves.)2. Paying Interest on Reservesa. In October of 2008, the Fed began paying banks interest on reserves.b. The higher the interest rate, the more reserves a bank will want to hold. This will reducethe money multiplier and the money supply.C. Problems in Controlling the Money Supply1. The Fed does not control the amount of money that consumers choose to deposit in banks.a. The more money that households deposit, the more reserves the banks have, and the more money the banking system can create.b. The less money that households deposit, the less reserves banks have, and the less money the banking system can create.274?Chapter 16/The Monetary System2. The Fed does not control the amount that bankers choose to lend.a. The amount of money created by the banking system depends on loans being made.b. If banks choose to hold onto a greater level of reserves than required by the Fed (called excess reserves), the money supply will fall.3. Therefore, in a system of fractional-reserve banking, the amount of money in the economy depends in part on the behavior of depositors and bankers.4. Because the Fed cannot control or perfectly predict this behavior, it cannot perfectly control the money supply.D. Case Study: Bank Runs and the Money Supply1. Bank runs create a large problem under fractional-reserve banking.2. Because the bank only holds a fraction of its deposits in reserve, it will not have the funds to satisfy all of the withdrawal requests from its depositors.3. Today, deposits are guaranteed through the Federal Depository Insurance Corporation (FDIC).Chapter 16/The Monetary System?275E. The Federal Funds Rate1. Definition of federal funds rate:the short-term interest rate that banks charge one another for loans.2. When the federal funds rate rises or falls, other interest rates often move in the same direction.3. In recent years, the Fed has set a target for the federal funds rate.F. In the News: Bernanke on the Fed’s Toolbox1. During the financial crisis of 2008 and 2009, the Fed expanded reserves to help struggling banks.2. This is an article written by Fed chairman, Ben Bernanke, discussing the Fed’s options for reversing this policy once the economy recovers from this deep recession.276?Chapter 16/The Monetary SystemSOLUTIONS TO TEXT PROBLEMS:Quick Quizzes1. The three functions of money are: (1) medium of exchange; (2) unit of account; and (3) store of value. Money is a medium of exchange because money is the item people use to purchase goods and services. Money is a unit of account because it is the yardstick people use to post prices and record debts. Money is a store of value because people use it totransfer purchasing power from the present to the future.2. The primary responsibilities of the Federal Reserve are to regulate banks, to ensure thehealth of the banking system, and to control the quantity of money that is made available inthe economy. If the Fed wants to increase the supply of money, it usually does so bycreating dollars and using them to purchase government bonds from the public in thenation’s bond markets.3. Banks create money when they hold a fraction of their deposits in reserve and lend out theremainder. If the Fed wanted to use all of its tools to decrease the money supply, it would:(1) sell government bonds from its portfolio in the open market to reduce the number ofdollars in circulation; (2) increase reserve requirements to reduce the money created bybanks; (3) increase the interest rate it pays on reserves to increase the reserves banks willchoose to hold; and (4) increase the discount rate to discourage banks from borrowingreserves from the Fed.Questions for Review1. Money is different from other assets in the economy because it is the most liquid assetavailable. Other assets vary widely in their liquidity.2. Commodity money is money with intrinsic value, like gold, which can be used for purposesother than as a medium of exchange. Fiat money is money without intrinsic value; it has novalue other than its use as a medium of exchange. Our economy uses fiat money.3. Demand deposits are balances in bank accounts that depositors can access on demandsimply by writing a check or using a debit card. They should be included in the supply ofmoney because they can be used as a medium of exchange.4. The Federal Open Market Committee (FOMC) is responsible for setting monetary policy in theUnited States. The FOMC consists of the 7 members of the Federal Reserve Board ofGovernors and 5 of the 12 presidents of Federal Reserve Banks. Members of the Board ofGovernors are appointed by the president of the United States and confirmed by the U.S.Senate. The presidents of the Federal Reserve Banks are chosen by each bank’s board ofdirectors.5. If the Fed wants to increase the supply of money with open-market operations, it purchasesU.S. government bonds from the public on the open market. The purchase increases thenumber of dollars in the hands of the public, thus raising the money supply.6. Banks do not hold 100% reserves because it is more profitable to use the reserves to makeloans, which earn interest, instead of leaving the money as reserves. The amount of reservesChapter 16/The Monetary System?277 banks hold is related to the amount of money the banking system creates through the moneymultiplier. The smaller the fraction of reserves banks hold, the larger the money multiplier,because each dollar of reserves is used to create more money.7. Bank B will show a larger change in bank capital. The decrease in assets will render Bank B insolvent because its assets will fall below its liabilities, a decrease in bank capital of 140%. Bank A will suffer a large decline in bank capital (70%) but will remain solvent.8. The discount rate is the interest rate on loans that the Federal Reserve makes to banks. If the Fed raises the discount rate, fewer banks will borrow from the Fed, so both banks' reserves and the money supply will be lower.9. Reserve requirements are regulations on the minimum amount of reserves that banks must hold against deposits. An increase in reserve requirements raises the reserve ratio, lowersthe money multiplier, and decreases the money supply.10. The Fed cannot control the money supply perfectly because: (1) the Fed does not control the amount of money that households choose to hold as deposits in banks; and (2) the Fed does not control the amount that bankers choose to lend. The actions of households and banks affect the money supply in ways the Fed cannot perfectly control or predict.Quick Check Multiple Choice1. c2. c3. d4. a5. c6. aProblems and Applications1. a. A U.S. penny is considered money in the U.S. economy because it is used as a mediumof exchange to buy goods or services, it serves as a unit of account because prices instores are listed in terms of dollars and cents, and it serves as a store of value foranyone who holds it over time.b. A Mexican peso is not considered money in the U.S. economy, because it is not used as a medium of exchange, and prices are not given in terms of pesos, so it is not a unit of account. It could serve as a store of value, though.c. A Picasso painting is not considered money, because you cannot exchange it for goods or services, and prices are not given in terms of Picasso paintings. It does, however, serveas a store of value.d. A plastic credit card is similar to money, but represents deferred payment rather than immediate payment. So credit cards do not fully represent the medium of exchangefunction of money, nor are they stores of value, because they represent short-term loansrather than being an asset like currency.278?Chapter 16/The Monetary System2. When your uncle repays a $100 loan from Tenth National Bank (TNB) by writing a check from his TNB checking account, the result is a change in the assets and liabilities of both your uncle and TNB, as shown in these T-accounts:By paying off the loan, your uncle simply eliminated the outstanding loan using the assets in his checking account. Your uncle's wealth has not changed; he simply has fewer assets and fewer liabilities.3. a. Here is BSB's T-account:b. When BSB's largest depositor withdraws $10 million in cash and BSB reduces its loans outstanding to maintain the same reserve ratio, its T-account is now:c. Because BSB is cutting back on its loans, other banks will find themselves short of reserves and they may also cut back on their loans as well.d. BSB may find it difficult to cut back on its loans immediately, because it cannot force people to pay off loans. Instead, it can stop making new loans. But for a time it mightfind itself with more loans than it wants. It could try to attract additional deposits to get additional reserves, or borrow from another bank or from the Fed.4. If you take $100 that you held as currency and put it into the banking system, then the total amount of deposits in the banking system increases by $1,000, because a reserve ratio of 10% means the money multiplier is 1/0.10 = 10. Thus, the money supply increases by $900, because deposits increase by $1,000 but currency declines by $100.Chapter 16/The Monetary System?279 5. a.b. The leverage ratio = $1,000/$200 = 5.c.d. Assets decline by 9%. The bank's capital declines by 45%. The reduction in bank capitalis larger than the reduction in assets because all of the defaulted loans are covered bybank capital.6. With a required reserve ratio of 10%, the money multiplier could be as high as 1/0.10 = 10,if banks hold no excess reserves and people do not keep some additional currency. So the maximum increase in the money supply from a $10 million open-market purchase is $100 million. The smallest possible increase is $10 million if all of the money is held by banks as excess reserves.7. The money supply will expand more if the Fed buys $2,000 worth of bonds. Both depositswill lead to monetary expansion, b ut the Fed’s deposit is new money. With a 5% reserve requirement, the multiplier is 20 (1/0.05). The $2,000 from the Fed will increase the money supply by $40,000 ($2,000 x 20). The $2,000 from the cookie jar is already part of themoney supply as currency. When it is deposited the money supply increases by $38,000.Deposits increase by $40,000 ($2,000 x 20) but currency decreases by $2,000.8. a. With a required reserve ratio of 10% and no excess reserves, the money multiplier is1/0.10 = 10. If the Fed sells $1 million of government bonds, reserves will decline by $1 million and the money supply will contract by 10 × $1 million = $10 million.b. Banks might wish to hold excess reserves if they need to hold the reserves for their day-to-day operations, such as paying other banks for customers' transactions, makingchange, cashing paychecks, and so on. If banks increase excess reserves such that there is no overall change in the total reserve ratio, then the money multiplier does not change and there is no effect on the money supply.9. a. With banks holding only required reserves of 10%, the money multiplier is 1/0.10 = 10.Because reserves are $100 billion, the money supply is 10 × $100 billion = $1,000 billion or $1 trillion.b. If the required reserve ratio is raised to 20%, the money multiplier declines to 1/0.20 = 5.With reserves of $100 billion, the money supply would decline to $500 billion, a declineof $500 billion. Reserves would be unchanged.10. a. To expand the money supply, the Fed should buy bonds.280?Chapter 16/The Monetary Systemb. With a reserve requirement of 20%, the money multiplier is 1/0.20 = 5. Therefore toexpand the money supply by $40 million, the Fed should buy $40 million/5 = $8 millionworth of bonds.11. a. If people hold all money as currency, the quantity of money is $2,000.b. If people hold all money as demand deposits at banks with 100% reserves, the quantity of money is $2,000.c. If people have $1,000 in currency and $1,000 in demand deposits, the quantity of money is $2,000.d. If banks have a reserve ratio of 10%, the money multiplier is 1/0.10 = 10. So if people hold all money as demand deposits, the quantity of money is 10 × $2,000 = $20,000.e. If people hold equal amounts of currency (C) and demand deposits (D) and the money multiplier for reserves is 10, then two equations must be satisfied:(1) C = D, so that people have equal amounts of currency and demand deposits; and (2) 10 × ($2,000 –C) = D, so that the money multiplier (10) times the number of dollar bills that are not being held by people ($2,000 –C) equals the amount of demand deposits (D). Using the first equation in the second gives 10 × ($2,000 –D) = D, or $20,000 –10D = D, or $20,000 = 11 D, so D = $1,818.18. Then C = $1,818.18. The quantity of money is C + D = $3,636.36.。
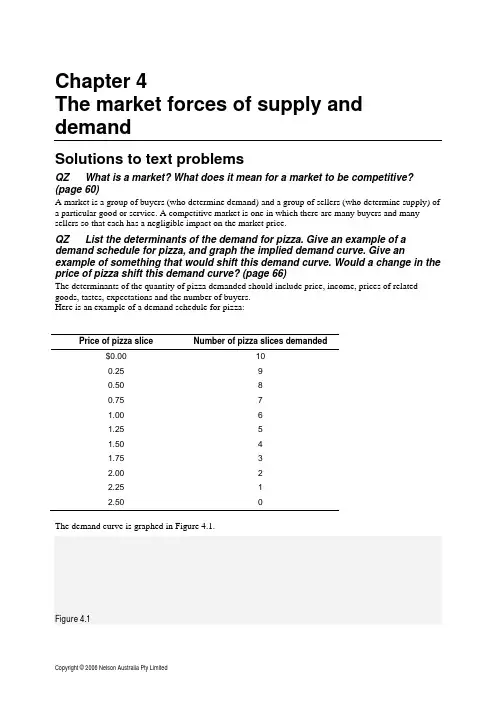
Chapter 4The market forces of supply and demandSolutions to text problemsQZ What is a market? What does it mean for a market to be competitive? (page 60)A market is a group of buyers (who determine demand) and a group of sellers (who determine supply) of a particular good or service. A competitive market is one in which there are many buyers and many sellers so that each has a negligible impact on the market price.QZ List the determinants of the demand for pizza. Give an example of a demand schedule for pizza, and graph the implied demand curve. Give an example of something that would shift this demand curve. Would a change in the price of pizza shift this demand curve? (page 66)The determinants of the quantity of pizza demanded should include price, income, prices of related goods, tastes, expectations and the number of buyers.Here is an example of a demand schedule for pizza:Price of pizza slice Number of pizza slices demanded$0.00 100.25 90.50 80.75 71.00 61.25 51.50 41.75 32.00 22.25 12.50 0The demand curve is graphed in Figure 4.1.Figure 4.1Chapter 4: The market forces of supply and demand 31Examples of things that would shift the demand curve include changes in income, prices of related goods like soft drink or hot dogs, tastes, and expectations about future income or prices.A change in the price of pizza would not shift this demand curve; it would only move from one point to another along the curve.QZ List the determinants of the supply of pizza. Give an example of a supply schedule for pizza, and graph the implied supply curve. Give an example of something that would shift this supply curve. Would a change in the price of pizza shift this supply curve? (page 71)The determinants of the quantity of pizza supplied include the price of pizza, the prices of inputs into pizza production, the technology for producing pizza, expectations about things like the future price of pizza and the number of suppliers of pizza.Here is an example of a supply schedule for pizza:Price of pizza slice Number of pizza slices supplied$0.00 00.25 1000.50 2000.75 3001.00 4001.25 5001.50 6001.75 7002.00 8002.25 9002.50 1000The supply curve is graphed in Figure 4.2.Figure 4.232 Principles of Economics, Third edition, Instructor’s ManualExamples of things that would shift the supply curve include changes in prices of inputs like tomato sauce and cheese, changes in technology like more efficient pizza ovens or automatic dough makers, and changes in expectations about the future price of pizza.A change in the price of pizza would not shift this supply curve; it would only move from one point to another along the curve.QZ Analyse what happens to the market for pizza if the price of tomatoes rises. Analyse what happens to the market for pizza if the price of hamburgers falls. (page 75)If the price of tomatoes rises, the supply curve for pizza shifts to the left because of the increased price of an input into pizza production, however there is no effect on demand. The shift to the left of the supply curve causes the equilibrium price to rise and the equilibrium quantity to decline, as Figure 4.3 shows.Figure 4.3Chapter 4: The market forces of supply and demand 33 If the price of hamburgers falls, the demand curve for pizza shifts to the left because the lower price of hamburgers will lead consumers to buy more hamburgers and less pizza, but there is no effect on supply. The shift to the left of the demand curve causes the equilibrium price to fall and the equilibrium quantity to decline, as Figure 4.4 shows.Figure 4.434 Principles of Economics, Third edition, Instructor’s ManualQuestions for review (page 79)1 A competitive market is a market in which there are many buyers and many sellers so that each has anegligible impact on the market price.2The quantity of a good that buyers demand is determined by the price of the good, income, the prices of related goods, tastes, expectations and the number of buyers.3The demand schedule is a table that shows the relationship between the price of a good and the quantity demanded. The demand curve is the downward-sloping line relating price and quantity demanded. The demand schedule and demand curve are related because the demand curve is simplya graph showing the points in the demand schedule.4The demand curve slopes downward because of the law of demand—other things equal, when the price of a good rises, the quantity demanded of the good falls. People buy less of a good when its price rises, both because they can't afford to buy as much and because they switch to purchasing other goods.5 A change in consumers' tastes leads to a shift of the demand curve. A change in price leads to amovement along the demand curve.6The quantity of a good that sellers supply is determined by the price of the good, input prices, technology, expectations and the number of suppliers.7 A supply schedule is a table showing the relationship between the price of a good and the quantity aproducer is willing and able to supply. The supply curve is the upward-sloping line relating price and quantity supplied. The supply schedule and the supply curve are related because the supply curve is simply a graph showing the points in the supply schedule.8The supply curve slopes upward because when the price is high, suppliers' profits increase, so they supply more output to the market. The result is the law of supply—other things equal, when the price of a good rises, the quantity supplied of the good also rises.9 A change in producers' technology leads to a shift in the supply curve. A change in price leads to amovement along the supply curve.10The equilibrium of a market is the point at which the demand and supply curves intersect. At the equilibrium price, the quantity of the good that buyers are willing and able to buy exactly balances the quantity that sellers are willing and able to sell. If the price is above the equilibrium price, sellers want to sell more than buyers want to buy, so there is a surplus. Sellers try to increase their sales by cutting prices; that continues until they reach the equilibrium price. If the price is below theequilibrium price, buyers want to buy more than sellers want to sell, so there is a shortage. Sellers can raise their price without losing customers; that continues until they reach the equilibrium price. 11When the price of beer rises, the demand for pies declines, because beer and pies are complements and people want to buy less beer. When we say the demand for pies declines, we mean that the demand curve for pies shifts to the left as in Figure 4.5 below. The supply curve for pies isn'taffected. With a shift to the left in the demand curve, the equilibrium price and quantity both decline, as the figure shows. Thus the quantity of pies supplied and demanded both fall. In summary, supply is unchanged, demand is decreased, quantity supplied declines, quantity demanded declines, and the price falls.Chapter 4: The market forces of supply and demand 35Figure 4.512 Prices play a vital role in market economies because they bring markets into equilibrium. If the priceis different from its equilibrium level, quantity supplied and quantity demanded aren't equal. The resulting surplus or shortage leads suppliers to adjust the price until equilibrium is restored. Prices thus serve as signals that guide economic decisions and allocate scarce resources.Problems and applications (page 80)1 a The cyclone damages the banana harvest, reducing the supply of bananas. This can be seen inFigure 4.6 as a shift to the left in the supply curve for bananas. The new equilibrium price is higher than the old equilibrium price. Figure 4.6P r i c e o f p i e sQuantity of bananasP r i c e o f b a n a n a sQuantity of pies36 Principles of Economics, Third edition, Instructor’s Manualb People often go to the pictures during school holidays so demand for picture tickets is highduring school holidays. When school holidays end, fewer people go to the pictures. The result, as shown in Figure 4.7, is a shift to the left in the demand curve. The equilibrium price of picture tickets is thus lower when school holidays end, as the figure shows. Figure 4.7c When a war breaks out in the Middle East, many markets are affected. Since much oilproduction takes place there, the war disrupts oil supplies, shifting the supply curve for petrol tothe left, as shown in Figure 4.8. The result is a rise in the equilibrium price of petrol. With a higher price for petrol, the cost of operating a big car, like a Ford Falcon, will increase. As a result, the demand for used Ford Falcons will decline, as people in the market for cars won't find Falcons as attractive. In addition, some people who already own Falcons will try to sell them. The result is that the demand curve for used Falcons shifts to the left, while the supply curve shifts to the right, as shown in Figure 4.9. The result is a decline in the equilibrium price of used Falcons.Figure 4.8Quantity of theatre tickets P r i c e o f t h e a t r e t i c k e t sP r i c e o f p e t r o l Quantity of petrolChapter 4: The market forces of supply and demand 37Figure 4.92 The statement that ‘an increase in the demand for notebooks raises the quantity of notebooksdemanded, but not the quantity supplied’ is false, in general. As Figure 4.10 shows, the increase in demand for notebooks results in an increased quantity supplied. The only way the statement would be true is if the supply curve were perfectly inelastic, as shown in Figure 4.11. Figure 4.10P r i c e o f u s e d F o r d F a l c o n sQuantity of used Ford Falcons38 Principles of Economics, Third edition, Instructor’s ManualFigure 4.113 a If people decide to have more children (a change in tastes), they'll want larger vehicles forhauling their kids around, so the demand for station wagons will increase. Supply won't be affected. The result is a rise in both price and quantity, as Figure 4.12 shows. Figure 4.12Quantity of Station WagonsP r i c e o f S t a t i o n W a g o n sChapter 4: The market forces of supply and demand 39b If a strike by steelworkers raises steel prices, the costs of producing a station wagon rise (a risein input prices), so the supply of station wagons decreases. Demand won't be affected. The result is a rise in the price of station wagons and a decline in the quantity, as Figure 4.13 shows.Figure 4.13c The development of new automated machinery for the production of station wagons is animprovement in technology. The reduction in firms' costs results in an increase in supply. Demand isn't affected. The result is a decline in the price of station wagons and an increase in the quantity, as Figure 4.14 shows.Figure 4.14d The rise in the price of minivans affects station wagon demand because minivans are substitutesfor station wagons (that is, there's a rise in the price of a related good). The result is an increase in demand for station wagons. Supply isn't affected. In equilibrium, the price and quantity of station wagons both rise, as Figure 4.12 shows.P r i c e o f S t a t i o n W a g o n sQuantity of Station WagonsP r i c e o f S t a t i o n W a g o n sQuantity of Station Wagonse The reduction in peoples' wealth caused by a stock market crash reduces their income, leading toa reduction in the demand for station wagons, since station wagons are a normal good. Supply isn’t affected. As a result, both price and quantity decline, as Figure 4.15 shows. Figure 4.154 Technological advances that reduce the cost of producing computer chips represent a decline in aninput price for producing a computer. The result is a shift to the right in the supply of computers, as shown in Figure 4.16. The equilibrium price falls and the equilibrium quantity rises, as the figure shows. Figure 4.16Quantity of Station WagonsP r i c e o f S t a t i o n W a g o n sSince computer software is a complement to computers, the increased equilibrium quantity of computers increases the demand for software. As Figure 4.17 shows, the result is a rise in both the equilibrium price and quantity of software.Figure 4.17Since typewriters are substitutes for computers, the increased equilibrium quantity of computers reduces the demand for typewriters. As Figure 4.18 shows, the result is a decline in both theequilibrium price and quantity of typewriters.Figure 4.185 a When an outbreak of ‘foot and mouth’ disease hits sheep farms in New Zealand, it raises inputprices for producing woollen jumpers. As a result, the supply of woollen jumpers shifts to the left, as shown in Figure 4.19. The new equilibrium has a higher price and lower quantity of woollen jumpers. Figure 4.19b A decline in the price of leather jackets leads more people to buy leather jackets, reducing thedemand for woollen jumpers. The result, shown in Figure 4.20, is a decline in both theequilibrium price and quantity of woollen jumpers.Figure 4.20Quantity of woollen jumpers P r i c e o f w o o l l e n j u m p e r sQuantity of woollen jumpersP r i c e o f w o o l l e n j u m p e r sc Kylie wearing a woollen jumper raises the demand for woollen jumpers, as shown in Figure4.21. The result is an increase in both the equilibrium price and quantity of woollen jumpers. Figure 4.21d The invention of new knitting machines increases the supply of woollen jumpers. As Figure 4.22shows, the result is a reduction in the equilibrium price and an increase in the equilibriumquantity of woollen jumpers.Figure 4.22P r i c e o f W o o l l e n J u m p e r sQuantity of Woollen Jumpers Quantity of Woollen JumpersP r i c e o f W o o l l e n J u m p e r s6 A temporarily high birth rate in the year 2005 leads to opposite effects on the price of babysittingservices in the years 2010 and 2020. In the year 2010, there are more 5-year-olds who need sitters, so the demand for babysitting services rises, as shown in Figure 4.23. The result is a higher price for babysitting services in 2010. However, in the year 2020, the increased number of 15-year-olds shifts the supply of babysitting services to the right, as shown in Figure 4.24. The result is a decline in the price of babysitting services.Figure 4.23Figure 4.247Since tomato sauce is a complement for hot dogs, when the price of hot dogs rises, the quantity demanded of hot dogs falls, thus reducing the demand for tomato sauce, causing both price and quantity of tomato sauce to fall. Since the quantity of tomato sauce falls, the demand for tomatoes by tomato sauce producers falls, so both price and quantity of tomatoes fall. When the price of tomatoes falls, producers of tomato juice face lower input prices, so the supply curve for tomato juice shifts down, causing the price of tomato juice to fall and the quantity of tomato juice to rise. The fall in the price of tomato juice causes people to substitute tomato juice for orange juice, so the demand for orange juice declines, causing the price and quantity of orange juice to fall. Now you can see clearly why a rise in the price of hot dogs leads to a fall in price of orange juice!8 a Cigars and chewing tobacco are substitutes for cigarettes, since a higher price for cigaretteswould increase demand for cigars and pipe tobacco.b An increase in the tax on cigarettes leads to increased demand for cigars and pipe tobacco. Theresult, as shown in Figure 4.25 for cigars, is a rise in both the equilibrium price and quantity of cigars and pipe tobacco.Figure 4.25c The results in part (b) showed that a tax on cigarettes leads people to substitute cigars and pipetobacco for cigarettes when the tax on cigarettes rises. To reduce total tobacco usage,policymakers might also want to increase the tax on cigars and pipe tobacco, or pursue sometype of public education program.9Quantity supplied equals quantity demanded at a price of $6 and quantity of 81 pizzas (Figure 4.26).If price were greater than $6, quantity supplied would exceed quantity demanded, so suppliers would reduce their price to gain sales. If price were less than $6, quantity demanded would exceed quantity supplied, so suppliers could raise their price without losing sales. In both cases, the price would continue to adjust until it reached $6, the only price at which there is neither surplus nor shortage. Figure 4.2610 a If the price of flour falls, since flour is an ingredient in bagels, the supply curve for bagels wouldshift to the right. The result, shown in Figure 4.27, would be a fall in the price of bagels and arise in the equilibrium quantity of bagels. Since cream cheese is a complement to bagels, the rise in quantity demanded of bagels increases the demand for cream cheese, as shown in Figure 4.28.The result is a rise in both the equilibrium price and quantity of cream cheese. So, a fall in theprice of flour indeed raises both the equilibrium price of cream cheese and the equilibriumquantity of bagels.Figure 4.27Figure 4.28What happens if the price of milk falls? Since milk is an ingredient in cream cheese, the fall in the price of milk leads to an increase in the supply of cream cheese. This leads to a decrease in the price of cream cheese (Figure 4.29), rather than a rise in the price of cream cheese. So a fall in the price of milk couldn't have been responsible for the pattern observed.Figure 4.29b In part (a), we found that a fall in the price of flour led to a rise in the price of cream cheese anda rise in the equilibrium quantity of bagels. If the price of flour rose, the opposite would be true;it would lead to a fall in the price of cream cheese and a fall in the equilibrium quantity ofbagels. Since the question says the equilibrium price of cream cheese has risen, it couldn't have been caused by a rise in the price of flour.What happens if the price of milk rises? From part (a), we found that a fall in the price of milk caused a decline in the price of cream cheese, so a rise in the price of milk would cause a rise in the price of cream cheese. Since bagels and cream cheese are complements, the rise in the price of cream cheese would reduce the demand for bagels, as Figure 4.30 shows. The result is adecline in the equilibrium quantity of bagels. So a rise in the price of milk does cause both a rise in the price of cream cheese and a decline in the equilibrium quantity of bagels.Figure 4.3011 a As Figure 4.31 shows, the supply curve is vertical. The constant supply makes sense because thepicture theatre has a fixed number of seats no matter what the price.Figure 4.31b Quantity supplied equals quantity demanded at a price of $8. The equilibrium quantity is 800tickets. cPriceQuantity demandedQuantity supplied$4 1400 800 8 1100 800 12 800 800 16 500 800 20 200800The new equilibrium price will be $12, which equates quantity demanded to quantity supplied. The equilibrium quantity is 800 tickets.P r i c e o f p i c t u r e t h e a t r e t i c k e t sQuantity of picture theatre tickets 80012The executives are confusing changes in demand with changes in quantity demanded. Figure 4.32 shows the demand curve prior to the marketing campaign (D1), and after the campaign (D2). The marketing campaign increased the demand for champagne, as shown, leading to a higher equilibrium price and quantity. The influence of the higher price on demand is already reflected in the outcome.It's impossible for the scenario outlined by the executives to occur.Figure 4.3213 At equilibrium Q S=Q D. Therefore here:1400 + 700P = 1600 – 300P1000P = 200P = $0.20The equilibrium price is $0.20 per bar of chocolate. Substitute this into either Q S or Q D to get the equilibrium quantity of 1540 bars of chocolate.。
51WHAT’S NEW IN THE S EVENTH EDITION:The In the News feature “Price Increases after Disasters” has been updated with a new article.LEARNING OBJECTIVES:By the end of this chapter, students should understand:➢ what a competitive market is.➢ what determines the demand for a good in a competitive market.➢ what determines the supply of a good in a competitive market.➢ how supply and demand together set the price of a good and the quantity sold.➢ the key role of prices in allocating scarce resources in market economies.CONTEXT AND PURPOSE:Chapter 4 is the first chapter in a three-chapter sequence that deals with supply and demand and how markets work. Chapter 4 shows how supply and demand for a good determines both the quantity produced and the price at which the good sells. Chapter 5 will add precision to the discussion of supply and demand by addressing the concept of elasticity —the sensitivity of the quantity supplied and quantity demanded to changes in economic variables. Chapter 6 will address the impact of government policies on prices and quantities in markets.The purpose of Chapter 4 is to establish the model of supply and demand. The model of supply and demand is the foundation for the discussion for the remainder of this text. For this reason, time spent studying the concepts in this chapter will return benefits to your students throughout their study of economics. Many instructors would argue that this chapter is the most important chapter in the text.THE MARKET FORCES OF SUPPLY AND DEMAND52 ❖Chapter 4/The Market Forces of Supply and DemandKEY POINTS:• Economists use the model of supply and demand to analyze competitive markets. In a competitive market, there are many buyers and sellers, each of whom has little or no influence on the market price.• The demand curve shows how the quantity of a good demanded depends on the price. According to the law of demand, as the price of a good falls, the quantity demanded rises. Therefore, the demand curve slopes downward.• In addition to price, other determinants of how much consumers want to buy include income, the prices of substitutes and complements, tastes, expectations, and the number of buyers. If one of these factors changes, the demand curve shifts.• The supply curve shows how the quantity of a good supplied depends on the price. According to the law of supply, as the price of a good rises, the quantity supplied rises. Therefore, the supply curve slopes upward.• In addition to price, other determinants of how much producers want to sell include input prices, technology, expectations, and the number of sellers. If one of these factors changes, the supply curve shifts.• The intersection of the supply and demand curves determines the market equilibrium. At the equilibrium price, the quantity demanded equals the quantity supplied.• The behavior of buyers and sellers naturally drives markets toward their equilibrium. When the market price is above the equilibrium price, there is a surplus of the good, which causes the market price to fall. When the market price is below the equilibrium price, there is a shortage, which causes the market price to rise.• To analyze how any event influences a market, we use the supply-and-demand diagram to examine how the event affects equilibrium price and quantity. To do this we follow three steps. First, we decide whether the event shifts the supply curve or the demand curve (or both). Second, we decide which direction the curve shifts. Third, we compare the new equilibrium with the initial equilibrium.• In market economies, prices are the signals that guide economic decisions and thereby allocate scarce resources. For every good in the economy, the price ensures that supply and demand are in balance. The equilibrium price then determines how much of the good buyers choose to consume and how much sellers choose to produce.Chapter 4/The Market Forces of Supply and Demand ❖ 53CHAPTER OUTLINE: I. Markets and CompetitionA. What Is a Market?1. Definition of market: a group of buyers and sellers of a particular good or service.2. Markets can take many forms and may be organized (agricultural commodities) or lessorganized (ice creamB. What Is Competition?1. Definition of competitive market: a market in which there are so many buyers andso many sellers that each has a negligible impact on the market price.2. Each buyer knows that there are several sellers from which to choose. Sellers know that each buyer purchases only a small amount of the total amount sold.C. In this chapter, we will assume that markets are perfectly competitive.1. Characteristics of a perfectly competitive market:a. The goods being offered for sale are exactly the same.b. The buyers and sellers are so numerous that no single buyer or seller has any influence over the market price.2. Because buyers and sellers must accept the market price as given, they are often called "price takers."3. Not all goods are sold in a perfectly competitive market.a. A market with only one seller is called a monopoly market.b. Other markets fall between perfect competition and monopoly.54 ❖ Chapter 4/The Market Forces of Supply and DemandD. We will start by studying perfect competition.1. Perfectly competitive markets are the easiest to analyze because buyers and sellers take the price as a given.2. Because some degree of competition is present in most markets, many of the lessons that we learn by studying supply and demand under perfect competition apply in morecomplicated markets.II. DemandA. The Demand Curve: The Relationship between Price and Quantity Demanded1. Definition of quantity demanded: the amount of a good that buyers are willing andable to purchase.2. One important determinant of quantity demanded is the price of the product.a. Quantity demanded is negatively related to price. This implies that the demand curve isdownward sloping.b. Definition of law of demand: the claim that, other things being equal, thequantity demanded of a good falls when the price of the good rises .3. Definition of demand schedule: a table that shows the relationship between theprice of a good and the quantity demanded. Price of Ice-Cream ConeQuantity of Cones Demanded$0.0012 $0.5010 $1.008 $1.506 $2.004 $2.502 $3.00Figure 1Make sure that you explain that, when we discuss the relationship between quantity demanded and price, we hold all other variables constant. You will need toemphasize this more than once to ensure that students understand why a change inprice leads to a movement along the demand curve.Chapter 4/The Market Forces of Supply and Demand ❖ 554. Definition of demand curve: a graph of the relationship between the price of a good and the quantity demanded.a. Price is generally drawn on the vertical axis.b. Quantity demanded is represented on the horizontal axis. B. Market Demand versus Individual Demand1. The market demand is the sum of all of the individual demands for a particular good orservice.2. The demand curves are summed horizontally —meaning that the quantities demanded are added up for each level of price.3. The market demand curve shows how the total quantity demanded of a good varies with the price of the good, holding constant all other factors that affect how much consumers want to buy.C. Shifts in the Demand Curve1. Because the market demand curve holds other things constant, it need not be stable overtime.56 ❖ Chapter 4/The Market Forces of Supply and Demand2. If any of these other factors change, the demand curve will shift.a. An increase in demand is represented by a shift of the demand curve to the right.b. A decrease in demand is represented by a shift of the demand curve to the left.3. Incomea. The relationship between income and quantity demanded depends on what type of good the product is.b. Definition of normal good: a good for which, other things equal, an increase in income leads to an increase in demand.c. Definition of inferior good: a good for which, other things equal, an increase inincome leads to a decrease in demand.4. Prices of Related Goodsa. Definition of substitutes: two goods for which an increase in the price of one good leads to an increase in the demand for the other.b. Definition of complements: two goods for which an increase in the price of one good leads to a decrease in the demand for the other.5. Tastes6. Expectationsa. Future incomeb. Future prices7. Number of BuyersChapter 4/The Market Forces of Supply and Demand ❖57D. Case Study: Two Ways to Reduce the Quantity of Smoking Demanded1. Public service announcements, mandatory health warnings on cigarette packages, and theprohibition of cigarette advertising on television are policies designed to reduce the demandfor cigarettes (and shift the demand curve to the left).2. Raising the price of cigarettes (through tobacco taxes) lowers the quantity of cigarettesdemanded.a. The demand curve does not shift in this case, however.b. An increase in the price of cigarettes can be shown by a movement along the originaldemand curve.3. Studies have shown that a 10% increase in the price of cigarettes causes a 4% reduction inthe quantity of cigarettes demanded. For teens, a 10% increase in price leads to a 12% dropin quantity demanded.4. Studies have also shown that a decrease in the price of cigarettes is associated with greateruse of marijuana. Thus, it appears that tobacco and marijuana are complements.III. SupplyA. The Supply Curve: The Relationship between Price and Quantity Supplied1. Definition of quantity supplied: the amount of a good that sellers are willing andable to sell.a. Quantity supplied is positively related to price. This implies that the supply curve will beupward sloping.b. Definition of law of supply: the claim that, other things equal, the quantitysupplied of a good rises when the price of the good rises.2. Definition of supply schedule: a table that shows the relationship between the priceof a good and the quantity supplied.58 ❖ Chapter 4/The Market Forces of Supply and Demand3. Definition of supply curve: a graph of the relationship between the price of a good and the quantity supplied. Price of Ice-Cream ConeQuantity of Cones Supplied$0.000 $0.50 0 $1.001 $1.502 $2.003 $2.504 $3.005B. Market Supply versus Individual Supply1. The market supply curve can be found by summing individual supply curves.2. Individual supply curves are summed horizontally at every price.3. The market supply curve shows how the total quantity supplied varies as the price of thegood varies.C. Shifts in the Supply Curve1. Because the market supply curve holds other things constant, the supply curve will shift ifany of these factors changes.a. An increase in supply is represented by a shift of the supply curve to the right.b. A decrease in supply is represented by a shift of the supply curve to the left.Figure 5Figure 7Figure 6You will want to take time to emphasize the difference between a “change in supply” and a “change in quantity supplied.”Chapter 4/The Market Forces of Supply and Demand ❖ 592. Input Prices3. Technology4. Expectations5. Number of Sellers IV. Supply and Demand TogetherA. Equilibrium1. The point where the supply and demand curves intersect is called the market’s equilibrium.2. Definition of equilibrium: a situation in which the market price has reached thelevel at which quantity supplied equals quantity demanded.3. Definition of equilibrium price: the price that balances quantity supplied andquantity demanded.4. The equilibrium price is often called the "market-clearing" price because both buyers andsellers are satisfied at this price.Table 2Figure 8 Students will benefit from seeing equilibrium using both a graph and a supply-and-demand schedule. The schedule will also make it easier for students to understand concepts such as shortages and surpluses.60 ❖Chapter 4/The Market Forces of Supply and Demand5. Definition of equilibrium quantity: the quantity supplied and the quantitydemanded at the equilibrium price.6. If the actual market price is higher than the equilibrium price, there will be a surplus of thegood.Figure 9a. Definition of surplus: a situation in which quantity supplied is greater thanquantity demanded.b. To eliminate the surplus, producers will lower the price until the market reachesequilibrium.7. If the actual price is lower than the equilibrium price, there will be a shortage of the good.a. Definition of shortage: a situation in which quantity demanded is greater thanquantity supplied.b. Sellers will respond to the shortage by raising the price of the good until the marketreaches equilibrium.8. Definition of the law of supply and demand: the claim that the price of any goodadjusts to bring the supply and demand for that good into balance.B. Three Steps to Analyzing Changes in Equilibrium 1. Decide whether the event shifts the supply or demand curve (or perhaps both). 2. Determine the direction in which the curve shifts.3. Use the supply-and-demand diagram to see how the shift changes the equilibrium price andquantity. C. Example: A change in market equilibrium due to a shift in demand —the effect of hot weather onthe market for ice cream.D. Shifts in Curves versus Movements along Curves1. A shift in the demand curve is called a "change in demand." A shift in the supply curve iscalled a "change in supply."2. A movement along a fixed demand curve is called a "change in quantity demanded." Amovement along a fixed supply curve is called a "change in quantity supplied." E. Example: A change in market equilibrium due to a shift in supply —the effect of a hurricane thatdestroys part of the sugar-cane crop and drives up the price of sugar.F. Example: Shifts in both supply and demand —the effect of hot weather and a hurricane thatdestroys part of the sugar cane crop. G. Summary1. When an event shifts the supply or demand curve, we can examine the effects on theequilibrium price and quantity.ALTERNATIVE CLASSROOM EXAMPLE:Go through these examples of events that would shift either the demand or supply of #2 lead pencils:▪ an increase in the income of consumers▪ an increase in the use of standardized exams (using opscan forms) ▪ a decrease in the price of graphite (used in the production of pencils) ▪ a decrease in the price of ink pens ▪ the start of a school year▪ new technology that lowers the cost of producing pencils.2. Table 4 reports the end results of these shifts in supply and demand.H. In the News: Price Increases after Disasters1. When a disaster strikes a region, many good experience an increase in demand or a decreasein supply resulting in upward pressure on prices.2. This article from defends price increases following natural disasters as a naturalresult of market interactions.V. Conclusion: How Prices Allocate ResourcesA. The model of supply and demand is a powerful tool for analyzing markets.B. Supply and demand together determine the prices of the economy’s goods and services.1. These prices serve as signals that guide the allocation of scarce resources in the economy.2. Prices determine who produces each good and how much of each good is produced.SOLUTIONS TO TEXT PROBLEMS:Quick Quizzes1. A market is a group of buyers (who determine demand) and a group of sellers (whodetermine supply) of a particular good or service. A perfectly competitive market is one inwhich there are many buyers and many sellers of an identical product so that each has anegligible impact on the market price.2. Here is an example of a monthly demand schedule for pizza:Price of Pizza Slice Number of Pizza Slices Demanded$ 0.00 100.25 90.50 80.75 71.00 61.25 51.50 41.75 32.00 22.25 12.50 0The demand curve is graphed in Figure 1.Figure 1Examples of things that would shift the demand curve include changes in income, prices ofrelated goods like soda or hot dogs, tastes, expectations about future income or prices, andthe number of buyers.A change in the price of pizza would not shift this demand curve; it would only lead to amovement from one point to another along the same demand curve.3. Here is an example of a monthly supply schedule for pizza:Price of Pizza Slice Number of PizzaSlices Supplied$ 0.00 00.25 1000.50 2000.75 3001.00 4001.25 5001.50 6001.75 7002.00 8002.25 9002.50 1000The supply curve is graphed in Figure 2.Figure 2Figure 3Examples of things that would shift the supply curve include changes in prices of inputs like tomato sauce and cheese, changes in technology like more efficient pizza ovens or automatic dough makers, changes in expectations about the future price of pizza, or a change in the number of sellers.A change in the price of pizza would not shift this supply curve; it would only lead to amovement from one point to another along the same supply curve.4. If the price of tomatoes rises, the supply curve for pizza shifts to the left because there hasbeen an increase in the price of an input into pizza production, but there is no shift indemand. The shift to the left of the supply curve causes the equilibrium price to rise and the equilibrium quantity to decline, as Figure 3 shows.If the price of hamburgers falls, the demand curve for pizza shifts to the left because thelower price of hamburgers will lead consumers to buy more hamburgers and fewer pizzas,but there is no shift in supply. The shift to the left of the demand curve causes theequilibrium price to fall and the equilibrium quantity to decline, as Figure 4 shows.Figure 4Questions for Review1. A competitive market is a market in which there are many buyers and many sellers of anidentical product so that each has a negligible impact on the market price. Another type ofmarket is a monopoly, in which there is only one seller. There are also other markets that fallbetween perfect competition and monopoly.2. The demand schedule is a table that shows the relationship between the price of a good andthe quantity demanded. The demand curve is the downward-sloping line relating price andquantity demanded. The demand schedule and demand curve are related because thedemand curve is simply a graph showing the points in the demand schedule.The demand curve slopes downward because of the law of demand—other things beingequal, when the price of a good rises, the quantity demanded of the good falls. People buyless of a good when its price rises, both because they cannot afford to buy as much andbecause they switch to purchasing other goods.3. A change in consumers' tastes leads to a shift of the demand curve. If the change inconsumers' tastes leads to an increase in demand, consumers want to buy more of this goodat every price level. A change in price leads to a movement along the demand curve.Because price is measured on the vertical axis, a change in the price represents a movementalong the demand curve.4. Because Popeye buys more spinach when his income falls, spinach is an inferior good for him.His demand curve for spinach shifts out to the right as a result of the decrease in his income.5. A supply schedule is a table showing the relationship between the price of a good and thequantity a producer is willing and able to supply. The supply curve is the upward-sloping linerelating price and quantity supplied. The supply schedule and the supply curve are related because the supply curve is simply a graph showing the points in the supply schedule.The supply curve slopes upward because when the price is high, suppliers' profits increase, so they supply more output to the market. The result is the law of supply—other things being equal, when the price of a good rises, the quantity supplied of the good also rises.6. A change in producers' technology leads to a shift in the supply curve. A change in priceleads to a movement along the supply curve.7. The equilibrium of a market is the point at which the quantity demanded is equal to quantitysupplied. If the price is above the equilibrium price, sellers want to sell more than buyers want to buy, so there is a surplus. Sellers try to increase their sales by cutting prices. That continues until they reach the equilibrium price. If the price is below the equilibrium price, buyers want to buy more than sellers want to sell, so there is a shortage. Sellers can raise their price without losing customers. That continues until they reach the equilibrium price.8. When the price of beer rises, the demand for pizza declines, because beer and pizza arecomplements and people want to buy less beer. When we say the demand for pizza declines, we mean that the demand curve for pizza shifts to the left as in Figure 5. The supply curve for pizza is not affected. With a shift to the left in the demand curve, the equilibrium price and quantity both decline, as the figure shows. Thus, the quantity of pizza supplied anddemanded both fall. In sum, supply is unchanged, demand is decreased, quantity supplied declines, quantity demanded declines, and the price falls.Figure 59. Prices play a vital role in market economies because they bring markets into equilibrium. Ifthe price is different from its equilibrium level, quantity supplied and quantity demanded are not equal. The resulting surplus or shortage leads suppliers to adjust the price untilequilibrium is restored. Prices thus serve as signals that guide economic decisions andallocate scarce resources.Quick Check Multiple Choice1. b2. b3. d4. b5. a6. cProblems and Applications1. a. Cold weather damages the orange crop, reducing the supply of oranges and raising theprice of oranges. This leads to a decline in the supply of orange juice because orangesare an important input in the production of orange juice. This can be seen in Figure 6 asa shift to the left in the supply curve for orange juice. The new equilibrium price is higherthan the old equilibrium price.Figure 6b. People often travel to the Caribbean from New England to escape cold weather, so thedemand for Caribbean hotel rooms is high in the winter. In the summer, fewer peopletravel to the Caribbean, because northern climates are more pleasant. The result, asshown in Figure 7, is a shift to the left in the demand curve. The equilibrium price ofCaribbean hotel rooms is thus lower in the summer than in the winter, as the figureshows.Figure 7c. When a war breaks out in the Middle East, many markets are affected. Because a largeproportion of oil production takes place there, the war disrupts oil supplies, shifting thesupply curve for gasoline to the left, as shown in Figure 8. The result is a rise in theequilibrium price of gasoline. With a higher price for gasoline, the cost of operating agas-guzzling automobile like a Cadillac will increase. As a result, the demand for usedCadillacs will decline, as people in the market for cars will not find Cadillacs as attractive.In addition, some people who already own Cadillacs will try to sell them. The result isthat the demand curve for used Cadillacs shifts to the left, while the supply curve shifts to the right, as shown in Figure 9. The result is a decline in the equilibrium price of used Cadillacs.Figure 8 Figure 92. The statement is false. As Figure 10 shows, in equilibrium the increase in demand fornotebooks results in an increased quantity demanded and the quantity supplied.Figure 10 Figure 113. a. If people decide to have more children, they will want larger vehicles for hauling theirkids around, so the demand for minivans will increase. Supply will not be affected. The result is a rise in both the price and the quantity sold, as Figure 12 shows.Figure 12 Figure 13b. If a strike by steelworkers raises steel prices, the cost of producing a minivan rises andthe supply of minivans decreases. Demand will not be affected. The result is a rise in the price of minivans and a decline in the quantity sold, as Figure 13 shows.c. The development of new automated machinery for the production of minivans is animprovement in technology. This reduction in firms' costs will result in an increase in supply. Demand is not affected. The result is a decline in the price of minivans and an increase in the quantity sold, as Figure 14 shows.Figure 14d. The rise in the price of sport utility vehicles affects minivan demand because sport utilityvehicles are substitutes for minivans. The result is an increase in demand for minivans.Supply is not affected. The equilibrium price and quantity of minivans both rise, as Figure12 shows.e. The reduction in peoples' wealth caused by a stock-market crash reduces their income,leading to a reduction in the demand for minivans, because minivans are likely a normal good. Supply is not affected. As a result, both the equilibrium price and the equilibrium quantity decline, as Figure 15 shows.Figure 154. a. DVDs and TV screens are likely to be complements because you cannot watch a DVDwithout a television. DVDs and movie tickets are likely to be substitutes because a movie can be watched at a theater or at home. TV screens and movie tickets are likely to besubstitutes for the same reason.b. The technological improvement would reduce the cost of producing a TV screen, shiftingthe supply curve to the right. The demand curve would not be affected. The result is that the equilibrium price will fall, while the equilibrium quantity will rise. This is shown inFigure 16.Figure 16c. The reduction in the price of TV screens would lead to an increase in the demand forDVDs because TV screens and DVDs are complements. The effect of this increase in the demand for DVDs is an increase in both the equilibrium price and quantity, as shown inFigure 17.Figure 17The reduction in the price of TV screens would cause a decline in the demand for movie tickets because TV screens and movie tickets are substitute goods. The decline in thedemand for movie tickets would lead to a decline in the equilibrium price and quantitysold. This is shown in Figure 18.Figure 185. Technological advances that reduce the cost of producing computer chips represent a declinein an input price for producing a computer. The result is a shift to the right in the supply of computers, as shown in Figure 19. The equilibrium price falls and the equilibrium quantity rises, as the figure shows.Figure 19Because computer software is a complement to computers, the lower equilibrium price of computers increases the demand for software. As Figure 20 shows, the result is a rise in both the equilibrium price and quantity of software.Figure 20Because typewriters are substitutes for computers, the lower equilibrium price of computers reduces the demand for typewriters. As Figure 21 shows, the result is a decline in both the equilibrium price and quantity of typewriters.Figure 216. a. When a hurricane in South Carolina damages the cotton crop, it raises input prices forproducing sweatshirts. As a result, the supply of sweatshirts shifts to the left, as shownin Figure 22. The new equilibrium price is higher and the new equilibrium quantity ofsweatshirts is lower.。
104WHAT’S NEW IN THE SIXTH EDITION:There is a new In the News feature on “Should Unpaid Internships Be Allowed ?”LEARNING OBJECTIVES:By the end of this chapter , students should understand:➢ the effects of government policies that place a ceiling on prices 。
➢ the effects of government policies that put a floor under prices.➢ how a tax on a good affects the price of the good and the quantity sold 。
➢ that taxes levied on sellers and taxes levied on buyers are equivalent 。
➢ how the burden of a tax is split between buyers and sellers 。
CONTEXT AND PURPOSE :Chapter 6 is the third chapter in a three-chapter sequence that deals with supply and demand and how markets work. Chapter 4 developed the model of supply and demand 。
Chapter 5 added precision to the model of supply and demand by developing the concept of elasticity —the sensitivity of the quantitysupplied and quantity demanded to changes in economic conditions 。
1WHAT’S NEW:The discussions of Principle #4, “People respond to incentives,” Principle #7, “Governments cansometimes improve market outcomes,” and Principle #10, “Society faces a s hort-run tradeoff between inflation and unemployment” have been shortened. A definition for the term “business cycle” has been added. A new FYI box on “How to Read This Book” has been added and provides students with tips on studying.LEARNING OBJECTIVES: By the end of this chapter, students should understand:➢ that economics is about the allocation of scarce resources.➢ that individuals face tradeoffs.➢ the meaning of opportunity cost.➢ how to use marginal reasoning when making decisions.➢ how incent ives affect people’s behavior.➢ why trade among people or nations can be good for everyone.➢ why markets are a good, but not perfect, way to allocate resources.➢ what determines some trends in the overall economy.CONTEXT AND PURPOSE:Chapter 1 is the first chapter in a three-chapter section that serves as the introduction to the text. Chapter 1 introduces ten fundamental principles on which the study of economics is based. In a broad sense, the rest of the text is an elaboration on these ten principles. Chapter 2 will develop how economists approach problems while Chapter 3 will explain how individuals and countries gain from trade. The purpose of Chapter 1 is to lay out ten economic principles that will serve as building blocks for the rest of the text. The ten principles can be grouped into three categories: how people makedecisions, how people interact, and how the economy works as a whole. Throughout the text, references1 TEN PRINCIPLES OF ECONOMICS2 Chapter 1/Ten Principles of Economicswill be made repeatedly to these ten principles.KEY POINTS:1. The fundamental lessons about individual decisionmaking are that people face tradeoffs among alternative goals, that the cost of any action is measured in terms of forgone opportunities, thatrational people make decisions by comparing marginal costs and marginal benefits, and that people change their behavior in response to the incentives they face.2. The fundamental lessons about interactions among people are that trade can be mutually beneficial,that markets are usually a good way of coordinating trades among people, and that the government can potentially improve market outcomes if there is some sort of market failure or if the market outcome is inequitable.3. The fundamental lessons about the economy as a whole are that productivity is the ultimate sourceof living standards, that money growth is the ultimate source of inflation, and that society faces a short-run tradeoff between inflation and unemployment.CHAPTER OUTLINE:A. The word “economy” comes from the Greek word meaning “one who mana ges a household.”B. This makes some sense since in the economy we are faced with many decisions (just as a household is).C.Fundamental economic problem: resources are scarce. D. Definition of scarcity : the limited nature of society’s resources.E. Definition of economics: the study of how society manages its scarce resources.Chapter 1/Ten Principles of Economics 3A. Principle #1: People Face Tradeoffs1. “There is no such thing as a free lunch.” Making decisions requires trading of fone goal for another.2. Examples include how a student spends her time, how a family decides to spendits income, how the U.S. government spends tax dollars, how regulations mayprotect the environment at a cost to firm owners.3. A special example of a tradeoff is the tradeoff between efficiency and equity.a. Definition of efficiency: the property of society getting the most itcan from its scarce resources.b. Definition of equity: the property of distributing economicprosperity fairly among the members of society.c. For example, tax dollars paid by wealthy Americans and then distributedto those less fortunate may improve equity but lower the return to hardwork and therefore reduce the level of output produced by our resources.d.This implies that the cost of this increased equity is a reduction in theefficient use of our resources.4. Recognizing that tradeoffs exist does not indicate what decisions should be made.B. Principle #2: The Cost of Something Is What You Give Up to Get It1. Making decisions requires individuals to consider the benefits and costs of someaction.2. What are the costs of going to college?a. We cannot count room and board (at least all of the cost) because theperson would have to pay for food and shelter even if he was not inschool.b. We would want to count the value of the student’s time since he couldbe working for pay instead of attending classes and studying.4 Chapter 1/Ten Principles of Economics3. Definition of opportunity cost: whatever must be given up to obtainsome item.C. Principle #3: Rational People Think at the Margin1. Many decisions in life involve incremental decisions: Should I remain in schoolthis semester? Should I take another course this semester? Should I study anadditional hour for tomorrow’s exam?2. Definition of marginal changes: small incremental adjustments to a planof action.3. Example: You are trying to decide how many years you should stay in school.Comparing the lifestyle of an individual with a Ph.D. to that of an individual whohas dropped out of grade school would be inappropriate. You are likely decidingwhether or not to remain in school for an additional year or two. Thus, you needto compare the additional benefits of another year in school (the marginalbenefit) with the additional cost of staying in school for another year (themarginal cost).4. Another example: Suppose that flying a 200-seat plane across the country coststhe airline $100,000, which means that the average cost of each seat is $500.Suppose that the plane is minutes from departure and a passenger is willing topay $300 for a seat. Should the airline sell the seat for $300? In this case, themarginal cost of an additional passenger is very small.D. Principle #4: People Respond to Incentives1. Because people make decisions by weighing costs and benefits, their decisionsmay change in response to changes in costs and benefits.a. When the price of a good rises, consumers will buy less of it because itscost has risen.b. When the price of a good rises, producers will allocate more resources tothe production of the good because the benefit from producing the goodhas risen.2. Sometimes policymakers fail to understand how policies may alter incentives andbehavior.3. Example: Seat belt laws increase use of seat belts and lower the incentives ofindividuals to drive safely. This leads to an increase in the number of caraccidents. This also leads to an increased risk for pedestrians.If you include any incentive-based criteria on your syllabus, discuss it now. Forexample, if you reward class attendance (or penalize students who do not attendclass), explain to students how this change in the marginal benefit of attending classcan be expected to alter their behavior.Chapter 1/Ten Principles of Economics 5III. How People InteractA. Principle #5: Trade Can Make Everyone Better Off1. Trade is not like a sports competition where one side gains and the other sideloses.2. Consider trade that takes place inside your home. Certainly the family isinvolved in trade with other families on a daily basis. Most families do not buildtheir own homes, make their own clothes, or grow their own food.3. Just like families benefit from trading with one another so do countries.4. This occurs because it allows for specialization in areas that countries (or families)can do best.6 Chapter 1/Ten Principles of EconomicsB. Principle #6: Markets Are Usually a Good Way to Organize Economic Activity1. Many countries that once had centrally planned economies have abandoned thissystem and are trying to develop market economies.2. Definition of market economy: an economy that allocates resourcesthrough the decentralized decisions of many firms and households asthey interact in markets for goods and services.Chapter 1/Ten Principles of Economics 73. Market prices reflect both the value of a product to consumers and the cost ofthe resources used to produce it. Therefore, decisions to buy or produce goodsand services are made based on the cost to society of providing them.4. When a government interferes in a market and restricts price from adjustingdecisions that households and firms make are not based on the properinformation. Thus, these decisions may be inefficient.5. Centrally planned economies have failed because they did not allow the marketto work.6. FYI: Adam Smith and the Invisible Handa. Adam Smith’s 1776 work suggested that although individuals aremotivated by self-interest, an invisible hand guides this self- interest intopromoting society’s economic well-being.b. Smith’s astute perceptions will be discussed more fully in the chap ters tocome.C. Principle #7: Governments Can Sometimes Improve Market Outcomes1. There are two broad reasons for the government to interfere with the economy:the promotion of efficiency and equity.2. Government policy can be most useful when there is market failure.a. Definition of market failure: a situation in which a market left onits own fails to allocate resources efficiently.3. Examples of Market Failurea. Definition of externality: the impact of one person’s actions onthe well-being of a bystander.b. Definition of market power: the ability of a single economic actor(or small group of actors) to have a substantial influence onmarket prices.c. Because a market economy rewards people for their ability to producethings that other people are willing to pay for, there will be an unequaldistribution of economic prosperity.8 Chapter 1/Ten Principles of Economics4. Note that the principle states that the government can improve market outcomes.This is not saying that the government always does improve market outcomes. IV. How the Economy as a Whole WorksA. Principle #8: A Country’s Standard of Living Depends on Its Ability to Produce Goods andServices1. Differences in living standards from one country to another are quite large.2. Changes in living standards over time are also great.3. The explanation for differences in living standards lies in differences inproductivity.4. Definition of productivity: the quantity of goods and services producedfrom each hour of a worker’s time.5. High productivity implies a high standard of living.6. Thus, policymakers must understand the impact of any policy on our ability toproduce goods and services.B. Principle #9: Prices Rise When the Government Prints Too Much Money1. Definition of inflation: an increase in the overall level of prices in theeconomy.2. When the government creates a large amount of money, the value of moneyfalls.3. Examples: Germany after World War I (in the early 1920s), the United States inthe 1970s.C. Principle #10: Society Faces a Short-Run Tradeoff between Inflation and Unemployment1. Definition of Phillips curve: a curve that shows the short-run tradeoffbetween inflation and unemployment.2. This is a controversial topic among economists.3. This tradeoff is only temporary but it can last for several years.4. The Phillips curve is important for understanding the business cycle.5. Definition of business cycle: fluctuations in economic activity, such asemployment and production.Chapter 1/Ten Principles of Economics 96. Policymakers can exploit this tradeoff by using various policy instruments, butthe extent and desirability of these interventions is of continuing debate.D. FYI: How to Read this Book1. Economics is very useful to understand, but it can be a difficult subject to grasp.2. There are five tips to make reading and understanding the material inthe book easier.a. Summarize, don’t highlight.b. Test yourself.c. Practice, practice, practice.d. Study in groups.e. Don’t forget the real world.10 Chapter 1/Ten Principles of EconomicsSOLUTIONS TO TEXT PROBLEMS:Quick Quizzes1. The four principles of economic decisionmaking are: (1) people face tradeoffs; (2) the cost ofsomething is what you give up to get it; (3) rational people think at the margin; and (4) peoplerespond to incentives. People face tradeoffs because to get one thing that they like, they usually have to give up another thing that they like. The cost of something is what you give up to get it, not just in terms of monetary costs but all opportunity costs. Rational people think at the margin by taking an action if and only if the marginal benefits exceed the marginal costs. Peoplerespond to incentives because as they compare benefits to costs, a change in incentives maycause their behavior to change.2. The three principles concerning economic interactions are: (1) trade can make everyone betteroff; (2) markets are usually a good way to organize economic activity; and (3) governments can sometimes improve market outcomes. Trade can make everyone better off because it allowscountries to specialize in what they do best and to enjoy a wider variety of goods and services.Markets are usually a good way to organize economic activity because the invisible hand leadsmarkets to desirable outcomes. Governments can sometimes improve market outcomes because sometimes markets fail to allocate resources efficiently because of an externality or market power.3. The three principles that describe how the economy as a whole works are: (1) a country’sstandard of living depends on its ability to produce goods and services; (2) prices rise when thegovernment prints too much money; and (3) society faces a short-run tradeoff between inflation and unemployment. A country’s standard of living depends on its ability to produce goods andservices, which in turn depends on its productivity, which is a function of the education ofworkers and the access workers have to the necessary tools and technology. Prices rise whenthe government prints too much money because more money in circulation reduces the value of money, causing inflation. Society faces a short-run tradeoff between inflation and unemployment that is only temporary and policymakers have some ability to exploit this relationship usingvarious policy instruments.Questions for Review1. Examples of tradeoffs include time tradeoffs (such as studying one subject over another, orstudying at all compared to engaging in social activities) and spending tradeoffs (such as whether to use your last ten dollars on pizza or on a study guide for that tough economics course).2. The opportunity cost of seeing a movie includes the monetary cost of admission plus the timecost of going to the theater and attending the show. The time cost depends on what else youmight do with that time; if it's staying home and watching TV, the time cost may be small, but if it's working an extra three hours at your job, the time cost is the money you could have earned.3. The marginal benefit of a glass of water depends on your circumstances. If you've just run amarathon, or you've been walking in the desert sun for three hours, the marginal benefit is very high. But if you've been drinking a lot of liquids recently, the marginal benefit is quite low. The point is that even the necessities of life, like water, don't always have large marginal benefits.4. Policymakers need to think about incentives so they can understand how people will respond tothe policies they put in place. The text's example of seat belts shows that policy actions canhave quite unintended consequences. If incentives matter a lot, they may lead to a verydifferent type of policy; for example, some economists have suggested putting knives in steering columns so that people will drive much more carefully! While this suggestion is silly, it highlights the importance of incentives.5. Trade among countries isn't a game with some losers and some winners because trade can makeeveryone better off. By allowing specialization, trade between people and trade betweencountries can improve everyone's welfare.6. The "invisible hand" of the marketplace represents the idea that even though individuals andfirms are all acting in their own self-interest, prices and the marketplace guide them to do what is good for society as a whole.7. The two main causes of market failure are externalities and market power. An externality is theimpact of one person’s actions on the well-being of a bystander, such as from pollution or thecreation of knowledge. Market power refers to the ability of a single person (or small group ofpeople) to unduly influence market prices, such as in a town with only one well or only one cable television company. In addition, a market economy also leads to an unequal distribution ofincome.8. Productivity is important because a country's standard of living depends on its ability to producegoods and services. The greater a country's productivity (the amount of goods and servicesproduced from each hour of a worker's time), the greater will be its standard of living.9. Inflation is an increase in the overall level of prices in the economy. Inflation is caused byincreases in the quantity of a nation's money.10. Inflation and unemployment are negatively related in the short run. Reducing inflation entailscosts to society in the form of higher unemployment in the short run.Problems and Applications1. a. A family deciding whether to buy a new car faces a tradeoff between the cost of the carand other things they might want to buy. For example, buying the car might mean theymust give up going on vacation for the next two years. So the real cost of the car is thefamily's opportunity cost in terms of what they must give up.b. For a member of Congress deciding whether to increase spending on national parks, thetradeoff is between parks and other spending items or tax cuts. If more money goesinto the park system, that may mean less spending on national defense or on the policeforce. Or, instead of spending more money on the park system, taxes could be reduced.c. When a company president decides whether to open a new factory, the decision is basedon whether the new factory will increase the firm's profits compared to other alternatives.For example, the company could upgrade existing equipment or expand existing factories.The bottom line is: Which method of expanding production will increase profit the most?d. In deciding how much to prepare for class, a professor faces a tradeoff between thevalue of improving the quality of the lecture compared to other things she could do withher time, such as working on additional research.2. When the benefits of something are psychological, such as going on a vacation, it isn't easy tocompare benefits to costs to determine if it's worth doing. But there are two ways to think aboutthe benefits. One is to compare the vacation with what you would do in its place. If you didn'tgo on vacation, would you buy something like a new set of golf clubs? Then you can decide ifyou'd rather have the new clubs or the vacation. A second way is to think about how much work you had to do to earn the money to pay for the vacation; then you can decide if thepsychological benefits of the vacation were worth the psychological cost of working.3. If you are thinking of going skiing instead of working at your part-time job, the cost of skiingincludes its monetary and time costs, which includes the opportunity cost of the wages you aregiving up by not working. If the choice is between skiing and going to the library to study, then the cost of skiing is its monetary and time costs including the cost to you of getting a lower grade in your course.4. If you spend $100 now instead of saving it for a year and earning 5 percent interest, you aregiving up the opportunity to spend $105 a year from now. The idea that money has a time value is the basis for the field of finance, the subfield of economics that has to do with prices offinancial instruments like stocks and bonds.5. The fact that you've already sunk $5 million isn't relevant to your decision anymore, since thatmoney is gone. What matters now is the chance to earn profits at the margin. If you spendanother $1 million and can generate sales of $3 million, you'll earn $2 million in marginal profit,so you should do so. You are right to think that the project has lost a total of $3 million ($6million in costs and only $3 million in revenue) and you shouldn't have started it. That's true, but if you don't spend the additional $1 million, you won't have any sales and your losses will be $5million. So what matters is not the total profit, but the profit you can earn at the margin. In fact, you'd pay up to $3 million to complete development; any more than that, and you won't beincreasing profit at the margin.6. Harry suggests looking at whether productivity would rise or fall. Productivity is certainlyimportant, since the more productive workers are, the lower the cost per gallon of potion. Ronwants to look at average cost. But both Harry and Ron are missing the other side of theequation−revenue. A firm wants to maximize its profits, so it needs to examine both costs andrevenues. Thus, Hermione is right−it’s best to examine whether the extra revenue wouldexceed the extra costs. Hermione is the only one who is thinking at the margin.7. a. The provision of Social Security benefits lowers an individual’s incentive to save forretirement. The benefits provide some level of income to the individual when he or sheretires. This means that the individual is not entirely dependent on savings to supportconsumption through the years in retirement.b. Since a person gets fewer after-tax Social Security benefits the greater is his or herearnings, there is an incentive not to work (or not work as much) after age 65. Themore you work, the lower your after-tax Social Security benefits will be. Thus thetaxation of Social Security benefits discourages work effort after age 65.8. a. When welfare recipients who are able to work have their benefits cut off after two years,they have greater incentive to find jobs than if their benefits were to last forever.b. The loss of benefits means that someone who can't find a job will get no income at all,so the distribution of income will become less equal. But the economy will be moreefficient, since welfare recipients have a greater incentive to find jobs. Thus the changein the law is one that increases efficiency but reduces equity.9. By specializing in each task, you and your roommate can finish the chores more quickly. If youdivided each task equally, it would take you more time to cook than it would take your roommate, and it would take him more time to clean than it would take you. By specializing, you reduce the total time spent on chores.Similarly, countries can specialize and trade, making both better off. For example, suppose ittakes Spanish workers less time to make clothes than French workers, and French workers canmake wine more efficiently than Spanish workers. Then Spain and France can both benefit ifSpanish workers produce all the clothes and French workers produce all the wine, and theyexchange some wine for some clothes.10. a. Being a central planner is tough! To produce the right number of CDs by the right artistsand deliver them to the right people requires an enormous amount of information. Youneed to know about production techniques and costs in the CD industry. You need toknow each person's musical tastes and which artists they want to hear. If you make thewrong decisions, you'll be producing too many CDs by artists that people don't want tohear, and not enough by others.b. Your decisions about how many CDs to produce carry over to other decisions. You haveto make the right number of CD players for people to use. If you make too many CDsand not enough cassette tapes, people with cassette players will be stuck with CDs theycan't play. The probability of making mistakes is very high. You will also be faced withtough choices about the music industry compared to other parts of the economy. If youproduce more sports equipment, you'll have fewer resources for making CDs. So alldecisions about the economy influence your decisions about CD production.11. a. Efficiency: The market failure comes from the monopoly by the cable TV firm.b. Equityc. Efficiency: An externality arises because secondhand smoke harms nonsmokers.d. Efficiency: The market failure occurs because of Standard Oil's monopoly power.e. Equityf. Efficiency: There is an externality because of accidents caused by drunk drivers.12. a. If everyone were guaranteed the best health care possible, much more of our nation'soutput would be devoted to medical care than is now the case. Would that be efficient?If you think that currently doctors form a monopoly and restrict health care to keep theirincomes high, you might think efficiency would increase by providing more health care.But more likely, if the government mandated increased spending on health care, theeconomy would be less efficient because it would give people more health care than theywould choose to pay for. From the point of view of equity, if poor people are less likelyto have adequate health care, providing more health care would represent animprovement. Each person would have a more even slice of the economic pie, thoughthe pie would consist of more health care and less of other goods.b. When workers are laid off, equity considerations argue for the unemployment benefitssystem to provide them with some income until they can find new jobs. After all, no oneplans to be laid off, so unemployment benefits are a form of insurance. But there’s anefficiency problem why work if you can get income for doing nothing? The economyisn’t operating efficiently if people remain unemployed for a long time, andunemployment benefits encourage unemployment. Thus, there’s a tradeoff betweenequity and efficiency. The more generous are unemployment benefits, the less income islost by an unemployed person, but the more that person is encouraged to remainunemployed. So greater equity reduces efficiency.13. Since average income in the United States has roughly doubled every 35 years, we are likely tohave a better standard of living than our parents, and a much better standard of living than our grandparents. This is mainly the result of increased productivity, so that an hour of workproduces more goods and services than it used to. Thus incomes have continuously risen overtime, as has the standard of living.14. If Americans save more and it leads to more spending on factories, there will be an increase inproduction and productivity, since the same number of workers will have more equipment towork with. The benefits from higher productivity will go to both the workers, who will get paidmore since they're producing more, and the factory owners, who will get a return on theirinvestments. There is no such thing as a free lunch, however, because when people save more, they are giving up spending. They get higher incomes at the cost of buying fewer goods.15. a. If people have more money, they are probably going to spend more on goods andservices.b. If prices are sticky, and people spend more on goods and services, then output mayincrease, as producers increase output to meet the higher demand rather than raisingprices.c. If prices can adjust, then the higher spending of consumers will be matched withincreased prices and output won't rise.16. To make an intelligent decision about whether to reduce inflation, a policymaker would need toknow what causes inflation and unemployment, as well as what determines the tradeoff between them. Any attempt to reduce inflation will likely lead to higher unemployment in the short run. A policymaker thus faces a tradeoff between the benefits of lower inflation compared to the cost of higher unemployment.。
曼昆经济学原理英文版文案加习题答案10章EXTERNALITIESWHAT’S NEW IN THE S EVENTH EDITION:There is a new In the News feature on ―What Should We Do about Climate Change.‖LEARNING OBJECTIVES:By the end of this chapter, students should understand:what an externality is.why externalities can make market outcomes inefficient.the various government policies aimed at solving the problem of externalities.how people can sometimes solve the problem of externalities on their own.why private solutions to externalities sometimes do not work.CONTEXT AND PURPOSE:Chapter 10 is the first chapter in the microeconomic section of the text. It is the first chapter in a three-chapter sequence on the economics of the public sector. Chapter 10 addresses externalities—the uncompensated impact of one person’s actions on the well-being of a bystander. Chapter 11 will address public goods and common resources (goods that will be defined in Chapter 11) and Chapter 12 will address the tax system.In Chapter 10, different sources of externalities and a varietyof potential cures for externalities are addressed. Markets maximize total surplus to buyers and sellers in a market. However, if a market generates an externality (a cost or benefit to someone external to the market) the market equilibrium may not maximize the total benefit to society. Thus, in Chapter 10 we will see that while markets are usually a good way to organize economic activity, governments can sometimes improve market outcomes.182Chapter 10/Externalities ? 183KEY POINTS:When a transaction between a buyer and seller directly affects a third party, the effect is called an externality. If an activity yields negative externalities, such as pollution, the socially optimal quantity in a market is less than the equilibrium quantity. If an activity yields positive externalities, such as technology spillovers, the socially optimal quantity is greater than the equilibrium quantity.Governments pursue various policies to remedy the inefficiencies caused by externalities. Sometimes the government prevents socially inefficient activity by regulating behavior. Other times it internalizes an externality using corrective taxes. Another public policy is to issue permits. For example, the government could protect the environment by issuing a limited number of pollution permits. The result of this policy is largely the same as imposing corrective taxes on polluters.Those affected by externalities can sometimes solve the problem privately. For instance, when one business imposes anexternality on another business, the two businesses can internalize theexternality by merging. Alternatively, the interested parties can solve the problem by negotiating a contract. According to the Coase theorem, if people can bargain without cost, then they can always reach an agreement in which resources are allocated efficiently. In many cases, however, reaching a bargain among the many interested parties is difficult, so the Coase theorem does not apply.CHAPTER OUTLINE:I. Definition of externality : the uncompensated impact of one person’s actions on the well -being of a bystander.A. If the impact on the bystander is adverse, we say that there is a negative externality.B. If the impact on the bystander is beneficial, we say that there is a positive externality.C. In either situation, decisionmakers fail to take account of the external effects of their behavior.II. Externalities and Market InefficiencyA. Welfare Economics: A Recap1. The demand curve for a good reflects the value of that good to consumers, measured by theprice that the marginal buyer is willing to pay.2. The supply curve for a good reflects the cost of producing that good.3. In a free market, the price of a good brings supply and demand into balance in a way thatmaximizes total surplus (the difference between theconsumers’ valuation of the good and the sellers’ cost of producing it).184 ? Chapter 10/ExternalitiesB. Negative Externalities1. Example: An aluminum firm emits pollution during production.2. Social cost is equal to the private cost to the firm of producing the aluminum plus theexternal costs to those bystanders affected by the pollution. Thus, social cost exceeds the private cost paid by producers.3. The optimal amount of aluminum in the market will occur where total surplus is maximized.a. Total surplus is equal to the value of aluminum to consumers minus the cost (social cost)of producing it.b. This will occur where the social-cost curve intersects with demand curve. At this point,producing one more unit would lower total surplus because the value to consumers is less than the cost to produce it.4. Because the supply curve does not reflect the true cost of producing aluminum, the marketwill produce more aluminum than is optimal. 5. This negative externality could be internalized by a tax on producers for each unit ofaluminum sold.ALTERNATIVE CLASSROOM EXAMPLE:A coal-fired power plant emits pollution during production.Chapter 10/Externalities ? 1856. Definition of internalizing an externality: altering incentives so that people takeaccount of the external effects of their actions.7. In the News: The Externalities of Country Livinga. In The Lorax by Dr. Seuss, urbanization is criticized while country living is consideredmore environmentally friendly.b. This article from The New York Times describes research that suggests that city livingmay in fact be ―green er‖ because of the use of public transportation.C. Positive Externalities1. Example: education.2. Education yields positive externalities because better-educated voters lead to a bettergovernment. Crime rates also drop as the education level of the population rises.3. In this case, the demand curve does not reflect the social value of a good.4. If there is a positive externality, the social value of the good is greater than the private value,and the optimum quantity will be greater than the quantity produced in the market.5. To internalize a positive externality, the government could use a subsidy.Figure 3ALTERNATIVE CLASSROOM EXAMPLE:The purchase of a fire extinguisher when an individual lives in an apartment complex This is a good time to discuss why the government taxes goods like alcohol, tobacco, and gasoline. You will find that students have heard the phrase ―sin tax,‖ but they often do not understand why economists might support such taxes (given thedeadweight loss from taxes discussed in Chapter 8).186 ?Chapter 10/Externalities6. Case Study: Technology Spillovers, Industrial Policy, and Patent Protectiona. A technology spillover occurs when one firm’s research and production efforts impactanother firm’s access to technological advance.b. It is difficult to measure the amounts of technology spillover that occur and this leads toa debate over whether or not the government should pursue policies to encourage theproduction of technology.c. Patent protection is a type of technology policy of the government because it protectsthe rights of inventors who create new technologies. Without patents, there would beless incentive to develop new ideas and technologies.III. Public Policies toward ExternalitiesA. When an externality causes a market to reach an inefficient allocation of resources, thegovernment can respond in two ways.1. Command-and-control policies regulate behavior directly.2. Market-based policies provide incentives so that private decisionmakers will choose to solvethe problem on their own.B. Command-and-Control Policies: Regulation1. Externalities can be corrected by requiring or forbidding certain behaviors.2. In the United States, the Environmental Protection Agency (EPA) develops and enforcesregulations aimed at protecting the environment.3. EPA regulations include maximum levels of pollution allowed or required adoption of aparticular technology to reduce emissions.C. Market-Based Policy 1: Corrective Taxes and Subsidies1. Externalities can be internalized through the use of taxes and subsidies.2. Definition of corrective tax: a tax designed to induce private decisionmakers to takeaccount of the social costs that arise from a negative externality.a. These taxes are preferred by economists over regulation, because firms that can reducepollution with the least cost are likely to do so (to avoid the tax) while firms thatencounter high costs when reducing pollution will simply pay the tax.b. Thus, this tax allows firms that face the highest cost of reducing pollution to continue topollute while encouraging less pollution over all.Chapter 10/Externalities ?187c. Unlike other taxes, corrective taxes do not cause a reduction in total surplus. In fact,they increase economic well-being by forcing decisionmakers to take into account thecost of all of the resources being used when making decisions.3. Case Study: Why Is Gasoline Taxed So Heavily?a. In the United States, almost half of what drivers pay for gasoline goes to gas taxes.b. This is to correct for three negative externalities associated with driving: congestion,accidents, and pollution.D. Market-Based Policy 2: Tradable Pollution Permits1. Example: EPA regulations restrict the amount of pollution that two firms can emit at 300 tonsof glop per year. Firm A wants to increase its amount of pollution. Firm B agrees to decrease its pollution by the same amount if Firm A pays it $5 million.2. Social welfare is increased if the EPA allows this situation. Total pollution remains the sameso there are no external effects. If both firms are doing this willingly, it must make thembetter off.3. If the EPA issued permits to pollute and then allowed firms to sell them, this would alsoincrease social welfare. Firms that could control pollution most inexpensively would do so and sell their permits, while those who encounter high costs when reducing pollution would buyadditional permits.4. Tradable pollution permits and corrective taxes are similar in effect. In both cases, firms mustpay for the right to pollute.a. In the case of the tax, the government basically sets the price of pollution and firms thenchoose the level of pollution (given the tax) that maximizes their profit.b. If tradable pollution permits are used, the government chooses the level of pollution (intotal, for all firms) and firms then decide what they are willing to pay for these permits.188 ?Chapter 10/ExternalitiesE. Objections to the Economic Analysis of Pollution1. Some individuals dislike the idea of allowing companies to purchase the right to pollute.2. Economists point out that ―people face trade-offs‖ (Principle #1) and we must decide howmuch we would be willing to give up in exchange for no pollution. It would likely not beenough.3. A clean environment can be viewed as any other good that obeys the law of demand. Thelower the price of environmental protection, the more the public will want.F. In the News: What Should We Do about Climate Change?1. Many policy analysts believe that taxing carbon is the best approach to dealing with globalclimate change..2. This article from The New York Times explains how the revenue-neutral carbon tax works inBritish Columbia and argues for its implementation in the United States..IV. Private Solutions to ExternalitiesA. We do not necessarily need government involvement to correct externalities.B. The Types of Private Solutions1. Problems of externalities can sometimes be solved by moral codes and social sanctions.a. Do not litter.b. The Golden Rule2. Many charities have been established that deal with externalities. The governmentencourages this private solution by allowing a deduction for charitable contributions in thedetermination of taxable income.a. Sierra Club (environment)b. University Alumni Association (scholarships)3. The parties involved in this externality (either the seller and the bystander or the consumerand the bystander) can possibly enter into an agreement to correct the externality.C. The Coase Theorem1. Definition of Coase theorem: the proposition that if private parties can bargainwithout cost over the allocation of resources, they can solve the problem ofexternalities on their own.Chapter 10/Externalities ?1892. Example: Dick owns a dog Spot who disturbs a neighbor (Jane) with its barking.a. One possible solution to this problem would be for Jane to pay Dick to get rid of the dog.The amount that she would be willing to pay would be equal to her valuation of the costsof the barking. Dick would only agree to this if Jane paid him an amount greater than thevalue he places on owning Spot.b. Even if Jane could legally force Dick to get rid of Spot, another solution could occur. Dickcould pay Jane to let him keep the dog.3. Whatever the initial distribution of rights, the parties involved in an externality can potentiallysolve the problem themselves and reach an efficient outcome where both parties are betteroff.D. Why Private Solutions Do Not Always Work1. Definition of transaction costs: the costs that parties incur in the process ofagreeing and following through on a bargain.2. Coordination of all of the interested parties may be difficult so that bargaining breaks down.This is especially true when the number of interested parties is large. SOLUTIONS TO TEXT PROBLEMS:Quick Quizzes1. Examples of negative externalities include pollution, barking dogs, and consumption ofalcoholic beverages. Examples of positive externalitiesinclude the restoration of historicbuildings, research into new technologies, and education. (Many other examples of negativeand positive externalities are possible.) Market outcomes are inefficient in the presence ofexternalities because markets produce a larger quantity than is socially desirable when thereis a negative externality and a smaller quantity than is socially desirable when there is apositive externality. The market outcomes do not account for all of the costs (negativeexternalities) or benefits (positive externalities) to society.2. The town government might respond to the externality from the smoke in three ways: (1)regulation; (2) corrective taxes; or (3) tradable pollution permits.Regulation prohibiting pollution beyond some level is good because it is often effective atreducing pollution. But doing so successfully requires the government to have a lot ofinformation about the industries and the alternative technologies that those industries couldadopt.Corrective taxes are a useful way to reduce pollution because the tax can be increased to getpollution to a lower level and because the taxes raise revenue for the government. The tax ismore efficient than regulation because it gives factories economic incentives to reducepollution and to adopt new technologies that pollute less.The disadvantage of correctivetaxes is that the government needs to know a lot of information to pick the right tax rate.Tradable pollution permits are similar to corrective taxes but allow the firms to trade the rightto pollute with each other. As a result, the government does not need as much informationabout the firms’ technologies. The government c an simply set a limit on the total amo unt of190 ?Chapter 10/Externalitiespollution, issue permits for that amount, and allow the firms to trade the permits. Thisreduces pollution while allowing economic efficiency.3. Examples of private solutions to externalities include moral codes and social sanctions,charities, and relying on the interested parties entering into contracts with one other.The Coase theorem is the proposition that if private parties can bargain without cost over theallocation of resources, they can solve the problem of externalities on their own.Private economic participants are sometimes unable to solve the problems caused by anexternality because of transaction costs or because bargaining breaks down. This is mostlikely when the number of interested parties is large.Questions for Review1. Examples of negative externalities include pollution, barking dogs, and consumption ofalcoholic beverages. Examples of positive externalitiesinclude the restoration of historicbuildings, research into new technologies, and education. (Many other examples of negativeand positive externalities are possible.)2. Figure 1 illustrates the effect of a negative externality. The equilibrium quantity provided bythe market is Q market. Because of the externality, the social cost of production is greater thanthe private cost of production, so the social-cost curve is above the supply curve. The optimalquantity for society is Q optimum. The private market produces too much of the good becauseQ market is greater than Q optimum.Figure 13. The patent system helps society solve the externality problem from technology spillovers. Bygiving inventors exclusive use of their inventions for a certain period, the inventor cancapture much of the economic benefit of the invention. In doing so, the patent systemencourages research and technological advance, which benefits society through spillovereffects.Chapter 10/Externalities ?1914. Corrective taxes are taxes enacted to correct the effects ofa negative externality. Economistsprefer corrective taxes over regulations as a way to protect the environment from pollutionbecause they can reduce pollution at a lower cost to society.A tax can be set to reducepollution to the same level as a regulation. The tax has the advantage of letting the marketdetermine the least expensive way to reduce pollution. The tax gives firms incentives todevelop cleaner technologies to reduce the taxes they have to pay.5. Externalities can be solved without government intervention through moral codes and socialsanctions, charities, merging firms whose externalities affect each other, or by contract.6. According to the Coase theorem, you and your roommate will bargain over whether yourroommate will smoke in the room. If you value clean air morethan your roommate valuessmoking, the bargaining process will lead to your roommate not smoking. But if yourroommate values smoking more than you value clean air, the bargaining process will lead toyour roommate smoking. The outcome is efficient as long as transaction costs do not preventan agreement from taking place. The solution may be reached by one of you paying off theother either not to smoke or for the right to smoke.Quick Check Multiple Choice1. c2. b3. a4. c5. b6. cProblems and Applications1. The Club conveys a negative externality on other car owners because car thieves will notattempt to steal a car with The Club visibly in place. This means that they will move on toanother car. The Lojack system conveys a positive externality because thieves do not knowwhich cars have this technology. Therefore, they are less likely to steal any car. Policyimplications include a subsidy for car owners that use the Lojack technology or a tax onthose who use The Club.2. a. Fire extinguishers exhibit positive externalities becauseeven though people buy them fortheir own use, they may prevent fire from damaging the property of others.192 ? Chapter 10/ExternalitiesFigure 2b. Figure 2 illustrates the positive externality from fire extinguishers. Notice that the social-value curve is above the demand curve and the social-cost curve is the same as the supply curve.c. The market equilibrium level of output is denoted Q market and the efficient level of outputis denoted Q optimum . The quantities differ because in deciding to buy fire extinguishers, people don't account for the benefits they provide to others.d. A government policy that would result in the efficient outcome would be to subsidizepeople $10 for every fire extinguisher they buy. This would shift the demand curve up to the social-value curve, and the market quantity would increase to the optimum quantity. 3. a. The extra traffic is a negative externality because the social cost is greater than theprivate cost..b. Figure 3 shows the market for theater tickets. Because there is no external benefit, thesocial-value curve is the same as the demand curve in this case. However, the social-cost curve lies $5 above the supply curve at each quantity. The efficient level of output occurs where the social-value curve (which is demand in this case) and the social-cost curve intersect..Figure 3optimum market Price of TicketsChapter 10/Externalities ?193c. This is a positive externality because the social value of theater tickets is greater than theprivate value in this case.d. Figure 4 shows both the positive and the negative externalities.Figure 4e. A tax of $3 per ticket will lead to the efficient outcome. The market equilibrium quantitywill be equal to the social optimum.4. a. The market for alcohol is shown in Figure5. The social-value curve is the same as thedemand curve in this case. The social-cost curve is above the supply curve because ofthe negative externality from increased motor vehicle accidents caused by those whodrink and drive. The market equilibrium level of output is Q market and the efficient level of output is Q optimum.b. The triangular area between points A, B, and C represents the deadweight loss of themarket equilibrium. This area shows the amount by which social costs exceed socialvalue for the quantity of alcohol consumption beyond the efficient level.Figure 5194 ?Chapter 10/Externalities5. a. It is efficient to have different amounts of pollution reduction at different firms becausethe costs of reducing pollution differ across firms. If all firms were made to reducepollution by the same amount, the costs would be low at some firms and prohibitivelyhigh at others, imposing a greater burden overall.b. Command-and-control approaches that rely on uniformpollution reduction among firmsgive the firms no incentive to reduce pollution beyond the mandated amount. Instead,every firm will reduce pollution by just the amount required and no more.c. Corrective taxes or tradable pollution rights give firms greater incentives to reducepollution. Firms are rewarded by paying lower taxes or spending less on permits if theyfind methods to reduce pollution, so they have the incentive to engage in research onpollution control. The government does not have to figure out which firms can reducepollution the most?it lets the market give firms the incentive to reduce pollution on theirown.6. a. A t a price of $1.50, each Whovillian will consume 4 bottles of Zlurp. Eac h consumer’stotal willingness to pay is $14 (= $5 + $4 + $3 + $2). The total spent by each Whovillianon Zlurp is $6 (= $1.50 ? 4). Therefore, each consumer receives $8 in consumer surplus(=$14 ? $6).b. Total surplus would fall by $4 to $4.c. If Cindy Lou only consumes 3 bottles of Zlurp, her consumer surplus is $4.50. Herwillingness to pay for 3 bottles is $5 + $4 + $3 = $12. She pays $1.50 x 3 = $4.50 andthe externality is $1 x 3 = $3. Thus, Cindy Lou's consumer surplus is $12 - $4.50 - $3.00= $4.50. Cindy’s decision increases consumer surplus in Whoville by $0.50 ($4.50-$4.00).d. The $1 tax raises the price of a bottle of Zlurp to $2.50. (The entire tax will be borne byconsumers because supply is perfectly elastic.) Each resident will purchase only 3 bottlesat the higher price and each consumer’s total willingness to pay is now $12 (= $5 + $4 +$3). Each resident pays $7.50 (= $2.50 ? 3). Therefore, each resident receives $4.50($12-$7.50) in consumer surplus.Because each bottle has an external cost of $1, the per-resident external cost is $3 ($1per bottle x 3 bottles). The government collects $3 per resident in revenue. Total surpluswith the tax is equal to $4.50 - $3.00 + $3.00 = $4.50.e. Yes, because total surplus is now higher than before the tax.7. a. The externality is noise pollution. Ringo’s consumption of rock and roll music affectsLuciano, but Ringo does not consider that in deciding how loudly he plays his music.b. The landlord could impose a rule that music could not be played above a certain decibellevel. This could be inefficient because there would be no harm done by Ringo playinghis music loud if Luciano is not home.c. Ringo and Luciano could negotiate an agreement that might, for example, allow Ringo toplay his music loudly at certain times of the day. They mightnot be able to reach anagreement if the transaction costs are high or if bargaining fails because each holds outfor a better deal.Chapter 10/Externalities ?195 8. a. An improvement in the technology for controlling pollution would reduce the demand forpollution rights, shifting the demand curve to the left. Figure 6 illustrates what wouldhappen if there were a corrective tax, while Figure 7 shows the impact if there were afixed supply of pollution permits. In both figures, the curve labeled D1 is the originaldemand for pollution rights and the curve labeled D2 is the new demand for pollutionrights after the improvement in technology.Figure 6b. With a corrective tax, the price of pollution remains unchanged and the quantity ofpollution declines, as Figure 6 shows. With pollution permits, the price of pollutiondeclines and the quantity of pollution is unchanged, as Figure 7 illustrates.Figure 79. a. In terms of economic efficiency in the market for pollution, it does not matter if thegovernment distributes the permits or auctions them off, as long as firms can sell thepermits to each other. The only difference would be that the government could makemoney if it auctioned the permits off, thus allowing it to reduce taxes, which would help196 ?Chapter 10/Externalitiesreduce the deadweight loss from taxation. There could also be some deadweight lossoccurring if firms use resources to lobby for additional permits.b. If the government allocated the permits to firms who did not value them as highly asother firms, the firms could sell the permits to each other so they would end up in thehands of the firms who value them most highly. Thus, the allocation of permits amongfirms would not matter for efficiency. But it would affect the distribution of wealth,because those who got the permits and sold them would be better off.10. a. The firms with the highest cost of reducing pollution will buy permits rather than reducetheir pollution. Firms that can sell their permits for more than it costs them to reducetheir pollution will sell.Because firm B faces the highest costs of reducing pollution, $25 per unit, it will keep itsown 40 permits and buy 40 permits from the other firms, so that it can still pollute 80units. Thus, firm B does not reduce its pollution at all.Of the two remaining firms, firm A has the higher cost of reducing pollution so it willkeep its own 40 permits and reduce its pollution by 30 units at a cost of $20 x 30 units =$600.Firm C sells all 40 of its permits to firm B and reduces its pollution by 50 units at a cost of$10 × 50 = $500. The total cost of pollution reduction is。
Chapter 5Elasticity and its applicationSolutions to text problemsprice elasticity of demand. Explain the relationship between total QZ Definerevenue and the price elasticity of demand. (page 92)The price elasticity of demand is a measure of how much the quantity demanded of a good responds to a change in the price of that good, calculated as the percentage change in quantity demanded divided by the percentage change in price.The relationship between total revenue and the price elasticity of demand is: (1) when a demand curve is inelastic (a price elasticity less than 1), a price increase raises total revenue, and a price decrease reduces total revenue; (2) when a demand curve is elastic (a price elasticity greater than 1), a price increase reduces total revenue, and a price decrease raises total revenue; and (3) when a demand curve is unit elastic (a price elasticity equal to 1), a change in price does not affect total revenue.price elasticity of supply. Explain why the price elasticity of supply QZ Definemight be different in the long run than in the short run. (page 94)The price elasticity of supply is a measure of how much the quantity supplied of a good responds to a change in the price of that good, calculated as the percentage change in quantity supplied divided by the percentage change in price.The price elasticity of supply might be different in the long run than in the short run because over short periods of time, firms cannot easily change the size of their factories to make more or less of a good. Thus, in the short run, the quantity supplied is not very responsive to the price. However, over longer periods, firms can build new factories or close old ones, or they can enter or exit a market. So, in the long run, the quantity supplied can respond substantially to the price.QZ How might a drought that destroys half of all farm crops be good for farmers? If such a drought is good for farmers, why don’t farmers destroy their own crops in the absence of a drought? (page 100)A drought that destroys half of all farm crops could be good for farmers if the demand for the crops is inelastic. The shift to the left of the supply curve leads to a price increase that raises total revenue because the price elasticity is less than one.Even though a drought could be good for farmers, they wouldn’t destroy their crops in the absence of a drought because no one farmer would have an incentive to destroy her crops, since she takes the market price as given. Only if all farmers destroyed their crops together, for example through a government program, would this plan work to make farmers better off.Questions for review (page 101)1The price elasticity of demand measures how much the quantity demanded responds to a change in price. The income elasticity of demand measures how much the quantity demanded changes as consumer income changes.2The determinants of the price elasticity of demand include whether the good is a necessity or a luxury, how available close substitutes are, how broadly defined the market is, and the time horizon.Luxury goods have greater price elasticity than necessities, goods with close substitutes have greater elasticity, goods in more narrowly defined markets have greater elasticity, and goods have greater elasticity the longer the time horizon.3Elasticity greater than 1 means demand is elastic. When the elasticity is greater than 1, the percentage change in quantity demanded exceeds the percentage change in price. When the elasticity60 Principles of Economics, Third edition, Instructor’s Manualequals 0, demand is perfectly inelastic. There is no change in quantity demanded when there is a change in price.4Figure 5.1 presents a supply-and-demand diagram, showing equilibrium price, equilibrium quantity, total spending by consumers and the total revenue received by producers. Total spending byconsumers equals the equilibrium price times the equilibrium quantity. Total revenue received by producers also equals the equilibrium price times the equilibrium quantity. These are shown by the area of the rectangle in Figure 5.1.Figure 5.15If demand is elastic, an increase in price reduces total revenue. With elastic demand, the quantity demanded falls by a greater percentage than the percentage increase in price. As a result, total revenue declines.6 A good with an income elasticity less than 0 is called an inferior good because as income rises, thequantity demanded declines.Chapter 5: Elasticity and its application 61 7The price elasticity of supply is calculated as the percentage change in quantity supplied divided by percentage change in price.Price elasticity of supply =% change in quantity supplied % change in priceIt measures how much the quantity supplied responds to changes in the price.8The price elasticity of supply of Picasso paintings is zero, since no matter how high price rises, no more can ever be produced.9The price elasticity of supply is usually larger in the long run than it is in the short run. Over short periods of time, firms cannot easily change the size of their factories to make more or less of a good, so the quantity supplied is not very responsive to price. Over longer periods, firms can build new factories or close old ones, so the quantity supplied is more responsive to price.10OPEC was unable to maintain a high price through the 1980s because the elasticity of supply and demand were more elastic in the long run. When the price of oil rose, producers of oil outside of OPEC increased oil exploration and built new extraction capacity. Consumers responded withgreater conservation efforts. As a result, supply increased and demand fell, leading to a lower price for oil in the long run.Problems and applications (page 102)1 a Mystery novels have more elastic demand than required textbooks, because mystery novels haveclose substitutes and are more of a luxury good, while required textbooks are more of a necessity with no close substitutes. If the price of mystery novels were to rise, readers could substituteother types of novels, or buy fewer novels altogether. But if the price of required textbooks were to rise, students would have little choice but to pay the higher price. Thus the quantity demanded of required textbooks is less responsive to price than the quantity demanded of mystery novels.b Beethoven recordings have more elastic demand than classical music recordings in general.Beethoven recordings are a narrower market than classical music recordings, so it is easy to find close substitutes for them. If the price of Beethoven recordings were to rise, people couldsubstitute other classical recordings, like Mozart. But if the price of all classical recordings were to rise, substitution would be more difficult. A transition from classical music to hip-hop, forexample, is less likely. Thus the quantity demanded of classical recordings is less responsive to price than the quantity demanded of Beethoven recordings.c Heating oil during the next 5 years has more elastic demand than heating oil during the next 6months. Goods have a more elastic demand over longer time horizons. If the price of heating oil were to rise temporarily, consumers couldn’t switch to other sources of fuel without greatexpense. But if the price of heating oil were to be high for a long time, people would gradually switch to gas or electric heat. As a result, the quantity demanded of heating oil during the next 6 months is less responsive to price than the quantity demanded of heating oil during the next 5years.d Lemonade has more elastic demand than water. Lemonade is a luxury with close substitutes,while water is a necessity with no close substitutes. If the price of water were to rise, consumers have little choice but to pay the higher price. But if the price of lemonade were to rise,consumers could easily switch to other soft drinks. So the quantity demanded of lemonade ismore responsive to price than the quantity demanded of water.2 a(i) For business travellers, the price elasticity of demand when the price of tickets risesfrom $200 to $250 is [(2,000 – 1,900)/1,950]/[(250 – 200)/225] = 3/13 = 0.23.(ii) For holiday-makers, the price elasticity of demand when the price of tickets risesfrom $200 to $250 is [(800 – 600)/700] / [(250 – 200)/225] = 9/7 = 1.29.b The price elasticity of demand for holiday-makers is higher than the elasticity for businesstravellers because holiday-makers can more easily choose a different mode of transportation like driving or taking the train. Business travellers are less likely to do so since time is moreimportant to them and their schedules are less adaptable.62 Principles of Economics, Third edition, Instructor’s Manual3 a(i) If your income is $10,000, your price elasticity of demand as the price of compactdiscs rises from $8 to $10 is [(40 – 32)/36] / [(10 – 8)/9] = 1(ii) If your income is $12,000, the elasticity is [(50 – 45)/47.5] / [(10 – 8)/9] = 9/19 =0.47b(i) If the price is $12, your income elasticity of demand as your income increases from $10,000 to $12,000 is [(30 – 24)/27] / [(12,000 – 10,000)/11,000] = 11/9 = 1.22.(ii) If the price is $16, your income elasticity of demand as your income increases from $10,000 to $12,000 is [(12 – 8)/10] / [(12,000 – 10,000)/11,000] = 11/5 = 2.2.4 a If Emily always spends one-third of her income on clothing, then her income elasticityof demand is one, since maintaining her clothing expenditures as a constant fraction ofher income means the percentage change in her quantity of clothing must equal herpercentage change in income. For example, suppose the price of clothing is $30, herincome is $9,000, and she purchases 100 clothing items. If her income rose 10 percentto $9,900, she’d spend a total of $3,300 on clothing, which is 110 clothing items, a 10percent increase.b Emily’s price elasticity of clothing demand is also one, since every percentage point increase inthe price of clothing would lead her to reduce her quantity purchased by the same percentage.Again, suppose the price of clothing is $30, her income is $9,000, and she purchases 100clothing items. If the price of clothing rose 1 percent to $30.30, she would purchase 99 clothing items, a 1 percent reduction. Note this part of the problem can be confusing to students if theyhave an example with a larger percentage change and they use the point elasticity calculationmethod. This example can be used to further illustrate the usefulness of the midpoint method for any size change.c Since Emily spends a smaller proportion of her income on clothing, then for any given price, herquantity demanded will be lower. Thus her demand curve has shifted to the left. But becauseshe’ll again spend a constant fraction of her income on clothing, her income and price elasticities of demand remain one.5 a With a 4.3 percent decline in quantity following a 20 percent increase in price, theprice elasticity of demand is only 4.3/20 = 0.215, which is fairly inelastic.b With inelastic demand, the revenue rises when the fare rises.c The elasticity estimate might be unreliable because it’s only the first month after the fareincrease. As time goes by, people may switch to other means of transportation in response to the price increase. So the elasticity may be larger in the long run than it is in the short run.6Tom’s price elasticity of demand is zero, since he wants the same quantity regardless of the price.Jerry’s price elasticity of demand is one, since he spends the same amount on gas, no matter what the price, which means his percentage change in quantity is equal to the percentage change in price.7To explain the observation that spending on restaurant meals declines more during economic downturns than does spending on food to be eaten at home, economists look at the income elasticity of demand. In economic downturns, people have lower income. To explain the observation, the income elasticity of restaurant meals must be larger than the income elasticity of spending on food to be eaten at home.8 a With a price elasticity of demand of 0.4, reducing the quantity demanded of cigarettes by 20percent requires a 50 percent increase in price, since 20/50 = 0.4. With the price of a pack ofcigarettes currently at $8, this would require an increase in the price to $13.33 a pack using the midpoint method (note that ($13.33 – $8)/$10.67 = 0.50).b The policy will have a larger effect five years from now than it does one year from now. Theelasticity is larger in the long run, since it may take some time for people to reduce theircigarette usage. The habit of smoking is hard to break in the short run.c Since teenagers don’t have as much income as adults, they are likely to have a higher priceelasticity of demand.9You’d expect the price elasticity of demand to be higher in the market for vanilla ice cream than for all ice cream because vanilla ice cream is a narrower category and other flavours of ice cream are almost perfect substitutes for vanilla.Chapter 5: Elasticity and its application 63 You’d expect the price elasticity of supply to be larger for vanilla ice cream than for all ice cream. A producer of vanilla ice cream could easily adjust the quantity of vanilla ice cream and produce other types of ice cream. But a producer of ice cream would have a more difficult time adjusting the overall quantity of ice cream they produced.10 a As Figure 5.2 shows, in both markets, the increase in supply reduces the equilibrium price andincreases the equilibrium quantity.b In the market for pharmaceutical drugs, with inelastic demand, the increase in supply leads to arelatively large decline in the price and not much of an increase in quantity. This marketexperiences a larger change in price.Figure 5.2c In the market for computers, with elastic demand, the increase in supply leads to a relativelylarge increase in quantity and not much of a decline in price. This market experiences a largerchange in quantity.d In the market for pharmaceutical drugs, since demand is inelastic, the percentage increase inquantity will be less than the percentage decrease in price, so total consumer spending willdecline. In contrast, since demand is elastic in the market for computers, the percentage increase in quantity will be greater than the percentage decrease in price, so total consumer spending will increase.11 a As Figure 5.3 shows, in both markets, the increase in demand increases both the equilibriumprice and the equilibrium quantity.b In the market for beachfront resorts, with inelastic supply, the increase in demand leads to arelatively large increase in the price and not much of an increase in quantity. This marketexperiences a larger change in price.c In the market for cars, with elastic supply, the increase in demand leads to a relatively largeincrease in quantity and not much of an increase in price. This market experiences a largerchange in quantity.d In both markets, total consumer spending rises, since both equilibrium price and equilibriumquantity rise.64 Principles of Economics, Third edition, Instructor’s Manual Figure 5.3Quantity of cars 12 a Vineyard owners whose vines weren’t destroyed benefited because the destruction of some ofthe vines reduced the supply, causing the equilibrium price to rise.b To tell whether vineyard owners as a group were hurt or helped by the floods, you’d need toknow the price elasticity of demand. It could be that the additional income earned by vineyard owners whose vines weren’t destroyed rose more because of the higher prices than the lossesmade by vineyard owners whose vines were destroyed, if demand is inelastic.13 A worldwide drought could increase the total revenue of farmers if the price elasticity of demand forgrain is inelastic. The drought reduces the supply of grain, but if demand is inelastic, the reduction of supply causes a large increase in price. Total farm revenue would rise as a result. If there’s only a drought in Queensland, Queensland’s production isn’t a large enough proportion of the total farm product to have much impact on the price. As a result, price is basically unchanged, while the output of Queensland farmers declines, thus reducing their income.14 When productivity increases for all farmland at a point in time, the increased productivity leads to arise in farmland prices, since more output can be produced on a given amount of land. But prior to the technological improvements, the productivity of farmland depended mainly on the prevailing weather conditions. There was little opportunity to substitute land with worse weather conditions for land with better weather conditions. As technology improved over time, it became much easier to substitute one type of land for another. So the price elasticity of supply for farmland increased over time, since now land with bad weather is a better substitute for land with good weather. Theincreased supply of land reduced farmland prices. As a result, productivity and farmland prices are negatively related over time.15 Not necessarily. If demand for luxury cars is price elastic, then raising the price of luxury cars byincreasing the tax will decrease the total revenue from luxury cars. It is likely that demand for luxury cars is elastic as they are more of a luxury than a necessity. P r i c e o f c a r s。

曼昆经济学原理英文版文案加习题答案12章WHAT’S NEW IN THE S EVENTH EDITION:All tables have been updated to the most recently available numbers. A new In the News box on “Tax Expenditures" has been added.LEARNING OBJECTIVES:By the end of this chapter, students should understand:➢how the U.S. government raises and spends money.➢the efficiency costs of taxes.➢alternative ways to judge the equity of a tax system.➢why studying tax incidence is crucial for evaluating tax equity.➢the trade-off between efficiency and equity in the design of a tax system.CONTEXT AND PURPOSE:Chapter 12 is the third chapter in a three-chapter sequence on the economics of the public sector. Chapter 10 addressed externalities. Chapter 11 addressed public goods and common resources. Chapter 12 addresses the tax system. Taxes are inevitable because when the government remedies an externality, provides a public good, or regulates the use of a common resource, it needs tax revenue to perform these functions.The purpose of Chapter 12 is to build on the lessons learned about taxes in previous chapters. We have seen that a tax reduces the quantity sold in a market, that the distribution of the burden of a tax depends on the relative elasticities of supply and demand, and that taxes cause deadweight losses. We expand the study of taxes in Chapter 12 by addressing how the U.S. government raises and spends money. The difficulty of making a tax system both efficient and equitable is then discussed.KEY POINTS:• The U.S. government raises revenue using various taxes. The most important taxes for thefederal government are individual income taxes and payroll taxes for social insurance. The most important taxes for state and local governments are sales taxes and property taxes.• The efficiency of a tax system refers to the costs it imposes on taxpayers. There are two costsof taxes beyond the transfer of resources from the taxpayer to the government. The first is the deadweight loss that arises as taxes alter incentives and distort the allocation of resources. The second is the administrative burden of complying with the tax laws.• The equity of a tax system concerns whether the tax burden is distributed fairly among thepopulation. According to the benefits principle, it is fair for people to pay taxes based on the benefits they receive from the government. According to the ability-to-pay principle, it is fair for people to pay taxes based on their capability to handle the financial burden. Whenevaluating the equity of a tax system, it is important to remember a lesson from the study of tax incidence: The distribution of tax burdens is not the same as the distribution of tax bills.• When considering changes in the tax laws, policymakers often face a trade-off betweenefficiency and equity. Much of the debate over tax policy arises because people give different weights to these two goals.CHAPTER OUTLINE:I. A Financial Overview of the U.S. GovernmentA. Figure 1 shows the level of government revenue in the United States, including federal, state, and local governments, as a percentage of total income for the U.S. economy.1. The role of government has grown substantially over the past century.2. The government’s revenue from taxation has grown at a faster rate than the economy’s levelof income.B. Table 1 compares the tax burden for several major countries, as measured by the government’stax revenue as a percentage of the nation’s total income.1. The United States has a low tax burden compared to most other advanced economies.2. Many European nations have much higher taxes, which finance a more generous social safetynet.C. The Federal Government1. Receiptsa. Table 2 reports the receipts of the federal government in 2011.b. Total receipts were $2,520 billion or $8,077 per person.c. The largest source of revenue is the individual income tax.d. A family’s income tax liability is how much it owes in taxes based on income. This tax isnot proportional to income. It is based on income minus deductions, and the tax rate rises as income rises. Table 3 presents federal tax rates for 2013.e. Other important revenue sources include payroll taxes (social insurance taxes), the corporate income tax, and excise taxes.2. Spendinga. Table 4 reports where the federal government spent its budget in 2011.b. Total spending was $3,757 billion or $12,042 per person.c. The largest category of expenditure is for income security, which includes Social Security, unemployment insurance payments, and welfare payments. The second largest expenseis health programs, including Medicare, Medicaid, and spending on medical research.d. The next largest category of spending is national defense.e. Another important category of expenditure is net interest on the federal debt.3. Definition of budget deficit: an excess of government spending over governmentreceipts.spending.D. Case Study: The Fiscal Challenge Ahead1. From 2009 to 2012, the U.S. federal government had budget deficits that exceeded $1 trillion every year, the largest budget shortfalls since World War II.2. Long-term projections of the government’s budget show that this is expected to rise dramatically in the decades ahead.a. The population ages 65 and older is growing; thus, Medicare and Social Security expenditures will rise as well.b. In addition, the costs of Medicare, Medicaid and government-subsidized health insurance are affected by the rising cost of medical care.E. State and Local Government1. Receiptsa. Table 5 reports the receipts from state and local governments for 2011.b. Total receipts were $2,064 billion or $6,615 per person.c. The two most important taxes for state and local governments are sales taxes andproperty taxes.d. State and local governments also levy individual and corporate income taxes.e. State governments also receive funding from the federal government.2. Spendinga. Table 6 shows how state and local governments spent their budgets in 2011.b. The largest category of spending was education, while the second largest category washealth programs.II. Taxes and EfficiencyA. Well-designed tax policies minimize the deadweight losses that occur when taxes distortincentives. They also minimize the administrative burdens that taxpayers face when complying with tax laws.B. Deadweight Losses1. Taxes lead to deadweight losses because they lower total surplus.2. Case Study: Should Income or Consumption Be Taxed?a. Because interest income is taxed, the current income tax laws discourage saving.b. If consumption (instead of income) is taxed, this disincentive disappears.c. European nations tend to rely more on consumption taxes than does the United States.C. Administrative Burden1. The current tax system is quite burdensome because of the large amount of paperworkrequired both when filling out tax forms and keeping records throughout the year.2. Many taxpayers spend resources hiring accountants and tax lawyers.a. People often need help filling out complex tax forms.b. Individuals may also want to learn how to arrange their affairs to reduce their tax burden.D. Marginal Tax Rates versus Average Tax Rates1. Definition of average tax rate: total taxes paid divided by total income.2. Definition of marginal tax rate: the amount that taxes increase from an additionaldollar of income.3. The average tax rate measures the sacrifice made by a taxpayer; the marginal tax ratemeasures how much the tax system distorts incentives.E. Lump-Sum Taxes1. Definition of lump-sum tax: a tax that is the same amount for every person.2. For this type of tax, the marginal tax rate is equal to zero.3. This is the most efficient type of tax because it does not distort incentives and thus has noeffect on total surplus. There is also little administrative burden with this type of tax.4. However, a lump-sum tax would take the same amount from the poor and the rich, whichmost people would view as unfair.III. Taxes and EquityA. The Benefits Principle1. Definition of benefits principle: the idea that people should pay taxes based on thebenefits they receive from government services.2. This principle tries to make public goods similar to private goods.3. An example of this would be the tax on gasoline, especially if revenues from the tax are used to build or maintain roads.B. The Ability-to-Pay Principle1. Definition of ability-to-pay principle: the idea that taxes should be levied on aperson according to how well that person can shoulder the burden.2. Definition of vertical equity: the idea that taxpayers with a greater ability to paytaxes should pay larger amounts.a. Three tax systems: proportional, regressive, and progressive.b. Definition of proportional tax: a tax for which high-income and low-incometaxpayers pay the same fraction of income.c. Definition of regressive tax: a tax for which high-income taxpayers pay a smaller fraction of their income than do low-income taxpayers.d. Definition of progressive tax: a tax for which high-income taxpayers pay a larger fraction of their income than do low-income taxpayers.e. Case Study: How the Tax Burden Is Distributed – Table 8 shows that the tax burden in this country is highly progressive. In addition, studies have shown that, if transferpayments are also taken into account, the degree of progressivity is substantial.3. Definition of horizontal equity: the idea that taxpayers with similar abilities to pay taxes should pay the same amount.C. Tax Incidence and Tax Equity1. The burden of a tax is not always borne by who pays the tax bill.2. Example: tax on fur coats. This will ultimately affect those who sell and produce the fur coats because the quantity of fur coats demanded will fall due to the increase in price.3. Case Study: Who Pays the Corporate Income Tax?a. The corporate income tax is popular among voters because a corporation is nonhumanand faceless.b. However, the burden of the corporate tax falls on stockholders, customers, and workers.c. An increase in corporate taxes means an increase in the cost of producing the product.Firms will cut back production (which lowers supply and raises the price to the consumer) and possibly lay off workers (which causes unemployment, lower wages, or both).D. In the News: Tax Expenditures1. Eliminating tax expenditures, special tax cuts for things like mortgage interest and charitablegiving, could result in lower taxes and fiscal sustainability.2. This article from The New York Times discussing the benefits of eliminating tax expendituresand the politics associated with such a proposal.IV. Conclusion: The Trade-off between Equity and EfficiencySOLUTIONS TO TEXT PROBLEMS:Quick Quizzes1. The two most important sources of tax revenue for the federal government are individualincome taxes and payroll taxes (social insurance taxes). The two most important sources oftax revenue for state and local governments are sales taxes and property taxes.2. The efficiency of a tax system depends on the costs of collecting a given amount of taxrevenue. One tax system is more efficient than another if the same amount of tax revenuecan be raised at a lower cost.A tax system can be inefficient because of the deadweight losses that result when taxesdistort the decisions that people make and because of the administrative burdens thattaxpayers bear as they comply with tax laws. An efficient tax system has low deadweightlosses and small administrative burdens.3. The benefits principle is the idea that people should pay taxes based on the benefits theyreceive from government services. It tries to make public goods similar to private goods bymaking those who benefit more from the public good pay more for it. The ability-to-payprinciple is the idea that taxes should be levied on a person according to how well thatperson can shoulder the burden. It tries to equalize the sacrifice each person makes towardpaying taxes.Vertical equity is the idea that taxpayers with greater ability to pay should pay largeramounts. Horizontal equity is the idea that taxpayers with similar abilities to pay should paythe same amount.Studying tax incidence is important for determining the equity of a tax system becauseunderstanding how equitable the tax system is requires understanding the indirect effects oftaxes. In many cases, the burden of the tax is borne by individuals other than those whoactually pay the tax.Questions for Review1. Over the past century, the government’s tax revenue has grown more rapidly than the rest ofthe economy. The ratio of government revenue to GDP has increased over time.2. Corporate profits are taxed first when the corporate income tax is taken out of acorporation's income. When the profits are used to pay dividends to the corporation'sshareholders, they are taxed again through individual income tax.3. The burden of a tax to taxpayers is greater than the revenue received by the governmentbecause: (1) taxes impose deadweight losses by reducing the quantity of goods producedand purchased to below their efficient level; and (2) taxes entail a costly administrativeburden on taxpayers.4. Some economists advocate taxing consumption rather than income because taxing incomediscourages saving. A consumption tax would not distort individuals’ saving decisions.5. The marginal tax rate on a lump-sum tax is zero. This type of tax has no deadweight loss,because it does not distort incentives.6. Wealthy taxpayers should pay more taxes than poor taxpayers should because: (1) theybenefit more from public services; and (2) they have a greater ability to pay.7. Horizontal equity refers to the idea that families in the same economic situation should betaxed equally. The concept of horizontal equity is hard to apply because families differ inmany ways, so it is not obvious how to tax them equitably. For example, two families withthe same income may have different numbers of children and different levels of medicalexpenses.Quick Check Multiple Choice1. b2. c3. a4. a5. d6. cProblems and Applications1. The federal government had a budget deficit in 2013. Policymakers expect budget deficitsover the next decade.2. a. The increase in revenue of the total government is attributable more to increases in stateand local government revenue than to federal government revenue. In 1964, state andlocal government revenue was 37% of total government revenue; by 2012, it had risento more than 48%.b. Personal income taxes accounted for more of the total revenue of federal and state andlocal governments in 2012 than in 1964; social insurance taxes accounted for asubstantially greater proportion in 2012 than in 1964; and corporate taxes accounted fora lower proportion in 2012 than in 1964.c. Transfer payments now account for a much greater proportion of the total expendituresof federal and state and local governments, while purchases account for a much smallerproportion. Expenditures on interest and subsidies are consistent.3. a. If the number of retirees is rising and total expenditures are frozen, then benefits perretiree will decline over time. Because the number of workers is rising, albeit slowly, taxpayments per worker would decline slowly over time.b. If benefits per retiree were frozen, total expenditures would rise quickly, along with thenumber of retirees. To pay for the increased expenditures, tax payments per workerwould rise, because the number of workers isn't growing as rapidly as the number ofretirees.c. If tax payments per worker were frozen, total expenditures would rise slowly, at thesame rate as the growth rate of the number of workers. Because the number of retireesis rising more rapidly, benefits per retiree would decline over time.d. The answers to parts (a), (b), and (c) suggest there is no easy solution. Either workerswill pay more per person or retirees will get fewer benefits per person. Policymakers mayeventually be forced to compromise, both reducing benefits per retiree and increasingtax payments per worker.4. If you earn $20,000 a year, then you pay federal income taxes in two parts: 10% on the first$8,925 of income and 15% on the amount above $8,925. Thus, your federal income taxesare ($8,925 ⨯ 0.10) + ($11,075 ⨯ 0.15) = $892.50 + $1661.25 = $2,553.75. You also pay $20,000 ⨯ 0.153 = $3,060 in federal payroll taxes and $20,000 ⨯ 0.04 = $800 in stateincome taxes, for a total tax bill of $6,413.75. Your average tax rate is $6,441.25/$20,000 =0.321 = 32.1%. Your marginal tax rate is 0.15 + 0.153 + 0.04 = 0.343 = 34.3%.If you earn $40,000 a year, then you pay federal income taxes in three parts: 10% on the first $8,925 of income, 15% for additional income up to $36,425, and 25% for the remaining $3,5750 of income. Thus, your federal income taxes are ($8,925 ⨯ 0.10) + ($27,500 ⨯ 0.15) + ($3,575 ⨯ 0.25) = $892.50 + $4,125 + $893.75 = $5911.25. You also pay $40,000 ⨯0.153 = $6,120 in federal payroll taxes, and $40,000 ⨯ 0.04 = $1,600 in state income taxes.Your total tax bill is $13,631.25. Your average tax rate is $13,631.25/$40,000 = 0.341 =34.1%. Your marginal tax rate is 0.25 + 0.153 + 0.04 = 0.443 = 44.3%.5. Excluding food and clothing from the sales tax is justified on equity grounds because poorpeople spend a greater proportion of their income on those items. By exempting them from taxation, the system makes the rich bear a greater burden of taxation than the poor. From the point of view of efficiency, however, excluding food and clothing from the sales tax is inefficient, because the incentives to purchase food and clothing rather than other items are likely affected by this tax exemption. This leads to an inefficient allocation of resources. In addition, because the demand for food and clothing is likely to be relatively inelastic, thedeadweight loss from a tax on these goods would be relatively small (when compared with a tax on a good whose demand is relatively elastic).6. a. An individual must pay taxes on the asset only when he or she sells it. Thus, this tax lawaffects the individual’s decision of whether to keep or sell the asset. Tax revenues onaccrued capital gains are only received by the government when an individual actuallysells the asset. Lowering the tax rate on capital gains may induce individuals to sellassets that they have been holding to avoid paying the taxes on the accrued capital gains.b. Because capital gains are not realized and thus taxed until the investment is sold,investors can avoid the tax by not selling the investment. When capital gains taxes arelowered, even temporarily, the investor has an incentive to sell the investment while thetax is lower. Thus, sales to realize capital gains will increase at the lower rate and so willtax revenue on the increased volume of transactions.c It is inefficient to tax only realized capital gains because it distorts the incentives anindividual faces with regard to keeping or selling a particular asset. However, it may bedifficult to estimate the rise in the value of an asset prior to its sale.7. If the state raises its sales tax from 5% to 6%, it is not plausible that sales tax revenue willincrease 20%. The increase in the tax rate is 20%, so the only way tax revenue couldincrease 20% would be if total spending didn't fall in response to the tax increase, which is unlikely. Instead, the higher tax would raise the price of goods, so people would spend less.Thus, tax revenue might go up, because the tax rate is higher, but by less than 20%. There is a possibility that tax revenues will fall.8. The effect of the Tax Reform Act of 1986 on interest payments was to reduce consumer debtand increase home equity debt. People started financing general expenditures through home equity loans and paid down their mortgages less quickly.9. a. The fact that visitors to many national parks pay an entrance fee is an example of thebenefits principle, because people are paying for the benefits they receive.b. The fact that local property taxes support elementary and secondary schools is anexample of the ability-to-pay principle, because if you own more expensive property, you must pay more tax.c. The setup of airport trust funds is an example of the benefits principle, because use ofthe airport generates tax revenue that pays for upkeep of the airport.。

✍ how to define and measure consumer surplus.✍ the link between sellers’ costs of producing a good and the supply curve.✍ how to define and measure producer surplus.✍ that the equilibrium of supply and demand maximizes total surplus in a market. CONTEXT AND PURPOSE:Chapter 7 is the first chapter in a three-chapter sequence on welfare economics and market efficiency. Chapter 7 employs the supply and demand model to develop consumer surplus and producer surplus as a measure of welfare and market efficiency. These concepts are then utilized in Chapters 8 and 9 to determine the winners and losers from taxation and restrictions on international trade.The purpose of Chapter 7 is to develop welfare economics—the study of how the allocation of resources affects economic well-being. Chapters 4 through 6 employed supply and demand in a positive framework, which focused on the question, “What is the equilibrium price and quantity in a market?” This chapter now addresses the normative question, “Is the equilibrium price and quantity in a market the best possible solution to the resource allocation problem, or is it simply the price and quantity that balance supply and demand?” Students will discover that under most circumstances the equilibrium price and quantity is also the one that maximizes welfare.KEY POINTS:? Consumer surplus equals buyers’ willingness to pay for a good minus the amount they actually pay for it, and it measures the benefit buyers get from participating in a market.Consumer surplus can be computed by finding the area below the demand curve and above the price.? Producer surplus equals the amount sellers receive for their goods minus their costs of production, and it measures the benefit sellers get from participating in a market. Producer surplus can be computed by finding the area below the price and above the supply curve.? An allocation of resources that maximizes the sum of consumer and producer surplus is said to be efficient. Policymakers are often concerned with the efficiency, as well as the equality, of economic outcomes.? The equilibrium of supply and demand maximizes the sum of consumer and producer surplus.That is, the invisible hand of the marketplace leads buyers and sellers to allocate resources efficiently.? Markets do not allocate resources efficiently in the presence of market failures such as market power or externalities.CHAPTER OUTLINE:I. Definition of welfare economics: the study of how the allocation of resources affects economic well-being.A. Willingness to Pay1. Definition of willingness to pay: the maximum amount that a buyer will pay for a good.2. Example: You are auctioning a mint-condition recording of Elvis Presley’s first album. Four buyers show up. Their willingness to pay is as follows:for John. Because John is willing to pay more than he has to for the album,he derives some benefit from participating in the market.3. Definition of consumer surplus: the amount a buyer is willing to pay for a good minus the amount the buyer actually pays for it.4. Note that if you had more than one copy of the album, the price in the auction would end up being lower (a little over $70 in the case of two albums) and both John and Paul would gain consumer surplus.B. Using the Demand Curve to Measure Consumer Surplus1. We can use the information on willingness to pay to derive a demand curve for the rare2. . Because the demand curve shows the buyers’ willingness to pay, we can use the demand curve to measure consumer surplus.C. How a Lower Price Raises Consumer Surplusare paying less for the product than before (area A on the graph).b. Because the price is now lower, some new buyers will enter the market and receive consumer surplus on these additional units of output purchased (area B on the graph).D. What Does Consumer Surplus Measure?1. Remember that consumer surplus is the difference between the amount that buyers are willing to pay for a good and the price that they actually pay.2. Thus, it measures the benefit that consumers receive from the good as the buyers themselves perceive it.III. Producer SurplusA. Cost and the Willingness to Sell1. Definition of cost: the value of everything a seller must give up to produce a good .2. Example: You want to hire someone to paint your house. You accept bids for the work from four sellers. Each painter is willing to work if the price you will pay exceeds her opportunity cost. (Note that this opportunity cost thus represents willingness to sell.) The costs are: ALTERNATIVE CLASSROOM EXAMPLE:Review the material on price ceilings from Chapter 6. Redraw the market for two-bedroom apartments in your town. Draw in a price ceiling below the equilibriumprice.Then go through:✍ consumer surplus before the price ceiling is put into place.✍ consumer surplus after the price ceiling is put into place.You will need to take some time to explain the relationship between the producers’ willingness to sell and the cost of producing the good. The relationship between cost and the supply curve is not as apparent as the relationship between the demand curve and willingness to pay. It is important to stress that consumer surplus is measured in monetary terms. Consumer surplus gives us a way to place a monetary cost on inefficient market outcomes (due to government involvement or market failure).except for Grandma. Because Grandma receives more than she would require to paint the house, she derives some benefit from producing in the market.4.Definition of producer surplus: the amount a seller is paid for a good minus the seller’s cost of providing it.5. Note that if you had more than one house to paint, the price in the auction would end up being higher (a little under $800 in the case of two houses) and both Grandma and Georgia would gain producer surplus.B. Using the Supply Curve to Measure Producer Surplus1. We can use the information on cost (willingness to sell) to derive a supply curve for2. marginal seller . Because the supply curve shows the sellers’ cost (willingness to sell), we can use the supply curve to measure producer surplus.are receiving more for the product than before (area C on the graph).b. Because the price is now higher, some new sellers will enter the market and receive producer surplus on these additional units of output sold (area D on the graph).D. Producer surplus is used to measure the economic well-being of producers, much like consumer surplus is used to measure the economic well-being of consumers.ALTERNATIVE CLASSROOM EXAMPLE:Review the material on price floors from Chapter 6. Redraw the market for anagricultural product such as corn. Draw in a price support above the equilibriumprice.Then go through:✍ producer surplus before the price support is put in place.✍ producer surplus after the price support is put in place.Make sure that you discuss the cost of the price support to taxpayers.IV.Market EfficiencyA. The Benevolent Social Planner1. The economic well-being of everyone in society can be measured by total surplus, which is the sum of consumer surplus and producer surplus:Total Surplus = Consumer Surplus + Producer SurplusTotal Surplus = (Value to Buyers – Amount Paid by Buyers) +(Amount Received by Sellers – Cost to Sellers)Because the Amount Paid by Buyers = Amount Received bySellers:2. Definition of efficiency: the property of a resource allocation of maximizing the total surplus received by all members of society .3. Definition of equality: the property of distributing economic prosperity uniformly the members of society .a. Buyers who value the product more than the equilibrium price will purchase the product; those who do not, will not purchase the product. In other words, the free market allocates the supply of a good to the buyers who value it most highly, as measured by their willingness to pay.b. Sellers whose costs are lower than the equilibrium price will produce the product; those whose costs are higher, will not produce the product. In other words, the free market allocates the demand for goods to the sellers who can produce it at the lowest cost.to the marginal buyer is greater than the cost to the marginal seller so total surplus would rise if output increases.b. At any quantity of output greater than the equilibrium quantity, the value of the product to the marginal buyer is less than the cost to the marginal seller so total surplus would rise if output decreases.3. Note that this is one of the reasons that economists believe Principle #6: Markets are usually a good way to organize economic activity.It would be a good idea to remind students that there are circumstances whenthe market process does not lead to the most efficient outcome. Examplesinclude situations such as when a firm (or buyer) has market power over priceor when there are externalities present. These situations will be discussed inlater chapters.Pretty Woman, Chapter 6. Vivien (Julia Roberts) and Edward (Richard Gere)negotiate a price. Afterward, Vivien reveals she would have accepted a lowerprice, while Edward admits he would have paid more. If you have done a goodjob of introducing consumer and producer surplus, you will see the light bulbsgo off above your students’ heads as they watch this clip.C. In the News: Ticket Scalping1. Ticket scalping is an example of how markets work to achieve an efficient outcome.2. This article from The Boston Globe de scribes economist Chip Case’s experience with ticket scalping.D. Case Study: Should There Be a Market in Organs?1. As a matter of public policy, people are not allowed to sell their organs.a. In essence, this means that there is a price ceiling on organs of $0.b. This has led to a shortage of organs.2. The creation of a market for organs would lead to a more efficient allocation of resources, but critics worry about the equity of a market system for organs.V. Market Efficiency and Market FailureA. To conclude that markets are efficient, we made several assumptions about how markets worked.1. Perfectly competitive markets.2. No externalities.B. When these assumptions do not hold, the market equilibrium may not be efficient.C. When markets fail, public policy can potentially remedy the situation. SOLUTIONS TO TEXT PROBLEMS:Quick Quizzes1. Figure 1 shows the demand curve for turkey. The price of turkey is P1 and the consumer surplus that results from that price is denoted CS. Consumer surplus is the amount a buyer is willing to pay for a good minus the amount the buyer actually pays for it. It measures the benefit to buyers of participating in a market.Figure 1 Figure 22. Figure 2 shows the supply curve for turkey. The price of turkey is P1 and the producer surplus that results from that price is denoted PS. Producer surplus is the amount sellers are paid for a good minus the sellers’ cost of providing it (measured by the supply curve). It measures the benefit to sellers of participating in a market.Figure 33. Figure 3 shows the supply and demand for turkey. The price of turkey is P1, consumer surplus is CS, and producer surplus is PS. Producing more turkeys than the equilibrium quantity would lower total surplus because the value to the marginal buyer would be lower than the cost to the marginal seller on those additional units.Questions for Review1. The price a buyer is willing to pay, consumer surplus, and the demand curve are all closely related. The height of the demand curve represents the willingness to pay of the buyers. Consumer surplus is the area below the demand curve and above the price, which equals the price that each buyer is willing to pay minus the price actually paid.2. Sellers' costs, producer surplus, and the supply curve are all closely related. The height of the supply curve represents the costs of the sellers. Producer surplus is the area below the price and above the supply curve, which equals the price received minus each seller's costs of producing the good.Figure 43. Figure 4 shows producer and consumer surplus in a supply-and-demand diagram.4. An allocation of resources is efficient if it maximizes total surplus, the sum of consumer surplus and producer surplus. But efficiency may not be the only goal of economic policymakers; they may also be concerned about equity the fairness of the distribution of well-being.5. The invisible hand of the marketplace guides the self-interest of buyers and sellers into promoting general economic well-being. Despite decentralized decision making and self-interested decision makers, free markets often lead to an efficient outcome.6. Two types of market failure are market power and externalities. Market power may cause market outcomes to be inefficient because firms may cause price and quantity to differ from the levels they would be under perfect competition, which keeps total surplus from being maximized. Externalities are side effects that are not taken into account by buyers and sellers. As a result, the free market does not maximize total surplus.Problems and Applications1. a. Consumer surplus is equal to willingness to pay minus the price paid. Therefore, Melissa’s willingness to pay must be $200 ($120 + $80).b. Her consumer surplus at a price of $90 would be $200 ? $90 = $110.c. If the price of an iPod was $250, Melissa would not have purchased one because the price is greater than her willingness to pay. Therefore, she would receive no consumer surplus.2. If an early freeze in California sours the lemon crop, the supply curve for lemons shifts to the left, as shown in Figure 5. The result is a rise in the price of lemons and a decline in consumer surplus from A + B + C to just A. So consumer surplus declines by the amount B + C.Figure 5 Figure 6In the market for lemonade, the higher cost of lemons reduces the supply of lemonade, as shown in Figure 6. The result is a rise in the price of lemonade and a decline in consumer surplus from D + E + F to just D, a loss of E + F. Note that an event that affects consumer surplus in one market often has effects on consumer surplus in other markets.3. A rise in the demand for French bread leads to an increase in producer surplus in the market for French bread, as shown in Figure 7. The shift of the demand curve leads to an increased price, which increases producer surplus from area A to area A + B + C.Figure 7The increased quantity of French bread being sold increases the demand for flour, as shown in Figure 8. As a result, the price of flour rises, increasing producer surplus from area Dto D + E + F. Note that an event that affects producer surplus in one market leads to effects on producer surplus in related markets.Figure 84. a.Figure 9b. When the price of a bottle of water is $4, Bert buys two bottles of water. His consumer surplus is shown as area A in the figure. He values his first bottle of water at $7, but pays only $4 for it, so has consumer surplus of $3. He values his second bottle of water at $5, but pays only $4for it, so has consumer surplus of $1. Thus Bert’s total consumer surplus is $3 + $1 = $4, which is the area of A in the figure.c. When the price of a bottle of water falls from $4 to $2, Bert buys three bottles of water, an increase of one. His consumer surplus consists of both areas A and B in the figure, an increase in the amount of area B. He gets consumer surplus of $5 from the first bottle ($7 value minus $2 price), $3 from the second bottle ($5 value minus $2 price), and $1 from the third bottle ($3 value minus $2 price), for a total consumer surplus of $9. Thus consumer surplus rises by $5 (which is the size of area B) when the price of a bottle of water falls from $4 to $2.5. a.Figure 10b. When the price of a bottle of water is $4, Ernie sells two bottles of water. His producer surplus is shown as area A in the figure. He receives $4 for his first bottle of water, but it costs only $1 to produce, so Ernie has producer surplus of $3. He also receives $4 for his second bottle of water, which costs $3 to produce, so he has producer surplus of $1. Thus Ernie’s total producer surplus is $3 + $1 = $4, which is the area of A in the figure.c. When the price of a bottle of water rises from $4 to $6, Ernie sells three bottles of water, an increase of one. His producer surplus consists of both areas A and B in the figure, an increase by the amount of area B. He gets producer surplus of $5 from the first bottle ($6 price minus $1 cost), $3 from the second bottle ($6 price minus $3 cost), and $1 from the third bottle ($6 price minus $5 price), for a total producer surplus of $9. Thus producer surplus rises by $5 (which is the size of area B) when the price of a bottle of water rises from $4 to $6.6. a. From Ernie’s supply schedule and Bert’s demand schedule, the quantityequilibrium quantity of two.b. At a price of $4, consumer surplus is $4 and producer surplus is $4, as shown in Problems 3 and 4 above. Total surplus is $4 + $4 = $8.c. If Ernie produced one less bottle, his producer surplus would decline to $3, as shown in Problem 4 above. If Bert consumed one less bottle, his consumer surplus would decline to $3, as shown in Problem 3 above. So total surplus would decline to $3 + $3 = $6.d. If Ernie produced one additional bottle of water, his cost would be $5, but the price is only $4, so his producer surplus would decline by $1. If Bert consumed one additional bottle of water, his value would be $3, but the price is $4, so his consumer surplus would decline by $1. So total surplus declines by $1 + $1 = $2.7. a. The effect of falling production costs in the market for stereos results in a shift to the right in the supply curve, as shown in Figure 11. As a result, the equilibrium price of stereos declines and the equilibrium quantity increases.Figure 11b. The decline in the price of stereos increases consumer surplus from area A to A + B + C + D, an increase in the amount B + C + D. Prior to the shift in supply, producer surplus was areas B + E (the area above the supply curve and below the price). After the shift in supply, producer surplus is areas E + F + G. So producer surplus changes by the amount F + G – B, which may be positive or negative. The increase in quantity increases producer surplus, while the decline in the price reduces producer surplus. Because consumer surplus rises by B + C + D and producer surplus rises by F + G – B, total surplus rises by C + D + F + G.c. If the supply of stereos is very elastic, then the shift of the supply curve benefits consumers most. To take the most dramatic case, suppose the supply curve were horizontal, as shown in Figure 12. Then there is no producer surplus at all. Consumers capture all the benefits of falling production costs, with consumer surplus rising from area A to area A + B.Figure 128. Figure 13 shows supply and demand curves for haircuts. Supply equals demand at a quantity of three haircuts and a price between $4 and $5. Firms A, C, and D should cut the hair of Ellen, Jerry, and Phil. Oprah’s willingness to pay is too low and firm B’s costs are too high, so they do not participate. The maximum total surplus is the area between the demand and supply curves, which totals $11 ($8 value minus $2 cost for the first haircut, plus $7 value minus $3 cost for the second, plus $5 value minus $4 cost for the third).Figure 139. a. The effect of falling production costs in the market for computers results in a shift to the right in the supply curve, as shown in Figure 14. As a result, the equilibrium price of computers declines and the equilibrium quantity increases. The decline in the price of computers increases consumer surplus from area A to A + B + C + D, an increase in the amount B + C + D.Figure 14 Figure 15Prior to the shift in supply, producer surplus was areas B + E (the area above thesupply curve and below the price). After the shift in supply, producer surplus isareas E + F + G. So producer surplus changes by the amount F + G – B, whichmay be positive or negative. The increase in quantity increases producer surplus,while the decline in the price reduces producer surplus. Because consumer surplusrises by B + C + D and producer surplus rises by F + G – B, total surplus rises byC +D + F + G.b. Because typewriters are substitutes for computers, the decline in the price of computers means that people substitute computers for typewriters, shifting the demand for typewriters to the left, as shown in Figure 15. The result is a decline in both the equilibrium price and equilibrium quantity of typewriters. Consumer surplus in the typewriter market changes from area A + B to A + C, a net change of C – B. Producer surplus changes from area C + D + E to area E, a net loss of C + D. Typewriter producers are sad about technological advances in computers because their producer surplus declines.c. Because software and computers are complements, the decline in the price and increase in the quantity of computers means that the demand for software increases, shifting the demand for software to the right, as shown in Figure 16. The result is an increase in both the price and quantity of software. Consumer surplus in the software market changes from B + C to A + B, anet change of A – C. Producer surplus changes from E to C + D + E, an increase of C + D, so software producers should be happy about the technological progress in computers.Figure 16d. Yes, this analysis helps explain why Bill Gates is one the world’s richest people, because his company produces a lot of software that is a complement with computers and there has been tremendous technological advance in computers.10. a. With Provider A, the cost of an extra minute is $0. With Provider B, the cost of anextra minute is $1.b. With Provider A, my friend will purchase 150 minutes [= 150 – (50)(0)]. WithProvider B, my friend would purchase 100 minutes [= 150 – (50)(1)].c. With Provider A, he would pay $120. The cost would be $100 with Provider B.Figure 17d. Figure 17 shows the friend’s demand. With Provider A, he buys 150 minutes andhis consumer surplus is equal to (1/2)(3)(150) – 120 = 105. With Provider B, hisconsumer surplus is equal to (1/2)(2)(100) = 100.e. I would recommend Provider A because he receives greater consumer surplus.11. a. Figure 18 illustrates the demand for medical care. If each procedure has a price of $100, quantity demanded will be Q1 procedures.Figure 18b. If consumers pay only $20 per procedure, the quantity demanded will be Q2 procedures. Because the cost to society is $100, the number of procedures performed is too large to maximize total surplus. The quantity that maximizes total surplus is Q1 procedures, which is less than Q2.c. The use of medical care is excessive in the sense that consumers get procedures whose value is less than the cost of producing them. As a result, the economy’s total surplus is reduced.d. To prevent this excessive use, the consumer must bear the marginal cost of the procedure. But this would require eliminating insurance. Another possibility would be that the insurance company, which pays most of the marginal cost of the procedure ($80, in this case) could decide whether the procedure should be performed. But the insurance company does not get the benefits of the procedure, so its decisions may not reflect the value to the consumer.。
SOLUTIONS TO TEXT PROBLEMS:Quick Quizzes1. Public goods are goods that are neither excludable nor rival. Examples include national defense,knowledge, and uncongested nontoll roads. Common resources are goods that are rival but not excludable. Examples include fish in the ocean, the environment, and congested nontoll roads. 2. The free-rider problem occurs when people receive the benefits of a good but avoid paying for it.The free-rider problem induces the government to provide public goods because if the government uses tax revenue to provide the good, everyone pays for it and everyone enjoys its benefits. The government should decide whether to provide a public good by comparing the good’s costs to its benefits; if the benefits exceed the costs, society is better off.3. Governments try to limit the use of common resources because one person’s use of the resourcediminishes others’ use of it, so there is a negative externality which leads people to use common resources excessively.Questions for Review1. An excludable good is one that people can be prevented from using. A rival good is one for whichone person's use of it diminishes another person's enjoyment of it. Pizza is both excludable, sincea pizza producer can prevent someone from ea ting it who doesn't pay for it, and rival, since whenone person eats it, no one else can eat it.2. A public good is a good that is neither excludable nor rival. An example is national defense, whichprotects the entire nation. No one can be prevented from enjoying the benefits of it, so it is not excludable, and an additional person who benefits from it does not diminish the value of it to others, so it is not rival. The private market will not supply the good, since no one would pay for itbecause they cannot be excluded from enjoying it if they don't pay for it.3. Cost-benefit analysis is a study that compares the costs and benefits to society of providing a publicgood. It is important because the government needs to know which public goods people value most highly and which have benefits that exceed the costs of supplying them. It is hard to dobecause quantifying the benefits is difficult to do from a questionnaire and because respondents have little incentive to tell the truth.4. A common resource is a good that is rival but not excludable. An example is fish in the ocean. Ifsomeone catches a fish, that leaves fewer fish for everyone else, so it's a rival good. But theocean is so vast, you cannot charge people for the right to fish, or prevent them from fishing, so it is not excludable. Thus, without government intervention, people will use the good too much,since they don't account for the costs they impose on others when they use the good.Problems and Applicat ions1. a. The externalities associated with public goods are positive. Since the benefits from thepublic good received by one person don't reduce the benefits received by anyone else, thesocial value of public goods is substantially greater than the private value. Examplesinclude national defense, knowledge, uncongested non-toll roads, and uncongested parks.Since public goods aren't excludable, the free-market quantity is zero, so it is less than the215efficient quantity.b. The externalities associated with common resources are generally negative. Sincecommon resources are rival but not excludable (so not priced) the use of the commonresources by one person reduces the amount available for others. Since commonresources are not priced, people tend to overuse them their private cost of using theresources is less than the social cost. Examples include fish in the ocean, theenvironment, congested non-toll roads, the Town Commons, and congested parks.2. a. (1) Police protection is a natural monopoly, since it is excludable (the police may ignoresome neighborhoods) and not rival (unless the police force is overworked, they're availablewhenever a crime arises). You could make an argument that police protection is rival, ifthe police are too busy to respond to all crimes, so that one person's use of the policereduces the amount available for others; in that case, police protection is a private good.(2) Snow plowing is most likely a common resource. Once a street is plowed, it isn'texcludable. But it is rival, especially right after a big snowfall, since plowing one streetmeans not plowing another street.(3) Education is a private good (with a positive externality). It is excludable, sincesomeone who doesn't pay can be prevented from taking classes. It is rival, since thepresence of an additional student in a class reduces the benefits to others.(4) Rural roads are public goods. They aren't excludable and they aren't rival sincethey're uncongested.(5) City streets are common resources when congested. They aren't excludable, sinceanyone can drive on them. But they are rival, since congestion means every additionaldriver slows down the progress of other drivers. When they aren't congested, city streetsare public goods, since they're no longer rival.b. The government may provide goods that aren't public goods, such as education, becauseof the externalities associated with them.3. a. Charlie is a free rider.b. The government could solve the problem by sponsoring the show and paying for it with taxrevenue collected from everyone.c. The private market could also solve the problem by making people watch commercials thatare incorporated into the program. The existence of cable TV makes the good excludable,so it would no longer be a public good.4. a. Since knowledge is a public good, the benefits of basic scientific research are available tomany people. The private firm doesn't take this into account when choosing how muchresearch to undertake; it only takes into account what it will earn.b. The United States has tried to give private firms incentives to provide basic research bysubsidizing it through organizations like the National Institute of Health and the NationalScience Foundation.c. If it's basic research that adds to knowledge, it isn't excludable at all, unless people in othercountries can be prevented somehow from sharing that knowledge. So perhaps U.S.firms get a slight advantage because they hear about technological advances first, butknowledge tends to diffuse rapidly.5. When a person litters along a highway, others bear the negative externality, so the private costsare low. Littering in your own yard imposes costs on you, so it has a higher private cost and is thus rare.6. When the system is congested, each additional rider imposes costs on other riders. For example,when all seats are taken, some people must stand. Or if there isn't any room to stand, somepeople must wait for a train that isn't as crowded. Increasing the fare during rush hourinternalizes this externality.7. On privately owned land, the amount of logging is likely to be efficient. Loggers have incentives todo the right amount of logging, since they care that the trees replenish themselves and the forest can be logged in the future. Publicly owned land, however, is a common resource, and is likely to be overlogged, since loggers won't worry about the future value of the land.Since public lands tend to be overlogged, the government can improve things by restricting thequantity of logging to its efficient level. Selling permits to log, or taxing logging, could be used to reach the appropriate quantity by internalizing the externality. Such restrictions are unnecessary on privately owned lands, since there is no externality.8. a. Overfishing is rational for fishermen since they're using a common resource. They don'tbear the costs of reducing the number of fish available to others, so it's rational for them tooverfish. The free-market quantity of fishing exceeds the efficient amount.b. A solution to the problem could come from regulating the amount of fishing, taxing fishingto internalize the externality, or auctioning off fishing permits. But these solutionswouldn't be easy to implement, since many nations have access to ocea ns, so internationalcooperation would be necessary, and enforcement would be difficult, because the sea is solarge that it is hard to police.c. By giving property rights to countries, the scope of the problem is reduced, since eachcountry has a greater incentive to find a solution. Each country can impose a tax or issuepermits, and monitor a smaller area for compliance.d. Since government agencies (like the Coast Guard in the United States) protect fishermenand rescue them when they need help, the fishermen aren't bearing the full costs of theirfishing. Thus they fish more than they should.e. The statement, "Only when fishermen believe they are assured a long-term and exclusiveright to a fishery are they likely to manage it in the same far-sighted way as good farmersmanage they land," is sensible. If fishermen owned the fishery, they would be sure not tooverfish, because they would bear the costs of overfishing. This is a case in whichproperty rights help prevent the overuse of a common resource.f. Alternatives include regulating the amount of fishing, taxing fishermen, auctioning offfishing permits, or taxing fish sold in stores. All would tend to reduce the amount offishing from the free-market amount toward the efficient amount.9. The private market provides information about the quality or function of goods and services inseveral different ways. First, producers advertise, providing people information about the product and its quality. Second, private firms provide information to consumers with independent reportson quality; an example is the magazine Consumer Reports. The government plays a role as well, by regulating advertising, thus preventing firms from exaggerating claims about their products,regulating certain goods like gasoline and food to be sure they are measured properly and provided without disease, and not allowing dangerous products on the market.10. To be a public good, a good must be neither rival nor excludable. When the Internet isn’tcongested, it is n ot rival, since one person’s use of it does not affect anyone else. However, at times traffic on the Internet is so great that everything slows down at such times, the Internet is rival. Is the Internet excludable? Since anyone operating a Web site can charge a customer for visiting the site by requiring a password, the Internet is excludable. Thus the Internet is notstrictly a public good. Since the Internet is usually not rival, it is more like a natural monopolythan a public good. However, since most people’s Web sites contain information and exclude no one, the majority of the Internet is a public good (when it is not congested).11. Recognizing that there are opportunity costs that are relevant for cost-benefit analysis is the key toanswering this question. A richer community can afford to place a higher value on life and safety.So the richer community is willing to pay more for a traffic light, and that should be considered in cost-benefit analysis.。
5ELASTICITY AND ITS APPLICATION WHAT’S NEW IN THE S EVENTH EDITION:There are no major changes to this chapter.LEARNING OBJECTIVES:By the end of this chapter, students should understand:the meaning of the elasticity of demand.what determines the elasticity of demand.the meaning of the elasticity of supply.what determines the elasticity of supply.the concept of elasticity in three very different markets (the market for wheat, the market for oil, and the market for illegal drugs).CONTEXT AND PURPOSE:Chapter 5 is the second chapter of a three-chapter sequence that deals with supply and demand and how markets work. Chapter 4 introduced supply and demand. Chapter 5 shows how much buyersand sellers respond to changes in market conditions. Chapter 6 will address the impact of government polices on competitive markets.The purpose of Chapter 5 is to add precision to the supply-and-demand model. We introduce the concept of elasticity, which measures the responsiveness of buyers and sellers to changes in economic variables such as prices and income. The concept of elasticity allows us to make quantitative observations about the impact of changes in supply and demand on equilibrium prices and quantities.KEY POINTS:The price elasticity of demand measures how much the quantity demanded responds to changes in the price. Demand tends to be more elastic if close substitutes are available, if the good is a luxury rather than a necessity, if the market is narrowly defined, or if buyers have substantial time to react to a price change.The price elasticity of demand is calculated as the percentage change in quantity demanded divided by the percentage change in price. If quantity demanded moves proportionately less than the price, then the elasticity is less than one, and demand is said to be inelastic.If quantity demanded moves proportionately more than the price, then the elasticity is greater than one, and demand is said to be elastic.Total revenue, the total amount paid for a good, equals the price of the good times the quantity sold. For inelastic demand curves, total revenue moves in the same direction as the price. For elastic demand curves, total revenue moves in the opposite direction as the price.The income elasticity of demand measures how much the quantity demanded responds tochanges in consumers’ income. The cross-price elasticity of demand measures how much the quantity demanded of one good responds to the price of another good.The price elasticity of supply measures how much the quantity supplied responds to changes in the price. This elasticity often depends on the time horizon under consideration. In most markets, supply is more elastic in the long run than in the short run.The price elasticity of supply is calculated as the percentage change in quantity supplied divided by the percentage change in price. If quantity supplied moves proportionately less than the price, then the elasticity is less than one, and supply is said to be inelastic.If quantity supplied moves proportionately more than the price, then the elasticity is greater than one, and supply is said to be elastic.The tools of supply and demand can be applied in many different kinds of markets. This chapter uses them to analyze the market for wheat, the market for oil, and the market for illegal drugs.CHAPTER OUTLINE:I. The Elasticity of DemandA. Definition of elasticity: a measure of the responsiveness of quantity demanded orquantity supplied to one of its determinants.B. The Price Elasticity of Demand and Its Determinants1. Definition of price elasticity of demand: a measure of how much the quantitydemanded of a good responds to a change in the price of that good, computed as thepercentage change in quantity demanded divided by the percentage change in price.2. Determinants of the Price Elasticity of Demanda. Availability of Close Substitutes: the more substitutes a good has, the moreelastic its demand.b. Necessities versus Luxuries: necessities are more price inelastic.c. Definition of the market: narrowly defined markets (ice cream) have moreelastic demand than broadly defined markets (food).d. Time Horizon: goods tend to have more elastic demand over longer time horizons.C. Computing the Price Elasticity of Demand1. Formula2. Example: the price of ice cream rises by 10% and quantity demanded falls by 20%.Price elasticity of demand = (20%)/(10%) = 23. Because there is an inverse relationship between price and quantity demanded (theprice of ice cream rose by 10% and the quantity demanded fell by 20%), the price elasticity of demand is sometimes reported as a negative number. We will ignorethe minus sign and concentrate on the absolute value of the elasticity.D. The Midpoint Method: A Better Way to Calculate Percentage Changes and Elasticities1. Because we use percentage changes in calculating the price elasticity of demand,the elasticity calculated by going from one point to another on a demand curvewill be different from an elasticity calculated by going from the second point tothe first. This difference arises because the percentage changes are calculatedusing a different base.a. A way around this problem is to use the midpoint method.b. Using the midpoint method involves calculating the percentage change in eitherprice or quantity demanded by dividing the change in the variable by themidpoint between the initial and final levels rather than by the initial levelitself.c. Example: the price rises from $4 to $6 and quantity demanded falls from 120 to80.% change in price = (6 −4)/5 × 100 = 40%% change in quantity demanded = (120 − 80)/100 x 100 = 40%price elasticity of demand = 40/40 = 1E. The Variety of Demand Curves1. Classification of Elasticitya. When the price elasticity of demand is greater than one, demand is defined tobe elastic.b. When the price elasticity of demand is less than one, the demand is defined tobe inelastic.c. When the price elasticity of demand is equal to one, the demand is said to haveunit elasticity.2. In general, the flatter the demand curve that passes through a given point, themore elastic the demand.3. Extreme Casesa. When the price elasticity of demand is equal to zero, the demand is perfectlyinelastic and is a vertical line.b. When the price elasticity of demand is infinite, the demand is perfectlyelastic and is a horizontal line.4. FYI: A Few Elasticities from the Real WorldF. Total Revenue and the Price Elasticity of Demand1. Definition of total revenue: the amount paid by buyers and received by sellers ofa good, computed as the price of the good times the quantity sold.2. If demand is inelastic, the percentage change in price will be greater than thepercentage change in quantity demanded.a. If price rises, quantity demanded falls, and total revenue will rise (becausethe increase in price will be larger than the decrease in quantity demanded).b. If price falls, quantity demanded rises, and total revenue will fall (becausethe fall in price will be larger than the increase in quantity demanded).3. If demand is elastic, the percentage change in quantity demanded will be greaterthan the percentage change in price.a. If price rises, quantity demanded falls, and total revenue will fall (becausethe increase in price will be smaller than the decrease in quantity demanded).b. If price falls, quantity demanded rises, and total revenue will rise (becausethe fall in price will be smaller than the increase in quantity demanded).4. If demand is unit elastic, the percentage change in price will be equal to thepercentage change in quantity demanded.a. If price rises, quantity demanded falls, and total revenue will remain the same(because the increase in price will be equal to the decrease in quantitydemanded).b. If price falls, quantity demanded rises, and total revenue will remain the same(because the fall in price will be equal to the increase in quantity demanded).G. Elasticity and Total Revenue along a Linear Demand Curve1. The slope of a linear demand curve is constant, but the elasticity is not.a. At points with a low price and a high quantity demanded, demand is inelastic.b. At points with a high price and a low quantity demanded, demand is elastic.2. Total revenue also varies at each point along the demand curve.H. Other Demand Elasticities1. Definition of income elasticity of demand: a measure of how much the quantitydemanded of a good responds to a change in consumers’ income, computed as the percentage change in quantity demanded divided by the percentage change in income.a. FormulaFigure 4Note that when demand is elastic and price falls, total revenue rises. Also point out that once demand is inelastic, any further decrease in price% change in quantity demandedIncome elasticity of demand =% change in incomeb. Normal goods have positive income elasticities, while inferior goods havenegative income elasticities.ALTERNATIVE CLASSROOM EXAMPLE:John’s income rises from $20,000 to $22,000 and the quantity of hamburger he buyseach week falls from 2 pounds to 1 pound.% change in quantity demanded = (1−2)/ x 100 = %% change in income = (22,000 −20,000)/21,000 x 100 = %c. Necessities tend to have small income elasticities, while luxuries tend to havelarge income elasticities.2. Definition of cross-price elasticity of demand: a measure of how much the quantitydemanded of one good responds to a change in the price of another good, computedas the percentage change in the quantity demanded of the first good divided by the percentage change in the price of the second good.a. Formulab. Substitutes have positive cross-price elasticities, while complements havenegative cross-price elasticities.ALTERNATIVE CLASSROOM EXAMPLE:The price of apples rises from $ per pound to $ per pound. As a result, thequantity of oranges demanded rises from 8,000 per week to 9,500.% change in quantity of oranges demanded = (9,500 − 8,000)/8,750 x 100 = %% change in price of apples = − / x 100 = 40%II. The Elasticity of SupplyA. The Price Elasticity of Supply and Its Determinants1. Definition of price elasticity of supply: a measure of how much the quantitysupplied of a good responds to a change in the price of that good, computed as thepercentage change in quantity supplied divided by the percentage change in price.2. Determinants of the Price Elasticity of Supplya. Flexibility of sellers: goods that are somewhat fixed in supply (beachfrontproperty) have inelastic supplies.b. Time horizon: supply is usually more inelastic in the short run than in thelong run.B. Computing the Price Elasticity of Supply1. Formula2. Example: the price of milk increases from $ per gallon to $ per gallon and thequantity supplied rises from 9,000 to 11,000 gallons per month.% change in price = –/ × 100 = 10%% change in quantity supplied = (11,000 –9,000)/10,000 × 100 = 20%Price elasticity of supply = (20%)/(10%) = 2C. The Variety of Supply Curves1. In general, the flatter the supply curve that passes through a given point, themore elastic the supply.2. Extreme Casesa. When the elasticity is equal to zero, the supply is said to be perfectlyinelastic and is a vertical line.b. When the elasticity is infinite, the supply is said to be perfectly elastic andis a horizontal line.3. Because firms often have a maximum capacity for production, the elasticity ofsupply may be very high at low levels of quantity supplied and very low at highlevels of quantity supplied.III. Three Applications of Supply, Demand, and ElasticityA. Can Good News for Farming Be Bad News for Farmers1. A new hybrid of wheat is developed that is more productive than those used in thepast. What happens2. Supply increases, price falls, and quantity demanded rises.3. If demand is inelastic, the fall in price is greater than the increase in quantitydemanded and total revenue falls.4. If demand is elastic, the fall in price is smaller than the rise in quantitydemanded and total revenue rises.5. In practice, the demand for basic foodstuffs (like wheat) is usually inelastic.a. This means less revenue for farmers.b. Because farmers are price takers, they still have the incentive to adopt thenew hybrid so that they can produce and sell more wheat.c. This may help explain why the number of farms has declined so dramatically overthe past two centuries.d. This may also explain why some government policies encourage farmers todecrease the amount of crops planted.B. Why Did OPEC Fail to Keep the Price of Oil HighFigure 8Short Run Long Run1. In the 1970s and 1980s, OPEC reduced the amount of oil it was willing to supply toworld markets. The decrease in supply led to an increase in the price of oil and a decrease in quantity demanded. The increase in price was much larger in the short run than the long run. Why2. The demand and supply of oil are much more inelastic in the short run than thelong run. The demand is more elastic in the long run because consumers can adjust to the higher price of oil by carpooling or buying a vehicle that gets bettermileage. The supply is more elastic in the long run because non-OPEC producerswill respond to the higher price of oil by producing more.C. Does Drug Interdiction Increase or Decrease Drug-Related Crime1. The federal government increases the number of federal agents devoted to the waron drugs. What happensa. The supply of drugs decreases, which raises the price and leads to a reductionin quantity demanded. If demand is inelastic, total expenditure on drugs (equalto total revenue) will increase. If demand is elastic, total expenditure willfall.b. Thus, because the demand for drugs is likely to be inelastic, drug-relatedcrime may rise.2. What happens if the government instead pursued a policy of drug educationa. The demand for drugs decreases, which lowers price and quantity supplied. Totalexpenditure must fall (because both price and quantity fall).b. Thus, drug education should not increase drug-related crime.SOLUTIONS TO TEXT PROBLEMS:Quick Quizzes1. The price elasticity of demand is a measure of how much the quantity demanded of agood responds to a change in the price of that good, computed as the percentage change in quantity demanded divided by the percentage change in price.When demand is inelastic (a price elasticity less than 1), a price increase raisestotal revenue, and a price decrease reduces total revenue. When demand is elastic (a price elasticity greater than 1), a price increase reduces total revenue, and a price decrease increases total revenue. When demand is unit elastic (a price elasticity equal to 1), a change in price does not affect total revenue.2. The price elasticity of supply is a measure of how much the quantity supplied of agood responds to a change in the price of that good, computed as the percentage change in quantity supplied divided by the percentage change in price.The price elasticity of supply might be different in the long run than in theshort run because over short periods of time, firms cannot easily change the sizes Figure 9(a) Drug Interdiction (b) Drug Educationof their factories to make more or less of a good. Thus, in the short run, thequantity supplied is not very responsive to the price. However, over longerperiods, firms can build new factories, expand existing factories, close oldfactories, or they can enter or exit a market. So, in the long run, the quantitysupplied can respond substantially to a change in price.3. A drought that destroys half of all farm crops could be good for farmers (at leastthose unaffected by the drought) if the demand for the crops is inelastic. Theshift to the left of the supply curve leads to a price increase that will raisetotal revenue if the price elasticity of demand is less than 1.No one farmer would have an incentive to destroy her crops in the absence of adrought because she takes the market price as given. Only if all farmersdestroyed a portion of their crops together, for example through a governmentprogram, would this plan work to make farmers better off.Questions for Review1. The price elasticity of demand measures how much quantity demanded responds to achange in price. The income elasticity of demand measures how much quantitydemanded responds to changes in consumers' income.2. The determinants of the price elasticity of demand include the availability ofclose substitutes, whether the good is a necessity or a luxury, the breadth of thedefinition of the market, and the time horizon. Goods with close substitutes havegreater elasticities, luxury goods have greater price elasticities thannecessities, goods in more narrowly defined markets have greater elasticities, andthe elasticity of demand is greater the longer the time horizon.3. An elasticity greater than one means that demand is elastic. When the elasticityis greater than one, the percentage change in quantity demanded exceeds thepercentage change in price. When the elasticity equals zero, demand is perfectly inelastic. There is no change in quantity demanded when there is a change in price.4. Figure 1 presents a supply-and-demand diagram, showing the equilibrium price, P,the equilibrium quantity, Q, and the total revenue received by producers. Total revenue equals the equilibrium price times the equilibrium quantity, which is the area of the rectangle shown in the figure.Figure 15. If demand is elastic, an increase in price reduces total revenue. With elasticdemand, the quantity demanded falls by a greater percentage than the price rises.As a result, total revenue moves in the opposite direction as the price. Thus, if price rises, total revenue falls.6. A good with income elasticity less than zero is called an inferior good because asincome rises, the quantity demanded declines.7. The price elasticity of supply is calculated as the percentage change in quantitysupplied divided by the percentage change in price. It measures how much quantity supplied responds to changes in price.8. If a fixed quantity of a good is available and no more can be made, the priceelasticity of supply is zero. Regardless of the percentage change in price, therewill be no change in the quantity supplied.9. Destruction of half of the fava bean crop is more likely to hurt fava bean farmersif the demand for fava beans is very elastic. Destruction of half of the cropcauses the supply curve to shift to the left resulting in a higher price of favabeans. When demand is very elastic, an increase in price leads to a decrease intotal revenue because the decrease in quantity demanded outweighs the increase inprice.Quick Check Multiple Choice1. a2. b3. d4. c5. a6. cProblems and Applications1. a. Mystery novels have more elastic demand than required textbooks because mysterynovels have close substitutes and are a luxury good, while required textbooksare a necessity with no close substitutes. If the price of mystery novels wereto rise, readers could substitute other types of novels, or buy fewer novelsaltogether. But if the price of required textbooks were to rise, students wouldhave little choice but to pay the higher price. Thus, the quantity demanded ofrequired textbooks is less responsive to price than the quantity demanded ofmystery novels.b. Beethoven recordings have more elastic demand than classical music recordingsin general. Beethoven recordings are a narrower market than classical musicrecordings, so it is easier to find close substitutes for them. If the price of Beethoven recordings were to rise, people could substitute other classicalrecordings, like Mozart. But if the price of all classical recordings were torise, substitution would be more difficult. (A transition from classical musicto rap is unlikely!) Thus, the quantity demanded of classical recordings isless responsive to price than the quantity demanded of Beethoven recordings.c. Subway rides during the next five years have more elastic demand than subwayrides during the next six months. Goods have a more elastic demand over longertime horizons. If the fare for a subway ride was to rise temporarily, consumers could not switch to other forms of transportation without great expense orgreat inconvenience. But if the fare for a subway ride was to remain high for a long time, people would gradually switch to alternative forms of transportation.As a result, the quantity demanded of subway rides during the next six monthswill be less responsive to changes in the price than the quantity demanded ofsubway rides during the next five years.d. Root beer has more elastic demand than water. Root beer is a luxury with closesubstitutes, while water is a necessity with no close substitutes. If the price of water were to rise, consumers have little choice but to pay the higher price.But if the price of root beer were to rise, consumers could easily switch toother sodas or beverages. So the quantity demanded of root beer is moreresponsive to changes in price than the quantity demanded of water.2. a. For business travelers, the price elasticity of demand when the price oftickets rises from $200 to $250 is [(2,000 – 1,900)/1,950]/[(250 – 200)/225]= = . For vacationers, the price elasticity of demand when the price oftickets rises from $200 to $250 is [(800 – 600)/700] / [(250 – 200)/225] == .b. The price elasticity of demand for vacationers is higher than the elasticityfor business travelers because vacationers can choose a substitute more easilythan business travelers. For example, vacationers can choose a different mode of transportation (like driving or taking the train), a different destination, a different departure date, and a different return date. They may also choose to not travel at all. Business travelers are less likely to do so because their schedules are less adaptable.3. a. The percentage change in price is equal to – / x 100 = 20%. If the priceelasticity of demand is , quantity demanded will fall by 4% in the short run [ ]. If the price elasticity of demand is , quantity demanded will fall by 14% in the long run [].b. Over time, consumers can make adjustments to their homes by purchasingalternative heat sources such as natural gas or electric furnaces. Thus, they can respond more easily to the change in the price of heating oil in the long run than in the short run.4. If quantity demanded fell, price must have increased according to the law ofdemand. For a price increase to increase total revenue, the percentage increase in the price must be greater than the percentage decline in quantity demanded. Therefore, demand is inelastic.5. , a. The effect on the market for coffee beans is shown in Figure 2. When ahurricane destroys half of the crop, the supply of coffee beans decreases, the price of coffee beans increases, and the quantity decreases.QuantityPrice Figure 2Demand S 1 S 2b. The effect on the market for cups of coffee is shown in Figure 2. When theprice of coffee beans, an important input into the production of a cup ofcoffee, increases, the supply of cups of coffee decreases, the price of a cup of coffee increases, and the quantity decreases.Because cups of coffee have an inelastic demand, when the price of a cup ofcoffee increases, the total expenditure on coffee increases.c. The effect on the market for donuts is shown in Figure 3. When the price ofcoffee increases and the quantity demanded of coffee decreases, consumersdemand fewer donuts because coffee and donuts are complements. When demanddecreases, the price of donuts decreases.Because donuts have an inelastic demand, when the price of donuts decreases,the total expenditure on donuts decreases.6. a. If your income is $10,000, your price elasticity of demand as the price of DVDsrises from $8 to $10 is [(40 – 32)/36]/[(10 – 8)/9] = = 1. If your income is $12,000, the elasticity is [(50 – 45)/]/[(10 – 8)/9] = = .b. If the price is $12, your income elasticity of demand as your income increasesfrom $10,000 to $12,000 is [(30 – 24)/27]/[(12,000 – 10,000)/11,000] = = . Price Figure 3If the price is $16, your income elasticity of demand as your income increases from $10,000 to $12,000 is [(12 – 8)/10]/[(12,000 – 10,000)/11,000] = = .7. a. If Maria always spends one-third of her income on clothing, then her incomeelasticity of clothing demand is one, because maintaining her clothingexpenditures as a constant fraction of her income means the percentage changein her quantity of clothing must equal her percentage change in income.b. Maria's price elasticity of clothing demand is also one, because everypercentage point increase in the price of clothing would lead her to reduce her quantity purchased by the same percentage.c. Because Maria spends a smaller proportion of her income on clothing, then forany given price, her quantity demanded will be lower. Thus, her demand curvehas shifted to the left. Because she will again spend a constant fraction ofher income on clothing, her income and price elasticities of demand remain one.8. a. The percentage change in price (using the midpoint formula) is – / × 100%= %. Therefore, the price elasticity of demand is = , which is very elastic.b. Because the demand is inelastic, the Transit Authority's revenue rises when thefare rises.c. The elasticity estimate might be unreliable because it is only the first monthafter the fare increase. As time goes by, people may switch to other means oftransportation in response to the price increase. So the elasticity may belarger in the long run than it is in the short run.9. Walt's price elasticity of demand is zero, because he wants the same quantityregardless of the price. Jessie's price elasticity of demand is one, because he spends the same amount on gas, no matter what the price, which means hispercentage change in quantity is equal to the percentage change in price.10. a. With a price elasticity of demand of , reducing the quantity demanded ofcigarettes by 20% requires a 50% increase in price, because 20/50 = . With the price of cigarettes currently $2, this would require an increase in the priceto $ a pack using the midpoint method (note that ($ – $2)/$ = .50).b. The policy will have a larger effect five years from now than it does one yearfrom now. The elasticity is larger in the long run, because it may take sometime for people to reduce their cigarette usage. The habit of smoking is hardto break in the short run.c. Because teenagers do not have as much income as adults, they are likely to havea higher price elasticity of demand. Also, adults are more likely to beaddicted to cigarettes, making it more difficult to reduce their quantitydemanded in response to a higher price.11. To determine whether you should increase or decrease the price of admissions, youneed to know if the demand is elastic or inelastic. If demand is elastic, adecline in the price of admissions will increase total revenue. If demand isinelastic, an increase in the price of admissions will cause total revenue to rise.12. A worldwide drought could increase the total revenue of farmers if the priceelasticity of demand for grain is inelastic. The drought reduces the supply of grain, but if demand is inelastic, the reduction of supply causes a large increase in price. Total farm revenue would rise as a result. If there is only a drought in Kansas, Kansas’ production is not a large enough proportion of the total farm product to have much impact on the price. As a result, price does not change (or changes by only a slight amount), while the output by Kansas farmers declines, thus reducing their income.。
曼昆微观经济学课后练习英文答案集团标准化办公室:[VV986T-J682P28-JP266L8-68PNN]the link between buyers’ willingness to pay for a good and the demandcurve.how to define and measure consumer surplus.the link between sellers’ costs of producing a good and the supply curve.how to define and measure producer surplus.that the equilibrium of supply and demand maximizes total surplus in amarket.CONTEXT AND PURPOSE:Chapter 7 is the first chapter in a three-chapter sequence on welfare economics and market efficiency. Chapter 7 employs the supply and demand model to develop consumer surplus and producer surplus as a measure of welfare and market efficiency. These concepts are then utilized in Chapters 8 and 9 to determine the winners and losers from taxation and restrictions on international trade.The purpose of Chapter 7 is to develop welfare economics—the study of how the allocation of resources affects economic well-being. Chapters 4 through 6 employed supply and demand in a positive framework, which focused on the question, “What is the equilibrium price and quantity in a market” This chapter now addresses the normative question, “Is the equilibrium price and quantity in a market the best possible solution to the resource allocation problem, or is it simply the price and quantity that balance supply and demand” Students will discover that under most circumstances the equilibrium price and quantity is also the one that maximizes welfare.KEY POINTS:Consumer surplus equals buyers’ willingness to pay for a good minus the amount they actually pay for it, and it measures the benefit buyers get from participating in a market. Consumer surplus can be computed by finding the area below the demand curve and above the price.Producer surplus equals the amount sellers receive for their goods minus their costs of production, and it measures the benefit sellers get from participating in a market. Producer surplus can be computed by finding the area below the price and above the supply curve.An allocation of resources that maximizes the sum of consumer and producer surplus is said to be efficient. Policymakers are often concerned with the efficiency, as well as the equality, of economic outcomes.The equilibrium of supply and demand maximizes the sum of consumer andproducer surplus. That is, the invisible hand of the marketplace leadsbuyers and sellers to allocate resources efficiently.Markets do not allocate resources efficiently in the presence of market failures such as market power or externalities.CHAPTER OUTLINE:I. Definition of welfare economics: the study of how the allocation of resources affects economic well-being.A. Willingness to Pay1. Definition of willingness to pay: the maximum amount that a buyer will pay for a good.2. Example: You are auctioning a mint-condition recording of Elvis Presley’s first album. Four buyers show up. Their willingness to pay is as follows:If the bidding goes to slightly higher than $80, all buyersdrop out except for John. Because John is willing to paymore than he has to for the album, he derives some benefitfrom participating in the market.3. Definition of consumer surplus: the amount a buyer is willing to payfor a good minus the amount the buyer actually pays for it.4. Note that if you had more than one copy of the album, the price in the auction would end up being lower (a little over $70 in the case of two albums) and both John and Paul would gain consumer surplus.B. Using the Demand Curve to Measure Consumer Surplus1. We can use the information on willingness to pay to derive a demandmarginal buyer . Because the demand curve shows the buyers’ willingness to pay, we can use the demand curve to measure c onsumer surplus.C. How a Lower Price Raises Consumer Surplussurplus because they are paying less for the product than before (area A on the graph).b. Because the price is now lower, some new buyers will enter the market and receive consumer surplus on these additional units of output purchased (area B on the graph).D. What Does Consumer Surplus Measure?1. Remember that consumer surplus is the difference between the amount that buyers are willing to pay for a good and the price that they actually pay.2. Thus, it measures the benefit that consumers receive from the good as the buyers themselves perceive it.III. Producer SurplusA. Cost and the Willingness to Sell1. Definition of cost: the value of everything a seller must give up to produce a good .2. Example: You want to hire someone to paint your house. You accept bidsfor the work from four sellers. Each painter is willing to work if the priceyou will pay exceeds her opportunity cost. (Note that this opportunity costthus represents willingness to sell.) The costs are:sellers will drop out except for Grandma. Because Grandma receives more than she would require to paint the house, she derives some benefit from producing in the market.4. Definition of producer surplus: the amount a seller is paid for a good minus the seller’s cost of providing it.5. Note that if you had more than one house to paint, the price in the auction would end up being higher (a little under $800 in the case of two houses) and both Grandma and Georgia would gain producer surplus.ALTERNATIVE CLASSROOM EXAMPLE:Review the material on price ceilings from Chapter 6. Redraw themarket for two-bedroom apartments in your town. Draw in a priceceiling below the equilibrium price.Then go through:consumer surplus before the price ceiling is put into place. consumer surplus after the price ceiling is put into place. You will need to take some time to explain the relationship between the producers’ willingness to sell and the cost of producing the good. The relationship between cost and the supply curve is not as apparent as the relationship between the It is important to stress that consumer surplus is measured inmonetary terms. Consumer surplus gives us a way to place amonetary cost on inefficient market outcomes (due to governmentB. Using the Supply Curve to Measure Producer Surplus1. We can use the information on cost (willingness to sell) to derive a2.the cost of the marginal seller. Because the supply curve shows the sellers’ cost (willingness to sell), we can use the supply curve to measure producer surplus.C. How a Higher Price Raises Producer Surplussurplus because they are receiving more for the product than before (area C on the graph).b. Because the price is now higher, some new sellers will enter the market and receive producer surplus on these additional units of output sold (area D on the graph).D. Producer surplus is used to measure the economic well-being of producers,ALTERNATIVE CLASSROOM EXAMPLE:Review the material on price floors from Chapter 6. Redraw the marketfor an agricultural product such as corn. Draw in a price supportabove the equilibrium price.Then go through:producer surplus before the price support is put in place.producer surplus after the price support is put in place.Make sure that you discuss the cost of the price support tomuch like consumer surplus is used to measure the economic well-being of consumers.IV. Market EfficiencyA. The Benevolent Social Planner1. The economic well-being of everyone in society can be measured by total surplus, which is the sum of consumer surplus and producer surplus:Total Surplus = Consumer Surplus + Producer SurplusTotal Surplus = (Value to Buyers – Amount Paid byBuyers) +(Amount Received by Sellers – Cost to Sellers)Because the Amount Paid by Buyers = Amount Received bySellers:2. Definition of efficiency: the property of a resource allocation of maximizing the total surplus received by all members of society .3. Definition of equality: the property of distributing economicprosperity uniformly the members of society .a. Buyers who value the product more than the equilibrium price will purchase the product; those who do not, will not purchase the product. Inother words, the free market allocates the supply of a good to the buyers who value it most highly, as measured by their willingness to pay.b. Sellers whose costs are lower than the equilibrium price will produce the product; those whose costs are higher, will not produce the product. Inother words, the free market allocates the demand for goods to the sellers who can produce it at the lowest cost.value of the product to the marginal buyer is greater than the cost to the marginal seller so total surplus would rise if output increases.Pretty Woman, Chapter 6. Vivien (Julia Roberts) and Edward(Richard Gere) negotiate a price. Afterward, Vivien reveals shewould have accepted a lower price, while Edward admits he wouldhave paid more. If you have done a good job of introducingconsumer and producer surplus, you will see the light bulbs gob. At any quantity of output greater than the equilibrium quantity, the value of the product to the marginal buyer is less than the cost to the marginal seller so total surplus would rise if output decreases.3. Note that this is one of the reasons that economists believe Principle #6: Markets are usually a good way to organize economic activity.C. In the News: Ticket Scalping1. Ticket scalping is an example of how markets work to achieve anefficient outcome.2. This article from The Boston Globe describes economist Chip Case’sexperience with ticket scalping.D. Case Study: Should There Be a Market in Organs?1. As a matter of public policy, people are not allowed to sell their organs.a. In essence, this means that there is a price ceiling on organs of $0.b. This has led to a shortage of organs.2. The creation of a market for organs would lead to a more efficientallocation of resources, but critics worry about the equity of a market system for organs.V. Market Efficiency and Market FailureA. To conclude that markets are efficient, we made several assumptions about how markets worked.1. Perfectly competitive markets.2. No externalities.B. When these assumptions do not hold, the market equilibrium may not be efficient.C. When markets fail, public policy can potentially remedy the situation. SOLUTIONS TO TEXT PROBLEMS:Quick Quizzes1. Figure 1 shows the demand curve for turkey. The price of turkey is P 1and the consumer surplus that results from that price is denoted CS. Consumer surplus is the amount a buyer is willing to pay for a good minus the amount the buyer actually pays for it. It measures the benefit to buyers ofparticipating in a market.Figure 1 Figure 22. Figure 2 shows the supply curve for turkey. The price of turkey is P 1and the producer surplus that results from that price is denoted PS. Producer surplus is the amount sellers are paid for a good minus the sellers’ cost of providing it (measured by the supply curve). It measures the benefit to sellers of participating in a market.It would be a good idea to remind students that there are circumstances when the market process does not lead to the most efficient outcome. Examples include situations such as when a firm (or buyer) has market power over price or when there areFigure 33. Figure 3 shows the supply and demand for turkey. The price of turkey is P, consumer surplus is CS, and producer surplus is PS. Producing more turkeys 1than the equilibrium quantity would lower total surplus because the value to the marginal buyer would be lower than the cost to the marginal seller on those additional units.Questions for Review1. The price a buyer is willing to pay, consumer surplus, and the demand curve are all closely related. The height of the demand curve represents the willingness to pay of the buyers. Consumer surplus is the area below the demand curve and above the price, which equals the price that each buyer is willing to pay minus the price actually paid.2. Sellers' costs, producer surplus, and the supply curve are all closely related. The height of the supply curve represents the costs of the sellers. Producer surplus is the area below the price and above the supply curve, which equals the price received minus each seller's costs of producing the good.Figure 43. Figure 4 shows producer and consumer surplus in a supply-and-demand diagram.4. An allocation of resources is efficient if it maximizes total surplus, the sum of consumer surplus and producer surplus. But efficiency may not be the only goal of economic policymakers; they may also be concerned about equitythe fairness of the distribution of well-being.5. The invisible hand of the marketplace guides the self-interest of buyers and sellers into promoting general economic well-being. Despite decentralized decision making and self-interested decision makers, free markets often lead to an efficient outcome.6. Two types of market failure are market power and externalities. Market power may cause market outcomes to be inefficient because firms may cause price and quantity to differ from the levels they would be under perfect competition, which keeps total surplus from being maximized. Externalities are side effects that are not taken into account by buyers and sellers. As a result, the free market does not maximize total surplus.Problems and Applications1. a. Consumer surplus is equal to willingness to pay minus the price paid. Therefore, Melissa’s willingness to pay must be $200 ($120 + $80).b. Her consumer surplus at a price of $90 would be $200 $90 = $110.c. If the price of an iPod was $250, Melissa would not have purchased one because the price is greater than her willingness to pay. Therefore, she would receive no consumer surplus.2. If an early freeze in California sours the lemon crop, the supply curve for lemons shifts to the left, as shown in Figure 5. The result is a rise in the price of lemons and a decline in consumer surplus from A + B + C to just A. So consumer surplus declines by the amount B + C.Figure 5 Figure 6In the market for lemonade, the higher cost of lemons reduces the supply of lemonade, as shown in Figure 6. The result is a rise in the price of lemonade and a decline in consumer surplus from D + E + F to just D, a loss of E + F. Note that an event that affects consumer surplus in one market oftenhas effects on consumer surplus in other markets.3. A rise in the demand for French bread leads to an increase in producer surplus in the market for French bread, as shown in Figure 7. The shift of the demand curve leads to an increased price, which increases producer surplusfrom area A to area A + B + C.Figure 7The increased quantity of French bread being sold increases the demandfor flour, as shown in Figure 8. As a result, the price of flour rises, increasing producer surplus from area D to D + E + F. Note that an event that affects producer surplus in one market leads to effects on producer surplus in related markets.Figure 84. a.Figure 9b. When the price of a bottle of water is $4, Bert buys two bottles of water. His consumer surplus is shown as area A in the figure. He values hisfirst bottle of water at $7, but pays only $4 for it, so has consumer surplus of $3. He values his second bottle of water at $5, but pays only $4 for it, so has consumer surplus of $1. Thus Bert’s total consumer surplus is $3 + $1 = $4, which is the area of A in the figure.c. When the price of a bottle of water falls from $4 to $2, Bert buys three bottles of water, an increase of one. His consumer surplus consists of both areas A and B in the figure, an increase in the amount of area B. He gets consumer surplus of $5 from the first bottle ($7 value minus $2 price), $3from the second bottle ($5 value minus $2 price), and $1 from the third bottle ($3 value minus $2 price), for a total consumer surplus of $9. Thus consumer surplus rises by $5 (which is the size of area B) when the price of a bottle of water falls from $4 to $2.5. a.Figure 10b. When the price of a bottle of water is $4, Ernie sells two bottles of water. His producer surplus is shown as area A in the figure. He receives $4 for his first bottle of water, but it costs only $1 to produce, so Ernie has producer surplus of $3. He also receives $4 for his second bottle of water, which costs $3 to produce, so he has producer surplus of $1. Thus Ernie’s total producer surplus is $3 + $1 = $4, which is the area of A in the figure.c. When the price of a bottle of water rises from $4 to $6, Ernie sells three bottles of water, an increase of one. His producer surplus consists of both areas A and B in the figure, an increase by the amount of area B. He gets producer surplus of $5 from the first bottle ($6 price minus $1 cost), $3 from the second bottle ($6 price minus $3 cost), and $1 from the third bottle ($6 price minus $5 price), for a total producer surplus of $9. Thus producer surplus rises by $5 (which is the size of area B) when the price of a bottle of water rises from $4 to $6.6. a. From Ernie’s supply schedule and Bert’s demand schedule, thean equilibrium quantity of two.b. At a price of $4, consumer surplus is $4 and producer surplus is $4, as shown in Problems 3 and 4 above. Total surplus is $4 + $4 = $8.c. If Ernie produced one less bottle, his producer surplus would decline to $3, as shown in Problem 4 above. If Bert consumed one less bottle, hisconsumer surplus would decline to $3, as shown in Problem 3 above. So total surplus would decline to $3 + $3 = $6.d. If Ernie produced one additional bottle of water, his cost would be $5, but the price is only $4, so his producer surplus would decline by $1. If Bert consumed one additional bottle of water, his value would be $3, but the price is $4, so his consumer surplus would decline by $1. So total surplus declines by $1 + $1 = $2.7. a. The effect of falling production costs in the market for stereos results in a shift to the right in the supply curve, as shown in Figure 11. As a result, the equilibrium price of stereos declines and the equilibriumquantity increases.Figure 11b. The decline in the price of stereos increases consumer surplus from area A to A + B + C + D, an increase in the amount B + C + D. Prior to the shift in supply, producer surplus was areas B + E (the area above the supply curve and below the price). After the shift in supply, producer surplus is areas E + F + G. So producer surplus changes by the amount F + G – B, which may be positive or negative. The increase in quantity increases producer surplus, while the decline in the price reduces producer surplus. Because consumer surplus rises by B + C + D and producer surplus rises by F + G – B, total surplus rises by C + D + F + G.c. If the supply of stereos is very elastic, then the shift of the supply curve benefits consumers most. To take the most dramatic case, suppose the supply curve were horizontal, as shown in Figure 12. Then there is no producer surplus at all. Consumers capture all the benefits of falling production costs, with consumer surplus rising from area A to area A + B.Figure 128. Figure 13 shows supply and demand curves for haircuts. Supply equals demand at a quantity of three haircuts and a price between $4 and $5. Firms A, C, and D should cut the hair of Ellen, Jerry, and Phil. Oprah’s willingnessto pay is too low and firm B’s costs are too high, so they do not participate. The maximum total surplus is the area between the demand and supply curves, which totals $11 ($8 value minus $2 cost for the first haircut, plus $7 value minus $3 cost for the second, plus $5 value minus $4 cost for the third).Figure 139. a. The effect of falling production costs in the market for computers results in a shift to the right in the supply curve, as shown in Figure 14. As a result, the equilibrium price of computers declines and the equilibrium quantity increases. The decline in the price of computers increases consumer surplus from area A to A + B + C + D, an increase in the amount B + C + D.Figure 14 Figure 15Prior to the shift in supply, producer surplus was areas B + E(the area above the supply curve and below the price). After theshift in supply, producer surplus is areas E + F + G. So producersurplus changes by the amount F + G – B, which may be positive ornegative. The increase in quantity increases producer surplus,while the decline in the price reduces producer surplus. Becauseconsumer surplus rises by B + C + D and producer surplus rises byF +G – B, total surplus rises by C + D + F + G.b. Because typewriters are substitutes for computers, the decline in the price of computers means that people substitute computers for typewriters, shifting the demand for typewriters to the left, as shown in Figure 15. The result is a decline in both the equilibrium price and equilibrium quantity of typewriters. Consumer surplus in the typewriter market changes from area A + B to A + C, a net change of C – B. Producer surplus changes from area C + D + E to area E, a net loss of C + D. Typewriter producers are sad about technological advances in computers because their producer surplus declines.c. Because software and computers are complements, the decline in the price and increase in the quantity of computers means that the demand for software increases, shifting the demand for software to the right, as shown in Figure 16. The result is an increase in both the price and quantity of software. Consumer surplus in the software market changes from B + C to A + B, a net change of A – C. Producer surplus changes from E to C + D + E, an increase of C + D, so software producers should be happy about the technological progress in computers.Figure 16d. Yes, this analysis helps explain why Bill Gates is one the world’s richest people, because his company produces a lot of software that is a complement with computers and there has been tremendous technological advance in computers.10. a. With Provider A, the cost of an extra minute is $0. WithProvider B, the cost of an extra minute is $1.b. With Provider A, my friend will purchase 150 minutes [= 150 –(50)(0)]. With Provider B, my friend would purchase 100 minutes [=150 – (50)(1)].c. With Provider A, he would pay $120. The cost would be $100 with Provider B.Figure 17d. Figure 17 shows the friend’s demand. With Provider A, he buys 150minutes and his consumer surplus is equal to (1/2)(3)(150) – 120= 105. With Provider B, his consumer surplus is equal to(1/2)(2)(100) = 100.e. I would recommend Provider A because he receives greater consumer surplus.11. a. Figure 18 illustrates the demand for medical care. If each procedure has a price of $100, quantity demanded will be Q1 procedures.Figure 18b. If consumers pay only $20 per procedure, the quantity demanded will be Qprocedures. Because the cost to society is $100, the number of procedures 2performed is too large to maximize total surplus. The quantity that maximizes total surplus is Q1 procedures, which is less than Q2.c. The use of medical care is excessive in the sense that consumers get procedures whose value is less than the cost of producing them. As a result, the economy’s total surplus is reduced.d. To prevent this excessive use, the consumer must bear the marginal cost of the procedure. But this would require eliminating insurance. Another possibility would be that the insurance company, which pays most of the marginal cost of the procedure ($80, in this case) could decide whether the procedure should be performed. But the insurance company does not get the benefits of the procedure, so its decisions may not reflect the value to the consumer.。
221WHAT’S NEW IN THE SEVENTH EDITION:There are no major changes to this chapter.LEARNING OBJECTIVES:By the end of this chapter, students should understand:what items are included in a firm’s costs of production. the link between a firm’s production process and its total costs.the meaning of average total cost and marginal cost and how they are related. the shape of a typical firm’s cost curves.the relationship between short-run and long-run costs.CONTEXT AND PURPOSE:Chapter 13 is the first chapter in a five-chapter sequence dealing with firm behavior and the organization of industry. It is important that students become comfortable with the material in Chapter 13 because Chapters 14 through 17 are based on the concepts developed in Chapter 13. To be more specific, Chapter 13 develops the cost curves on which firm behavior is based. The remaining chapters in thissection (Chapters 14-17) utilize these cost curves to develop the behavior of firms in a variety of different market structures—competitive, monopolistic, monopolistically competitive, and oligopolistic.The purpose of Chapter 13 is to address the costs of production and develop the firm’s cost curves. These cost curves underlie the firm’s supply curve. In previous chapters, we summarized the firm’s production decisions by starting with the supply curve. While this is suitable for answering manyquestions, it is now necessary to address the costs that underlie the supply curve in order to address the part of economics known as industrial organization —the study of how firms’ decisions about prices and quantities depend on the market conditions they face.KEY POINTS:The goal of firms is to maximize profit, which equals total revenue minus total cost.THE COSTS OF PRODUCTION222 ❖ Chapter 13/The Costs of Production∙When analyzing a firm’s behavior, it is important to include all the opportunity costs of production. Some of the opportunity costs, such as the wages a firm pays its workers, are explicit. Other opportunity costs, such as the wages the firm owner gives up by working at the firm rather than taking another job, are implicit. Economic profit takes both explicit and implicit costs into account, whereas accounting profits consider only explicit costs.∙A firm’s costs reflect its production process. A typical firm’s production function gets flatter as the quantity of an input increases, displaying the property of diminishing marginal product. As a result, a firm’s total-cost curve gets steeper as the quantity produced rises.∙A firm’s total costs can be divided between fixed costs and variable costs. Fixed costs are costs that do not change when the firm alters the quantity of output produced. Variable costs are costs that change when the firm alters the quantity of output produced.∙From a firm’s total cost, two related measures of cost are derived. Average total cost is total cost divided by the quantity of output. Marginal cost is the amount by which total cost rises if output increases by one unit.∙When analyzing firm behavior, it is often useful to graph average total cost and marginal cost. For a typical firm, marginal cost rises with the quantity of output. Average total cost first falls as output increases and then rises as output increases further. The marginal-cost curve always crosses the average-total-cost curve at the minimum of average total cost.∙A firm’s costs often depend on the time horizon considered. In particular, many costs are fixed in the short run but variable in the long run. As a result, when the firm changes its level of production, average total cost may rise more in the short run than in the long run.CHAPTER OUTLINE:I.What Are Costs?A.Total Revenue, Total Cost, and Profit1.The goal of a firm is to maximize profit.Chapter 13/The Costs of Production ❖ 2232.Definition oftotal revenue: the amount a firm receives for the sale of its output.3.Definition of total cost: the market value of the inputs a firm uses in production.4.Definition of profit: total revenue minus total cost.B.Costs as Opportunity Costs1.Principle #2: The cost of something is what you give up to get it.2.The costs of producing an item must include all of the opportunity costs of inputs used inproduction.3.Total opportunity costs include both implicit and explicit costs.a.Definition of explicit costs: input costs that require an outlay of money by thefirm.b.Definition of implicit costs: input costs that do not require an outlay of moneyby the firm.c.The total cost of a business is the sum of explicit costs and implicit costs.d.This is the major way in which accountants and economists differ in analyzing theperformance of a business.e.Accountants focus on explicit costs, while economists examine both explicit and implicitcosts.C.The Cost of Capital as an Opportunity Cost1.The opportunity cost of financial capital is an important cost to include in any analysis of firmperformance.2.Example: Caroline uses $300,000 of her savings to start her firm. It was in a savings accountpaying 5% interest.3.Because Caroline could have earned $15,000 per year on this savings, we must include thisopportunity cost. (Note that an accountant would not count this $15,000 as part of the firm'scosts.)224 ❖ Chapter 13/The Costs of Production4.If Caroline had instead borrowed $200,000 from a bank and used $100,000 from her savings,the opportunity cost would not change if the interest rate stayed the same (according to the economist). But the accountant would now count the $10,000 in interest paid for the bank loan.D.Economic Profit versus Accounting Profit1.Figure 1 highlights the differences in the ways in which economists and accountants calculateprofit.2.Definition of economic profit: total revenue minus total cost, including both explicitand implicit costs .a.Economic profit is what motivates firms to supply goods and services.b.To understand how industries evolve, we need to examine economic profit.3.Definition of accounting profit: total revenue minus total explicit cost .4.If implicit costs are greater than zero, accounting profit will always exceed economic profit.II.Production and CostsA.The Production Function1.Definition of production function: the relationship between quantity of inputs usedto make a good and the quantity of output of that good.2.Example: Caroline's cookie factory. The size of the factory is assumed to be fixed; Carolinecan vary her output (cookies) only by varying the labor used.Number ofWorkersOutputMarginal Productof LaborCost of Factory Cost of WorkersTotal Cost of Inputs 00---$30$0$30150503010402904030205031203030306041402030407051501030508061555306090Chapter 13/The Costs of Production ❖ 2253.Definition of marginal product: the increase in output that arises from an additionalunit of input.a.As the amount of labor used increases, the marginal product of labor falls.b.Definition of diminishing marginal product: the property whereby the marginalproduct of an input declines as the quantity of the input increases.4.We can draw a graph of the firm's production function by plotting the level of labor (x -axis)against the level of output (y -axis).226 ❖ Chapter 13/The Costs of Productiona.The slope of the production function measures marginal product.b.Diminishing marginal product can be seen from the fact that the slope falls as theamount of labor used increases.B.From the Production Function to the Total-Cost Curve1.We can draw a graph of the firm's total cost curve by plotting the level of output (x-axis)against the total cost of producing that output (y-axis).a.The total cost curve gets steeper and steeper as output rises.b.This increase in the slope of the total cost curve is also due to diminishing marginalproduct: As Caroline increases the production of cookies, her kitchen becomesovercrowded, and she needs a lot more labor.Chapter 13/The Costs of Production ❖ 227III.The Various Measures of CostA.Example: Conrad’s Coffee ShopOutputTotal Cost Fixed Cost Variable Cost Average Fixed Cost Average Variable Cost AverageTotalCostMarginal Cost 0 $3.00 $3.00 $0------------1 3.30 3.000.30$3.00$0.30$3.30$0.302 3.80 3.000.80 1.500.40 1.900.503 4.50 3.00 1.50 1.000.50 1.500.704 5.40 3.00 2.400.750.60 1.350.905 6.50 3.00 3.500.600.70 1.30 1.1067.80 3.00 4.800.500.80 1.30 1.3079.30 3.00 6.300.430.901.33 1.50228 ❖ Chapter 13/The Costs of Production811.00 3.008.000.38 1.00 1.38 1.70912.90 3.009.900.33 1.10 1.43 1.901015.003.0012.000.301.201.502.10B.Fixed and Variable Costs1.Definition of fixed costs: costs that do not vary with the quantity of outputproduced.2.Definition ofvariable costs: costs that do vary with the quantity of outputproduced.3.Total cost is equal to fixed cost plus variable cost.C.Average and Marginal Cost1.Definition of average total cost: total cost divided by the quantity of output.2.Definition ofaverage fixed cost: fixed costs divided by the quantity of output.3.Definition of average variable cost: variable costs divided by the quantity of output.4.Definition of marginal cost: the increase in total cost that arises from an extra unitof production.Chapter 13/The Costs of Production ❖ 2295.Average total cost tells us the cost of a typical unit of output and marginal cost tells us thecost of an additional unit of output.D.Cost Curves and Their Shapes1.Rising Marginal Costa.This occurs because of diminishing marginal product.b.At a low level of output, there are few workers and a lot of idle equipment. But as outputincreases, the coffee shop gets crowded and the cost of producing another unit of outputbecomes high.2.U-Shaped Average Total Costa.Average total cost is the sum of average fixed cost and average variable cost.b.AFC declines as output expands and AVC typically increases as output expands. AFC ishigh when output levels are low. As output expands, AFC declines pulling ATC down. Asfixed costs get spread over a large number of units, the effect of AFC on ATC falls andATC begins to rise because of diminishing marginal product.c.Definition of efficient scale: the quantity of output that minimizes average totalcost.3.The Relationship between Marginal Cost and Average Total Costa.Whenever marginal cost is less than average total cost, average total cost is falling.Whenever marginal cost is greater than average total cost, average total cost is rising.b.The marginal-cost curve crosses the average-total-cost curve at minimum average totalcost (the efficient scale).230 ❖ Chapter 13/The Costs of Production4.Typical Cost Curvesa.Marginal cost eventually rises with output.b.The average-total-cost curve is U-shaped.c.Marginal cost crosses average total cost at the minimum of average total cost.IV.Costs in the Short Run and in the Long RunA.The division of total costs into fixed and variable costs will vary from firm to firm.B.Some costs are fixed in the short run, but all are variable in the long run.1.For example, in the long run a firm could choose the size of its factory.2.Once a factory is chosen, the firm must deal with the short-run costs associated with thatplant size.C.The long-run average-total-cost curve lies along the lowest points of the short-run average-total-cost curves because the firm has more flexibility in the long run to deal with changes in production.D.The long-run average-total-cost curve is typically U-shaped, but is much flatter than a typicalshort-run average-total-cost curve.E.The length of time for a firm to get to the long run will depend on the firm involved.F.Economies and Diseconomies of Scale1.Definition of economies of scale: the property whereby long-run average total costfalls as the quantity of output increases.2.Definition of diseconomies of scale: the property whereby long-run average totalcost rises as the quantity of output increases.3.Definition of constant returns to scale: the property whereby long-run average totalcost stays the same as the quantity of output changes.4.FYI: Lessons from a Pin Factorya.In The Wealth of Nations, Adam Smith described how specialization in a pin factoryallowed output to be greater than it would have been if each worker attempted toperform many different tasks.b.The use of specialization allows firms to achieve economies of scale.V.Table 3 provides a summary of all of the various cost definitions used throughout this chapter.SOLUTIONS TO TEXT PROBLEMS:Quick Quizzes1.Farmer McDonald’s opportunity cost is $300, consisting of 10 hours of lessons at $20 an hourthat he could have been earning plus $100 in seeds. His accountant would only count theexplicit cost of the seeds ($100). If McDonald earns $200 from selling the crops, thenMcDonald earns a $100 accounting profit ($200 sales minus $100 cost of seeds) but incursan economic loss of $100 ($200 sales minus $300 opportunity cost).2.Farmer Jones’s production function is shown in Figure 1 and his total-cost curve is shown inFigure 2. The production function becomes flatter as the number of bags of seeds increasesbecause of the diminishing marginal product of seeds. The total-cost curve gets steeper asthe amount of production increases. This feature is also due to the diminishing marginalproduct of seeds, since each additional bag of seeds generates a lower marginal product, andthus, the cost of producing additional bushels of wheat rises.Figure 1Figure 23.The average total cost of producing 5 cars is $250,000/5 = $50,000. Since total cost rosefrom $225,000 to $250,000 when output increased from 4 to 5, the marginal cost of the fifthcar is $25,000.The marginal-cost curve and the average-total-cost curve for a typical firm are shown inFigure 3. They cross at the efficient scale because at low levels of output, marginal cost isbelow average total cost, so average total cost is falling. But after the two curves cross,marginal cost rises above average total cost, and average total cost starts to rise. So thepoint of intersection must be the minimum of average total cost.Figure 34.The long-run average total cost of producing 9 planes is $9 million/9 = $1 million. The long-run average total cost of producing 10 planes is $9.5 million/10 = $0.95 million. Since thelong-run average total cost declines as the number of planes increases, Boeing exhibitseconomies of scale.Questions for Review1.The relationship between a firm's total revenue, profit, and total cost is profit equals totalrevenue minus total costs.2.An accountant would not count the owner’s opportunity cost of alternative employment as anaccounting cost. An example is given in the text in which Caroline runs a cookie business, butshe could instead work as a computer programmer. Because she's working in her cookiefactory, she gives up the opportunity to earn $100 per hour as a computer programmer. Theaccountant ignores this opportunity cost because money does not flow into or out of thefirm. But the cost is relevant to Caroline’s decision to run the cookie factory.3.Marginal product is the increase in output that arises from an additional unit of input.Diminishing marginal product means that the marginal product of an input declines as thequantity of the input increases.4.Figure 4 shows a production function that exhibits diminishing marginal product of labor.Figure 5 shows the associated total-cost curve. The production function is concave becauseof diminishing marginal product, while the total-cost curve is convex for the same reason.Figure 4Figure 55.Total cost consists of the costs of all inputs needed to produce a given quantity of output. Itincludes fixed costs and variable costs. Average total cost is the cost of a typical unit of output and is equal to total cost divided by the quantity produced. Marginal cost is the cost of producing an additional unit of output and is equal to the change in total cost divided by the change in quantity. An additional relation between average total cost and marginal cost is that whenever marginal cost is less than average total cost, average total cost is declining; whenever marginal cost is greater than average total cost, average total cost is rising.Figure 66.Figure 6 shows the marginal-cost curve and the average-total-cost curve for a typical firm.There are three main features of these curves: (1) marginal cost is U-shaped but risessharply as output increases; (2) average total cost is U-shaped; and (3) whenever marginal cost is less than average total cost, average total cost is declining; whenever marginal cost is greater than average total cost, average total cost is rising. Marginal cost is increasing for output greater than a certain quantity because of diminishing returns. The average-total-cost curve is downward-sloping initially because the firm is able to spread out fixed costs over additional units. The average-total-cost curve is increasing beyond some output levelbecause as quantity increases, the demand for important variable inputs increases; therefore, the cost of these inputs increases. The marginal-cost and average-total-cost curves intersect at the minimum of average total cost; that quantity is the efficient scale.7.In the long run, a firm can adjust the factors of production that are fixed in the short run; forexample, it can increase the size of its factory. As a result, the long-run average-total-costcurve has a much flatter U-shape than the short-run average-total-cost curve. In addition,the long-run curve lies along the lower envelope of the short-run curves.8.Economies of scale exist when long-run average total cost decreases as the quantity ofoutput increases, which occurs because of specialization among workers. Diseconomies ofscale exist when long-run average total cost rises as the quantity of output increases, whichoccurs because of the coordination problems inherent in a large organization.Quick Check Multiple Choice1. a2. d3. d4. c5. b6. aProblems and Applications1. a.opportunity cost; b. average total cost; c. fixed cost; d. variable cost; e. total cost; f.marginal cost.2. a.The opportunity cost of something is what must be given up to acquire it.b.The opportunity cost of running the hardware store is $550,000, consisting of $500,000to rent the store and buy the stock and a $50,000 implicit cost, because your aunt wouldquit her job as an accountant to run the store. Because the total opportunity cost of$550,000 exceeds the projected revenue of $510,000, your aunt should not open thestore, as her economic profit would be negative.3. a.The following table shows the marginal product of each hour spent fishing:Hours Fish Fixed Cost Variable Cost Total Cost Marginal Product 00$10$0$10---11010515102181010208324101525642810203045301025352b.Figure 7 graphs the fisherman's production function. The production function becomesflatter as the number of hours spent fishing increases, illustrating diminishing marginalproduct.Figure 7c.The table shows the fixed cost, variable cost, and total cost of fishing. Figure 8 shows the fisherman's total-cost curve. It has an upward slope because catching additional fish takes additional time. The curve is convex because there are diminishing returns to fishing time because each additional hour spent fishing yields fewer additional fish.Figure 84.Here is the completed table:WorkersOutputMarginal Product Total Cost Average Total Cost Marginal Cost00---$200------12020300$15.00$5.00250304008.00 3.3339040500 5.56 2.50412030600 5.00 3.33514020700 5.00 5.00615010800 5.3310.0071555900 5.8120.00a.See the table for marginal product. Marginal product rises at first, then declines becauseof diminishing marginal product.b.See the table for total cost.c.See the table for average total cost. Average total cost is U-shaped. When quantity islow, average total cost declines as quantity rises; when quantity is high, average totalcost rises as quantity rises.d.See the table for marginal cost. Marginal cost is also U-shaped, but rises steeply asoutput increases. This is due to diminishing marginal product.e.When marginal product is rising, marginal cost is falling, and vice versa.f.When marginal cost is less than average total cost, average total cost is falling; the costof the last unit produced pulls the average down. When marginal cost is greater thanaverage total cost, average total cost is rising; the cost of the last unit produced pushes the average up.5.At an output level of 600 players, total cost is $180,000 (600 × $300). The total cost ofproducing 601 players is $180,901. Therefore, you should not accept the offer of $550, because the marginal cost of the 601st player is $901.6. a.The fixed cost is $300, because fixed cost equals total cost minus variable cost. At anoutput of zero, the only costs are fixed cost.b.Quantity TotalCost VariableCostMarginal Cost(using total cost)Marginal Cost(using variable cost)0$300$0------135050$50$50239090404034201203030445015030305490190404065402405050Marginal cost equals the change in total cost for each additional unit of output. It is also equal to the change in variable cost for each additional unit of output. This relationship occurs because total cost equals the sum of variable cost and fixed cost and fixed costdoes not change as the quantity changes. Thus, as quantity increases, the increase intotal cost equals the increase in variable cost.7.The following table illustrates average fixed cost (AFC), average variable cost (AVC), andaverage total cost (ATC) for each quantity. The efficient scale is 4 houses per month,because that minimizes average total cost.Quantity VariableCost FixedCostTotalCostAverageFixed CostAverageVariable CostAverageTotal Cost0$0.00$200.00$200.00---------110.00200.00210.00$200.00$10.00$210.00220.00200.00220.00100.0010.00110.00340.00200.00240.0066.6713.3380.00480.00200.00280.0050.0020.0070.005160.00200.00360.0040.0032.0072.006320.00200.00520.0033.3353.3386.677640.00200.00840.0028.5791.43120.008. a.The lump-sum tax causes an increase in fixed cost. Therefore, as Figure 10 shows, onlyaverage fixed cost and average total cost will be affected.Figure 10b.Refer to Figure 11. Average variable cost, average total cost, and marginal cost will all begreater. Average fixed cost will be unaffected.Figure 119. a.The following table shows average variable cost (AVC), average total cost (ATC), andmarginal cost (MC) for each quantity.Quantity VariableCost TotalCostAverageVariable CostAverageTotal CostMarginalCost0$0.00$30.00---------110.0040.00$10.00$40.00$10.00225.0055.0012.5027.5015.00345.0075.0015.0025.0020.00470.00100.0017.5025.0025.005100.00130.0020.0026.0030.006135.00165.0022.5027.5035.00b.Figure 12 shows the three curves. The marginal-cost curve is below the average-total-cost curve when output is less than four and average total cost is declining. Themarginal-cost curve is above the average-total-cost curve when output is above four and average total cost is rising. The marginal-cost curve lies above the average-variable-cost curve.Figure 1210.The following table shows quantity (Q), total cost (TC), and average total cost (ATC) for thethree firms:Firm A Firm B Firm CQuantity TC ATC TC ATC TC ATC1$60.00$60.00$11.00$11.00$21.00$21.00270.0035.0024.0012.0034.0017.00380.0026.6739.0013.0049.0016.33490.0022.5056.0014.0066.0016.505100.0020.0075.0015.0085.0017.006110.0018.3396.0016.00106.0017.677120.0017.14119.0017.00129.0018.43Firm A has economies of scale because average total cost declines as output increases. Firm B has diseconomies of scale because average total cost rises as output rises. Firm C has economies of scale from one to three units of output and diseconomies of scale for levels of output beyond three units.。
Chapter 8 of TaxationWHAT’S NEW IN THE S EVENTH EDITION:A new In the News box on “The Tax Debate ” has been added.LEARNING OBJECTIVES:By the end of this chapter, students should understand:➢ how taxes reduce consumer and producer surplus.➢ the meaning and causes of the deadweight loss from a tax.➢ why some taxes have larger deadweight losses than others.➢ how tax revenue and deadweight loss vary with the size of a tax.CONTEXT AND PURPOSE:Chapter 8 is the second chapter in a three-chapter sequence dealing with welfare economics. In the previous section on supply and demand, Chapter 6 introduced taxes and demonstrated how a tax affects the price and quantity sold in a market. Chapter 6 also described the factors that determine how the burden of the tax is divided between the buyers and sellers in a market. Chapter 7 developed welfare economics —the study of how the allocation of resources affects economic well-being. Chapter 8combines the lessons learned in Chapters 6 and 7 and addresses the effects of taxation on welfare. Chapter 9 will address the effects of trade restrictions on welfare.The purpose of Chapter 8 is to apply the lessons learned about welfare economics in Chapter 7 to the issue of taxation that was addressed in Chapter 6. Students will learn that the cost of a tax to buyers and sellers in a market exceeds the revenue collected by the government. Students will also learn about the factors that determine the degree by which the cost of a tax exceeds the revenue collected by the government.8 APPLICATION: THE COSTS OF TAXATIONKEY POINTS:• A tax on a good reduces the welfare of buyers and sellers of the good, and the reduction in consumer and producer surplus usually exceeds the revenue raised by the government. The fall in total surplus—the sum of consumer surplus, producer surplus, and tax revenue—is called thedeadweight loss of the tax.•Taxes have deadweight losses because they cause buyers to consume less and sellers to produce less, and these changes in behavior shrink the size of the market below the level that maximizes total surplus. Because the elasticities of supply and demand measure how much market participantsrespond to market conditions, larger elasticities imply larger deadweight losses.•As a tax grows larger, it distorts incentives more, and its deadweight loss grows larger. Because a tax reduces the size of a market, however, tax revenue does not continually increase. It first rises with the size of a tax, but if the tax gets large enough, tax revenue starts to fall.CHAPTER OUTLINE:I. The Deadweight Loss of TaxationA. Remember that it does not matter who a tax is levied on; buyers and sellers will likely share inthe burden of the tax.B. If there is a tax on a product, the price that a buyer pays will be greater than the price the sellerreceives. Thus, there is a tax wedge between the two prices and the quantity sold will be smaller if there was no tax.Figure 1C. How a Tax Affects Market Participants1. We can measure the effects of a tax on consumers by examining the change in consumer surplus. Similarly, we can measure the effects of the tax on producers by looking at thechange in producer surplus.2. However, there is a third party that is affected by the tax —the government, which gets totaltax revenue of T × Q. If the tax revenue is used to provide goods and services to the public, then the benefit from the tax revenue must not be ignored.3. Welfare without a Taxa. Consumer surplus is equal to: A + B + C.b. Producer surplus is equal to: D + E + F.c. Total surplus is equal to: A + B + C + D + E + F.4. Welfare with a Taxa. Consumer surplus is equal to: A. Figure 2 If you spent enough time covering consumer and producer surplus in Chapter 7,students should have an easy time with this concept.Figure 3b. Producer surplus is equal to: F.c. Tax revenue is equal to: B + D.d. Total surplus is equal to: A + B + D + F.5. Changes in Welfarea. Consumer surplus changes by: –(B + C).b. Producer surplus changes by: –(D + E).c. Tax revenue changes by: +(B + D).d. Total surplus changes by: –(C + E).6. Definition of deadweight loss: the fall in total surplus that results from a market distortion, such as a tax.D. Deadweight Losses and the Gains from Trade1. Taxes cause deadweight losses because they prevent buyers and sellers from benefiting from trade.2. This occurs because the quantity of output declines; trades that would be beneficial to both the buyer and seller will not take place because of the tax.3. The deadweight loss is equal to areas C and E (the drop in total surplus).4. Note that output levels between the equilibrium quantity without the tax and the quantity with the tax will not be produced, yet the value of these units to consumers (represented bythe demand curve) is larger than the cost of these units to producers (represented by the supply curve).Figure 4Show the students that the nature of this deadweight loss stems from the reduction in the quantity of the output exchanged. Stress the idea that goods that are not produced, consumed, or taxed do not generate benefits for anyone.II. The Determinants of the Deadweight LossFigure 5A. The price elasticities of supply and demand will determine the size of the deadweight loss thatoccurs from a tax.1. Given a stable demand curve, the deadweight loss is larger when supply is relatively elastic.2. Given a stable supply curve, the deadweight loss is larger when demand is relatively elastic.B. Case Study: The Deadweight Loss Debate1. Social Security tax and federal income tax are taxes on labor earnings. A labor tax places atax wedge between the wage the firm pays and the wage that workers receive.2. There is considerable debate among economists concerning the size of the deadweight lossfrom this wage tax.3. The size of the deadweight loss depends on the elasticity of labor supply and demand, andthere is disagreement about the magnitude of the elasticity of supply.a. Economists who argue that labor taxes do not greatly distort market outcomes believethat labor supply is fairly inelastic.b. Economists who argue that labor taxes lead to large deadweight losses believe that laborsupply is more elastic.III. Deadweight Loss and Tax Revenue as Taxes VaryA. As taxes increase, the deadweight loss from the tax increases.B. In fact, as taxes increase, the deadweight loss rises more quickly than the size of the tax.1. The deadweight loss is the area of a triangle and the area of a triangle depends on the square of its size.Activity 1—Labor TaxesType: In-class discussion Topics: Deadweight loss, taxationMaterials needed: None Time: 10 minutesClass limitations: Works in any size class PurposeMost students have not spent a great deal of time considering the effects of taxation on labor supply. This in-class exercise gives them the opportunity to consider the effects of proposed tax rates on their own willingness to supply labor. InstructionsAsk students to assume that they are full-time workers earning $10 per hour, $80 per day, $400 per week, $20,000 per year.Ask them if they would quit their jobs or keep working if the tax rate was 10%, 20%, 30%, … (up to 100%).Keep a tally as they show hands indicating that they are leaving the labor force.Ask students what they think the “best” tax rate is. Points for DiscussionMany students have no idea that current marginal tax rates are greater than 30% for many taxpayers.Students will likely say that a tax rate of zero would be best, but remind them that therewould be no roads, libraries, parks, or national defense without at least some revenue raised by the government.Figure 62. If we double the size of a tax, the base and height of the triangle both double so the area of the triangle (the deadweight loss) rises by a factor of four.C. As the tax increases, the level of tax revenue will eventually fall.D. Case Study: The Laffer Curve and Supply-Side Economics1. The relationship between the size of a tax and the level of tax revenues is called a Laffer curve.2. Supply-side economists in the 1980s used the Laffer curve to support their belief that a drop in tax rates could lead to an increase in tax revenue for the government.3. Economists continue to debate Laffer’s argument.a. Many believe that the 1980s refuted Laffer’s theory.b. Others believe that the events of the 1980s tell a more favorable supply-side story.c. Some economists believe that, while an overall cut in taxes normally decreases revenue, some taxpayers may find themselves on the wrong side of the Laffer curve.E. In the News: The Tax Debate1. Recently, policymakers have debated the effects of increasing the tax rate, particularly on higher-income taxpayers.2. These two opinion pieces from The Wall Street Journal present both sides of the issue. ALTERNATIVE CLASSROOM EXAMPLE: Draw a graph showing the demand and supply of paper clips. (Draw each curve as a 45-degree line so that buyers and sellers will share any tax equally.) Mark the equilibrium price as $ (per box) and the equilibrium quantity as 1,000 boxes. Show students the areas of producer and consumer surplus.Impose a $ tax on each box. Assume that sellers are required to “pay” the tax to thegovernment. Show students that:▪ the price buyers pay will rise to $.▪ the price sellers receive will fall to $.▪ the quantity of paper clips purchased will fall (assume to 800 units).▪ tax revenue would be equal to $160 ($ 800).Have students calculate the area of deadweight loss. (You may have to remind students how to calculate the area of a triangle.)Show students that as the tax increases (to $, $, and $, tax revenue rises and then falls, and the deadweight loss increases.Activity 2—Tax AlternativesType:In-class assignmentTopics:Taxes and deadweight lossMaterials needed:NoneTime: 20 minutesClass limitations:Works in any size classPurposeThe market impact of taxes can be a new concept to many students. This exercise helps them think about the effects of taxes on different goods. Taxes that may be appealing for equity reasons can be distortionary from a market perspective.InstructionsTell the class, “The state has decided to increase funding for public education. They are considering four alternative taxes to finance these expenditures. All four taxes would raise the same amount of rev enue.” List these options on the board:1. A sales tax on food.2. A tax on families with school-age children.3. A property tax on vacation homes.4. A sales tax on jewelry.Ask the students to answer the following questions. Give them time to write an answer, and then discuss their answers before moving to the next question:A. Taxes change incentives. How might individuals change their behavior because ofeach of these taxes?B. Rank these taxes from smallest deadweight loss to largest deadweight loss. Explain.C. Is deadweight loss the only thing to consider when designing a tax system? Common Answers and Points for DiscussionA. Taxes change incentives. How might individuals change their behavior because ofeach of these taxes?1. A sales tax on food: At the margin, some consumers will purchase less food.Overall food purchases will not decrease substantially because the tax will bespread over a large number of consumers and demand is relatively inelastic.2. A tax on families with school-age children: No families would put their children upfor adoption to avoid taxes. A large tax could have implications for familyplanning; couples may choose not to have children, or to have fewer children,over time. A more realistic concern would be relocation to other states by mobilefamilies to avoid the tax.3. A property tax on vacation homes: This tax would be concentrated on fewerhouseholds. A large tax would discourage people from buying vacation homes.Developers would build fewer vacation homes in the long run. In many areas,people could choose an out-of-state vacation home to avoid the tax.4. A sales tax on jewelry: This tax would also be relatively concentrated. Peoplewould buy less jewelry, or they would buy jewelry in other states with lowertaxes.SOLUTIONS TO TEXT PROBLEMS:Quick Quizzes1. Figure 1 shows the supply and demand curves for cookies, with equilibrium quantity Q 1 andequilibrium price P 1. When the government imposes a tax on cookies, the price to buyers rises to P B , the price received by sellers declines to P S , and the equilibrium quantity falls to Q 2. The deadweight loss is the triangular area below the demand curve and above the supply curve between quantities Q 1 and Q 2. The deadweight loss shows the fall in total surplus that results from the tax.Figure 12. The deadweight loss of a tax is greater the greater is the elasticity of demand. Therefore, atax on beer would have a larger deadweight loss than a tax on milk because the demand for beer is more elastic than the demand for milk.B. Rank these taxes from smallest deadweight loss to largest deadweight loss.Lowest deadweight loss —tax on children, very inelasticThen —tax on food. Demand is inelastic; supply is elastic. Third —tax on vacation homes Demand is elastic; short-run supply is inelastic.Most deadweight loss —tax on jewelryDemand is elastic; supply is elastic.C. Is deadweight loss the only thing to consider when designing a tax system?No. This can generate a lively discussion. There are a variety of equity or fairnessconcerns. The taxes on children and on food would be regressive. Each of the taxeswould tax certain households at much higher rates than other households with similarincomes.3. If the government doubles the tax on gasoline, the revenue from the gasoline tax could riseor fall depending on whether the size of the tax is on the upward or downward slopingportion of the Laffer curve. However, if the government doubles the tax on gasoline, you canbe sure that the deadweight loss of the tax rises because deadweight loss always rises as thetax rate rises.Questions for Review1. When the sale of a good is taxed, both consumer surplus and producer surplus decline. Thedecline in consumer surplus and producer surplus exceeds the amount of governmentrevenue that is raised, so society's total surplus declines. The tax distorts the incentives ofboth buyers and sellers, so resources are allocated inefficiently.2. Figure 2 illustrates the deadweight loss and tax revenue from a tax on the sale of a good.Without a tax, the equilibrium quantity would be Q1, the equilibrium price would be P1,consumer surplus would be A + B + C, and producer surplus would be D + E + F. Theimposition of a tax places a wedge between the price buyers pay, P B, and the price sellersreceive, P S, where P B = P S + tax. The quantity sold declines to Q2. Now consumer surplus isA, producer surplus is F, and government revenue is B + D. The deadweight loss of the tax isC+E, because that area is lost due to the decline in quantity from Q1 to Q2.Figure 23. The greater the elasticities of demand and supply, the greater the deadweight loss of a tax.Because elasticity measures the responsiveness of buyers and sellers to a change in price,higher elasticity means the tax induces a greater reduction in quantity, and therefore, agreater distortion to the market.4. Experts disagree about whether labor taxes have small or large deadweight losses becausethey have different views about the elasticity of labor supply. Some believe that labor supplyis inelastic, so a tax on labor has a small deadweight loss. But others think that workers canadjust their hours worked in various ways, so labor supply is elastic, and thus a tax on laborhas a large deadweight loss.5. The deadweight loss of a tax rises more than proportionally as the tax rises. Tax revenue,however, may increase initially as a tax rises, but as the tax rises further, revenue eventuallydeclines.Quick Check Multiple Choice1. a2. b3. c4. a5. b6. aProblems and Applications1. a. Figure 3 illustrates the market for pizza. The equilibrium price is P1, the equilibriumquantity is Q1, consumer surplus is area A + B + C, and producer surplus is area D + E +F. There is no deadweight loss, as all the potential gains from trade are realized; totalsurplus is the entire area between the demand and supply curves: A + B + C + D + E +F.Figure 3b. With a $1 tax on each pizza sold, the price paid by buyers, P B, is now higher than theprice received by sellers, P S, where P B = P S + $1. The quantity declines to Q2, consumersurplus is area A, producer surplus is area F, government revenue is area B + D, anddeadweight loss is area C + E. Consumer surplus declines by B + C, producer surplusdeclines by D + E, government revenue increases by B + D, and deadweight lossincreases by C + E.c. If the tax were removed and consumers and producers voluntarily transferred B + D tothe government to make up for the lost tax revenue, then everyone would be better offthan without the tax. The equilibrium quantity would be Q1, as in the case without thetax, and the equilibrium price would be P1. Consumer surplus would be A + C, becauseconsumers get surplus of A + B + C, then voluntarily transfer B to the government.Producer surplus would be E + F, because producers get surplus of D + E + F, thenvoluntarily transfer D to the government. Both consumers and producers are better offthan the case when the tax was imposed. If consumers and producers gave a little bitmore than B + D to the government, then all three parties, including the government,would be better off. This illustrates the inefficiency of taxation.2. a. The statement, "A tax that has no deadweight loss cannot raise any revenue for thegovernment," is incorrect. An example is the case of a tax when either supply or demand is perfectly inelastic. The tax has neither an effect on quantity nor any deadweight loss,but it does raise revenue.b. The statement, "A tax that raises no revenue for the government cannot have anydeadweight loss," is incorrect. An example is the case of a 100% tax imposed on sellers.With a 100% tax on their sales of the good, sellers will not supply any of the good, sothe tax will raise no revenue. Yet the tax has a large deadweight loss, because it reduces the quantity sold to zero.3. a. With very elastic supply and very inelastic demand, the burden of the tax on rubberbands will be borne largely by buyers. As Figure 4 shows, consumer surplus declinesconsiderably, by area A + B, but producer surplus decreases only by area C+D..Figure 4 Figure 5b.With very inelastic supply and very elastic demand, the burden of the tax on rubberbands will be borne largely by sellers. As Figure 5 shows, consumer surplus does notdecline much, just by area A + B, while producer surplus falls substantially, by area C +D. Compared to part (a), producers bear much more of the burden of the tax, andconsumers bear much less.4. a. The deadweight loss from a tax on heating oil is likely to be greater in the fifth year afterit is imposed rather than the first year. In the first year, the demand for heating oil isrelatively inelastic, as people who own oil heaters are not likely to get rid of them rightaway. But over time they may switch to other energy sources and people buying newheaters for their homes will more likely choose gas or electric, so the tax will have agreater impact on quantity. Thus, the deadweight loss of the tax will get larger over time.b. The tax revenue is likely to be higher in the first year after it is imposed than in the fifthyear. In the first year, demand is more inelastic, so the quantity does not decline asmuch and tax revenue is relatively high. As time passes and more people substitute away from oil, the quantity sold declines, as does tax revenue.5. Because the demand for food is inelastic, a tax on food is a good way to raise revenuebecause it leads to a small deadweight loss; thus taxing food is less inefficient than taxing other things. But it is not a good way to raise revenue from an equity point of view, because poorer people spend a higher proportion of their income on food. The tax would affect them more than it would affect wealthier people.6. a. This tax has such a high rate that it is not likely to raise much revenue. Because of thehigh tax rate, the equilibrium quantity in the market is likely to be at or near zero.b. Senator Moynihan's goal was probably to ban the use of hollow-tipped bullets. In thiscase, the tax could be as effective as an outright ban.7. a. Figure 6 illustrates the market for socks and the effects of the tax. Without a tax, theequilibrium quantity would be Q1, the equilibrium price would be P1, total spending byconsumers equals total revenue for producers, which is P1 x Q1, which equals area B + C + D + E + F, and government revenue is zero. The imposition of a tax places a wedgebetween the price buyers pay, P B, and the price sellers receive, P S, where P B = P S + tax.The quantity sold declines to Q2. Now total spending by consumers is P B x Q2, whichequals area A + B + C + D, total revenue for producers is P S x Q2, which is area C + D,and government tax revenue is Q2 x tax, which is area A + B.b. Unless supply is perfectly elastic or demand is perfectly inelastic, the price received byproducers falls because of the tax. Total receipts for producers fall, because producerslose revenue equal to area B + E + F.Figure 6c. The price paid by consumers rises, unless demand is perfectly elastic or supply isperfectly inelastic. Whether total spending by consumers rises or falls depends on theprice elasticity of demand. If demand is elastic, the percentage decline in quantityexceeds the percentage increase in price, so total spending declines. If demand isinelastic, the percentage decline in quantity is less than the percentage increase in price,so total spending rises. Whether total consumer spending falls or rises, consumer surplusdeclines because of the increase in price and reduction in quantity.8. Figure 7 illustrates the effects of the $2 subsidy on a good. Without the subsidy, theequilibrium price is P1 and the equilibrium quantity is Q1. With the subsidy, buyers pay priceP B, producers receive price P S (where P S = P B + $2), and the quantity sold is Q2. Thefollowing table illustrates the effect of the subsidy on consumer surplus, producer surplus,government revenue, and total surplus. Because total surplus declines by area D + H, thesubsidy leads to a deadweight loss in that amount.After Subsidy ChangeBeforeSubsidyConsumerSurplus A + B A + B + E + F + G +(E + F + G)ProducerSurplus E + I B + C + E + I +(B + C)GovernmentRevenue 0 –(B + C + D + E + F + G + H) –(B + C + D + E + F + G + H) Total Surplus A + B + E + I A + B – D + E – H + I –(D + H)Figure 79. a. Figure 8 shows the effect of a $10 tax on hotel rooms. The tax revenue is represented byareas A + B, which are equal to ($10)(900) = $9,000. The deadweight loss from the tax is represented by areas C + D, which are equal to ($10)(100) = $500.Figure 8 Figure 9b. Figure 9 shows the effect of a $20 tax on hotel rooms. The tax revenue is represented byareas A + B, which are equal to ($20)(800) = $16,000. The deadweight loss from the tax is represented by areas C + D, which are equal to ($20)(200) = $2,000.When the tax is doubled, the tax revenue rises by less than double, while the deadweight loss rises by more than double. The higher tax creates a greater distortion to the market.10. a. Setting quantity supplied equal to quantity demanded gives 2P = 300 –P. Adding P toboth sides of the equation gives 3P = 300. Dividing both sides by 3 gives P = 100.Substituting P = 100 back into either equation for quantity demanded or supplied gives Q = 200.b. Now P is the price received by sellers and P +T is the price paid by buyers. Equatingquantity demanded to quantity supplied gives 2P = 300 − (P+T). Adding P to both sides of the equation gives 3P = 300 –T. Dividing both sides by 3 gives P = 100 –T/3. This is the price received by sellers. The buyers pay a price equal to the price received by sellers plus the tax (P +T = 100 + 2T/3). The quantity sold is now Q = 2P = 200 – 2T/3.c. Because tax revenue is equal to T x Q and Q = 200 – 2T/3, tax revenue equals 200T−2T2/3. Figure 10 (on the next page) shows a graph of this relationship. Tax revenue iszero at T = 0 and at T = 300.Figure 10 Figure 11d. As Figure 11 shows, the area of the triangle (laid on its side) that represents thedeadweight loss is 1/2 × base × height, where the base is the change in the price, which is the size of the tax (T) and the height is the amount of the decline in quantity (2T/3).So the deadweight loss equals 1/2 ×T × 2T/3 = T2/3. This rises exponentially from 0 (when T = 0) to 30,000 when T = 300, as shown in Figure 12.Figure 12e. A tax of $200 per unit is a bad policy, because tax revenue is declining at that tax level.The government could reduce the tax to $150 per unit, get more tax revenue ($15,000 when the tax is $150 versus $13,333 when the tax is $200), and reduce the deadweight loss (7,500 when the tax is $150 compared to 13,333 when the tax is $200).。
Chapter 1Problems and Applications1. a. A family deciding whether to buy a new car faces a tradeoff between the cost of thecar and other things they might want to buy. For example, buying the car mightmean they must give up going on vacation for the next two years. So the real costof the car is the family's opportunity cost in terms of what they must give up.b. For a member of Congress deciding whether to increase spending on national parks,the tradeoff is between parks and other spending items or tax cuts. If more moneygoes into the park system, that may mean less spending on national defense or on thepolice force. Or, instead of spending more money on the park system, taxes couldbe reduced.c. When a company president decides whether to open a new factory, the decision isbased on whether the new factory will increase the firm's profits compared to otheralternatives. For example, the company could upgrade existing equipment orexpand existing factories. The bottom line is: Which method of expandingproduction will increase profit the most?d. In deciding how much to prepare for class, a professor faces a tradeoff between thevalue of improving the quality of the lecture compared to other things she could dowith her time, such as working on additional research.2. When the benefits of something are psychological, such as going on a vacation, it isn't easy tocompare benefits to costs to determine if it's worth doing. But there are two ways to think about the benefits. One is to compare the vacation with what you would do in its place. If you didn't go on vacation, would you buy something like a new set of golf clubs? Then you can decide if you'd rather have the new clubs or the vacation. A second way is to think about how much work you had to do to earn the money to pay for the vacation; then you can decide if the psychological benefits of the vacation were worth the psychological cost of working.3. If you are thinking of going skiing instead of working at your part-time job, the cost of skiingincludes its monetary and time costs, plus the opportunity cost of the wages you're giving up by not working. If the choice is between skiing and going to the library to study, then the cost of skiing is its monetary and time costs plus the cost to you of getting a lower grade in your course.4. If you spend $100 now instead of investing it for a year and earning 5 percent interest, youare giving up the opportunity to spend $105 a year from now. The idea that money has a time value is the basis for the field of finance, the subfield of economics that has to do with prices of financial instruments like stocks and bonds.5. The fact that you've already sunk $5 million isn't relevant to your decision anymore, sincethat money is gone. What matters now is the chance to earn profits at the margin. If you spend another $1 million and can generate sales of $3 million, you'll earn $2 million in marginal profit, so you should do so. You are right to think that the project has lost a total of $3 million ($6 million in costs and only $3 million in revenue) and you shouldn't have started it. That's true, but if you don't spend the additional $1 million, you won't have any sales and your losses will be $5 million. So what matters is not the total profit, but the profit you can earn at the margin. In fact, you'd pay up to $3 million to complete development; any more than that, and you won't be increasing profit at the margin.6. Harry suggests looking at whether productivity would rise or fall. Productivity is certainlyimportant, since the more productive workers are, the lower the cost per gallon of potion.Harry wants to look at average cost. But both Harry and Ron are missing the other side of the equation−revenue. A firm wants to maximize its profits, so it needs to examine both costs and revenues. Thus, Hermione is right−it’s best to examine whether the extra revenue would exceed the extra costs. In addition, Hermione is the only one who’s thinking at the margin.7. a. Since a person gets fewer after-tax Social Security benefits the greater is his or herincome, there's an incentive not to save for retirement. If you save a lot, yourincome will be higher, and you won't get as much after-tax Social Security income assomeone who didn't save as much. The unintended consequence of the taxation ofSocial Security benefits is to reduce saving; yet the Social Security system arosebecause of worries that people wouldn’t save enough for retirement.b. For the same reason, you'll tend not to work (or not work as much) after age 65.The more you work, the lower your after-tax Social Security benefits will be. Thusthe taxation of Social Security benefits discourages work effort after age 65.8. a. When welfare recipients who are able to work have their benefits cut off after twoyears, they have greater incentive to find jobs than if their benefits were to lastforever.b. The loss of benefits means that someone who can't find a job will get no income atall, so the distribution of income will become less equal. But the economy will bemore efficient, since welfare recipients have a greater incentive to find jobs. Thusthe change in the law is one that increases efficiency but reduces equity.9. By specializing in each task, you and your roommate can finish the chores more quickly. Ifyou divided each task equally, it would take you more time to cook than it would take your roommate, and it would take him more time to clean than it would take you. By specializing, you reduce the total time spent on chores.Similarly, countries can specialize and trade, making both better off. For example, suppose it takes Spanish workers less time to make clothes than French workers, and French workers can make wine more efficiently than Spanish workers. Then Spain and France can both benefit if Spanish workers produce all the clothes and French workers produce all the wine, and they exchange some wine for some clothes.10. a. Being a central planner is tough! To produce the right number of CDs by the rightartists and deliver them to the right people requires an enormous amount ofinformation. You need to know about production techniques and costs in the CDindustry. You need to know each person's musical tastes and which artists theywant to hear. If you make the wrong decisions, you'll be producing too many CDsby artists that people don't want to hear, and not enough by others.b. Your decisions about how many CDs to produce carry over to other decisions. Youhave to make the right number of CD players for people to use. If you make toomany CDs and not enough cassette tapes, people with cassette players will be stuckwith CDs they can't play. The probability of making mistakes is very high. Youwill also be faced with tough choices about the music industry compared to otherparts of the economy. If you produce more sports equipment, you'll have fewerresources for making CDs. So all decisions about the economy influence yourdecisions about CD production.11. a. Efficiency: The market failure comes from the monopoly by the cable TV firm.b. Equityc. Efficiency: An externality arises because secondhand smoke harms nonsmokers.d. Efficiency: The market failure occurs because of Standard Oil's monopoly power.e. Equityf. Efficiency: There's an externality because of accidents caused by drunk drivers.12. a. If everyone were guaranteed the best health care possible, much more of our nation'soutput would be devoted to medical care than is now the case. Would that beefficient? If you think that currently doctors form a monopoly and restrict healthcare to keep their incomes high, you might think efficiency would increase byproviding more health care. But more likely, if the government mandated increasedspending on health care, the economy would be less efficient because it would givepeople more health care than they would choose to pay for. From the point of viewof equity, if poor people are less likely to have adequate health care, providing morehealth care would represent an improvement. Each person would have a more evenslice of the economic pie, though the pie would consist of more health care and lessof other goods.b. When workers are laid off, equity considerations argue for the unemploymentbenefits system to provide them with some income until they can find new jobs.After all, no one plans to be laid off, so unemployment benefits are a form ofinsurance. But there’s an efficiency problem why work if you can get income fordoing nothing? The economy isn’t o perating efficiently if people remainunemployed for a long time, and unemployment benefits encourage unemployment.Thus, there’s a tradeoff between equity and efficiency. The more generous areunemployment benefits, the less income is lost by an unemployed person, but themore that person is encouraged to remain unemployed. So greater equity reducesefficiency.13. Since average income in the United States has roughly doubled every 35 years, we are likelyto have a better standard of living than our parents, and a much better standard of living than our grandparents. This is mainly the result of increased productivity, so that an hour of work produces more goods and services than it used to. Thus incomes have continuously risen over time, as has the standard of living.14. If Americans save more and it leads to more spending on factories, there will be an increasein production and productivity, since the same number of workers will have more equipment to work with. The benefits from higher productivity will go to both the workers, who will get paid more since they're producing more, and the factory owners, who will get a return on their investments. There's no such thing as a free lunch, though, because when people save more, they're giving up spending. They get higher incomes at the cost of buying fewer goods.15. a. If people have more money, they're probably going to spend more on goods andservices.b. If prices are sticky, and people spend more on goods and services, then output mayincrease, as producers increase output to meet the higher demand rather than raisingprices.c. If prices can adjust, then people's higher spending will be matched with increasedprices, and output won't rise.16. To make an intelligent decision about whether to reduce inflation, a policymaker would needto know what causes inflation and unemployment, as well as what determines the tradeoff between them. Because prices are sticky, an attempt to reduce inflation will lead to higher unemployment. A policymaker thus faces a tradeoff between the benefits of lower inflation compared to the cost of higher unemployment.Chapter 2Problems and Applications1. Many answers are possible.2. a. Steel is a fairly uniform commodity, though some firms produce steel of inferiorquality.b. Novels are each unique, so they are quite distinguishable.c. Wheat produced by one farmer is completely indistinguishable from wheat producedby another.d. Fast food is more distinguishable than steel or wheat, but certainly not as much asnovels.3. See Figure 2-5; the four transactions are shown.Figure 2-54. a. Figure 2-6 shows a production possibilities frontier between guns and butter. It isbowed out because when most of the economy’s resources are being used to pr oducebutter, the frontier is steep and when most of the economy’s resources are being usedto produce guns, the frontier is very flat. When the economy is producing a lot ofguns, workers and machines best suited to making butter are being used to makeguns, so each unit of guns given up yields a large increase in the production of butter;thus the production possibilities frontier is flat. When the economy is producing alot of butter, workers and machines best suited to making guns are being used tomake butter, so each unit of guns given up yields a small increase in the productionof butter; thus the production possibilities frontier is steep.b. Point A is impossible for the economy to achieve; it is outside the productionpossibilities frontier. Point B is feasible but inefficient because it’s inside theproduction possibilities frontier.Figure 2-6c. The Hawks might choose a point like H, with many guns and not much butter. TheDoves might choose a point like D, with a lot of butter and few guns.d. If both Hawks and Doves reduced their desired quantity of guns by the same amount,the Hawks would get a bigger peace dividend because the production possibilitiesfrontier is much steeper at point H than at point D. As a result, the reduction of agiven number of guns, starting at point H, leads to a much larger increase in thequantity of butter produced than when starting at point D.5. See Figure 2-7. The shape and position of the frontier depend on how costly it is to maintaina clean environment the productivity of the environmental industry. Gains inenvironmental productivity, such as the development of a no-emission auto engine, lead to shifts of the production-possibilities frontier, like the shift from PPF1 to PPF2 shown in the figure.Figure 2-76. a. A family’s decision about how much income to save is microeconomics.b. The effect of government regulations on auto emissions is microeconomics.c. The impact of higher saving on economic growth is macroeconomics.d. A f irm’s decision about how many workers to hire is microeconomics.e. The relationship between the inflation rate and changes in the quantity of money ismacroeconomics.7. a. The statement that society faces a short-run tradeoff between inflation andunemployment is a positive statement. It deals with how the economy is, not how itshould be. Since economists have examined data and found that there’s a short-runnegative relationship between inflation and unemployment, the statement is a fact,thus it’s a positive statement.b. The statement that a reduction in the rate of growth of money will reduce the rate ofinflation is a positive statement. Economists have found that money growth andinflation are very closely related. The statement thus tells how the world is, and soit is a positive statement.c. The statement that the Federal Reserve should reduce the rate of growth of money isa normative statement. It states an opinion about something that should be done,not how the world is.d. The statement that society ought to require welfare recipients to look for jobs is anormative statement. It doesn’t state a fact about how the world is. Instead, it is astatement of how the world should be and is thus a normative statement.e. The statement that lower tax rates encourage more work and more saving is apositive statement. Economists have studied the relationship between tax rates andwork, as well as the relationship between tax rates and saving. They’ve found anegative relationship in both cases. So the statement reflects how the world is, andis thus a positive statement.8. Two of the statements in Table 2-2 are clearly normative. They are: “5. If the federalbudget is to be balanced, it should be done over the business cycle rather th an yearly” and “9.The government should restructure the welfare system along the lines of a ‘negative income tax.’” Both are suggestions of changes that should be made, rather than statements of fact, so they are clearly normative statements.The other statements in the table are positive. All the statements concern how the world is, not how the world should be. Note that in all cases, even though they’re statements of fact, fewer than 100 percent of economists agree with them. You could say that positive statements are statements of fact about how the world is, but not everyone agrees about what the facts are.9. As the president, you’d be interested in both the positive and normative views of economists,but you’d probably be most interested in their positive views. Economists are on your staff to provide their expertise about how the economy works. They know many facts about the economy and the interaction of different sectors. So you’d be most likely to call on them about questions of fact posit ive analysis. Since you’re the president, you’re the one who has the make the normative statements as to what should be done, with an eye to the political consequences. The normative statements made by economists represent their views, not necessarily ei ther your’s or the electorate’s.10. There are many possible answers.11. As of this writing, the chairman of the Federal Reserve is Alan Greenspan, the chair of theCouncil of Economic Advisers is Martin N. Baily, and the secretary of the treasury is Larry Summers.12. There are many possible answers.13. As time goes on, you might expect economists to disagree less about public policy becausethey’ll have opportunities to observe different policies that are put into place. As new policies are tried, their results will become known, and they can be evaluated better. It’s likely that the disagreement about them will be reduced after they’ve been tried in practice.For example, many economists thought that wage and price controls would be a good idea for keeping inflation under control, while others thought it was a bad idea. But when the controls were tried in the early 1970s, the results were disastrous. The controls interfered with the invisible hand of the marketplace and shortages developed in many products. As a result, most economists are now convinced that wage and price controls are a bad idea for controlling inflation.But it’s unlikely that the differences between economists will ever be completely eliminated.Economists differ on too many aspects of how the world works. Plus, even as some policies get tried out and are either accepted or rejected, creative economists keep coming up with new ideas.Chapter 3Problems and Applications1. In the text example of the farmer and the rancher, the farmer’s opportunity cost of producingone pound of meat is two pounds of potatoes because for every 20 hours of work, he can produce one pound of meat or two pounds of potatoes. With limited time at his disposal, producing a pound of meat means he gives up the opportunity to produce two pounds of potatoes. Similarly, the rancher’s opportunity cost of producing one pound of meat is 1/8 pound of potatoes because for every hour of work, she can produce one pound of meat or 1/8 pound of potatoes. With limited time at her disposal, producing a pound of meat means she gives up the opportunity to produce 1/8 pound of potatoes.2. a. See Figure 3-2. If Maria spends all five hours studying economics, she can read100 pages, so that is the vertical intercept of the production possibilities frontier. Ifshe spends all five hours studying sociology, she can read 250 pages, so that is thehorizontal intercept. The time costs are constant, so the production possibilitiesfrontier is a straight line.Figure 3-2b. It takes Maria two hours to read 100 pages of sociology. In that time, she couldread 40 pages of economics. So the opportunity cost of 100 pages of sociology is40 pages of economics.3. a.Workers needed to make:One Car One Ton of GrainU.S. 1/4 1/10Japan 1/4 1/5b. See Figure 3-3. With 100 million workers and four cars per worker, if eithereconomy were devoted completely to cars, it could make 400 million cars. Since aU.S. worker can produce 10 tons of grain, if the U.S. produced only grain it wouldproduce 1,000 million tons. Since a Japanese worker can produce 5 tons of grain, ifJapan produced only grain it would produce 500 million tons. These are theintercepts of the production possibilities frontiers shown in the figure. Note thatsince the tradeoff between cars and grain is constant, the production possibilitiesfrontier is a straight line.Figure 3-3c. Since a U.S. worker produces either 4 cars or 10 tons of grain, the opportunity cost of1 car is 2½ tons of grain, which is 10 divided by 4. Since a Japanese workerproduces either 4 cars or 5 tons of grain, the opportunity cost of 1 car is1 1/4 tons of grain, which is 5 divided by 4. Similarly, the U.S. opportunity cost of1 ton of grain is 2/5 cars (4 divided by 10) and the Japanese opportunity cost of 1 tonof grain is 4/5 cars (4 divided by 5). This gives the following table:Opportunity Cost of:1 Car (in terms of tons ofgrain given up) 1 Ton of Grain (in terms ofcars given up)U.S. 2 1/2 2/5Japan 1 1/4 4/5d. Neither country has an absolute advantage in producing cars, since they’re equallyproductive (the same output per worker); the U.S. has an absolute advantage in producing grain, since it’s more productive (greater output per worker).e. Japan has a comparative advantage in producing cars, since it has a loweropportunity cost in terms of grain given up. The U.S. has a comparative advantage in producing grain, since it has a lower opportunity cost in terms of cars given up. f. With half the workers in each country producing each of the goods, the U.S. wouldproduce 200 million cars (that’s 50 million workers times 4 cars each) and 500 million tons of grain (50 million workers times 10 tons each). Japan would produce 200 million cars (50 million workers times 4 cars each) and 250 million tons of grain(50 million workers times 5 tons each).g. From any situation with no trade, in which each country is producing some cars andsome grain, suppose the U.S. changed 1 worker from producing cars to producinggrain. That worker would produce 4 fewer cars and 10 additional tons of grain.Then suppose the U.S. offers to trade 7 tons of grain to Japan for 4 cars. The U.S.will do this because it values 4 cars at 10 tons of grain, so it will be better off if thetrade goes through. Suppose Japan changes 1 worker from producing grain toproducing cars. That worker would produce 4 more cars and 5 fewer tons of grain.Japan will take the trade because it values 4 cars at 5 tons of grain, so it will be betteroff. With the trade and the change of 1 worker in both the U.S. and Japan, eachcountry gets the same amount of cars as before and both get additional tons of grain(3 for the U.S. and 2 for Japan). Thus by trading and changing their production,both countries are better off.4. a. Pat’s opportunity cost of making a pizza is 1/2 gallon of root beer, since she couldbrew 1/2 gallon in the time (2 hours) it takes her to make a pizza. Pat has anabsolute advantage in making pizza since she can make one in two hours, while ittakes Kris four hours. Kris’s opportunity cost of making a pizza is 2/3 gallons ofroot beer, since she could brew 2/3 of a gallon in the time (4 hours) it takes her tomake a pizza. Since Pa t’s opportunity cost of making pizza is less than Kris’s, Pathas a comparative advantage in making pizza.b. Since Pat has a comparative advantage in making pizza, she will make pizza andexchange it for root beer that Kris makes.c. The highest price of pizza in terms of root beer that will make both roommates betteroff is 2/3 gallons of root beer. If the price were higher than that, then Kris wouldprefer making her own pizza (at an opportunity cost of 2/3 gallons of root beer)rather than trading for pizza that Pat makes. The lowest price of pizza in terms ofroot beer that will make both roommates better off is 1/2 gallon of root beer. If theprice were lower than that, then Pat would prefer making her own root beer (she canmake 1/2 gallon of root beer instead of making a pizza) rather than trading for rootbeer that Kris makes.5. a. Since a Canadian worker can make either two cars a year or 30 bushels of wheat, theopportunity cost of a car is 15 bushels of wheat. Similarly, the opportunity cost of abushel of wheat is 1/15 of a car. The opportunity costs are the reciprocals of eachother.b. See Figure 3-4. If all 10 million workers produce two cars each, they produce atotal of 20 million cars, which is the vertical intercept of the production possibilitiesfrontier. If all 10 million workers produce 30 bushels of wheat each, they produce atotal of 300 million bushels, which is the horizontal intercept of the productionpossibilities frontier. Since the tradeoff between cars and wheat is always the same,the production possibilities frontier is a straight line.If Canada chooses to consume 10 million cars, it will need 5 million workers devotedto car production. That leaves 5 million workers to produce wheat, who willproduce a total of 150 million bushels (5 million workers times 30 bushels perworker). This is shown as point A on Figure 3-4.c. If the United States buys 10 million cars from Canada and Canada continues toconsume 10 million cars, then Canada will need to produce a total of 20 million cars.So Canada will be producing at the vertical intercept of the production possibilitiesfrontier. But if Canada gets 20 bushels of wheat per car, it will be able to consume200 million bushels of wheat, along with the 10 million cars. This is shown as pointB in the figure. Canada should accept the deal because it gets the same number ofcars and 50 million more bushes of wheat.Figure 3-46. Though the professor could do both writing and data collection faster than the student (that is,he has an absolute advantage in both), his time is limited. If the professor’s comparative advantage is in writing, it makes sense for him to pay a student to collect the data, since that’s the student’s comparative advantage.7. a. English workers have an absolute advantage over Scottish workers in producingscones, since English workers produce more scones per hour (50 vs. 40). Scottishworkers have an absolute advantage over English workers in producing sweaters,since Scottish workers produce more sweaters per hour (2 vs. 1). Comparativeadvantage runs the same way. English workers, who have an opportunity cost of1/50 sweaters per scone (1 sweater per hour divided by 50 scones per hour), have acomparative advantage in scone production over Scottish workers, who have anopportunity cost of 1/20 sweater per scone (2 sweaters per hour divided by 40 sconesper hour). Scottish workers, who have an opportunity cost of 20 scones per sweater(40 scones per hour divided by 2 sweaters per hour), have a comparative advantagein sweater production over English workers, who have an opportunity cost of 50scones per sweater (50 scones per hour divided by 1 sweater per hour).b. If England and Scotland decide to trade, Scotland will produce sweaters and tradethem for scones produced in England. A trade with a price between 20 and 50scones per sweater will benefit both countries, as they’ll be getting the traded good ata lower price than their opportunity cost of producing the good in their own country.c. Even if a Scottish worker produced just one sweater per hour, the countries wouldstill gain from trade, because Scotland would still have a comparative advantage inproducing sweaters. Its opportunity cost for sweaters would be higher than before(40 scones per sweater, instead of 20 scones per sweater before). But there are stillgains from trade since England has a higher opportunity cost (50 scones per sweater).。
第一章Questions for Review1. Examples of tradeoffs include time tradeoffs (such as studying one subject over another, or studying at all compared to engaging in social activities) and spending tradeoffs (such as whether to use your last ten dollars on pizza or on a study guide for that tough economics course).2. The opportunity cost of seeing a movie includes the monetary cost of admission plus the time cost of going to the theater and attending the show. The time cost depends on what else you might do with that time; if it's staying home and watching TV, the time cost may be small, but if it's working an extra three hours at your job, the time cost is the money you could have earned.3. The marginal benefit of a glass of water depends on your circumstances. If you've just run a marathon, or you've been walking in the desert sun for three hours, the marginal benefit is very high. But if you've been drinking a lot of liquids recently, the marginal benefit is quite low. The point is that even the necessities of life, like water, don't always have large marginal benefits.4. Policymakers need to think about incentives so they can understand how people will respond to the policies they put in place. The text's example of seat belts shows that policy actions can have quite unintended consequences. If incentives matter a lot, they may lead to a very different type of policy; for example, some economists have suggested putting knives in steering columns so that people will drive much more carefully! While this suggestion is silly, it highlights the importance of incentives.5. Trade among countries isn't a game with some losers and some winners because trade can make everyone better off. By allowing specialization, trade between people and trade between countries can improve everyone's welfare.6. The "invisible hand" of the marketplace represents the idea that even though individuals and firms are all acting in their own self-interest, prices and the marketplace guide them to do what is good for society as a whole.7. The two main causes of market failure are externalities and market power. An externality is the impact of one person’s actions on the well-being of a bystander, such as from pollution or the creation of knowledge. Market power refers to the ability of a single person (or small group of people) to unduly influence market prices, such as in a town with only one well or only one cable television company. In addition, a market economy also leads to an unequal distribution of income.8. Productivity is important because a country's standard of living depends on its ability to produce goods and services. The greater a country's productivity (the amount of goods and services produced from each hour of a worker's time), the greater will be its standard of living.9. Inflation is an increase in the overall level of prices in the economy. Inflation is caused by increases in the quantity of a nation's money.10. Inflation and unemployment are negatively related in the short run. Reducing inflation entails costs to society in the form of higher unemployment in the short run.Problems and Applications1. a. A family deciding whether to buy a new car faces a tradeoff between the cost of the car and other things they might want to buy. For example, buying the car might mean they must give up going on vacation for the next two years. So the real cost of the car is the family's opportunity cost in terms of what they must give up.b. For a member of Congress deciding whether to increase spending on national parks, the tradeoff is between parks and other spending items or tax cuts. If more money goes into the park system, that may mean less spending on national defense or on the police force. Or, instead of spending more money on the park system, taxes could be reduced.c. When a company president decides whether to open a new factory, the decision is based on whether the new factory will increase the firm's profits compared to other alternatives. For example, the company could upgrade existing equipment or expand existing factories. The bottom line is: Which method of expanding production will increase profit the most?d. In deciding how much to prepare for class, a professor faces a tradeoff between the value of improving the quality of the lecture compared to other things she could do with her time, such as working on additional research.2. When the benefits of something are psychological, such as going on a vacation, it isn't easy to compare benefits to costs to determine if it's worth doing. But there are two ways to think about the benefits. One is to compare the vacation with what you would do in its place. If you didn't go on vacation, would you buy something like a new set of golf clubs? Then you can decide if you'd rather have the new clubs or the vacation. A second way is to think about how much work you had to do to earn the money to pay for the vacation; then you can decide if the psychological benefits of the vacation were worth the psychological cost of working.3. If you are thinking of going skiing instead of working at your part-time job, the cost of skiing includes its monetary and time costs, which includes the opportunity cost of the wages you are giving up by not working. If the choice is between skiing and going to the library to study, then the cost of skiing is its monetary and time costs including the cost to you of getting a lower grade in your course.4. If you spend $100 now instead of saving it for a year and earning 5 percent interest, you are giving up the opportunity to spend $105 a year from now. The idea that money has a time value is the basis for the field of finance, the subfield of economics that has to do with prices of financial instruments like stocks and bonds.5. The fact that you've already sunk $5 million isn't relevant to your decision anymore, since that money is gone. What matters now is the chance to earn profits at the margin. If you spend another $1 million and can generate sales of $3 million, you'll earn $2 million in marginal profit, so you should do so. You are right to think that the project has lost a total of $3 million ($6 million in costs and only $3 million in revenue) and you shouldn't have started it. That's true, but if you don't spend the additional $1 million, you won't have any sales and your losses will be $5 million. So what matters is not the total profit, but the profit you can earn at the margin. In fact, you'd pay up to $3 million to complete development; any more than that, and you won't be increasing profit at the margin.6. Harry suggests looking at whether productivity would rise or fall. Productivity is certainly important, since the more productive workers are, the lower the cost per gallon of potion. Ron wants to look at average cost. But both Harry and Ron are missing the other side of the equation?revenue. A firm wants to maximize its profits, so it needs to examine both costs and revenues. Thus, Hermione is right?it’s best to examine whether the extra revenue would exceed the extra costs. Hermione is the only one who is thinking at the margin.7. a. The provision of Social Security benefits lowers an individual’s incentive to save for retirement. The benefits provide some level of income to the individual when he or she retires. This means that the individual is not entirely dependent on savings to support consumption through the years in retirement.b. Since a person gets fewer after-tax Social Security benefits the greater is his or her earnings, there is an incentive not to work (or not work as much) after age 65. The more you work, the lower your after-tax Social Security benefits will be. Thus the taxation of Social Security benefits discourages work effort after age 65.8. a. When welfare recipients who are able to work have their benefits cut off after two years, they have greater incentive to find jobs than if their benefits were to last forever.b. The loss of benefits means that someone who can't find a job will get no income at all, so the distribution of income will become less equal. But the economy will be more efficient, since welfare recipients have a greater incentive to find jobs. Thus the change in the law is one that increases efficiency but reduces equity.9. By specializing in each task, you and your roommate can finish the chores more quickly. If you divided each task equally, it would take you more time to cook than it would take your roommate, and it would take him more time to clean than it would take you. By specializing, you reduce the total time spent on chores.Similarly, countries can specialize and trade, making both better off. For example, suppose it takes Spanish workers less time to make clothes than French workers, and French workers can make wine more efficiently than Spanish workers. Then Spain and France can both benefit if Spanish workers produce all the clothes and French workers produce all the wine, and they exchange some wine for some clothes.10. a. Being a central planner is tough! To produce the right number of CDs by the right artists and deliver them to the right people requires an enormous amount of information. You need to know about production techniques and costs in the CD industry. You need to know each person's musical tastes and which artists they want to hear. If you make the wrong decisions, you'll be producing too many CDs by artists that people don't want to hear, and not enough by others.b. Your decisions about how many CDs to produce carry over to other decisions. You have to make the right number of CD players for people to use. If you make too many CDs and not enough cassette tapes, people with cassette players will be stuck with CDs they can't play. The probability of making mistakes is very high. You will also be faced with tough choices about the music industry compared to other parts of the economy. If you produce more sports equipment, you'll have fewer resources for making CDs. So all decisions about the economy influence your decisions about CD production.11. a. Efficiency: The market failure comes from the monopoly by the cable TV firm.b. Equityc. Efficiency: An externality arises because secondhand smoke harms nonsmokers.d. Efficiency: The market failure occurs because of Standard Oil's monopoly power.e. Equityf. Efficiency: There is an externality because of accidents caused by drunk drivers.12. a. If everyone were guaranteed the best health care possible, much more of our nation's output would be devoted to medical care than is now the case. Would that be efficient? If you think that currently doctors form a monopoly and restrict health care to keep their incomes high, you might think efficiency would increase by providing more health care. But more likely, if the government mandated increased spending on health care, the economy would be less efficient because it would give people more health care than they would choose to pay for. From the point of view of equity, if poor people are less likely to have adequate health care, providing more health care would represent an improvement. Each person would have a more even slice of the economic pie, though the pie would consist of more health care and less of other goods.b. When workers are laid off, equity considerations argue for the unemployment benefits system to provide them with some income until they can find new jobs. After all, no one plans to be laid off, so unemployment benefits are a form of insurance. But there’s an efficiency problem?why work if you can get income for doing nothing? The economy isn’t operating efficiently if people remain unemployed for a long time, and unemployment benefits encourage unemployment. Thus, there’s a tradeoff between equity and efficiency. The more generous are unemployment benefits, the less income is lost by an unemployed person, but the more that person is encouraged to remain unemployed. So greater equity reduces efficiency.13. Since average income in the United States has roughly doubled every 35 years, we are likely to have a better standard of living than our parents, and a much better standard of living than our grandparents. This is mainly the result of increased productivity, so that an hour of work produces more goods and services than it used to. Thus incomes have continuously risen over time, as has the standard of living.14. If Americans save more and it leads to more spending on factories, there will be an increase in production and productivity, since the same number of workers will have more equipment to work with. The benefits from higher productivity will go to both the workers, who will get paid more since they're producing more, and the factory owners, who will get a return on their investments. There is no such thing as a free lunch, however, because when people save more, they are giving up spending. They get higher incomes at the cost of buying fewer goods.15. a. If people have more money, they are probably going to spend more on goods and services.b. If prices are sticky, and people spend more on goods and services, then output may increase, as producers increase output to meet the higher demand rather than raising prices.c. If prices can adjust, then the higher spending of consumers will be matched with increased prices and output won't rise.16. To make an intelligent decision about whether to reduce inflation, a policymaker would need to know what causes inflation and unemployment, as well as what determines the tradeoff between them. Any attempt to reduce inflation will likely lead to higher unemployment in the short run. A policymaker thus faces a tradeoff between the benefits of lower inflation compared to the cost of higher unemployment.第二章Questions for Review1. Economics is like a science because economists use the scientific method. They devise theories, collect data, and then analyze these data in an attempt to verify or refute their theories about how the world works. Economists use theory and observation like other scientists, but they are limited in their ability to run controlled experiments. Instead, they must rely on natural experiments.2. Economists make assumptions to simplify problems without substantially affecting the answer. Assumptions can make the world easier to understand.3. An economic model cannot describe reality exactly because it would be too complicated to understand. A model is a simplification that allows the economist to see what is truly important.4. Figure 3 shows a production possibilities frontier between milk and cookies (PPF1). If a disease kills half of the economy's cow population, less milk production is possible, so the PPF shifts inward (PPF2). Note that if the economy produces all cookies, so it doesn't need any cows, then production is unaffected. But if the economy produces any milk at all, then there will be less production possible after the disease hits.Figure 35. The idea of efficiency is that an outcome is efficient if the economy is getting all it can from the scarce resources it has available. In terms of the production possibilities frontier, an efficient point is a point on the frontier, such as point A in Figure 4. A point inside the frontier, such as point B, is inefficient since more of one good could be produced without reducing the production of another good.Figure 46. The two subfields in economics are microeconomics and macroeconomics. Microeconomics is the study of how households and firms make decisions and how they interact in specific markets. Macroeconomics is the study of economy-wide phenomena.7. Positive statements are descriptive and make a claim about how the world is, while normative statements are prescriptive and make a claim about how the world ought to be. Here is an example. Positive: A rapid growth rate of money is the cause of inflation. Normative: The government should keep the growth rate of money low.8. The Council of Economic Advisers is a group of economists who consult with the president of the United States about economic matters. The Council consists of three members and a staff of several dozen economists. It writes the annual Economic Report of the President.9. Economists sometimes offer conflicting advice to policymakers for two reasons:(1) economists may disagree about the validity of alternative positive theories about how the world works; and (2) economists may have different values and, therefore, different normative views about what public policy should try to accomplish.Problems and Applications1. Many answers are possible.2. a. Steel is a fairly uniform commodity, though some firms produce steel of inferior quality.b. Novels are each unique, so they are quite distinguishable.c. Wheat produced by one farmer is completely indistinguishable from wheat produced by another.d. Fast food is more distinguishable than steel or wheat, but certainly not as much as novels.3. See Figure 5; the four transactions are shown.Figure 54. a. Figure 6 shows a production possibilities frontier between guns and butter. It is bowed out because when most of the economy’s resources are being used to produce butter, the frontier is steep and when most of the economy’s resources are being used to produce guns, the frontier is very flat. When the economy is producing a lot of guns, workers and machines best suited to making butter are being used to make guns, so each unit of guns given up yields a large increase in the production of butter. Thus, the production possibilities frontier is flat. When the economy is producing a lot of butter, workers and machines best suited to making guns are being used to make butter, so each unit of guns given up yields a small increase in the production of butter. Thus, the production possibilities frontier is steep.b. Point A is impossible for the economy to achieve; it is outside the production possibilities frontier. Point B is feasible but inefficient because it’s inside the production possibilities frontier.Figure 6c. The Hawks might choose a point like H, with many guns and not much butter. The Doves might choose a point like D, with a lot of butter and few guns.d. If both Hawks and Doves reduced their desired quantity of guns by the same amount, the Hawks would get a bigger peace dividend because the production possibilities frontier is much steeper at point H than at point D. As a result, the reduction of a given number of guns, starting at point H, leads to a much larger increase in the quantity of butter produced than when starting at point D.5. See Figure 7. The shape and position of the frontier depend on how costly it is to maintain a clean environment?the productivity of the environmental industry. Gains in environmental productivity, such as the development of a no-emission auto engine, lead to shifts of the production-possibilities frontier, like the shift from PPF1 to PPF2 shown in the figure.Figure 76. a. A family's decision about how much income to save is microeconomics.b. The effect of government regulations on auto emissions is microeconomics.c. The impact of higher saving on economic growth is macroeconomics.d. A firm's decision about how many workers to hire is microeconomics.e. The relationship between the inflation rate and changes in the quantity of money is macroeconomics.7. a. The statement that society faces a short-run tradeoff betweeninflation and unemployment is a positive statement. It deals with how the economy is, not how it should be. Since economists have examined data and found that there is a short-run negative relationship between inflation and unemployment, the statement is a fact, thus it is a positive statement.b. The statement that a reduction in the rate of growth of money will reduce the rate of inflation is a positive statement. Economists have found that money growth and inflation are very closely related. The statement thus tells how the world is, and so it is a positive statement.c. The statement that the Federal Reserve should reduce the rate of growth of money is a normative statement. It states an opinion about something that should be done, not how the world is.d. The statement that society ought to require welfare recipients to look for jobs is a normative statement. It doesn't state a fact about how the world is. Instead, it is a statement of how the world should be and is thus a normative statement.e. The statement that lower tax rates encourage more work and more saving is a positive statement. Economists have studied the relationship between tax rates and work, as well as the relationship between tax rates and saving. They have found a negative relationship in both cases. So the statement reflects how the world is, and is thus a positive statement.8. Two of the statements in Table 2 are clearly normative. They are: "5. If the federal budget is to be balanced, it should be done over the business cycle rather than yearly" and "9. The government should restructure the welfare system along the lines of a 'negative income tax.'" Both are suggestions of changes that should be made, rather than statements of fact, so they are clearly normative statements.The other statements in the table are positive. All the statements concern how the world is, not how the world should be. Note that in all cases, even though they are statements of fact, fewer than 100 percent of economists agree with them. You could say that positive statements are statements of fact about how the world is, but not everyone agrees about what the facts are.9. As the president, you'd be interested in both the positive and normative views of economists, but you'd probably be most interested in their positive views. Economists are on your staff to provide their expertise about how the economy works. They know many facts about the economy and the interaction of different sectors. So you would be most likely to call on them about questions of fact?positive analysis. Since you are the president, you are the one who has to make the normative statements as to what should be done, with an eye to the political consequences. The normative statements made by economists represent their own views, not necessarily your views or the electorate’s views.10. There are many possible answers.11. As of this writing, the chairman of the Federal Reserve is Alan Greenspan, the chair of the Council of Economic Advisers is R. Glen Hubbard, and the secretary of the treasury is Paul H. O’Neill.12. As time goes on, you might expect economists to disagree less about public policy because they will have opportunities to observe different policies that are put into place. As new policies are tried, their results will become known, and they can be evaluated better. It's likely that the disagreement about them will be reduced after they've been tried in practice. For example, many economists thought that wage and price controls would be a good idea for keeping inflation under control, while others thought it was a bad idea. But when the controls were tried in the early 1970s, the results were disastrous. The controls interfered with the invisible hand of the marketplace and shortages developed in many markets. As a result, most economists are now convinced that wage and price controls are a bad idea for controlling inflation.But it is unlikely that the differences between economists will ever be completely eliminated. Economists differ on too many aspects of how the world works. Plus, even as some policies get tried out and are either accepted or rejected, creative economists keep coming up with new ideas.第三章SOLUTIONS TO TEXT PROBLEMS:Questions for Review1. Absolute advantage reflects a comparison of the productivity of one person, firm, or nation to that of another, while comparative advantage is based on the relative opportunity costs of the persons, firms, or nations. While a person, firm, or nation may have an absolute advantage in producing every good, they can't have a comparative advantage in every good.2. Many examples are possible. Suppose, for example, that Roger can prepare a fine meal of hot dogs and macaroni in just ten minutes, while it takes Anita twenty minutes. And Roger can do all the wash in three hours, while it takes Anita four hours. Roger has an absolute advantage in both cooking and doing the wash, but Anita has a comparative advantage in doing the wash (the wash takes the same amount of time as 12 meals, while it takes Roger 18 meals' worth of time).3. Comparative advantage is more important for trade than absolute advantage. In the example in problem 2, Anita and Roger will complete their chores more quickly if Anita does at least some of the wash and Roger cooks the fine meals for both, because Anita has a comparative advantage in doing the wash, while Roger has a comparative advantage in cooking.4. A nation will export goods for which it has a comparative advantage because it has a smaller opportunity cost of producing those goods. As a result, citizens of all nations are able to consume quantities of goods that are outside their production possibilities frontiers.5. Economists oppose policies that restrict trade among nations because trade allows all countries to achieve greater prosperity by allowing them to receive the gains from comparative advantage. Restrictions on trade hurt all countries.Problems and Applications1. In the text example of the farmer and the rancher, the farmer's opportunity cost of producing one ounce of meat is 4 ounces of potatoes because for every 8 hours of work, he can produce 8 ounces of meat or 32 ounces of potatoes. With limited time at his disposal, producing an ounce of meat means he gives up the opportunity to produce 4 ounces of potatoes. Similarly, the rancher's opportunity cost of producing one ounce of meat is 2 ounces of potatoes because for every 8 hours of work, she can produce 24 ounces of meat or 48 ounces of potatoes. With limited time at her disposal, producing an ounce of meat means she gives up the opportunity to produce 2 ounces of potatoes.2. a. See Figure 2. If Maria spends all five hours studying economics, she can read 100 pages, so that is the vertical intercept of the production possibilities frontier. If she spends all five hours studying sociology, she can read 250 pages, so that is the horizontal intercept. The time costs are constant, so the production possibilities frontier is a straight line.Figure 2b. It takes Maria two hours to read 100 pages of sociology. In that time, she could read 40 pages of economics. So the opportunity cost of 100 pages of sociology is 40 pages of economics.3. a.Workers needed to make:One Car One Ton of GrainU.S. 1/4 1/10Japan 1/4 1/5b. See Figure 3. With 100 million workers and four cars per worker, if either economy were devoted completely to cars, it could make 400 million cars. Since a U.S. worker can produce 10 tons of grain, if the United States produced only grain it would produce 1,000 million tons. Since a Japanese worker can produce 5 tons of grain, if Japan produced only grain it would produce 500 million tons. These are the intercepts of the production possibilities frontiers shown in the figure. Note that since the tradeoff between cars and grain is constant, the production possibilities frontier is a straight line.Figure 3c. Since a U.S. worker produces either 4 cars or 10 tons of grain, the opportunity cost of 1 car is 2? tons of grain, which is 10 divided by 4. Since a Japanese worker produces either 4 cars or 5 tons of grain, the opportunity cost of 1 car is1 1/4 tons of grain, which is 5 divided by 4. Similarly, the U.S. opportunity cost of 1 ton of grain is 2/5 car (4 divided by 10) and the Japanese opportunity cost of 1 ton of grain is 4/5 car (4 divided by 5). This gives the following table:Opportunity Cost of:1 Car (in terms of tons of grain given up) 1 Ton of Grain (in terms of cars given up)U.S. 2 1/2 2/5Japan 1 1/4 4/5d. Neither country has an absolute advantage in producing cars, since they're equally productive (the same output per worker); the United States has an absolute advantage in producing grain, since it is more productive (greater output per worker).e. Japan has a comparative advantage in producing cars, since it has a lower opportunity cost in terms of grain given up. The United States has a comparative advantage in producing grain, since it has a lower opportunity cost in terms of cars given up.f. With half the workers in each country producing each of the goods, the United States would produce 200 million cars (that is 50 million workers times 4 cars each) and 500 million tons of grain (50 million workers times 10 tons each). Japan would produce 200 million cars (50 million workers times 4 cars each) and 250 million tons of grain (50 million workers times 5 tons each).g. From any situation with no trade, in which each country is producing some cars and some grain, suppose the United States changed 1 worker from。