Dynamic changes in radial oxygen loss and iron plaque
- 格式:pdf
- 大小:732.85 KB
- 文档页数:10
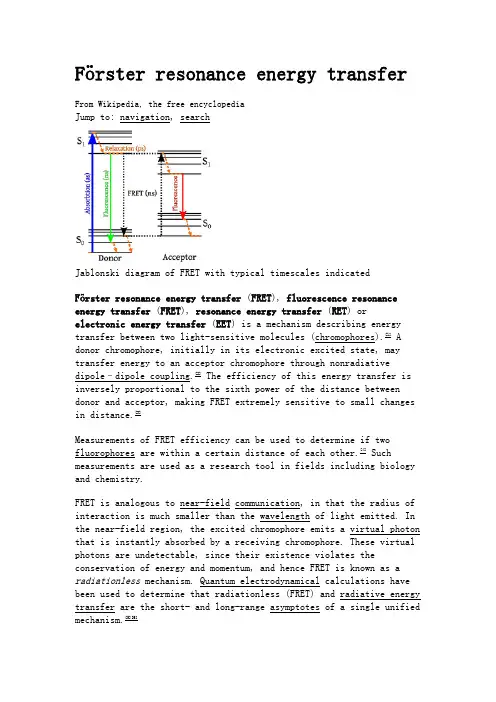
Förster resonance energy transferFrom Wikipedia, the free encyclopediaJump to: navigation, searchJablonski diagram of FRET with typical timescales indicatedFörster resonance energy transfer (FRET), fluorescence resonance energy transfer (FRET), resonance energy transfer (RET) orelectronic energy transfer (EET) is a mechanism describing energy transfer between two light-sensitive molecules (chromophores).[1] A donor chromophore, initially in its electronic excited state, may transfer energy to an acceptor chromophore through nonradiative dipole–dipole coupling.[2] The efficiency of this energy transfer is inversely proportional to the sixth power of the distance between donor and acceptor, making FRET extremely sensitive to small changes in distance.[3]Measurements of FRET efficiency can be used to determine if two fluorophores are within a certain distance of each other.[4] Such measurements are used as a research tool in fields including biology and chemistry.FRET is analogous to near-field communication, in that the radius of interaction is much smaller than the wavelength of light emitted. In the near-field region, the excited chromophore emits a virtual photon that is instantly absorbed by a receiving chromophore. These virtual photons are undetectable, since their existence violates the conservation of energy and momentum, and hence FRET is known as a radiationless mechanism. Quantum electrodynamical calculations have been used to determine that radiationless (FRET) and radiative energy transfer are the short- and long-range asymptotes of a single unified mechanism.[5][6]Contents[hide]∙ 1 Terminology∙ 2 Theoretical basis∙ 3 Experimental co nfirmation of the Förster resonance energy transfer theory∙ 4 Methods to measure FRET efficiencyo 4.1 Sensitized emissiono 4.2 Photobleaching FRETo 4.3 Lifetime measurements∙ 5 Fluorophores used for FRETo 5.1 CFP-YFP pairso 5.2 BRETo 5.3 Homo-FRET∙ 6 Applicationso 6.1 Biology∙7 Other methods∙8 See also∙9 References∙10 External linksTerminology[edit]Förster resonance energy transfer is named after the German scientist Theodor Förster.[7] When both chromophores are fluorescent, the term "fluorescence resonance energy transfer" is often used instead, although the energy is not actually transferred by fluorescence.[8][9]In order to avoid an erroneous interpretation of the phenomenon that is always a nonradiative transfer of energy (even when occurring between two fluorescent chromophores), the name "Förster resonance energy transfer" is preferred to "fluorescence resonance energy transfer;" however, the latter enjoys common usage in scientific literature.[10] It should also be noted that FRET is not restricted to fluorescence. It can occur in connection with phosphorescence as well.[8]Theoretical basis[edit]The FRET efficiency () is the quantum yield of the energy transfer transition, i.e. the fraction of energy transfer event occurring per donor excitation event:[11]where is the rate of energy transfer, the radiative decayrate, and the 's are the rate constants of any other de-excitation pathways.[12]The FRET efficiency depends on many physical parameters that can be grouped as follows:∙The distance between the donor and the acceptor (typically in the range of 1-10 nm)∙The spectral overlap of the donor emission spectrum and the acceptor absorption spectrum.∙The relative orientation of the donor emission dipole moment and the acceptor absorption dipole moment.depends on the donor-to-acceptor separation distance with an inverse 6th power law due to the dipole-dipole coupling mechanism:with being the Förster distance of this pair of donor andacceptor, i.e. the distance at which the energy transfer efficiency is 50%.[12]The Förster distance depends on the overlap integral of the donor emission spectrum with the acceptor absorption spectrum and their mutual molecular orientation as expressed by the following equation.[13][14]where is the fluorescence quantum yield of the donor in the absence of the acceptor, κ2 is the dipole orientation factor, is the refractive index of the medium, is Avogadro's number, and is the spectral overlap integral calculated aswhere is the normalized donor emission spectrum, and is the acceptor molar extinction coefficient.[15] The orientation factor κ is given by,Where denotes the normalized transition dipole moment of therespective fluorophore and denotes the normalized inter-fluorophore displacement. κ2 =2/3 is often assumed. This value is obtained when both dyes are freely rotating and can be considered to beisotropically oriented during the excited state lifetime. If either dye is fixed or not free to rotate, then κ2 =2/3 will not be a valid assumption. In most cases, however, even modest reorientation of the dyes results in enough orientational averaging that κ2 = 2/3 doesnot result in a large error in the estimated energy transfer distance due to the sixth power dependence of R0 on κ2. Even when κ2 is quite different from 2/3 the error can be associated with a shift in R0 and thus determinations of changes in relative distance for a particular system are still valid. Fluorescent proteins do not reorient on a timescale that is faster than their fluorescence lifetime. In this case 0 ≤ κ2≤ 4.[15]The FRET efficiency relates to the quantum yield and the fluorescence lifetime of the donor molecule as follows:[16]where and are the donor fluorescence lifetimes in the presenceand absence of an acceptor, respectively, or aswhere and are the donor fluorescence intensities with and without an acceptor, respectively.Experimental confirmation of the Förster resonance energy transfer theory[edit]The inverse sixth-power distance dependence of Förster resonance energy transfer was experimentally confirmed by Wilchek, Edelhoch and Brand[17][18] using tryptophyl peptides. Stryer, Haugland and Yguerabide[19] also experimentally demonstrated the theoretical dependence ofFörster resonance ene rgy transfer on the overlap integral by using a fused indolosteroid as a donor and a ketone as an acceptor. However, a lot of contradictions of special experiments with the theory was oserved. The reason is that the theory has approximate character and gives overstimated distances of 50-100 Angstrems (Vekshin N.L. Energy Transfer in Macromolecules, SPIE, 1997; Vekshin N.L. Photonics of Biopolymers, Springer, 2002).Methods to measure FRET efficiency[edit]In fluorescence microscopy, fluorescence confocal laser scanning microscopy, as well as in molecular biology, FRET is a useful tool to quantify molecular dynamics in biophysics and biochemistry, such as protein-protein interactions, protein–DNA interactions, and protein conformational changes. For monitoring the complex formation between two molecules, one of them is labeled with a donor and the other with an acceptor. The FRET efficiency is measured and used to identify interactions between the labeled complexes. There are several ways of measuring the FRET efficiency by monitoring changes in the fluorescence emitted by the donor or the acceptor.[20]Sensitized emission[edit]One method of measuring FRET efficiency is to measure the variationin acceptor emission intensity.[14] When the donor and acceptor are in proximity (1–10 nm) due to the interaction of the two molecules, the acceptor emission will increase because of the intermolecularFRET from the donor to the acceptor. For monitoring protein conformational changes, the target protein is labeled with a donor and an acceptor at two loci. When a twist or bend of the protein brings the change in the distance or relative orientation of the donor and acceptor, FRET change is observed. If a molecular interaction or a protein conformational change is dependent on ligand binding, this FRET technique is applicable to fluorescent indicators for the ligand detection.Photobleaching FRET[edit]FRET efficiencies can also be inferred from the photobleaching rates of the donor in the presence and absence of an acceptor.[14] This method can be performed on most fluorescence microscopes; one simply shines the excitation light (of a frequency that will excite the donor but not the acceptor significantly) on specimens with and without the acceptor fluorophore and monitors the donor fluorescence (typically separated from acceptor fluorescence using a bandpass filter) over time. The timescale is that of photobleaching, which is seconds to minutes, with fluorescence in each curve being given bywhere is the photobleaching decay time constant and depends on whether the acceptor is present or not. Since photobleaching consists in the permanent inactivation of excited fluorophores, resonance energy transfer from an excited donor to an acceptor fluorophore prevents the photobleaching of that donor fluorophore, and thus high FRET efficiency leads to a longer photobleaching decay time constant:where and are the photobleaching decay time constants of thedonor in the presence and in the absence of the acceptor, respectively. (Notice that the fraction is the reciprocal of that used for lifetime measurements).This technique was introduced by Jovin in 1989.[21] Its use of anentire curve of points to extract the time constants can give it accuracy advantages over the other methods. Also, the fact that time measurements are over seconds rather than nanoseconds makes it easierthan fluorescence lifetime measurements, and because photobleaching decay rates do not generally depend on donor concentration (unless acceptor saturation is an issue), the careful control of concentrations needed for intensity measurements is not needed. It is, however, important to keep the illumination the same for the with- and without-acceptor measurements, as photobleaching increases markedly with more intense incident light.Lifetime measurements[edit]FRET efficiency can also be determined from the change in the fluorescence lifetime of the donor.[14] The lifetime of the donor will decrease in the presence of the acceptor. Lifetime measurements of FRET are used in Fluorescence-lifetime imaging microscopy.Fluorophores used for FRET[edit]If the linker is intact, excitation at the absorbance wavelength of CFP (414nm) causes emission by YFP (525nm) due to FRET. If the linker is cleaved by a protease, FRET is abolished and emission is at the CFP wavelength (475nm).CFP-YFP pairs[edit]One common pair fluorophores for biological use is a cyan fluorescent protein (CFP) – yellow fluorescent protein (YFP) pair.[22] Both are color variants of green fluorescent protein (GFP). Labeling with organic fluorescent dyes requires purification, chemical modification, and intracellular injection of a host protein. GFP variants can be attached to a host protein by genetic engineering which can be more convenient. Additionally, a fusion of CFP and YFP linked by a protease cleavage sequence can be used as a cleavage assay.[23]BRET[edit]A limitation of FRET is the requirement for external illumination to initiate the fluorescence transfer, which can lead to background noise in the results from direct excitation of the acceptor or to photobleaching. To avoid this drawback, Bioluminescence Resonance Energy Transfer (or BRET) has been developed.[24] This technique uses a bioluminescent luciferase (typically the luciferase from Renilla reniformis) rather than CFP to produce an initial photon emission compatible with YFP.Homo-FRET[edit]In general, "FRET" refers to situations where the donor and acceptor proteins (or "fluorophores") are of two different types. In many biological situations, however, researchers might need to examine the interactions between two, or more, proteins of the same type—or indeed the same protein with itself, for example if the protein folds or forms part of a polymer chain of proteins[25] or for other questions of quantification in biological cells.[26]Obviously, spectral differences will not be the tool used to detect and measure FRET, as both the acceptor and donor protein emit light with the same wavelengths. Yet researchers can detect differences in the polarisation between the light which excites the fluorophores andthe light which is emitted, in a technique called FRET anisotropy imaging; the level of quantified anisotropy (difference in polarisation between the excitation and emission beams) then becomes an indicative guide to how many FRET events have happened.[27]Applications[edit]Biology[edit]FRET has been used to measure distance and detect molecular interactions in a number of systems and has applications in biology and chemistry.[28] FRET can be used to measure distances between domains in a single protein and therefore to provide information about protein conformation.[29] FRET can also detect interaction between proteins.[30] Applied in vivo, FRET has been used to detect the location and interactions of genes and cellular structures including intergrins and membrane proteins.[31] FRET can be used to obtain information about metabolic or signaling pathways.[32] FRET is also used to study lipid rafts in cell membranes.[33]FRET and BRET are also the common tools in the study of biochemical reaction kinetics and molecular motors.The applications of Fluorescence Resonance Energy Transfer (FRET) have expanded tremendously in the last 25 years, and the technique has become a staple technique in many biological and biophysical fields. FRET can be used as spectroscopic ruler in various areas such as structural elucidation of biological molecules and their interactions in vitro assays, in vivo monitoring in cellular research, nucleic acid analysis, signal transduction, light harvesting and metallic nanomaterial etc. Based on the mechanism of FRET a variety of novel chemical sensors and biosensors have been developed.[34]Other methods[edit]A different, but related, mechanism is Dexter Electron Transfer.An alternative method to detecting protein–protein proximity is the bimolecular fluorescence complementation (BiFC) where two halves of a YFP are fused to a protein. When these two halves meet they form a fluorophore after about 60 s – 1 hr.[35]See also[edit]∙Förster coupling∙Surface energy transfer∙Dexter electron transfer∙Time-resolved fluorescence energy transferReferences[edit]1.Jump up ^ Cheng, Ping-Chin (2006). "The Contrast Formation in OpticalMicroscopy". In Pawley, James B. Handbook Of Biological Confocal Microscopy(3rd ed.). New York, NY: Springer. pp. 162–206. doi:10.1007/978-0-387-45524-2_8. ISBN 978-0-387-25921-5.2.Jump up ^ Helms, Volkhard (2008). "Fluorescence Resonance Energy Transfer".Principles of Computational Cell Biology. Weinheim: Wiley-VCH. p. 202.ISBN 978-3-527-31555-0.3.Jump up ^ Harris, Daniel C. (2010). "Applications of Spectrophotometry".Quantitative Chemical Analysis (8th ed.). New York: W. H. Freeman and Co.pp. 419–44. ISBN 978-1-4292-1815-3.4.Jump up ^ Zheng, Jie (2006). "Spectroscopy-Based Quantitative FluorescenceResonance Energy Transfer Analysis". In Stockand, James D.; Shapiro, MarkS. Ion Channels: Methods and Protocols. Methods in Molecular Biology,Volume 337. Totowa, NJ: Humana Press. pp. 65–77. doi:10.1385/1-59745-095-2:65. ISBN 978-1-59745-095-9.5.Jump up ^ Andrews, David L. (1989). "A unified theory of radiative andradiationless molecular energy transfer". Chemical Physics135 (2): 195–201. Bibcode:1989CP....135..195A. doi:10.1016/0301-0104(89)87019-3.6.Jump up ^ Andrews, David L; Bradshaw, David S (2004). "Virtual photons,dipole fields and energy transfer: A quantum electrodynamical approach".European Journal of Physics25 (6): 845. doi:10.1088/0143-0807/25/6/017.7.Jump up ^Förster, Theodor (1948). "Zwischenmolekulare Energiewanderung undFluoreszenz" [Intermolecular energy migration and fluorescence]. Annalender Physik (in German) 437: 55–75. Bibcode:1948AnP...437...55F.doi:10.1002/andp.19484370105.8.^ Jump up to: a b Valeur, Bernard; Berberan-Santos, Mario (2012). "ExcitationEnergy Transfer". Molecular Fluorescence: Principles and Applications, 2nded. Weinheim: Wiley-VCH. pp. 213–261. doi:10.1002/9783527650002.ch8.ISBN 9783527328376.9.Jump up ^ FRET microscopy tutorial from Olympus10.Jump up ^Glossary of Terms Used in Photochemistry (3rd ed.). IUPAC. 2007.p. 340.11.Jump up ^ Moens, Pierre. "Fluorescence Resonance Energy Transferspectroscopy". Retrieved July 14, 2012.12.^ Jump up to: a b Schaufele, Fred; Demarco, Ignacio; Day, Richard N. (2005)."FRET Imaging in the Wide-Field Microscope". In Periasamy, Ammasi; Day, Richard. Molecular Imaging: FRET Microscopy and Spectroscopy. Oxford:Oxford University Press. pp. 72–94. doi:10.1016/B978-019517720-6.50013-4.ISBN 978-0-19-517720-6.13.Jump up ^Förster, Th. (1965). "Delocalized Excitation and ExcitationTransfer". In Sinanoglu, Oktay. Modern Quantum Chemistry. IstanbulLectures. Part III: Action of Light and Organic Crystals3. New York and London: Academic Press. pp. 93–137. Retrieved 2011-06-22.14.^ Jump up to: a b c d Clegg, Robert (2009). "Förster resonance energytransfer—FRET: what is it, why do it, and how it's done". In Gadella,Theodorus W. J. FRET and FLIM Techniques. Laboratory Techniques inBiochemistry and Molecular Biology, Volume 33. Elsevier. pp. 1–57.doi:10.1016/S0075-7535(08)00001-6. ISBN 978-0-08-054958-3.15.^ Jump up to: a b Demchenko, Alexander P. (2008). "Fluorescence DetectionTechniques". Introduction to Fluorescence Sensing. Dordrecht: Springer.pp. 65–118. doi:10.1007/978-1-4020-9003-5_3. ISBN 978-1-4020-9002-8. 16.Jump up ^ Majoul, Irina; Jia, Yiwei; Duden, Rainer (2006). "PracticalFluorescence Resonance Energy Transfer or Molecular Nanobioscopy of Living Cells". In Pawley, James B. Handbook Of Biological Confocal Microscopy (3rd ed.). New York, NY: Springer. pp. 788–808. doi:10.1007/978-0-387-45524-2_45. ISBN 978-0-387-25921-5.17.Jump up ^ Template:ISRAEL JOURNAL OF CHEMISTRY. Vol. 1. No. Sa. 196318.Jump up ^ {Edelhoch, H., Brand, L., Wilchek, M. (1967). "Fluorescencestudies with tryptophyl peptides". Biochemistry 6 (2): 547–559.doi:10.1021/bi00854a024. PMID 6047638}19.Jump up ^ Lakowicz, Joseph R., ed. (1991). Principles. New York: PlenumPress. p. 172. ISBN 978-0-306-43875-2.20.Jump up ^ "Fluorescence Resonance Energy Transfer Protocol". WellcomeTrust. Retrieved 24 June 2012.[dead link]21.Jump up ^Szöllősi, János; Alexander, Denis R. (2007). "The Application ofFluorescence Resonance Energy Transfer to the Investigation ofPhosphatases". In Klumpp, Susanne; Krieglstein, Josef. ProteinPhosphatases. Methods in Enzymology, Volume 366. Amsterdam: Elsevier.pp. 203–24. doi:10.1016/S0076-6879(03)66017-9. ISBN 978-0-12-182269-9. 22.Jump up ^ Periasamy, Ammasi (July 2001). "Fluorescence resonance energytransfer microscopy: a mini review". Journal of Biomedical Optics6 (3): 287–291. Bibcode:2001JBO.....6..287P. doi:10.1117/1.1383063.PMID 11516318.23.Jump up ^ Nguyen, AW; Daugherty, PS (March 2005). "Evolutionaryoptimization of fluorescent proteins for intracellular FRET.". Naturebiotechnology23 (3): 355–60. doi:10.1038/nbt1066. PMID 15696158.24.Jump up ^ Bevan, Nicola; Rees, Stephen (2006). "Pharmaceutical Applicationsof GFP and RCFP". In Chalfie, Martin; Kain, Steven R. Green FluorescentProtein: Properties, Applications and Protocols. Methods of Biochemical Analysis, Volume 47 (2nd ed.). Hoboken, NJ: John Wiley & Sons. pp. 361–90. doi:10.1002/0471739499.ch16. ISBN 978-0-471-73682-0.25.Jump up ^ Gautier, I.; Tramier, M.; Durieux, C.; Coppey, J.; Pansu, R.B.;Nicolas, J.-C.; Kemnitz, K.; Coppey-Moisan, M. (2001). "Homo-FRETMicroscopy in Living Cells to Measure Monomer-Dimer Transition of GFP-Tagged Proteins". Biophysical Journal80 (6): 3000–8.Bibcode:2001BpJ....80.3000G. doi:10.1016/S0006-3495(01)76265-0.PMC 1301483. PMID 11371472.26.Jump up ^ Bader, Arjen N.; Hofman, Erik G.; Voortman, Jarno; Van Bergen EnHenegouwen, Paul M.P.; Gerritsen, Hans C. (2009). "Homo-FRET ImagingEnables Quantification of Protein Cluster Sizes with SubcellularResolution". Biophysical Journal97 (9): 2613–22.Bibcode:2009BpJ....97.2613B. doi:10.1016/j.bpj.2009.07.059. PMC 2770629.PMID 19883605.27.Jump up ^ Gradinaru, Claudiu C.; Marushchak, Denys O.; Samim, Masood;Krull, Ulrich J. (2010). "Fluorescence anisotropy: From single molecules to live cells". The Analyst135 (3): 452–9. Bibcode:2010Ana...135..452G.doi:10.1039/b920242k. PMID 20174695.28.Jump up ^ Lakowicz, Joseph R. (1999). Principles of fluorescencespectroscopy (2nd ed.). New York, NY: Kluwer Acad./Plenum Publ. pp. 374–443. ISBN 978-0-306-46093-7.29.Jump up ^ Truong, Kevin; Ikura, Mitsuhiko (2001). "The use of FRET imagingmicroscopy to detect protein–protein interactions and proteinconformational changes in vivo". Current Opinion in Structural Biology11(5): 573–8. doi:10.1016/S0959-440X(00)00249-9. PMID 11785758.30.Jump up ^ Pollok, B; Heim, R (1999). "Using GFP in FRET-basedapplications". Trends in Cell Biology9 (2): 57–60. doi:10.1016/S0962-8924(98)01434-2. PMID 10087619.31.Jump up ^ Sekar, R. B.; Periasamy, A (2003). "Fluorescence resonance energytransfer (FRET) microscopy imaging of live cell protein localizations". The Journal of Cell Biology160 (5): 629–33. doi:10.1083/jcb.200210140.PMC 2173363. PMID 12615908.32.Jump up ^ Ni, Qiang; Zhang, Jin (2010). "Dynamic Visualization of CellularSignaling". In Endo, Isao; Nagamune, Teruyuki. Nano/Micro Biotechnology.Advances in Biochemical Engineering/Biotechnology, Volume 119. Springer.pp. 79–97. Bibcode:2010nmb..book...79N. doi:10.1007/10_2008_48.ISBN 978-3-642-14946-7. PMID 19499207.33.Jump up ^ Silvius, John R.; Nabi, Ivan Robert (2006). "Fluorescence-quenching and resonance energy transfer studies of lipid microdomains in model and biological membranes (Review)". Molecular Membrane Biology23(1): 5–16. doi:10.1080/09687860500473002. PMID 16611577.34.Jump up ^ S. A., Hussain et al. (2015). "Fluorescence Resonance EnergyTransfer (FRET) sensor" (PDF). J. Spectrosc. Dyn.5 (7): 1–16.35.Jump up ^ Hu, Chang-Deng; Chinenov, Yurii; Kerppola, Tom K. (2002)."Visualization of Interactions among bZIP and Rel Family Proteins in Living Cells Using Bimolecular Fluorescence Complementation". Molecular Cell9(4): 789–98. doi:10.1016/S1097-2765(02)00496-3. PMID 11983170。

Climate change is one of the most pressing global issues of our time,with farreaching implications for the environment,economy,and society.The effects of climate change are multifaceted and can be observed in various aspects of life on Earth.1.Environmental Impact:The most evident impact of climate change is on the environment.Rising temperatures have led to the melting of polar ice caps and glaciers, causing sea levels to rise.This not only threatens coastal cities and lowlying islands but also disrupts the habitats of many species,leading to a loss of biodiversity.Additionally, climate change has been linked to more frequent and severe weather events,such as hurricanes,floods,and droughts,which can devastate ecosystems and human settlements.2.Agricultural Effects:Agriculture is heavily dependent on stable climate conditions. Changes in temperature and precipitation patterns can lead to reduced crop yields, affecting food security globally.Droughts can decimate harvests,while floods can destroy crops and soil fertility.Moreover,warmer temperatures can shift the ranges of pests and diseases,complicating agricultural practices.3.Health Implications:Climate change can have direct and indirect effects on human health.Direct effects include heatrelated illnesses and deaths during heatwaves.Indirect effects are more complex and can include the spread of vectorborne diseases as warmer climates expand the habitats of diseasecarrying insects.Additionally,air quality can be affected by higher temperatures,exacerbating respiratory issues.4.Economic Consequences:The economic impacts of climate change are significant and varied.Industries such as agriculture,fisheries,and tourism are particularly vulnerable to the effects of climate change.Insurance costs may rise due to an increase in natural disasters,and infrastructure may require costly adaptations to withstand extreme weather events.On the other hand,some regions may experience economic benefits from a longer growing season or access to new shipping routes.5.Social and Political Ramifications:Climate change can exacerbate social inequalities and lead to political instability.Displacement of populations due to environmental disasters can create refugee crises,straining international relations and local resources. Additionally,competition for dwindling resources like water and arable land can lead to conflicts.6.Mitigation and Adaptation Efforts:In response to the impacts of climate change,there is a growing emphasis on mitigation and adaptation strategies.Mitigation involves reducing greenhouse gas emissions to slow the rate of climate change,while adaptation involves adjusting to the effects that are already occurring.This can include developingmore resilient infrastructure,investing in renewable energy,and implementing policies that promote sustainable development.cation and Awareness:Raising awareness about the impacts of climate change is crucial for driving societal and political cation plays a key role in informing the public about the science behind climate change,its consequences,and the steps that can be taken to mitigate its effects.8.International Cooperation:Addressing climate change requires a coordinated global response.International agreements,such as the Paris Agreement,aim to unite countries in efforts to reduce emissions and support those most vulnerable to climate change impacts.In conclusion,the impacts of climate change are widespread and interconnected, affecting every aspect of life on Earth.It is essential that individuals,communities,and nations work together to mitigate these effects and adapt to the changes that are already underway.。

荷花耐深水评价体系及耐深水鉴定李祥志;刘兆磊;陈发棣;丁跃生;高迎;王宏辉【摘要】[目的]为发掘耐深水荷花(Nelumbo nucifera Gaertn),建立荷花苗期耐深水性评价体系.[方法]根据逐步增加水深过程中盆栽荷花表型变化,将深水胁迫指数划分为7个等级;采用叶色、叶形态、叶柄高度、叶柄粗度、成活率5个外观形态指标,进行定量分级,制定等级得分标准,然后以各指标的得分总和对耐深水性进行综合评价,建立评价体系,对20个荷花品种耐深水性鉴定.[结果]不同荷花品种对水深要求差异较大,初步筛选结果为:极不耐深水品种2个,分别为“红飞天”和“贵妃醉酒”;不耐深水品种8个,分别为“友谊牡丹莲”、“欢庆”、“粉牡丹”、“红台莲”、“金碧辉煌”、“伯里之子”、“似彩云”和“似粉黛”;较耐深水品种8个,分别为“深情”、“新统帅”、“上海一号”、“普者黑白荷”、“碧云”、“梨花白”、“金色年华”和“红巨子”;高度耐深水品种2个,分别为“台城拂翠”和“秦淮花灯”.耐深水荷花以1.2m水深为宜.[结论]该研究初步筛选出2个高度耐深水荷花品种“台城拂翠”和“秦淮花灯”,可为荷花耐深水育种奠定基础.【期刊名称】《安徽农业科学》【年(卷),期】2014(000)003【总页数】4页(P679-682)【关键词】荷花;耐深水性;形态指标;评价体系【作者】李祥志;刘兆磊;陈发棣;丁跃生;高迎;王宏辉【作者单位】南京农业大学园艺学院,江苏南京210095;南京农业大学园艺学院,江苏南京210095;南京农业大学园艺学院,江苏南京210095;南京艺莲苑花卉有限公司,江苏南京210000;南京农业大学园艺学院,江苏南京210095;南京农业大学园艺学院,江苏南京210095【正文语种】中文【中图分类】S682.32荷花(Nelumbo nucifera Gaertn)是睡莲科莲属多年生大型挺水植物,又名莲或莲花,原产我国。
目前有中国莲种系、中国莲亚种莲种系和中美杂种莲种系3个种系[1]。

腊梅花的根、茎、叶作文英文回答:Roots of the Plum Blossom:The roots of the plum blossom are an essential part of the plant's structure and function. They anchor the plant in the soil and absorb water and nutrients necessary for growth. The roots of the plum blossom are typically fibrous and spread out in a radial pattern from the base of the plant. They have a strong grip on the soil, allowing the plant to withstand strong winds and other external forces. The roots also play a role in storing carbohydrates and other essential nutrients, which are used by the plant during periods of dormancy or when resources are limited.Stems of the Plum Blossom:The stems of the plum blossom are upright and woody, providing support for the plant's leaves and flowers. Theytransport water and nutrients from the roots to the rest of the plant. The stems also serve as a pathway for the movement of sugars and other organic compounds produced during photosynthesis. In addition to their structural and transport functions, the stems of the plum blossom can also undergo secondary growth, allowing the plant to increase in height and girth over time. This secondary growth is facilitated by the presence of vascular tissues, such as xylem and phloem, which are responsible for the transport of fluids and nutrients within the plant.Leaves of the Plum Blossom:The leaves of the plum blossom are typically ovate or lanceolate in shape and have a smooth texture. They are arranged alternately along the stems and are attached to the branches by petioles. The leaves play a crucial role in the process of photosynthesis, where they capture sunlight and convert it into energy. They contain chlorophyll, which gives them their green color and enables them to absorb light. The leaves also have small openings called stomata, which allow for the exchange of gases, such as oxygen andcarbon dioxide, with the surrounding environment. This exchange is important for the plant's respiration and the regulation of water loss through transpiration.中文回答:腊梅花的根部:腊梅花的根部是植物结构和功能的重要组成部分。
An operational remote sensing algorithm of land surface evaporationKenlo NishidaInstitute of Agricultural and Forest Engineering,University of Tsukuba,Tsukuba,JapanRamakrishna R.Nemani and Steven W.RunningNumerical Terradynamic Simulation Group(NTSG),School of Forestry,University of Montana,Missoula,Montana,USAJoseph M.GlassyLupine Logic,Inc.,Missoula,Montana,USAReceived5January2002;revised17October2002;accepted27January2003;published7May2003.[1]Partitioning of solar energy at the Earth surface has significant implications in climatedynamics,hydrology,and ecology.Consequently,spatial mapping of energy partitioningfrom satellite remote sensing data has been an active research area for over twodecades.We developed an algorithm for estimating evaporation fraction(EF),expressedas a ratio of actual evapotranspiration(ET)to the available energy(sum of ET and sensibleheat flux),from satellite data.The algorithm is a simple two-source model of ET.Wecharacterize a landscape as a mixture of bare soil and vegetation and thus we estimate EFas a mixture of EF of bare soil and EF of vegetation.In the estimation of EF of vegetation,we use the complementary relationship of the actual and the potential ET for theformulation of EF.In that,we use the canopy conductance model for describing vegetationphysiology.On the other hand,we use‘‘VI-T s’’(vegetation index-surface temperature)diagram for estimation of EF of bare soil.As operational production of EF globally is ourgoal,the algorithm is primarily driven by remote sensing data but flexible enough to ingestancillary data when available.We validated EF from this prototype algorithm usingNOAA/AVHRR data with actual observations of EF at AmeriFlux stations(standard errorffi0.17and R2ffi0.71).Global distribution of EF every8days will be operationallyproduced by this algorithm using the data of MODIS on EOS-PM(Aqua)satellite.I NDEX T ERMS:1818Hydrology:Evapotranspiration;3322Meteorology and AtmosphericDynamics:Land/atmosphere interactions;3360Meteorology and Atmospheric Dynamics:Remote sensing;K EYWORDS:MODIS,Aqua,evapotranspirationCitation:Nishida,K.,R.R.Nemani,S.W.Running,and J.M.Glassy,An operational remote sensing algorithm of land surface evaporation,J.Geophys.Res.,108(D9),4270,doi:10.1029/2002JD002062,2003.1.Introduction[2]Accurate characterization of evapotranspiration(ET, or latent heat flux;in this paper,in W mÀ2)is essential for understanding climate dynamics and the terrestrial ecosys-tem productivity[Churkina et al.,1999;Nemani et al., 2002]because it is closely related to energy transfer processes.It also has applications in such areas as water resource management and wild fire assessment.[3]As a result of historical efforts,accurate estimation of ET is becoming available via a number of methods using surface meteorological and sounding observations.How-ever,the ground observation networks cover only a small portion of global land surface.Therefore many attempts have been made to minimize the use of ground observations for estimating spatial distribution of ET at regional to global scales.Satellite remote sensing is a promising tool for this purpose.Nevertheless,most of the existing techniques of ET estimation from satellite remote sensing are not satis-factory,because they still depend on ground observations. Therefore consistent estimation of up-to-date global ET distribution with satellite remote sensing independent of ground observations remains a challenging task.One pos-sible approach is the utilization of the reanalysis data from global circulation model(GCM)as a surrogate for ground observations,but it is still problematic because the accuracy of the reanalysis also depends on the ground observation network.In addition,the grid scale of the reanalysis data is usually too coarse to be combined with finer scale satellite observations.[4]One popular approach for estimation of ET from a satellite is using a combination of vegetation index(VI)and the surface radiant temperature(T s).We call this approach the VI-T s method.Nemani and Running[1989]showed the utility of a scatterplot of VI and T s of a group of pixels inside a fixed square region(we call it‘‘window’’)in a satellite image.Figure1is an illustration of VI-T s scatterJOURNAL OF GEOPHYSICAL RESEARCH,VOL.108,NO.D9,4270,doi:10.1029/2002JD002062,2003Copyright2003by the American Geophysical Union.0148-0227/03/2002JD002062$09.00ACL5-1diagram.In general,a VI-T s diagram shows a linear or triangular distribution with a negative correlation between VI and T s.Changes in the slope of VI-T s scatterplot(s) during a growing season have been found to track modeled surface conductance in a semiarid ecosystem[Nemani and Running,1989].Generally speaking,s assumes a negative value because dense vegetation(with high VI)has lower T s. As the surface becomes drier,sparse vegetation and bare soil become warmer relative to vegetation resulting in larger negative values of s.[5]Since then,studies on VI-T s methods made rapid progress.Carlson et al.[1995]and Gillies et al.[1997] established an inversion technique of their SV AT model to estimate available soil moisture(M0)from VI-T s triangle (named as the‘‘Triangle Method’’)distributions without meteorological data.Moran et al.[1994]developed an algorithm to estimate‘‘water deficit index(WDI)’’through a simple geometric consideration on the VI-T s diagram (which they call vegetation index-temperature trapezoid, VITT)with a theoretical basis of crop water stress index (CWSI)proposed by Jackson et al.[1981].Jiang and Islam [2001]developed another VI-T s method by linear decom-position of the triangular distribution of VI-T s diagram and estimated the‘‘a’’parameter of the Priestley-Taylor’s equa-tion.This method has clear advantages of simplicity and consistency.It does not require any surface meteorology data.[6]However,there are several difficulties to the above VI-T s methods.First,some of them still need surface meteorological data.Second,inversion of numerical model may require large amount of computational resources when applied at global scales.Third,on a dense vegetation,T s is close to the air temperature(T a)because of small aerody-namic resistance of the vegetation canopy,making it diffi-cult to estimate ET from a gradient of temperature.Fourth,some concepts are based on a single-source big-leaf model, which may be difficult to apply to complex landscapes with mixed land covers.[7]In this study,we propose a new version of VI-T s method for global ET estimation using moderate-resolution ($1km)optical remote sensing data such as Aqua/MODIS sensor.Taking the above problems into account,we estab-lished five policies for the development of the proposed algorithm.[8](1)‘‘Stand alone.’’It can operate without surface meteorological data(e.g.,wind speed,vapor pressure deficit (VPD),air temperature,boundary layer stability).In gen-eral,the VPD and the wind speed(or the aerodynamic resistance)are difficult to be estimated from remote sensing, yet critical for ET estimation.Therefore we tried to mini-mize the influence of these two meteorological elements in our algorithm.[9](2)‘‘Flexibility.’’If meteorological data are available, the algorithm should be flexible enough to incorporate them.It should also incorporate other ancillary data such as albedo,emissivity,and roughness when they are avail-able.Therefore we must describe these variables explicitly in the algorithm.[10](3)‘‘Simplicity.’’It is simply constructed in order to save computational resources.[11](4)‘‘Scalability.’’It provides information not only about instantaneous but also about daily ET.This is because daily ET is more interesting for many users than instanta-neous one.Moreover,because the NASA EOS project operates the two MODIS sensors onboard the EOS-AM (Terra)satellite and the EOS-PM(Aqua)satellite[Running et al.,1994]and they observe each land surface twice a day (morning and afternoon),the algorithm should consistently process these multiple data sources if required.Figure1.The VI-T s diagram and the concept of estimation of T soil max,T veg,and T soil for equation(27). ACL5-2NISHIDA ET AL.:OPERATIONAL REMOTE SENSING[12](5)‘‘Versatility.’’It should operate regardless of the type of vegetation,land cover,season,and climate.2.Algorithm2.1.Evaporation Fraction(EF)[13]We introduce‘‘evaporation fraction(EF)’’as an index for ET after Shuttleworth et al.[1989]:ET ET=Q;ð1Þwhere Q is the available energy(W mÀ2)which can be transferred directly into atmosphere as either sensible heat flux(H;in W mÀ2)or latent heat flux.In other words,Q HþET:ð2ÞBecause of energy conservation,we can also describe Q as the difference between the net radiation(R n)and the ground heat transfer(G):Q¼R nÀG:ð3ÞEF is directly related to the Bowen Ratio(=H/ET)by EF= 1/(1+BR).However,we do not use BR because(1)BR is a nonlinear parameter for ET and(2)BR does not have upper limit(if ET approaches zero,BR goes to infinity). [14]Our goal is estimation of EF rather than ET.This is due to three reasons:(1)EF is a suitable index for surface moisture condition,(2)EF is useful for temporal scaling, and(3)accurate estimation of Q is difficult.We explain each one of them hereafter.[15]First,EF is more suitable index for surface moisture condition than ET.ET cannot be easily interpreted as an index for the soil moisture or drought status because it is a function not only of the surface moisture but some of the environmental factors such as the incoming radiation(or the available energy Q).On the contrary,EF is more directly related to the land surface conditions because of Q,the denominator of EF.Although in some exceptional cases ET may exceed Q(especially when a dry warm air mass flows onto a wet surface),Q is the possible upper limit of ET in most cases.Therefore dividing ET by Q results in a simple and rational way to represent the surface moisture condition or drought.[16]Second,EF is useful for scaling instantaneous obser-vations to longer time periods.Satellites(except the geo-stationary satellites)observe each land surface only a few times in a day.ET,however,generally shows large diurnal changes responding to the Sun angle and cloud coverage. Therefore even if we can estimate ET at the moment of satellite overpass,it cannot be directly related to the daily or daytime total ET.On the contrary,EF is nearly constant during most daytime in many cases[Shuttleworth et al., 1989;Sugita and Brutsaert,1991;Crago,1996].Therefore if we can estimate the daily or daytime average Q,we can estimate the daily or daytime average ET by using instanta-neous EF derived by a satellite.[17]Finally,accurate estimation of Q requires input data which are not easily available via optical remote sensing,such as atmospheric water vapor content and aerosol.Although we estimate Q during the process of estimating EF,we eventually normalize it in order to reduce errors because we cannot trust the accuracy of a simple radiative transfer algorithm of Q for a reliable estimation of ET.[18]With reference to the first reason,we should further discuss‘‘potential evaporation(PET).’’PET is the maxi-mum possible ET under specific climate and surface con-dition.Although many types of PET have been proposed, Penman’s PET(PET PM;equation(4))and Priestley and Taylor’s PET(PET PT;equation(5))[Priestley and Taylor, 1972]are the most widely acceptedET PM¼ÁQþr C Pðe*ÀeÞ=r aÁþgð4ÞandET PT¼aÁþgQ;ð5ÞwhereÁis derivative of the saturated vapor pressure in terms of temperature(Pa KÀ1),g is the psychrometric constant(Pa KÀ1),r is the air density(kg mÀ3),C P is the specific heat of air under constant pressure(J kgÀ1KÀ1),e* is the saturated vapor pressure(Pa)at the air temperature,e is the vapor pressure in the atmosphere(Pa),and r a is the aerodynamic resistance(s mÀ1).The VPD is e*Àe.The a in equation(5)is called‘‘Priestley-Taylor’s parameter.’’Although still controversial[e.g.,De Bruin,1983],1.26is generally accepted as the value of a.[19]Because PET as well as Q set the upper limit of ET, PET can normalize ET and yield relative magnitude of ET. In fact,many studies use ET/PET instead of EF because PET represents a more realistic upper limit of ET than Q. For example,Granger and Gray[1989]used ET/PET PM to see direct relationship between ET and VPD.Choudhury et al.[1994]used ET/PET PT to see a relationship between vegetation index and ET.Jiang and Islam[2001]also used PET PT as a normalization factor for ET.However,some-times it is difficult to estimate PET as it requires meteoro-logical information such as temperature,VPD,and wind speed.Therefore even if we get accurate value of ET/PET,it is difficult to convert it to the actual ET without such information.This is the main reason why we do not use ET/PET.The well-known diurnal stability of EF,which we mentioned previously,is another reason to use EF.The relation between EF and ET/PET is discussed in Appendix A as it played key role in the theoretical development of the algorithm.2.2.Linear Two-Source Model of EF[20]In our algorithm,we simplify a landscape as a mixture of two elements,namely,vegetation and bare soil. The proportion of vegetation is the fractional vegetation cover,namely,f veg which takes a value between0and1. Assuming a negligible coupled energy transfer between vegetation and bare soil,we describe ET from a pixel as a linear combination of ET from vegetation and ET from bare soil:ET¼f veg ET vegþ1Àf vegÀÁET soil:ð6ÞNISHIDA ET AL.:OPERATIONAL REMOTE SENSING ACL5-3The subscripts‘‘veg’’and‘‘soil’’denote vegetation and bare soil,respectively.This linear model is invalid when ET varies significantly within each component.Such situation happens in a fragmented landscape with a markedly different surface temperature,moisture,and roughness between the two components[e.g.,Oke,1987]. Additionally,we can describe each of ET veg and ET soil by using EF:ET veg¼Q veg EF vegð7ÞandET soil¼Q soil EF soil:ð8ÞThe difference between Q veg and Q soil comes from differences in thermal emission,solar reflectance,and ground heat flux between bare soil and vegetation.By dividing equation(6)with the available energy over the entire modeled landscape[Q=f veg Q veg+(1Àf veg)Q soil] and using equations(7)and(8),we describe EF on the entire landscape(EF)as:EF¼ETQ¼f vegQ vegQEF vegþ1Àf vegÀÁQ soilQEF soil:ð9Þ3.Estimation of Core Variables[21]In equation(9),the most important variables(Core Variables)are f veg,EF veg,and EF soil.In this section,we describe how to estimate these core variables.Most of the formulations of the core variables are not likely to change even if we get other ancillary data.However,in the estimation of the core variables,we need other variables such as air temperature,wind speed,incoming radiation etc. We call them as‘‘basic variables’’and they may be provided by other reliable data sources.We describe how we estimate the basic variables in section4.3.1.Fractional Vegetation Cover(f veg)[22]The fractional vegetation cover(f veg)is estimated from the spectral vegetation index.Although there are many types of vegetation indices,we can use normalized differ-ence vegetation index(NDVI)as an example.NDVI is defined as a ratio of red(R red)and near-infrared(R nir) reflectancesNDVI¼R nirÀR redðÞ=R nirþR redðÞ:ð10ÞIf we can assume that NDVI is linearly related to f veg,we can say:f veg¼NDVIÀNDVI minðÞ=NDVI maxÀNDVI minðÞ;ð11Þwhere NDVI max and NDVI min are NDVI of full vegetation (f veg=1)and bare soil(f veg=1).The assumption of linearity of NDVI in terms of f veg is not valid when the sum of two channels of reflectance(R nir+R red)is significantly different between vegetation and bare soil.We can minimize such influence by using advanced VIs such as SA VI[Huete,1988]or EVI[Huete et al.,1999]if some additional information is available.3.2.Estimation of the EF of Vegetation(EF veg) [23]Because of active turbulent diffusion,dense vegeta-tion(especially forest)shows little difference between T a and T s regardless of the magnitude of ET.It makes estima-tion of ET difficult over dense vegetation using a temper-ature gradient(T s-T a)or some of the existing VI-T s methods. The isolines of ET or soil moisture in such VI-T s methods converge into one point at dense vegetation under the temperature gradient logic.In other words,from the stand-point of using temperature gradient,dense vegetation becomes a mathematically singular point.Jiang and Islam [2001]avoided this problem by assigning the maximum value of‘‘a’’parameter[i.e.,(Á+g)/Á]to the dense vegetation canopy assuming that the entire available energy is dissipated as ET over the dense vegetation.However,they are not always true because even a dense vegetation canopy responds to environmental conditions and does not always transpire at the potential rates.Therefore we have to con-sider physiology of the vegetation.For this reason,we introduce the surface resistance of the canopy in the formulation of EF veg as follows.[24]Let us consider ET veg by using Penman-Monteith equation(12):ET veg¼ÁQþr C Pðe*ÀeÞ=r aÁþg1þr c=r aðÞ;ð12Þwhere r c is surface resistance of the vegetation canopy(s mÀ1).In this equation,the most difficult parameters to be obtained by a satellite are VPD(that is e*Àe)in the numerator and the wind speed,which controls r a in both numerator and denominator.Therefore we want to minimize the influence of these two factors by modifying this equation.Dividing equation(12)by equation(4),we can remove the VPD term in the numerator to obtain:ET vegPM veg¼Áþgc a;ð13Þwhere PET PM veg is Penman’s PET(equation(4))on vegetation(W mÀ2).Assuming the complementary rela-tionship formulated by the Brutsaert and Stricker’s[1979] advection aridity(Appendix A),we can convert ET veg/ PET PM veg to EF veg by solving equation(A5)and equation (13)and then get:EF veg¼aÁÁþg1þr c=2r aðÞ:ð14ÞNote that equation(14)becomes equivalent to Priestley-Taylor’s PET(equation(5))if r c is zero.Although there is still an influence of VPD and wind speed in equation(14) because r c depends on VPD and r a depends on wind speed, the influence is less direct than equation(12).We use equation(14)to estimate EF veg from satellite data. [25]In this equation,Áand g are available from the air temperature T a(although g depends on atmospheric pres-ACL5-4NISHIDA ET AL.:OPERATIONAL REMOTE SENSINGsure as well,the effect is usually small).We describe how to estimate T a in section 4.1.[26]We also need r a and r c to solve equation (14).In order to estimate r a ,we use the following empirical for-mulae [Kondo ,2000,143pp.;Kondo ,1994,137pp.]:1=r a ¼0:008U 50mforforest canopy ;ð15Þ1=r a ¼0:003U 1m for grassland and croplands ;ð16Þwhere U 50m and U 1m are wind speeds at 50and 1.0m heights,respectively (m s À1).We estimate U 50m by using VI-T s diagram,as described in section 4.3.We estimate U 1m from U 50m by using the logarithm profile of wind:U ¼u *ln z Àd ðÞ=z 0½ =k ;ð17Þwhere u *is the shear velocity (m s À1),z is the height (m),d is the surface displacement (m),z 0is the roughness length (we assumed z 0=0.005m for bare surface and 0.01m for grassland after Kondo [2000]),and k is the von Karman’s constant and we assume 0.4as its value.Equation (17)is valid only under near-neutral condition.However,we can easily modify it if stability parameter (such as z /L ;L is the Monin-Obukhov length)is available.[27]For estimation of r c in equation (13),we assume the environmental factors,namely temperature,VPD,photo-synthetic active radiation (PAR),soil water potential,and atmospheric CO 2concentration control stomatal conduc-tance [Jarvis ,1976]in the following form:1=r c ¼f 1T a ðÞf 2PAR ðÞf 3VPD ðÞf 4y ðÞf 5CO 2ðÞ=r c MIN þ1=r cuticle ;ð18Þwhere y is the leaf-water potential (Pa),r c MIN is the minimum resistance (s m À1),and r cuticle is the canopy resistance related to diffusion through cuticle layer of leaves (s m À1).Among the environmental factors in equation (18),only temperature and PAR can be estimated from satellite remote sensing and radiative transfer calcu-lation,whereas VPD and y are hard to estimate from satellite data.However,some studies pointed out that temperature could sometimes be a surrogate for VPD.For example,Tanaka et al.[2000]reported in his field observation of deciduous conifer forest in Siberia that the behavior of the canopy conductance against VPD and temperature is mostly parallel to each other so that either one of them is sufficient to describe r c .Toda et al.[2000]also reported a similar situation in a mixed landscape in Thailand where the distinctive rainy season and dry season exist.However,a severe soil water stress can often lead to a complete degradation of canopy.For example,Hipps et al.[1996]reported a rapid response of arid shrub foliages to soil water depletion in the Great Basin ecosystem.In such cases,change of f veg (or vegetation index)and EF soil should account for the drought.Therefore we decided to drop the terms of VPD,y ,and CO 2(f 2,f 4,and f 5)from equation (17)in the actual implementation although in some cases such simplifications may inevitably introduce large errors.However,if estimates of VPD become available from other data sources,we can easily incorporate them in equation (18).[28]We adopted the following equations [Jarvis ,1976;Kosugi ,1996]to estimate each of the components in equation (18):f 1T a ðÞ¼T a ÀT n T o ÀT nT x ÀT a T x ÀT oT x ÀT o ðÞ=T o ÀT n ðÞ½;ð19Þf 2PAR ðÞ¼PAR;ð20Þwhere T n ,T o ,T x are minimum,optimal,and maximum temperatures for stomatal activity,respectively.The para-meter concerning photon absorption efficiency at low light intensity is A .These four parameters as well as r c MIN determine the characteristics of the stomata behavior.Although they can change depending on species,structure of canopy,and adaptation to regional environment etc.,we chose a set of representative values for all biomes for simplicity.We took the values of r c MIN of Kelliher et al.[1995].They showed that the maximum canopy conductance (reciprocal of r c MIN )of dense vegetation is approximately 2.7times of maximum leaf conductance.They further concluded that the maximum canopy conductance is approximately 0.020m s À1(as a resistance,50s m À1)for natural vegetation and 0.033m s À1(as a resistance,33s m À1)for agricultural crops.For r cuticle ,we adopted the value used in Biome-BGC model [White et al.,2000].For T n ,T o ,T x ,and A ,we adopted an experimental result of Kosugi [1996].She determined these parameters for leaves of three tree species (Quercus glauca ,Cinnamomum camphora ,and Pasania edulis )without parameterization of VPD and y (f 2and f 4).We took the average of each parameter in her experiment.Table 1shows the settings of these parameters.Figure 2shows dependency of EF veg on temperature,wind speed,and vegetation types.3.3.Estimation of EF at Bare Soil (EF soil )[29]In order to estimate EF soil ,we consider energy budget of a bare soil.First,we express the net radiation with radiation components as follows:R n ¼1Àref ðÞR d þL d Àes T 4s ;ð21Þwhere ref is the albedo,R d is the downward short-wave radiation (W m À2),L d is the downward long-wave (thermal infrared)radiation (W m À2),e is the emissivity,and s is theTable 1.Parameters for the Canopy Conductance ModeAbbreviation DefinitionParameter R c MIN Minimum resistance (natural)50s m À1R c MIN Minimum resistance (crop)33s m À1R cuticle Cuticle resistance 100,000s m À1T n ,Minimum temperature 2.7°C T o ,Optimal temperature 31.1°C T x Maximum temperature 45.3°CA(Related to light use efficiency)152m mol m À2s À1NISHIDA ET AL.:OPERATIONAL REMOTE SENSINGACL 5-5Stefan-Boltzmann constant (W m À2K À4).If we apply equation (21)to bare soil and expand the last term ofequation (21)in terms of T soil ÀT a ,we get es T soil4%e soil s T a 4+4e soil s T a 3(T soil ÀT a ).Then we can modify equation (21)to separate the effect of surface temperature and get:R n %R n 0À4es T 3a T soil ÀT a ðÞ;ð22Þwhere R n 0[=(1Àref)R d +L d Àes T a 4]is the net radiation if T soil is equal to T a .[30]Meanwhile,we can express the ground heat flux on a bare soil as:G ¼C G R n ;ð23Þwhere C G is an empirical coefficient ranging from 0.3for wet soil to 0.5for dry soil [Idso et al.,1975].Then we can rewrite the energy budget (equation (3))over bare soil:Q soil ¼R n ÀG ¼1ÀC G ðÞR n %1ÀC G ðÞR n 0À4es T 3a T soil ÀT a ðÞÂüH þET ¼r C P T soil ÀT a ðÞ=r a soil þET :ð24ÞFrom equation (24),we can then describe the surface temperature of bare soil as:T soil ¼Q soil 0ÀET4es T 3a 1ÀC G ðÞþr C P =r a soilþT a ;ð25Þwhere Q soil 0[=(1ÀC G )R n 0]is the available energy (Wm À2)when T soil is equal to T a .This equation means the surface temperature of bare soil is linearly related to ET as long as other variables are invariant.T soil becomes the highest (T soil max )if ET is zero:T soil max ¼Q soil 04es T a 1ÀC G ðÞþr C P =r a soilþT a :ð26ÞBy combination of equations (25)and (26),we get:T soil max ÀT soil T soil max ÀT a ¼ET soil Q soil 0¼Q soilQ soil 0EF soil :ð27ÞIn order to use equation (27)as a means to estimateEF soil ,we need to know the maximum possible temperature (T soil max )and the actual temperature (T soil )of bare soil as well as the air temperature (T a ).We evaluate them by using the VI-T s diagram.[31]If we can assume that a window for the VI-T s diagram contains dry land surface,we can estimate the maximum possible temperature at bare soil (T soil max )by looking at the left upper corner of the VI-T s diagram (Figure 1).We can extrapolate the upper edge of the diagram to the minimum VI to estimate T soil max .We call this upper edge the ‘‘warm edge’’after Carlson et al.[1995].This approach assumes that T s can be described as a linear combination of surface temperature of vegetation cover and bare soil as:T s ¼f veg T veg þ1Àf veg ÀÁT soil :ð28ÞThis is not true because the intensity of infrared radiationfrom the land surface (which is observable by satellite)depends on surface temperature in a nonlinear manner.However,as long as the difference between T veg and T soil is small in comparison to the absolute value of T s (in K),equation (28)is approximately valid.[32]Equation (27)may seem to be applicable to not only bare soil but also to any type of land surface,and in fact,Moran et al.[1994]took this approach in their VI-T s algorithm (called ‘‘VITT’’).However,we apply it to bare soil alone.This is because equation (27)assumes homoge-neity of T s and sensible heat transfer (H )inside a pixel.In other words,equation (27)is a single-source model.If the landscape is a mixture of vegetation and bare soil,we cannot define a representative temperature for a single source of sensible heat to derive equation (24).Additionally,if we apply equation (27)to a full vegetation canopy (replacing T soil with T veg ),we can hardly estimate EF veg because,as mentioned in section 3.2,the gradient of temperature over vegetation (especially forests)due to ET is much smaller in comparison to bare soil.[33]It is important to note that equation (27)is only approximately valid because albedo (in Q soil 0),emissivityFigure 2.Dependency of EF veg on air temperature,windspeed,and vegetation type.In these graphs,PAR was set to 1000m mol m À2s À1.Broken lines are EF of Priestley-Taylor’s PET,which is a limit of EF veg with the canopy conductance close to zero or wind speed close to zero.ACL 5-6NISHIDA ET AL.:OPERATIONAL REMOTE SENSING。

425 BibliographyH.A KAIKE(1974).Markovian representation of stochastic processes and its application to the analysis of autoregressive moving average processes.Annals Institute Statistical Mathematics,vol.26,pp.363-387. B.D.O.A NDERSON and J.B.M OORE(1979).Optimal rmation and System Sciences Series, Prentice Hall,Englewood Cliffs,NJ.T.W.A NDERSON(1971).The Statistical Analysis of Time Series.Series in Probability and Mathematical Statistics,Wiley,New York.R.A NDRE-O BRECHT(1988).A new statistical approach for the automatic segmentation of continuous speech signals.IEEE Trans.Acoustics,Speech,Signal Processing,vol.ASSP-36,no1,pp.29-40.R.A NDRE-O BRECHT(1990).Reconnaissance automatique de parole`a partir de segments acoustiques et de mod`e les de Markov cach´e s.Proc.Journ´e es Etude de la Parole,Montr´e al,May1990(in French).R.A NDRE-O BRECHT and H.Y.S U(1988).Three acoustic labellings for phoneme based continuous speech recognition.Proc.Speech’88,Edinburgh,UK,pp.943-950.U.A PPEL and A.VON B RANDT(1983).Adaptive sequential segmentation of piecewise stationary time rmation Sciences,vol.29,no1,pp.27-56.L.A.A ROIAN and H.L EVENE(1950).The effectiveness of quality control procedures.Jal American Statis-tical Association,vol.45,pp.520-529.K.J.A STR¨OM and B.W ITTENMARK(1984).Computer Controlled Systems:Theory and rma-tion and System Sciences Series,Prentice Hall,Englewood Cliffs,NJ.M.B AGSHAW and R.A.J OHNSON(1975a).The effect of serial correlation on the performance of CUSUM tests-Part II.Technometrics,vol.17,no1,pp.73-80.M.B AGSHAW and R.A.J OHNSON(1975b).The influence of reference values and estimated variance on the ARL of CUSUM tests.Jal Royal Statistical Society,vol.37(B),no3,pp.413-420.M.B AGSHAW and R.A.J OHNSON(1977).Sequential procedures for detecting parameter changes in a time-series model.Jal American Statistical Association,vol.72,no359,pp.593-597.R.K.B ANSAL and P.P APANTONI-K AZAKOS(1986).An algorithm for detecting a change in a stochastic process.IEEE rmation Theory,vol.IT-32,no2,pp.227-235.G.A.B ARNARD(1959).Control charts and stochastic processes.Jal Royal Statistical Society,vol.B.21, pp.239-271.A.E.B ASHARINOV andB.S.F LEISHMAN(1962).Methods of the statistical sequential analysis and their radiotechnical applications.Sovetskoe Radio,Moscow(in Russian).M.B ASSEVILLE(1978).D´e viations par rapport au maximum:formules d’arrˆe t et martingales associ´e es. Compte-rendus du S´e minaire de Probabilit´e s,Universit´e de Rennes I.M.B ASSEVILLE(1981).Edge detection using sequential methods for change in level-Part II:Sequential detection of change in mean.IEEE Trans.Acoustics,Speech,Signal Processing,vol.ASSP-29,no1,pp.32-50.426B IBLIOGRAPHY M.B ASSEVILLE(1982).A survey of statistical failure detection techniques.In Contribution`a la D´e tectionS´e quentielle de Ruptures de Mod`e les Statistiques,Th`e se d’Etat,Universit´e de Rennes I,France(in English). M.B ASSEVILLE(1986).The two-models approach for the on-line detection of changes in AR processes. In Detection of Abrupt Changes in Signals and Dynamical Systems(M.Basseville,A.Benveniste,eds.). Lecture Notes in Control and Information Sciences,LNCIS77,Springer,New York,pp.169-215.M.B ASSEVILLE(1988).Detecting changes in signals and systems-A survey.Automatica,vol.24,pp.309-326.M.B ASSEVILLE(1989).Distance measures for signal processing and pattern recognition.Signal Process-ing,vol.18,pp.349-369.M.B ASSEVILLE and A.B ENVENISTE(1983a).Design and comparative study of some sequential jump detection algorithms for digital signals.IEEE Trans.Acoustics,Speech,Signal Processing,vol.ASSP-31, no3,pp.521-535.M.B ASSEVILLE and A.B ENVENISTE(1983b).Sequential detection of abrupt changes in spectral charac-teristics of digital signals.IEEE rmation Theory,vol.IT-29,no5,pp.709-724.M.B ASSEVILLE and A.B ENVENISTE,eds.(1986).Detection of Abrupt Changes in Signals and Dynamical Systems.Lecture Notes in Control and Information Sciences,LNCIS77,Springer,New York.M.B ASSEVILLE and I.N IKIFOROV(1991).A unified framework for statistical change detection.Proc.30th IEEE Conference on Decision and Control,Brighton,UK.M.B ASSEVILLE,B.E SPIAU and J.G ASNIER(1981).Edge detection using sequential methods for change in level-Part I:A sequential edge detection algorithm.IEEE Trans.Acoustics,Speech,Signal Processing, vol.ASSP-29,no1,pp.24-31.M.B ASSEVILLE, A.B ENVENISTE and G.M OUSTAKIDES(1986).Detection and diagnosis of abrupt changes in modal characteristics of nonstationary digital signals.IEEE rmation Theory,vol.IT-32,no3,pp.412-417.M.B ASSEVILLE,A.B ENVENISTE,G.M OUSTAKIDES and A.R OUG´E E(1987a).Detection and diagnosis of changes in the eigenstructure of nonstationary multivariable systems.Automatica,vol.23,no3,pp.479-489. M.B ASSEVILLE,A.B ENVENISTE,G.M OUSTAKIDES and A.R OUG´E E(1987b).Optimal sensor location for detecting changes in dynamical behavior.IEEE Trans.Automatic Control,vol.AC-32,no12,pp.1067-1075.M.B ASSEVILLE,A.B ENVENISTE,B.G ACH-D EVAUCHELLE,M.G OURSAT,D.B ONNECASE,P.D OREY, M.P REVOSTO and M.O LAGNON(1993).Damage monitoring in vibration mechanics:issues in diagnos-tics and predictive maintenance.Mechanical Systems and Signal Processing,vol.7,no5,pp.401-423.R.V.B EARD(1971).Failure Accommodation in Linear Systems through Self-reorganization.Ph.D.Thesis, Dept.Aeronautics and Astronautics,MIT,Cambridge,MA.A.B ENVENISTE and J.J.F UCHS(1985).Single sample modal identification of a nonstationary stochastic process.IEEE Trans.Automatic Control,vol.AC-30,no1,pp.66-74.A.B ENVENISTE,M.B ASSEVILLE and G.M OUSTAKIDES(1987).The asymptotic local approach to change detection and model validation.IEEE Trans.Automatic Control,vol.AC-32,no7,pp.583-592.A.B ENVENISTE,M.M ETIVIER and P.P RIOURET(1990).Adaptive Algorithms and Stochastic Approxima-tions.Series on Applications of Mathematics,(A.V.Balakrishnan,I.Karatzas,M.Yor,eds.).Springer,New York.A.B ENVENISTE,M.B ASSEVILLE,L.E L G HAOUI,R.N IKOUKHAH and A.S.W ILLSKY(1992).An optimum robust approach to statistical failure detection and identification.IFAC World Conference,Sydney, July1993.B IBLIOGRAPHY427 R.H.B ERK(1973).Some asymptotic aspects of sequential analysis.Annals Statistics,vol.1,no6,pp.1126-1138.R.H.B ERK(1975).Locally most powerful sequential test.Annals Statistics,vol.3,no2,pp.373-381.P.B ILLINGSLEY(1968).Convergence of Probability Measures.Wiley,New York.A.F.B ISSELL(1969).Cusum techniques for quality control.Applied Statistics,vol.18,pp.1-30.M.E.B IVAIKOV(1991).Control of the sample size for recursive estimation of parameters subject to abrupt changes.Automation and Remote Control,no9,pp.96-103.R.E.B LAHUT(1987).Principles and Practice of Information Theory.Addison-Wesley,Reading,MA.I.F.B LAKE and W.C.L INDSEY(1973).Level-crossing problems for random processes.IEEE r-mation Theory,vol.IT-19,no3,pp.295-315.G.B ODENSTEIN and H.M.P RAETORIUS(1977).Feature extraction from the encephalogram by adaptive segmentation.Proc.IEEE,vol.65,pp.642-652.T.B OHLIN(1977).Analysis of EEG signals with changing spectra using a short word Kalman estimator. Mathematical Biosciences,vol.35,pp.221-259.W.B¨OHM and P.H ACKL(1990).Improved bounds for the average run length of control charts based on finite weighted sums.Annals Statistics,vol.18,no4,pp.1895-1899.T.B OJDECKI and J.H OSZA(1984).On a generalized disorder problem.Stochastic Processes and their Applications,vol.18,pp.349-359.L.I.B ORODKIN and V.V.M OTTL’(1976).Algorithm forfinding the jump times of random process equation parameters.Automation and Remote Control,vol.37,no6,Part1,pp.23-32.A.A.B OROVKOV(1984).Theory of Mathematical Statistics-Estimation and Hypotheses Testing,Naouka, Moscow(in Russian).Translated in French under the title Statistique Math´e matique-Estimation et Tests d’Hypoth`e ses,Mir,Paris,1987.G.E.P.B OX and G.M.J ENKINS(1970).Time Series Analysis,Forecasting and Control.Series in Time Series Analysis,Holden-Day,San Francisco.A.VON B RANDT(1983).Detecting and estimating parameters jumps using ladder algorithms and likelihood ratio test.Proc.ICASSP,Boston,MA,pp.1017-1020.A.VON B RANDT(1984).Modellierung von Signalen mit Sprunghaft Ver¨a nderlichem Leistungsspektrum durch Adaptive Segmentierung.Doctor-Engineer Dissertation,M¨u nchen,RFA(in German).S.B RAUN,ed.(1986).Mechanical Signature Analysis-Theory and Applications.Academic Press,London. L.B REIMAN(1968).Probability.Series in Statistics,Addison-Wesley,Reading,MA.G.S.B RITOV and L.A.M IRONOVSKI(1972).Diagnostics of linear systems of automatic regulation.Tekh. Kibernetics,vol.1,pp.76-83.B.E.B RODSKIY and B.S.D ARKHOVSKIY(1992).Nonparametric Methods in Change-point Problems. Kluwer Academic,Boston.L.D.B ROEMELING(1982).Jal Econometrics,vol.19,Special issue on structural change in Econometrics. L.D.B ROEMELING and H.T SURUMI(1987).Econometrics and Structural Change.Dekker,New York. D.B ROOK and D.A.E VANS(1972).An approach to the probability distribution of Cusum run length. Biometrika,vol.59,pp.539-550.J.B RUNET,D.J AUME,M.L ABARR`E RE,A.R AULT and M.V ERG´E(1990).D´e tection et Diagnostic de Pannes.Trait´e des Nouvelles Technologies,S´e rie Diagnostic et Maintenance,Herm`e s,Paris(in French).428B IBLIOGRAPHY S.P.B RUZZONE and M.K AVEH(1984).Information tradeoffs in using the sample autocorrelation function in ARMA parameter estimation.IEEE Trans.Acoustics,Speech,Signal Processing,vol.ASSP-32,no4, pp.701-715.A.K.C AGLAYAN(1980).Necessary and sufficient conditions for detectability of jumps in linear systems. IEEE Trans.Automatic Control,vol.AC-25,no4,pp.833-834.A.K.C AGLAYAN and R.E.L ANCRAFT(1983).Reinitialization issues in fault tolerant systems.Proc.Amer-ican Control Conf.,pp.952-955.A.K.C AGLAYAN,S.M.A LLEN and K.W EHMULLER(1988).Evaluation of a second generation reconfigu-ration strategy for aircraftflight control systems subjected to actuator failure/surface damage.Proc.National Aerospace and Electronic Conference,Dayton,OH.P.E.C AINES(1988).Linear Stochastic Systems.Series in Probability and Mathematical Statistics,Wiley, New York.M.J.C HEN and J.P.N ORTON(1987).Estimation techniques for tracking rapid parameter changes.Intern. Jal Control,vol.45,no4,pp.1387-1398.W.K.C HIU(1974).The economic design of cusum charts for controlling normal mean.Applied Statistics, vol.23,no3,pp.420-433.E.Y.C HOW(1980).A Failure Detection System Design Methodology.Ph.D.Thesis,M.I.T.,L.I.D.S.,Cam-bridge,MA.E.Y.C HOW and A.S.W ILLSKY(1984).Analytical redundancy and the design of robust failure detection systems.IEEE Trans.Automatic Control,vol.AC-29,no3,pp.689-691.Y.S.C HOW,H.R OBBINS and D.S IEGMUND(1971).Great Expectations:The Theory of Optimal Stop-ping.Houghton-Mifflin,Boston.R.N.C LARK,D.C.F OSTH and V.M.W ALTON(1975).Detection of instrument malfunctions in control systems.IEEE Trans.Aerospace Electronic Systems,vol.AES-11,pp.465-473.A.C OHEN(1987).Biomedical Signal Processing-vol.1:Time and Frequency Domain Analysis;vol.2: Compression and Automatic Recognition.CRC Press,Boca Raton,FL.J.C ORGE and F.P UECH(1986).Analyse du rythme cardiaque foetal par des m´e thodes de d´e tection de ruptures.Proc.7th INRIA Int.Conf.Analysis and optimization of Systems.Antibes,FR(in French).D.R.C OX and D.V.H INKLEY(1986).Theoretical Statistics.Chapman and Hall,New York.D.R.C OX and H.D.M ILLER(1965).The Theory of Stochastic Processes.Wiley,New York.S.V.C ROWDER(1987).A simple method for studying run-length distributions of exponentially weighted moving average charts.Technometrics,vol.29,no4,pp.401-407.H.C S¨ORG¨O and L.H ORV´ATH(1988).Nonparametric methods for change point problems.In Handbook of Statistics(P.R.Krishnaiah,C.R.Rao,eds.),vol.7,Elsevier,New York,pp.403-425.R.B.D AVIES(1973).Asymptotic inference in stationary gaussian time series.Advances Applied Probability, vol.5,no3,pp.469-497.J.C.D ECKERT,M.N.D ESAI,J.J.D EYST and A.S.W ILLSKY(1977).F-8DFBW sensor failure identification using analytical redundancy.IEEE Trans.Automatic Control,vol.AC-22,no5,pp.795-803.M.H.D E G ROOT(1970).Optimal Statistical Decisions.Series in Probability and Statistics,McGraw-Hill, New York.J.D ESHAYES and D.P ICARD(1979).Tests de ruptures dans un mod`e pte-Rendus de l’Acad´e mie des Sciences,vol.288,Ser.A,pp.563-566(in French).B IBLIOGRAPHY429 J.D ESHAYES and D.P ICARD(1983).Ruptures de Mod`e les en Statistique.Th`e ses d’Etat,Universit´e deParis-Sud,Orsay,France(in French).J.D ESHAYES and D.P ICARD(1986).Off-line statistical analysis of change-point models using non para-metric and likelihood methods.In Detection of Abrupt Changes in Signals and Dynamical Systems(M. Basseville,A.Benveniste,eds.).Lecture Notes in Control and Information Sciences,LNCIS77,Springer, New York,pp.103-168.B.D EVAUCHELLE-G ACH(1991).Diagnostic M´e canique des Fatigues sur les Structures Soumises`a des Vibrations en Ambiance de Travail.Th`e se de l’Universit´e Paris IX Dauphine(in French).B.D EVAUCHELLE-G ACH,M.B ASSEVILLE and A.B ENVENISTE(1991).Diagnosing mechanical changes in vibrating systems.Proc.SAFEPROCESS’91,Baden-Baden,FRG,pp.85-89.R.D I F RANCESCO(1990).Real-time speech segmentation using pitch and convexity jump models:applica-tion to variable rate speech coding.IEEE Trans.Acoustics,Speech,Signal Processing,vol.ASSP-38,no5, pp.741-748.X.D ING and P.M.F RANK(1990).Fault detection via factorization approach.Systems and Control Letters, vol.14,pp.431-436.J.L.D OOB(1953).Stochastic Processes.Wiley,New York.V.D RAGALIN(1988).Asymptotic solutions in detecting a change in distribution under an unknown param-eter.Statistical Problems of Control,Issue83,Vilnius,pp.45-52.B.D UBUISSON(1990).Diagnostic et Reconnaissance des Formes.Trait´e des Nouvelles Technologies,S´e rie Diagnostic et Maintenance,Herm`e s,Paris(in French).A.J.D UNCAN(1986).Quality Control and Industrial Statistics,5th edition.Richard D.Irwin,Inc.,Home-wood,IL.J.D URBIN(1971).Boundary-crossing probabilities for the Brownian motion and Poisson processes and techniques for computing the power of the Kolmogorov-Smirnov test.Jal Applied Probability,vol.8,pp.431-453.J.D URBIN(1985).Thefirst passage density of the crossing of a continuous Gaussian process to a general boundary.Jal Applied Probability,vol.22,no1,pp.99-122.A.E MAMI-N AEINI,M.M.A KHTER and S.M.R OCK(1988).Effect of model uncertainty on failure detec-tion:the threshold selector.IEEE Trans.Automatic Control,vol.AC-33,no12,pp.1106-1115.J.D.E SARY,F.P ROSCHAN and D.W.W ALKUP(1967).Association of random variables with applications. Annals Mathematical Statistics,vol.38,pp.1466-1474.W.D.E WAN and K.W.K EMP(1960).Sampling inspection of continuous processes with no autocorrelation between successive results.Biometrika,vol.47,pp.263-280.G.F AVIER and A.S MOLDERS(1984).Adaptive smoother-predictors for tracking maneuvering targets.Proc. 23rd Conf.Decision and Control,Las Vegas,NV,pp.831-836.W.F ELLER(1966).An Introduction to Probability Theory and Its Applications,vol.2.Series in Probability and Mathematical Statistics,Wiley,New York.R.A.F ISHER(1925).Theory of statistical estimation.Proc.Cambridge Philosophical Society,vol.22, pp.700-725.M.F ISHMAN(1988).Optimization of the algorithm for the detection of a disorder,based on the statistic of exponential smoothing.In Statistical Problems of Control,Issue83,Vilnius,pp.146-151.R.F LETCHER(1980).Practical Methods of Optimization,2volumes.Wiley,New York.P.M.F RANK(1990).Fault diagnosis in dynamic systems using analytical and knowledge based redundancy -A survey and new results.Automatica,vol.26,pp.459-474.430B IBLIOGRAPHY P.M.F RANK(1991).Enhancement of robustness in observer-based fault detection.Proc.SAFEPRO-CESS’91,Baden-Baden,FRG,pp.275-287.P.M.F RANK and J.W¨UNNENBERG(1989).Robust fault diagnosis using unknown input observer schemes. In Fault Diagnosis in Dynamic Systems-Theory and Application(R.Patton,P.Frank,R.Clark,eds.). International Series in Systems and Control Engineering,Prentice Hall International,London,UK,pp.47-98.K.F UKUNAGA(1990).Introduction to Statistical Pattern Recognition,2d ed.Academic Press,New York. S.I.G ASS(1958).Linear Programming:Methods and Applications.McGraw Hill,New York.W.G E and C.Z.F ANG(1989).Extended robust observation approach for failure isolation.Int.Jal Control, vol.49,no5,pp.1537-1553.W.G ERSCH(1986).Two applications of parametric time series modeling methods.In Mechanical Signature Analysis-Theory and Applications(S.Braun,ed.),chap.10.Academic Press,London.J.J.G ERTLER(1988).Survey of model-based failure detection and isolation in complex plants.IEEE Control Systems Magazine,vol.8,no6,pp.3-11.J.J.G ERTLER(1991).Analytical redundancy methods in fault detection and isolation.Proc.SAFEPRO-CESS’91,Baden-Baden,FRG,pp.9-22.B.K.G HOSH(1970).Sequential Tests of Statistical Hypotheses.Addison-Wesley,Cambridge,MA.I.N.G IBRA(1975).Recent developments in control charts techniques.Jal Quality Technology,vol.7, pp.183-192.J.P.G ILMORE and R.A.M C K ERN(1972).A redundant strapdown inertial reference unit(SIRU).Jal Space-craft,vol.9,pp.39-47.M.A.G IRSHICK and H.R UBIN(1952).A Bayes approach to a quality control model.Annals Mathematical Statistics,vol.23,pp.114-125.A.L.G OEL and S.M.W U(1971).Determination of the ARL and a contour nomogram for CUSUM charts to control normal mean.Technometrics,vol.13,no2,pp.221-230.P.L.G OLDSMITH and H.W HITFIELD(1961).Average run lengths in cumulative chart quality control schemes.Technometrics,vol.3,pp.11-20.G.C.G OODWIN and K.S.S IN(1984).Adaptive Filtering,Prediction and rmation and System Sciences Series,Prentice Hall,Englewood Cliffs,NJ.R.M.G RAY and L.D.D AVISSON(1986).Random Processes:a Mathematical Approach for Engineers. Information and System Sciences Series,Prentice Hall,Englewood Cliffs,NJ.C.G UEGUEN and L.L.S CHARF(1980).Exact maximum likelihood identification for ARMA models:a signal processing perspective.Proc.1st EUSIPCO,Lausanne.D.E.G USTAFSON, A.S.W ILLSKY,J.Y.W ANG,M.C.L ANCASTER and J.H.T RIEBWASSER(1978). ECG/VCG rhythm diagnosis using statistical signal analysis.Part I:Identification of persistent rhythms. Part II:Identification of transient rhythms.IEEE Trans.Biomedical Engineering,vol.BME-25,pp.344-353 and353-361.F.G USTAFSSON(1991).Optimal segmentation of linear regression parameters.Proc.IFAC/IFORS Symp. Identification and System Parameter Estimation,Budapest,pp.225-229.T.H¨AGGLUND(1983).New Estimation Techniques for Adaptive Control.Ph.D.Thesis,Lund Institute of Technology,Lund,Sweden.T.H¨AGGLUND(1984).Adaptive control of systems subject to large parameter changes.Proc.IFAC9th World Congress,Budapest.B IBLIOGRAPHY431 P.H ALL and C.C.H EYDE(1980).Martingale Limit Theory and its Application.Probability and Mathemat-ical Statistics,a Series of Monographs and Textbooks,Academic Press,New York.W.J.H ALL,R.A.W IJSMAN and J.K.G HOSH(1965).The relationship between sufficiency and invariance with applications in sequential analysis.Ann.Math.Statist.,vol.36,pp.576-614.E.J.H ANNAN and M.D EISTLER(1988).The Statistical Theory of Linear Systems.Series in Probability and Mathematical Statistics,Wiley,New York.J.D.H EALY(1987).A note on multivariate CuSum procedures.Technometrics,vol.29,pp.402-412.D.M.H IMMELBLAU(1970).Process Analysis by Statistical Methods.Wiley,New York.D.M.H IMMELBLAU(1978).Fault Detection and Diagnosis in Chemical and Petrochemical Processes. Chemical Engineering Monographs,vol.8,Elsevier,Amsterdam.W.G.S.H INES(1976a).A simple monitor of a system with sudden parameter changes.IEEE r-mation Theory,vol.IT-22,no2,pp.210-216.W.G.S.H INES(1976b).Improving a simple monitor of a system with sudden parameter changes.IEEE rmation Theory,vol.IT-22,no4,pp.496-499.D.V.H INKLEY(1969).Inference about the intersection in two-phase regression.Biometrika,vol.56,no3, pp.495-504.D.V.H INKLEY(1970).Inference about the change point in a sequence of random variables.Biometrika, vol.57,no1,pp.1-17.D.V.H INKLEY(1971).Inference about the change point from cumulative sum-tests.Biometrika,vol.58, no3,pp.509-523.D.V.H INKLEY(1971).Inference in two-phase regression.Jal American Statistical Association,vol.66, no336,pp.736-743.J.R.H UDDLE(1983).Inertial navigation system error-model considerations in Kalmanfiltering applica-tions.In Control and Dynamic Systems(C.T.Leondes,ed.),Academic Press,New York,pp.293-339.J.S.H UNTER(1986).The exponentially weighted moving average.Jal Quality Technology,vol.18,pp.203-210.I.A.I BRAGIMOV and R.Z.K HASMINSKII(1981).Statistical Estimation-Asymptotic Theory.Applications of Mathematics Series,vol.16.Springer,New York.R.I SERMANN(1984).Process fault detection based on modeling and estimation methods-A survey.Auto-matica,vol.20,pp.387-404.N.I SHII,A.I WATA and N.S UZUMURA(1979).Segmentation of nonstationary time series.Int.Jal Systems Sciences,vol.10,pp.883-894.J.E.J ACKSON and R.A.B RADLEY(1961).Sequential and tests.Annals Mathematical Statistics, vol.32,pp.1063-1077.B.J AMES,K.L.J AMES and D.S IEGMUND(1988).Conditional boundary crossing probabilities with appli-cations to change-point problems.Annals Probability,vol.16,pp.825-839.M.K.J EERAGE(1990).Reliability analysis of fault-tolerant IMU architectures with redundant inertial sen-sors.IEEE Trans.Aerospace and Electronic Systems,vol.AES-5,no.7,pp.23-27.N.L.J OHNSON(1961).A simple theoretical approach to cumulative sum control charts.Jal American Sta-tistical Association,vol.56,pp.835-840.N.L.J OHNSON and F.C.L EONE(1962).Cumulative sum control charts:mathematical principles applied to their construction and use.Parts I,II,III.Industrial Quality Control,vol.18,pp.15-21;vol.19,pp.29-36; vol.20,pp.22-28.432B IBLIOGRAPHY R.A.J OHNSON and M.B AGSHAW(1974).The effect of serial correlation on the performance of CUSUM tests-Part I.Technometrics,vol.16,no.1,pp.103-112.H.L.J ONES(1973).Failure Detection in Linear Systems.Ph.D.Thesis,Dept.Aeronautics and Astronautics, MIT,Cambridge,MA.R.H.J ONES,D.H.C ROWELL and L.E.K APUNIAI(1970).Change detection model for serially correlated multivariate data.Biometrics,vol.26,no2,pp.269-280.M.J URGUTIS(1984).Comparison of the statistical properties of the estimates of the change times in an autoregressive process.In Statistical Problems of Control,Issue65,Vilnius,pp.234-243(in Russian).T.K AILATH(1980).Linear rmation and System Sciences Series,Prentice Hall,Englewood Cliffs,NJ.L.V.K ANTOROVICH and V.I.K RILOV(1958).Approximate Methods of Higher Analysis.Interscience,New York.S.K ARLIN and H.M.T AYLOR(1975).A First Course in Stochastic Processes,2d ed.Academic Press,New York.S.K ARLIN and H.M.T AYLOR(1981).A Second Course in Stochastic Processes.Academic Press,New York.D.K AZAKOS and P.P APANTONI-K AZAKOS(1980).Spectral distance measures between gaussian pro-cesses.IEEE Trans.Automatic Control,vol.AC-25,no5,pp.950-959.K.W.K EMP(1958).Formula for calculating the operating characteristic and average sample number of some sequential tests.Jal Royal Statistical Society,vol.B-20,no2,pp.379-386.K.W.K EMP(1961).The average run length of the cumulative sum chart when a V-mask is used.Jal Royal Statistical Society,vol.B-23,pp.149-153.K.W.K EMP(1967a).Formal expressions which can be used for the determination of operating character-istics and average sample number of a simple sequential test.Jal Royal Statistical Society,vol.B-29,no2, pp.248-262.K.W.K EMP(1967b).A simple procedure for determining upper and lower limits for the average sample run length of a cumulative sum scheme.Jal Royal Statistical Society,vol.B-29,no2,pp.263-265.D.P.K ENNEDY(1976).Some martingales related to cumulative sum tests and single server queues.Stochas-tic Processes and Appl.,vol.4,pp.261-269.T.H.K ERR(1980).Statistical analysis of two-ellipsoid overlap test for real time failure detection.IEEE Trans.Automatic Control,vol.AC-25,no4,pp.762-772.T.H.K ERR(1982).False alarm and correct detection probabilities over a time interval for restricted classes of failure detection algorithms.IEEE rmation Theory,vol.IT-24,pp.619-631.T.H.K ERR(1987).Decentralizedfiltering and redundancy management for multisensor navigation.IEEE Trans.Aerospace and Electronic systems,vol.AES-23,pp.83-119.Minor corrections on p.412and p.599 (May and July issues,respectively).R.A.K HAN(1978).Wald’s approximations to the average run length in cusum procedures.Jal Statistical Planning and Inference,vol.2,no1,pp.63-77.R.A.K HAN(1979).Somefirst passage problems related to cusum procedures.Stochastic Processes and Applications,vol.9,no2,pp.207-215.R.A.K HAN(1981).A note on Page’s two-sided cumulative sum procedures.Biometrika,vol.68,no3, pp.717-719.B IBLIOGRAPHY433 V.K IREICHIKOV,V.M ANGUSHEV and I.N IKIFOROV(1990).Investigation and application of CUSUM algorithms to monitoring of sensors.In Statistical Problems of Control,Issue89,Vilnius,pp.124-130(in Russian).G.K ITAGAWA and W.G ERSCH(1985).A smoothness prior time-varying AR coefficient modeling of non-stationary covariance time series.IEEE Trans.Automatic Control,vol.AC-30,no1,pp.48-56.N.K LIGIENE(1980).Probabilities of deviations of the change point estimate in statistical models.In Sta-tistical Problems of Control,Issue83,Vilnius,pp.80-86(in Russian).N.K LIGIENE and L.T ELKSNYS(1983).Methods of detecting instants of change of random process prop-erties.Automation and Remote Control,vol.44,no10,Part II,pp.1241-1283.J.K ORN,S.W.G ULLY and A.S.W ILLSKY(1982).Application of the generalized likelihood ratio algorithm to maneuver detection and estimation.Proc.American Control Conf.,Arlington,V A,pp.792-798.P.R.K RISHNAIAH and B.Q.M IAO(1988).Review about estimation of change points.In Handbook of Statistics(P.R.Krishnaiah,C.R.Rao,eds.),vol.7,Elsevier,New York,pp.375-402.P.K UDVA,N.V ISWANADHAM and A.R AMAKRISHNAN(1980).Observers for linear systems with unknown inputs.IEEE Trans.Automatic Control,vol.AC-25,no1,pp.113-115.S.K ULLBACK(1959).Information Theory and Statistics.Wiley,New York(also Dover,New York,1968). K.K UMAMARU,S.S AGARA and T.S¨ODERSTR¨OM(1989).Some statistical methods for fault diagnosis for dynamical systems.In Fault Diagnosis in Dynamic Systems-Theory and Application(R.Patton,P.Frank,R. Clark,eds.).International Series in Systems and Control Engineering,Prentice Hall International,London, UK,pp.439-476.A.K USHNIR,I.N IKIFOROV and I.S AVIN(1983).Statistical adaptive algorithms for automatic detection of seismic signals-Part I:One-dimensional case.In Earthquake Prediction and the Study of the Earth Structure,Naouka,Moscow(Computational Seismology,vol.15),pp.154-159(in Russian).L.L ADELLI(1990).Diffusion approximation for a pseudo-likelihood test process with application to de-tection of change in stochastic system.Stochastics and Stochastics Reports,vol.32,pp.1-25.T.L.L A¨I(1974).Control charts based on weighted sums.Annals Statistics,vol.2,no1,pp.134-147.T.L.L A¨I(1981).Asymptotic optimality of invariant sequential probability ratio tests.Annals Statistics, vol.9,no2,pp.318-333.D.G.L AINIOTIS(1971).Joint detection,estimation,and system identifirmation and Control, vol.19,pp.75-92.M.R.L EADBETTER,G.L INDGREN and H.R OOTZEN(1983).Extremes and Related Properties of Random Sequences and Processes.Series in Statistics,Springer,New York.L.L E C AM(1960).Locally asymptotically normal families of distributions.Univ.California Publications in Statistics,vol.3,pp.37-98.L.L E C AM(1986).Asymptotic Methods in Statistical Decision Theory.Series in Statistics,Springer,New York.E.L.L EHMANN(1986).Testing Statistical Hypotheses,2d ed.Wiley,New York.J.P.L EHOCZKY(1977).Formulas for stopped diffusion processes with stopping times based on the maxi-mum.Annals Probability,vol.5,no4,pp.601-607.H.R.L ERCHE(1980).Boundary Crossing of Brownian Motion.Lecture Notes in Statistics,vol.40,Springer, New York.L.L JUNG(1987).System Identification-Theory for the rmation and System Sciences Series, Prentice Hall,Englewood Cliffs,NJ.。

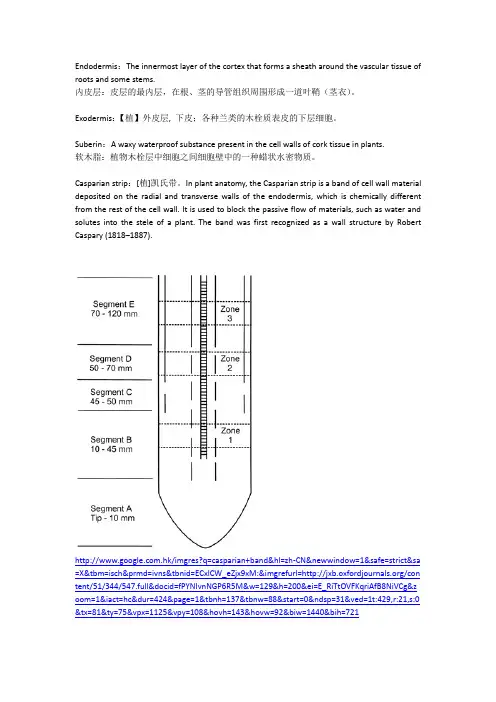
Endodermis:The innermost layer of the cortex that forms a sheath around the vascular tissue of roots and some stems.内皮层:皮层的最内层,在根、茎的导管组织周围形成一道叶鞘(茎衣)。
Exodermis:【植】外皮层, 下皮;各种兰类的木栓质表皮的下层细胞。
Suberin:A waxy waterproof substance present in the cell walls of cork tissue in plants.软木脂:植物木栓层中细胞之间细胞壁中的一种蜡状水密物质。
Casparian strip:[植]凯氏带。
In plant anatomy, the Casparian strip is a band of cell wall material deposited on the radial and transverse walls of the endodermis, which is chemically different from the rest of the cell wall. It is used to block the passive flow of materials, such as water and solutes into the stele of a plant. The band was first recognized as a wall structure by Robert Caspary (1818–1887)./imgres?q=casparian+band&hl=zh-CN&newwindow=1&safe=strict&sa =X&tbm=isch&prmd=ivns&tbnid=ECxlCW_eZjx9xM:&imgrefurl=/con tent/51/344/547.full&docid=fPYNIvnNGP6R5M&w=129&h=200&ei=E_RiTtOVFKqriAfB8NiVCg&z oom=1&iact=hc&dur=424&page=1&tbnh=137&tbnw=88&start=0&ndsp=31&ved=1t:429,r:21,s:0 &tx=81&ty=75&vpx=1125&vpy=108&hovh=143&hovw=92&biw=1440&bih=721/2010/07/expert-eye-carbohydrates-and-amino-acid-products/ Endodermis and Exodermis in Roots/WileyCDA/ElsArticle/refId-a0002086.htmlRoots of terrestrial plants are designed to take up water and nutrients. At the same time, uptake of unwanted compounds, for example toxic, and infection by soil borne pathogens must be avoided. Specific unicellular tissues, the endodermis and the exodermis, allow roots to establish and maintain this selectivity. The endodermis represents an unicellular cell layer separating the central cylinder of the root from the cortex. The exodermis represents an unicellular cell layer located at the outer surface of the root directly below the root epidermis. Both tissues are characterised by specific cell wall modifications. In early developmental stages the anticlinal radial walls exhibit Casparian bands, composed of the polymers suberin and lignin. In a subsequent developmental state a suberin lamella is deposited on the inner surface of endo- and exodermal cell walls. These apoplastic barriers, mainly composed of suberin, significantly affect radial uptake of water and dissolved nutrients and radial loss of oxygen.Key Concepts:∙Casparian bands, composed of lignin and suberin, form characteristic cell wall modifications in radial walls of endodermal and exodermal cells.∙Suberin lamellae are deposited onto the inner surface of endodermal and exodermal cell walls.∙Apoplastic barriers in roots are established by the deposition of suberin into and onto the cell wall.∙Suberised apoplastic barriers in roots help to establish root selectivity in nutrient uptake.∙The endodermis, forming an ‘inner’ apoplastic barrier in the root, is important in preventing nutrients actively concentrated in the xylem from passively diffusing back to the soil.∙The exo dermis, forming an ‘outer’ apoplastic barrier at the root surface, mainly establishes the root/soil interface between the root and the soil environment surrounding the root.∙As an adaptation to various environmental stress factors (e.g. drought, salt, heavy metal stress, oxygen deficiency, etc.) suberisation of apoplastic barriers is significantly modified.Fatty acid elongases and cytochrome P450 hydroxylases represent important key enzymes in suberin biosynthesis.Keywords: apoplastic barrier; Casparian band; endodermis; exodermis; hypodermis; nutrient uptake; plant root; suberin; transport。
励磁器excitor 电压voltage 电流current升压变压器step-up transformer 母线bus 变压器transformer空载损耗:no-load loss 铁损:iron loss 铜损:copper loss空载电流:no-load current 无功损耗:reactive loss 有功损耗:active loss 输电系统power transmission system高压侧high side 输电线transmission line高压: high voltage 低压:low voltage 中压:middle voltage功角稳定angle stability 稳定stability 电压稳定voltage stability暂态稳定transient stability 电厂power plant 能量输送power transfer交流AC 直流DC 电网power system落点drop point 开关站switch station 调节regulation高抗high voltage shunt reactor 并列的:apposable 裕度margin故障fault 三相故障three phase fault 分接头:tap切机generator triping 高顶值high limited value 静态static (state)动态dynamic (state) 机端电压控制***R 电抗reactance电阻resistance 功角power angle 有功(功率)active power电容器:Capacitor 电抗器:Reactor 断路器:Breaker电动机:motor 功率因数:power-factor 定子:stator阻抗电压:阻抗:impedance 功角:power-angle 电压等级:voltage grade有功负载: active load/PLoad 无功负载:reactive load 档位:tap position电阻:resistor 电抗:reactance 电导:conductance电纳:susceptance 上限:upper limit 下限:lower limit正序阻抗:positive sequence impedance 负序阻抗:negative sequence impedance零序阻抗:zero sequence impedance无功(功率)reactive power 功率因数power factor 无功电流reactive current斜率slope 额定rating 变比ratio参考值reference value 电压互感器PT 分接头tap仿真分析simulation analysis 下降率droop rate 传递函数transfer function框图block diagram 受端receive-side 同步synchronization保护断路器circuit breaker 摇摆swing 阻尼damping无刷直流电机:Brusless DC motor 刀闸(隔离开关):Isolator 机端generator terminal变电站transformer substation永磁同步电机:Permanent-magnet Synchronism Motor异步电机:Asynchronous Motor三绕组变压器:three-column transformer ThrClnTrans双绕组变压器:double-column transformer DblClmnTrans固定串联电容补偿fixed series capacitor compensation双回同杆并架double-circuit lines on the same tower单机无穷大系统one machine - infinity bus system励磁电流:magnetizing current 补偿度degree of compensation Electromagnetic fields 电磁场失去同步loss of synchronization装机容量installed capacity 无功补偿reactive power compensation故障切除时间fault clearing time 极限切除时间critical clearing time强行励磁reinforced excitation 并联电容器:shunt capacitor< 下降特性droop characteristics 线路补偿器LDC(line drop compensation) 电机学Electrical Machinery 自动控制理论Automatic Control Theory电磁场Electromagnetic Field微机原理Principle of Microcomputer电工学Electrotechnics Principle of circuits 电路原理Electrical Machinery 电机学电力系统稳态分析Steady-State Analysis of Power System电力系统暂态分析Transient-State Analysis of Power System电力系统继电保护原理Principle of Electrical System's Relay Protection 电力系统元件保护原理Protection Principle of Power System 's Element 电力系统内部过电压Past V oltage within Power system模拟电子技术基础Basis of Analogue Electronic Technique数字电子技术Digital Electrical Technique电路原理实验Lab. of principle of circuits电气工程讲座Lectures on electrical power production电力电子基础Basic fundamentals of power electronics高电压工程High voltage engineering电子专题实践Topics on experimental project of electronics电气工程概论Introduction to electrical engineering电子电机集成系统electronic machine system电力传动与控制Electrical Drive and Control火电厂英语专业词汇acid cleaning 酸洗interstage leakage 级间漏汽coal bunker 原煤斗intervetion/disturbing/bump 扰动excess air 过量空气inverter 转换开关induced draft fan 引风机isolate 相互隔离steam drum 汽包item 物品、元件sub-distribution transformer 低压厂用变journal bearing 支持轴承6kv station board 6KV公用配电屏kilo-volt 千伏6kv unit board 6KV配电屏low pressure cylinder/casing(LP) 低压缸A: ampere 安培large scale integrate circuit 大规模集成电路actuator 执行机构LED 发光二极管adapter 转接器、接头、light/ignite 点火air circuit breaker 空气断路器linear variable differential transformer (LVDT) 线性差动变压器air dry 分析基linearization 线性化air preheater 空气预热器liquid 液态air-insulated 空气绝缘的live steam 主蒸汽algorithms 算法load tap-changing 有载调压的alignment 平直度log 记录、日志alteration 改造longitudinal 纵向的alternating current 交流电lug 吊耳ammonia 氨major pant item 主要辅机amplitude 幅度making current 关合电流analogue 模拟量malfunction 误动作Analogue to Digital conversion 模数转换mechanism 操作机构annex 附属部分medium 媒介、介质annular 环状的membrane panel/wall 膜式壁annunciator 报警器microgovernor 微型调速器anthracite 无烟煤mill 铁素体apex 顶点millivolt 毫伏archive buffer 文件缓冲器Mimic 模拟图armature 电枢MMC: motor control center 电动机控制中心as received 应用基Modulation 调节、调制ash 灰分modulation-demodulation 调制解调ASM 模拟子模块moisture 水分Attemperator 减温器monitor mode 监控方式Automatic Boiler Controls 锅炉自动控制monitor/monitor unit 监控器automatic control system 自动控制系统monitoring 监测autonomous 独立存在的monoxide 一氧化碳auxiliary 辅助的motor starter 电动机启动装置axial 轴向的motor-operated 电动操纵的back-up 备用moving blades/ blading 动叶片bar 条形multifork root 叉型叶根bargraph 条形图Multi Function Process(MFP) 多功能处理器batch 成组的、成批的MV A: mega volt-ampere 兆伏安baud rate 波特率natural gas 天然气bay 隔间natural/thermal circulation 自然循环bearing house 轴承座network 电网bearing pad 轴瓦neutral point 中性点binary 二进制的nitrogen 氮binary cell 二进制单元node 节点binary counter 二进制计数器notch V形凹槽bit 比特、位ohm 欧姆bituminous 烟煤oil 石油blank 毛胚oiled-cable 油浸式电缆blow 熔断open loop 开环blow/purge 吹扫open-cycle 开环blowdown pipe 排污管operation 运行/操作boil 沸腾operation condition 运行工况boiler/steam generator 锅炉optimum control 最优控制Boil out 煮炉order polynomial 多项式breaking current 开断电流orientation 定位brown coal/lignite 褐煤outage 停运bubble 汽泡outdoor 户外的burner 燃烧器outer casing 外缸bus interface module(BIM) 总线接口模块overhaul 大修busbar/bus 母线overhead 架空的cable 电缆overhead transmission line 架空输电线calibration 检验overview 全貌、总的看法capacitance 电容oxidized condition/atmosphere 氧化气氛capacitive current 电容电流oxygen 氧capacitor 电容器palm terminal 星型capacity 容量panel 配电盘、屏、板carbon 碳parallel interface 并行接口cast resin transformer 树脂浇注变压器pedestal 轴承座casting 锻造pedestal 轴承座centerline 中心线peer 同类的central control room (CCR) 集控室permanent 长久的channel 通道、信道permanent magnet 永久磁铁character 符号字符permeability 磁导率charger 充电器PF burner/pulverized fuel burner 煤粉燃烧器chronological 按时间顺序的phase change 相变circuit breaker 断路器photo-electric 光电circular 圆形的pick-ups 采样器circumferential 周围的pilot exciter 副励磁机clearance 间隙pipe 管道closed loop 闭环plane 平面coal 煤plant-loop 厂环coal feeder 给煤机pneumatic pilot valve 启动控制阀coil 线圈power plant 电厂cold junction compensation 冷端补偿power station (水)电站collar 轴环power supplies 电源Commission 试运行pressure 压力commissioning operation 试运行pressure firing 正压燃烧common service system 公用系统pressure meter 压力表compatibility 兼容性、相容性probe 探针compatible 能共存的、兼容的Process Control Unit (PCU) 过程处理单元complete functional set 全功能组件programmable logic controller(PLC) 可编程逻辑控制器concentricity 中心度、同心度programmable read only memory(PROM) 可编程只读存储器condensate 凝结prolong outage 长期停机conductance 导纳protection and trip 保护和跳闸conductibility 电导率provision 备用conductor 导体proximate analysis 工业分析cone 锥体PT: potential /voltage transformer 电压互感器configure 组态pulverizer/mill 磨煤机conical 圆锥形的push button 按钮connected in star 星型连接push contact 按钮触点consumption 消耗pushbutton 按钮control accuracy 控制精度pyramid 锥体control action 控制作用quality 质量control and instrumentation(C&I) 控制仪表系统quench 灭弧control button(knob) 控制按钮radial 半径的、辐射状的control console(desk) 控制台Rotor 转子controller 控制器reactance 电抗convection pass 对流烟道reaction turbine 反动式汽轮机converter 变送器rear end 后端、末端cooling fin 散热片rectify 整流coordination control system(CCS) 协调控制系统reducing condition/atmosphere 还原气氛core 铁芯redundancy 冗余的coupling 联轴器redundancy bit 冗余位crack/cracking 裂纹redundancy testing 冗余测试creep 蠕变reheater 再热器critical pressure 临界压力reliability 可靠性CT :current transformer 电流互感器reserve 备用cubical 机柜resistance 电阻cylinder 汽缸resolution 分辨率cylindrical 圆柱形的reverse video 反相显示D.C. resistance 直流电阻roll 毛胚deaerator(D.A)除氧器roof tube 顶棚管decimal 十进制的root 叶根demineralized water 除盐水rotor 转子density 密度RTD 热电阻diaphragm 隔板stator 定子dielectric 不导电的、绝缘的saturated water 饱和水digit display 数字显示scheme: system 系统digit signal 数字信号screw 螺钉dimension 尺寸search coil 控制线圈diode 二极管semiconductor 半导体directed forced-oil and forced-air cooled(ODAF) serial access 串行存取disconnecter 隔离开关serial interface 串(行接)口discrete 不连续的serpentine tube 蛇形管distribute control system(DCS) 分散控制系统shadow 跟随distribution 配电shaft 轴diverter 分压器shroud/shrouding 围带division wall 分隔墙shunt 使分流double shell structure 双层缸结构shut down 停机double-flow 双向流动side wall 侧墙dowel 销钉signal conditioning 信号调节drain pipe 疏水管silicon 硅Drain 疏水single-flow 单向流动dry 干燥基slave module 子模块dry and ash free 可燃基Slipping 滑环dry -core cable 干式电缆Solenoid 电磁dual 双重的solid 固态duct 风道sootblower 吹灰器dump 转存sophisticated 高级的、先进的duodecimal 十二进制square root 平方根duplicate 复制的、备用的stabilization 稳定性duration 持续时间start up 启动dynamic stability 动稳定start up/standby transformer 启/备变eccentricity 偏心度state-of the-art 有目前发展水平的economizer 省煤器stationary blades/ blading 静叶片ECR:economic continuous rating 额定负荷stator frame 定子机座eddy current proximity detector 电涡流式检测器steady-state 稳态EHV :extra-high voltage 超高压steam air header 蒸汽热风器electric pressure converter 电压转换器steam/water vapor 水蒸气electrical equipment/apparatus 电气设备steam-water -mixture 汽水混合物electro-hydraulic 电动液压的stop/emergency valve 截止阀emergency 紧急的stress 应力energy 能量stud/stub 管接头engineering unit 工程单位sub system 子系统error checking and recovery 错误检验和恢复subbituminous 次烟煤error detector 错误指示器subcooled water 过冷水error rate 误差率substation 变电站evaluate 求出的数量suction firing 负压燃烧evaporate 蒸发suite 一组exception report 例外报告sulfur/sulphur 硫excite 励磁sulphur hexa fluoride 六氟化硫exciter 励磁机superconductor 超导体expansion 膨胀superheater 过热器expansion tank 油枕supervise 监督管理extinction 熄灭、灭火surge 浪涌facia/fascia 仪器仪表板surge diverter 避雷器facility 设备、工具switch block 开关组fatigue 疲劳、软化switch cabinet 开关柜feed back 反馈switcher 开关feeder speed 给煤机转速信号Switchgear 开关柜finish 光洁度symmetry 对称度fir-tree root 枞树形叶根synchronization 并网fixed carbon 固定碳tap 分接头flow meter 流量计tapping winding 分接头绕组flow rate 流量temperature 温度flue 烟道tenon 榫头flue gas 烟气terminal 终端、端子forced draft fan 鼓风机terminal box 端子箱、出线盒forced/pumped circulation 强迫循环terminal device 终端设备forced-oil and forced-air cooled(OFAF) the action of a magnetic field 磁场作用forging 铣制the bottom half 下半部fossil fuel 化石燃料the control room 控制室frame 机座the dew point temperature 露点free standing 独立的the front pedestal 操作台front/rear wall 前/后墙the horizontal joint 水平接合面fuel /flue 燃料/烟道the operations panel 控制屏furnace 炉膛the top half 上半部furnace tube 水冷壁thermal efficiency 热效率fuse 熔断器thermal power plant 热电厂galvanic isolation 绝缘thermal stress analysis 热应力分析gas air header 烟气热风器thermocouple 热电偶gaseous 气态thermocouple 热电偶gauge glass 水位计thermodynamic instrumentation 热工仪表generator 发电机thrust bearing 推力轴承generator transformer 主变tip 叶顶gland segment/packing 汽封片token 令牌governing valve 铸造tolerance 公差governor 调速器transformer 变压器gravity 重力transmitter 变送器grid 电网transport 传送、运输ground coal /pulverized fuel 粉状燃料transverse 横向的harmonious 协调的trap 阻波器header 联箱trip 切除、切断、脱扣heat 热量/加热tube 管子hexadecimal 十六进制tube bundle 管排hierarchical 分层(级)的tube seat 管座high pressure cylinder/casing(HP) 高压缸tube sheet 管板horizontal 水平的tubular 管形的hydraulic power plant 水电站turbine 汽轮机hydrazine 联氨turbine supervisory instrument(TIS) 汽机监视仪表hydrogen 氢turning gear 盘车装置hydrostatic test 水压实验two-tier terminals 双列端子排igniter 点火器ultimate analysis 元素分析impeller/wheel/disk 叶轮Uniform :the same 相同的impulse turbine 冲动式汽轮机Uninterruptible power supply(UPS) 不断电电源impulse withstand voltage 冲击耐受电压unit transformer 厂用变indoor 户内的utility boiler 公用锅炉inductance 感抗V: volt 伏特inductive 感应的vacuum contactor 真空断路器inductive current 电感电流Vane 导叶industrial boiler 工业锅炉Vertical 垂直的inner casing 内缸Via 经由INNIS 网络接口子模块Vibration 振动instrument 测试仪表visual (inquiry)display terminal 直观显示终端instrument board 仪器盘visual communication 可视通讯instrument correction 仪表校正visual display unit (VDU) 直观显示元件instrument range 仪表量程visual frequency 视频instrument sensitivity 仪表灵敏度visual scanner 视像扫描器instrument terminal 端子、接线柱volatile 挥发分insulator 绝缘子volt free contact 电压自由触点integration 使完整W: watt 瓦特interconnection 相互water 水interface 接口water level 水位interlock 联锁wet-steam 湿蒸汽interlocking contact 联锁触点wind box 风箱interlocking signal 联锁信号winding 绕组interlocking switch system 联锁开关系统workhouse 模块intermediate pressure cylinder/casing(IP) 中压缸Zener diode 齐纳二极管internally 内部的zig-zag rod Z型拉筋interruption 开断acid cleaning 酸洗interstage leakage 级间漏汽coal bunker 原煤斗intervetion/disturbing/bump 扰动excess air 过量空气inverter 转换开关induced draft fan 引风机isolate 相互隔离steam drum 汽包item 物品、元件sub-distribution transformer 低压厂用变journal bearing 支持轴承6kv station board 6KV公用配电屏kilo-volt 千伏6kv unit board 6KV配电屏low pressure cylinder/casing(LP) 低压缸A: ampere 安培large scale integrate circuit 大规模集成电路actuator 执行机构LED 发光二极管adapter 转接器、接头、light/ignite 点火air circuit breaker 空气断路器linear variable differential transformer (LVDT) 线性差动变压器air dry 分析基linearization 线性化air preheater 空气预热器liquid 液态air-insulated 空气绝缘的live steam 主蒸汽algorithms 算法load tap-changing 有载调压的alignment 平直度log 记录、日志alteration 改造longitudinal 纵向的alternating current 交流电lug 吊耳ammonia 氨major pant item 主要辅机amplitude 幅度making current 关合电流analogue 模拟量malfunction 误动作Analogue to Digital conversion 模数转换mechanism 操作机构annex 附属部分medium 媒介、介质annular 环状的membrane panel/wall 膜式壁annunciator 报警器microgovernor 微型调速器anthracite 无烟煤mill 铁素体apex 顶点millivolt 毫伏archive buffer 文件缓冲器Mimic 模拟图armature 电枢MMC: motor control center 电动机控制中心as received 应用基Modulation 调节、调制ash 灰分modulation-demodulation 调制解调ASM 模拟子模块 moisture 水分Attemperator 减温器monitor mode 监控方式Automatic Boiler Controls 锅炉自动控制monitor/monitor unit 监控器automatic control system 自动控制系统monitoring 监测autonomous 独立存在的monoxide 一氧化碳auxiliary 辅助的motor starter 电动机启动装置axial 轴向的motor-operated 电动操纵的back-up 备用moving blades/ blading 动叶片bar 条形multifork root 叉型叶根bargraph 条形图Multi Function Process(MFP) 多功能处理器batch 成组的、成批的MV A: mega volt-ampere 兆伏安baud rate 波特率natural gas 天然气bay 隔间natural/thermal circulation 自然循环bearing house 轴承座network 电网bearing pad 轴瓦neutral point 中性点binary 二进制的nitrogen 氮binary cell 二进制单元node 节点binary counter 二进制计数器notch V形凹槽bit 比特、位ohm 欧姆bituminous 烟煤oil 石油blank 毛胚oiled-cable 油浸式电缆blow 熔断 open loop 开环blow/purge 吹扫open-cycle 开环blowdown pipe 排污管operation 运行/操作boil 沸腾operation condition 运行工况boiler/steam generator 锅炉optimum control 最优控制Boil out 煮炉order polynomial 多项式breaking current 开断电流orientation 定位brown coal/lignite 褐煤outage 停运bubble 汽泡outdoor 户外的burner 燃烧器outer casing 外缸bus interface module(BIM) 总线接口模块overhaul 大修busbar/bus 母线overhead 架空的cable 电缆overhead transmission line 架空输电线calibration 检验overview 全貌、总的看法capacitance 电容oxidized condition/atmosphere 氧化气氛capacitive current 电容电流oxygen 氧capacitor 电容器palm terminal 星型capacity 容量panel 配电盘、屏、板carbon 碳parallel interface 并行接口cast resin transformer 树脂浇注变压器pedestal 轴承座casting 锻造pedestal 轴承座centerline 中心线peer 同类的central control room (CCR) 集控室permanent 长久的channel 通道、信道permanent magnet 永久磁铁character 符号字符permeability 磁导率charger 充电器PF burner/pulverized fuel burner 煤粉燃烧器chronological 按时间顺序的phase change 相变circuit breaker 断路器photo-electric 光电circular 圆形的pick-ups 采样器circumferential 周围的pilot exciter 副励磁机clearance 间隙pipe 管道closed loop 闭环plane 平面coal 煤plant-loop 厂环coal feeder 给煤机pneumatic pilot valve 启动控制阀coil 线圈power plant 电厂cold junction compensation 冷端补偿power station (水)电站collar 轴环power supplies 电源Commission 试运行pressure 压力commissioning operation 试运行pressure firing 正压燃烧common service system 公用系统pressure meter 压力表compatibility 兼容性、相容性probe 探针compatible 能共存的、兼容的Process Control Unit (PCU) 过程处理单元complete functional set 全功能组件programmable logic controller(PLC) 可编程逻辑控制器concentricity 中心度、同心度programmable read only memory(PROM) 可编程只读存储器condensate 凝结prolong outage 长期停机conductance 导纳protection and trip 保护和跳闸conductibility 电导率provision 备用conductor 导体proximate analysis 工业分析cone 锥体PT: potential /voltage transformer 电压互感器configure 组态pulverizer/mill 磨煤机conical 圆锥形的push button 按钮connected in star 星型连接push contact 按钮触点consumption 消耗pushbutton 按钮control accuracy 控制精度pyramid 锥体control action 控制作用quality 质量control and instrumentation(C&I) 控制仪表系统 quench 灭弧control button(knob) 控制按钮radial 半径的、辐射状的control console(desk) 控制台Rotor 转子controller 控制器reactance 电抗convection pass 对流烟道reaction turbine 反动式汽轮机converter 变送器rear end 后端、末端cooling fin 散热片rectify 整流coordination control system(CCS) 协调控制系统reducing condition/atmosphere 还原气氛core 铁芯redundancy 冗余的coupling 联轴器redundancy bit 冗余位crack/cracking 裂纹redundancy testing 冗余测试creep 蠕变reheater 再热器critical pressure 临界压力reliability 可靠性CT :current transformer 电流互感器reserve 备用cubical 机柜resistance 电阻cylinder 汽缸resolution 分辨率cylindrical 圆柱形的reverse video 反相显示D.C. resistance 直流电阻roll 毛胚deaerator(D.A)除氧器roof tube 顶棚管decimal 十进制的root 叶根demineralized water 除盐水rotor 转子density 密度RTD 热电阻diaphragm 隔板stator 定子dielectric 不导电的、绝缘的saturated water 饱和水digit display 数字显示scheme: system 系统digit signal 数字信号screw 螺钉dimension 尺寸search coil 控制线圈diode 二极管semiconductor 半导体directed forced-oil and forced-air cooled(ODAF) serial access 串行存取disconnecter 隔离开关serial interface 串(行接)口discrete 不连续的serpentine tube 蛇形管distribute control system(DCS) 分散控制系统shadow 跟随distribution 配电shaft 轴diverter 分压器shroud/shrouding 围带division wall 分隔墙shunt 使分流double shell structure 双层缸结构shut down 停机double-flow 双向流动side wall 侧墙dowel 销钉signal conditioning 信号调节drain pipe 疏水管silicon 硅Drain 疏水single-flow 单向流动dry 干燥基slave module 子模块dry and ash free 可燃基Slipping 滑环dry -core cable 干式电缆Solenoid 电磁dual 双重的solid 固态duct 风道sootblower 吹灰器dump 转存sophisticated 高级的、先进的duodecimal 十二进制square root 平方根duplicate 复制的、备用的stabilization 稳定性duration 持续时间start up 启动dynamic stability 动稳定start up/standby transformer 启/备变eccentricity 偏心度state-of the-art 有目前发展水平的economizer 省煤器stationary blades/ blading 静叶片ECR:economic continuous rating 额定负荷stator frame 定子机座eddy current proximity detector 电涡流式检测器steady-state 稳态EHV :extra-high voltage 超高压steam air header 蒸汽热风器electric pressure converter 电压转换器steam/water vapor 水蒸气electrical equipment/apparatus 电气设备steam-water -mixture 汽水混合物electro-hydraulic 电动液压的stop/emergency valve 截止阀emergency 紧急的stress 应力energy 能量stud/stub 管接头engineering unit 工程单位sub system 子系统error checking and recovery 错误检验和恢复subbituminous 次烟煤error detector 错误指示器subcooled water 过冷水error rate 误差率substation 变电站evaluate 求出的数量suction firing 负压燃烧evaporate 蒸发suite 一组exception report 例外报告sulfur/sulphur 硫excite 励磁 sulphur hexa fluoride 六氟化硫exciter 励磁机superconductor 超导体expansion 膨胀superheater 过热器expansion tank 油枕supervise 监督管理extinction 熄灭、灭火surge 浪涌facia/fascia 仪器仪表板surge diverter 避雷器facility 设备、工具switch block 开关组fatigue 疲劳、软化switch cabinet 开关柜feed back 反馈switcher 开关feeder speed 给煤机转速信号Switchgear 开关柜finish 光洁度symmetry 对称度fir-tree root 枞树形叶根synchronization 并网fixed carbon 固定碳tap 分接头flow meter 流量计tapping winding 分接头绕组flow rate 流量temperature 温度flue 烟道tenon 榫头flue gas 烟气terminal 终端、端子forced draft fan 鼓风机terminal box 端子箱、出线盒forced/pumped circulation 强迫循环terminal device 终端设备forced-oil and forced-air cooled(OFAF) the action of a magnetic field 磁场作用forging 铣制the bottom half 下半部fossil fuel 化石燃料the control room 控制室frame 机座the dew point temperature 露点free standing 独立的the front pedestal 操作台front/rear wall 前/后墙the horizontal joint 水平接合面fuel /flue 燃料/烟道the operations panel 控制屏furnace 炉膛the top half 上半部furnace tube 水冷壁thermal efficiency 热效率fuse 熔断器thermal power plant 热电厂galvanic isolation 绝缘thermal stress analysis 热应力分析gas air header 烟气热风器thermocouple 热电偶gaseous 气态thermocouple 热电偶gauge glass 水位计thermodynamic instrumentation 热工仪表generator 发电机thrust bearing 推力轴承generator transformer 主变tip 叶顶gland segment/packing 汽封片token 令牌governing valve 铸造tolerance 公差governor 调速器transformer 变压器gravity 重力transmitter 变送器grid 电网 transport 传送、运输ground coal /pulverized fuel 粉状燃料transverse 横向的harmonious 协调的trap 阻波器header 联箱trip 切除、切断、脱扣heat 热量/加热tube 管子hexadecimal 十六进制tube bundle 管排hierarchical 分层(级)的tube seat 管座high pressure cylinder/casing(HP) 高压缸tube sheet 管板horizontal 水平的tubular 管形的hydraulic power plant 水电站turbine 汽轮机hydrazine 联氨turbine supervisory instrument(TIS) 汽机监视仪表hydrogen 氢turning gear 盘车装置hydrostatic test 水压实验two-tier terminals 双列端子排igniter 点火器ultimate analysis 元素分析impeller/wheel/disk 叶轮Uniform :the same 相同的impulse turbine 冲动式汽轮机Uninterruptible power supply(UPS) 不断电电源impulse withstand voltage 冲击耐受电压unit transformer 厂用变indoor 户内的utility boiler 公用锅炉inductance 感抗V: volt 伏特inductive 感应的vacuum contactor 真空断路器inductive current 电感电流Vane 导叶industrial boiler 工业锅炉Vertical 垂直的inner casing 内缸Via 经由INNIS 网络接口子模块Vibration 振动instrument 测试仪表visual (inquiry)display terminal 直观显示终端instrument board 仪器盘visual communication 可视通讯instrument correction 仪表校正visual display unit (VDU) 直观显示元件instrument range 仪表量程visual frequency 视频instrument sensitivity 仪表灵敏度visual scanner 视像扫描器instrument terminal 端子、接线柱volatile 挥发分insulator 绝缘子volt free contact 电压自由触点integration 使完整W: watt 瓦特interconnection 相互 water 水interface 接口water level 水位interlock 联锁wet-steam 湿蒸汽interlocking contact 联锁触点wind box 风箱interlocking signal 联锁信号winding 绕组interlocking switch system 联锁开关系统workhouse 模块intermediate pressure cylinder/casing(IP) 中压缸Zener diode 齐纳二极管internally 内部的zig-zag rod Z型拉筋interruption 开断。

矿山词汇(5)温度保护temperature protection污风polluted air污染控制设备pollution control equipment污酸contaminated acid无触点自动补偿automatic contactless compensation无缝钢管seamless steel pipe无功补偿容量reactive compensation无功电度reactive watt-hour无功功率reactive power无轨设备trackless equipment无轨设备维修trackless equipment maintenance无轨设备维修厂房trackless equipment maintenance building无轨设备维修硐室trackless equipment repair chamber无轨设备维修设施trackless equipment maintain facilities无轨维修间trackless equipment maintenance workshop无轨斜坡道trackless ramp无线电信号radio signal无线方式wireless mode无线泄漏通信系统wireless leak communication system无线泄漏通信主机wireless leak communication host无形及递延资产净值net value of invisible and deferred assets五防功能five-prevention function物料单重unit weight of material物料的混合mix物料的搅拌agitate物相分析mineragraphic analysis物相组成phase composition西回风井west upcast shaft西回风井井口坐标west return air shaft pithead coordinate西矿体west orebody西矿体初步设计联络会议纪要summary of preliminary design liaison meeting of the west orebody西偏北侧west by north吸水槽suction tank系统提示system prompt系统最大静张力maximum static tension of system细泥slime细砂fine tailings细碎tertiary crushing细碎机tertiary crusher细碎破碎机tertiary crusher细碎圆锥破碎机tertiary cone crusher细碎振动给矿机vibro-feeder of tertiary crusher细尾矿fine tailings细尾砂fine tailings下风向leeward下罗恩Lower Roan下罗恩组lower Roan Group:下盘基底岩石footwall basement rock下盘矿体footwall orebody下盘砾岩footwall conglomerate下盘片岩footwall schist下盘疏干沿脉长dewatering drift at footwall下石英岩夹层quartzite band先浮后浸工艺利润profits from leaching after floatation process现场地形资料topographic information of site area现场考察site visit现场控制箱local control box现浇钢筋混凝土箱形结构cast-in-place r.c. box structure现金流入cash inflows现有峰值负荷present peak load陷落subsidence相间分布distributed alternatively箱形结构box structure向上回采upward stoping巷道drift巷道长度drift length巷道代码drift code巷道的通风断面积ventilation sectional area of drift巷道探矿drift prospecting巷道通风断面的周边长度perimeter length of drift ventilation section 巷道通风摩擦阻力fractional resistance of drift ventilation巷道通过的风量air flow of drift巷口drift portal项目投资capital cost项目自有资本equity capital消防车fire vehicle消能池energy dissipation tank消声器silencer销售费用sales expenses销售收入sales income(revenue)小齿轮轴承润滑站pinion bearing lub. station小的结核small nodules小断面巷道small section drifts小轿车car小时来料含水量water content in filling material per hour小时来料量hourly amount of filling material小时来料量(干砂)Hourly filling material amount (dry tailings)小时提升人数hourly hoisting men小型试验bench scale test小型试验laboratory test斜井decline斜坡道ramp (与井口相连,slope不与井口相连)斜坡道电动卡车运矿ore transportation by electric-wheel truck in ramp 斜坡道硐口ramp portal斜坡道工程ramp works斜坡道开拓ramp development斜坡道口ramp exit斜巷dip switch谐波干扰harmonic interference携带式磁粉探伤机portable magetic flaw detector泄漏电缆leaky cable泄水drainage泄水沟drainage ditch泄水井drainage shaft泄水钻孔drainage boreholes卸矿ore unloading卸矿仓ore unloading bin卸矿口discharge opening卸料小车tripper新风段fresh air section新鲜风流fresh air flow新增additional新增仪表校验装置additional instrument calibration device行政技术办公区administration & technical office area行政生活用车administration and domestic vehicles型钢罐道shaped steel guide型号model型号及规格type and specification醒目标志eye-catching signs需要搅拌槽数量number of agitating tanks required需要系数demand factor需要扬程required head絮凝剂添加装置flocculent/focculant feeding unit蓄水池reservoir悬吊式suspended悬挂载荷suspended load旋流器沉砂underflow选别工业试验full-scale separation test。
CHAPTER 1INTRODUCTION1.1MATERIALS PROCESSINGChemically reactive plasma discharges are widely used to modify the surface prop-erties of materials.Plasma processing technology is vitally important to several of the largest manufacturing industries in the world.Plasma-based surface processes are indispensable for manufacturing the very large scale integrated circuits (ICs)used by the electronics industry.Such processes are also critical for the aerospace,automotive,steel,biomedical,and toxic waste management industries.Materials and surface structures can be fabricated that are not attainable by any other commer-cial method,and the surface properties of materials can be modified in unique ways.For example,0.2-m m-wide,4-m m-deep trenches can be etched into silicon films or substrates (Fig.1.1).A human hair is 50–100m m in diameter,so hundreds of these trenches would fit endwise within a human hair.Unique materials such as diamond films and amorphous silicon for solar cells have also been produced,and plasma-based hardening of surgically implanted hip joints and machine tools have extended their working lifetimes manyfold.It is instructive to look closer at integrated circuit fabrication,which is the key application that we describe in this book.As a very incomplete list of plasma pro-cesses,argon or oxygen discharges are used to sputter-deposit aluminum,tungsten,or high-temperature superconducting films;oxygen discharges can be used to grow SiO 2films on silicon;SiH 2Cl 2=NH 3and Si(OC 2H 5)4=O 2discharges are used for the plasma-enhanced chemical vapor deposition (PECVD)of Si 3N 4and SiO 2films,1Principles of Plasma Discharges and Materials Processing ,by M.A.Lieberman and A.J.Lichtenberg.ISBN 0-471-72001-1Copyright #2005John Wiley &Sons,Inc.respectively;BF 3discharges can be used to implant dopant (B)atoms into silicon;CF 4=Cl 2=O 2discharges are used to selectively remove silicon films;and oxygen dis-charges are used to remove photoresist or polymer films.These types of steps (deposit or grow,dope or modify,etch or remove)are repeated again and again in the manufacture of a modern IC.They are the equivalent,on a micrometer-size scale,of centimeter-size manufacture using metal and components,bolts and solder,and drill press and lathe.For microfabrication of an IC,one-third of the tens to hundreds of fabrication steps are typically plasma based.Figure 1.2shows a typical set of steps to create a metal film patterned with sub-micrometer features on a large area (300mm diameter)wafer substrate.In (a ),the film is deposited;in (b ),a photoresist layer is deposited over the film;in (c ),the resist is selectively exposed to light through a pattern;and in (d ),the resist is developed,removing the exposed resist regions and leaving behind a patterned resist mask.In (e ),this pattern is transferred into the film by an etch process;the mask protects the underlying film from being etched.In (f ),the remaining resist mask is removed.Of these six steps,plasma processing is generally used for film deposition (a )and etch (e ),and may also be used for resist development (d )and removal (f ).The etch process in (e )is illustrated as leading to vertical sidewalls aligned with the resist mask;that is,the mask pattern has been faithfully transferred into the metal film.This can be accomplished by an etch process that removes material in the vertical direction only.The horizontal etch rate is zero.Such anisotropic etches are easily produced by plasma processing.On the other hand,one mightimagineFIGURE 1.1.Trench etch (0.2m m wide by 4m m deep)in single-crystal silicon,showing the extraordinary capabilities of plasma processing;such trenches are used for device isolation and charge storage capacitors in integrated circuits.2INTRODUCTIONthat exposing the masked film (d )to a liquid (or vapor phase)etchant will lead to the undercut isotropic profile shown in Figure 1.3a (compare to Fig.1.2e ),which is produced by equal vertical and horizontal etch rates.Many years ago,feature spa-cings (e.g.,between trenches)were tens of micrometers,much exceeding required film thicknesses.Undercutting was then acceptable.This is no longer true with submicrometer feature spacings.The reduction in feature sizes and spacings makes anisotropic etch processes essential.In fact,strictly vertical etches are some-times not desired;one wants controlled sidewall angles.Plasma processing is the only commercial technology capable of such control.Anisotropy is a critical process parameter in IC manufacture and has been a major force in driving the development of plasma processing technology.The etch process applied to remove the film in Figure 1.2d is shown in Figure 1.2e as not removing,either the photoresist or the underlying substrate.This selectivity is another critical process parameter for IC manufacture.Whereas FIGURE 1.2.Deposition and pattern transfer in manufacturing an integrated circuit:(a )metal deposition;(b )photoresist deposition;(c )optical exposure through a pattern;(d )photoresist development;(e )anisotropic plasma etch;(f )remaining photoresist removal.1.1MATERIALS PROCESSING 3wet etches have been developed having essentially infinite selectivity,highly selec-tive plasma etch processes are not easily designed.Selectivity and anisotropy often compete in the design of a plasma etch process,with results as shown in Figure 1.3b .Compare this to the idealized result shown in Figure 1.2e .Assuming that film-to-substrate selectivity is a critical issue,one might imagine simply turning off the plasma after the film has been etched through.This requires a good endpoint detection system.Even then,variations in film thickness and etch rate across the area of the wafer imply that the etch cannot be stopped at the right moment every-where.Hence,depending on the process uniformity ,there is a need for some selectivity.These issues are considered further in Chapter 15.Here is a simple recipe for etching silicon using a plasma discharge.Start with an inert molecular gas,such as CF 4.Excite the discharge to sustain a plasma by electron–neutral dissociative ionization,e þCF 4À!2e þCF þ3þFand to create reactive species by electron–neutral dissociation,e þCF 4À!e þF þCF 3À!e þ2F þCF2FIGURE 1.3.Plasma etching in integrated circuit manufacture:(a )example of isotropic etch;(b )sidewall etching of the resist mask leads to a loss of anisotropy in film etch;(c )illustrating the role of bombarding ions in anisotropic etch;(d )illustrating the role of sidewall passivating films in anisotropic etch.4INTRODUCTIONThe etchant F atoms react with the silicon substrate,yielding the volatile etch product SiF4:Si(s)þ4F(g)À!SiF4(g)Here,s and g indicate solid and gaseous forms,respectively.Finally,the product is pumped away.It is important that CF4does not react with silicon,and that the etch product SiF4is volatile,so that it can be removed.This process etches siliconisotropically.For an anisotropic etch,there must be high-energy ion(CFþ3)bombard-ment of the substrate.As illustrated in Figures1.3c and d,energetic ions leaving the discharge during the etch bombard the bottom of the trench but do not bombard the sidewalls,leading to anisotropic etching by one of two mechanisms.Either the ion bombardment increases the reaction rate at the surface(Fig.1.3c),or it exposes the surface to the etchant by removing passivatingfilms that cover the surface(Fig.1.3d).Similarly,Cl and Br atoms created by dissociation in a discharge are good etch-ants for silicon,F atoms and CF2molecules for SiO2,O atoms for photoresist,and Cl atoms for aluminum.In all cases,a volatile etch product is formed.However,F atoms do not etch aluminum,and there is no known etchant for copper,because the etch products are not volatile at reasonable substrate temperatures.We see the importance of the basic physics and chemistry topics treated in this book:(1)plasma physics(Chapters2,4–6,and18),to determine the electron and ion densities,temperatures,and ion bombardment energies andfluxes for a given dis-charge configuration;and(2)gas-phase chemistry and(3)surface physics and chem-istry(Chapters7and9),to determine the etchant densities andfluxes and the etch rates with and without ion bombardment.The data base for thesefields of science is provided by(4)atomic and molecular physics,which we discuss in Chapters3 and8.We also discuss applications of equilibrium thermodynamics(Chapter7)to plasma processing.The measurement and experimental control of plasma and chemical properties in reactive discharges is itself a vast subject.We provide brief introductions to some simple plasma diagnostic techniques throughout the text.We have motivated the study of the fundamentals of plasma processing by exam-ining isotropic and anisotropic etches for IC manufacture.These are discussed in Chapter15.Other characteristics motivate its use for deposition and surface modi-fication.For example,a central feature of the low-pressure processing discharges that we consider in this book is that the plasma itself,as well as the plasma–substrate system,is not in thermal equilibrium.This enables substrate temperatures to be relatively low,compared to those required in conventional thermal processes, while maintaining adequate deposition or etch rates.Putting it another way,plasma processing rates are greatly enhanced over thermal processing rates at the same sub-strate temperature.For example,Si3N4films can be deposited over aluminumfilms by PECVD,whereas adequate deposition rates cannot be achieved by conventional chemical vapor deposition(CVD)without melting the aluminumfilm.Chapter16 gives further details.Particulates or“dust”can be a significant component in processing discharges and can be a source of substrate-level contamination in etch and deposition1.1MATERIALS PROCESSING56INTRODUCTIONprocesses.One can also control dust formation in useful ways,for example,to produce powders of various sizes or to incorporate nanoparticles during deposition to modifyfilm properties.Dusty plasmas are described in Chapter17.The nonequilibrium nature of plasma processing has been known for many years, as illustrated by the laboratory data in Figure1.4.In time sequence,this showsfirst, the equilibrium chemical etch rate of silicon in the XeF2etchant gas;next,the tenfold increase in etch rate with the addition of argon ion bombardment of the sub-strate,simulating plasma-assisted etching;andfinally,the very low“etch rate”due to the physical sputtering of silicon by the ion bombardment alone.A more recent application is the use of plasma-immersion ion implantation(PIII)to implant ions into materials at dose rates that are tens to hundreds of times larger than those achievable with conventional(beam based)ion implantation systems.In PIII,a series of negative high-voltage pulses are applied to a substrate that is immersed directly into a discharge,thus accelerating plasma ions into the substrate.The devel-opment of PIII has opened a new implantation regime characterized by very high dose rates,even at very low energies,and by the capability to implant both large area and irregularly shaped substrates,such asflat panel displays or machine tools and dies. This is illustrated in Figure1.5.Further details are given in Chapter16.1.2PLASMAS AND SHEATHSPlasmasA plasma is a collection of free charged particles moving in random directions that is,on the average,electrically neutral(see Fig.1.6a).This book deals withweakly Array FIGURE1.4.Experimental demonstration of ion-enhanced plasma etching.(Coburn and Winters,1979.)ionized plasma discharges,which are plasmas having the following features:(1)they are driven electrically;(2)charged particle collisions with neutral gas mol-ecules are important;(3)there are boundaries at which surface losses are important;(4)ionization of neutrals sustains the plasma in the steady state;and (5)the electrons are not in thermal equilibrium with the ions.A simple discharge is shown schematically in Figure 1.6b .It consists of a voltage source that drives current through a low-pressure gas between two parallel conduct-ing plates or electrodes.The gas “breaks down”to form a plasma,usually weakly ionized,that is,the plasma density is only a small fraction of the neutral gas density.We describe some qualitative features of plasmas in this section;discharges are described in the following section.Plasmas are often called a fourth state of matter.As we know,a solid substance in thermal equilibrium generally passes into a liquid state as the temperature is increased at a fixed pressure.The liquid passes into a gas as the temperature is further increased.At a sufficiently high temperature,the molecules in the gas decompose to form a gas of atoms that move freely in random directions,except for infrequent collisions between atoms.If the temperature is furtherincreased,FIGURE 1.5.Illustrating ion implantation of an irregular object:(a )In a conventional ion beam implanter,the beam is electrically scanned and the target object is mechanically rotated and tilted to achieve uniform implantation;(b )in plasma-immersion ion implantation (PIII),the target is immersed in a plasma,and ions from the plasma are implanted with a relatively uniform spatialdistribution.VFIGURE 1.6.Schematic view of (a )a plasma and (b )a discharge.1.2PLASMAS AND SHEATHS 7then the atoms decompose into freely moving charged particles(electrons and positive ions),and the substance enters the plasma state.This state is characterized by a common charged particle density n e%n i%n particles/m3and,in equilibrium, a temperature T e¼T i¼T.The temperatures required to form plasmas from puresubstances in thermal equilibrium range from roughly4000K for easy-to-ionize elements like cesium to20,000K for hard-to-ionize elements like helium.The fractional ionization of a plasma isx iz¼n i n gþn iwhere n g is the neutral gas density.x iz is near unity for fully ionized plasmas,and x iz(1for weakly ionized plasmas.Much of the matter in the universe is in the plasma state.This is true because stars,as well as most interstellar matter,are plasmas.Although stars are plasmas in thermal equilibrium,the light and heavy charged particles in low-pressure proces-sing discharges are almost never in thermal equilibrium,either between themselves or with their surroundings.Because these discharges are electrically driven and are weakly ionized,the applied power preferentially heats the mobile electrons,while the heavy ions efficiently exchange energy by collisions with the background gas. Hence,T e)T i for these plasmas.Figure1.7identifies different kinds of plasmas on a log n versus log T e diagram. There is an enormous range of densities and temperatures for both laboratory and space plasmas.Two important types of processing discharges are indicated on the figure.Low-pressure discharges are characterized by T e%1–10V,T i(T e,and n%108–1013cm23.These discharges are used as miniature chemical factories in which feedstock gases are broken into positive ions and chemically reactive etch-ants,deposition precursors,and so on,which thenflow to and physically or chemi-cally react at the substrate surface.While energy is delivered to the substrate also, for example,in the form of bombarding ions,the energyflux is there to promote the chemistry at the substrate,and not to heat the substrate.The gas pressures for these discharges are low:p%1mTorr–1Torr.These discharges and their use for processing are the principal subject of this book.We give the quantitative frame-work for their analysis in Chapter10.High-pressure arc discharges are also used for processing.These discharges have T e%0.1–2V and n%1014–1019cm23,and the light and heavy particles are more nearly in thermal equilibrium,with T i.T e.These discharges are used mainly to deliver heat to the substrate,for example,to increase surface reaction rates, to melt,sinter,or evaporate materials,or to weld or cut refractory materials.Opera-ting pressures are typically near atmospheric pressure(760Torr).High-pressure discharges of this type are beyond the scope of this book.Figure1.8shows the densities and temperatures(or average energies)for various species in a typical rf-driven capacitively coupled low-pressure discharge;for example,for silicon etching using CF4,as described in Section1.1.We see that the feedstock gas,etchant atoms,etch product gas,and plasma ions have roughly 8INTRODUCTIONthe same temperature,which does not exceed a few times room temperature (0.026V).The etchant F and product SiF 4densities are significant fractions of the CF 4density,but the fractional ionization is very low:n i 10À5n g .The electron temperature T e is two orders of magnitude larger than the ion temperature T i .However,we note that the energy of ions bombarding the substrate can be 100–1000V,much exceeding T e .The acceleration of low-temperature ions510152025log 10 T (V)el o g 10n (c m –3)FIGURE 1.7.Space and laboratory plasmas on a log n versus log T e diagram (after Book,1987).l De is defined in Section 2.4.1.2PLASMAS AND SHEATHS 9across a thin sheath region where the plasma and substrate meet is central to all pro-cessing discharges.We describe this qualitatively below and quantitatively in later chapters.Although n i and n e may be five orders of magnitude lower that n g ,the charged particles play central roles in sustaining the discharge and in processing.Because T e )T i ,it is the electrons that dissociate the feedstock gas to create the free radicals,etchant atoms,and deposition precursors,required for the chemistry at the substrate.Electrons also ionize the gas to create the positive ions that sub-sequently bombard the substrate.As we have seen,energetic ion bombardment can increase chemical reaction rates at the surface,clear inhibitor films from the surface,and physically sputter materials from or implant ions into the surface.T e is generally less than the threshold energies E diss or E iz for dissociation and ionization of the feedstock gas molecules.Nevertheless,dissociation and ionization occur because electrons have a distribution of energies.Letting g e (E )d E be the number of electrons per unit volume with energies lying between E and E þd E ,then the distribution function g e (E )is sketched in Figure 1.9.Electrons having ener-gies below E diss or E iz cannot dissociate or ionize the gas.We see that dissociation and ionization are produced by the high-energy tail of the distribution.Although the distribution is sketched in the figure as if it were Maxwellian at the bulk electron temperature T e ,this may not be the case.The tail distribution might be depressed below or enhanced above a Maxwellian by electron heating and electron–neutral collision processes.Two temperature distributions are sometimes observed,with Te 1081010n (c m –3)T or ·Ò (V)FIGURE 1.8.Densities and energies for various species in a low-pressure capacitive rf discharge.10INTRODUCTIONfor the bulk electrons lower than T h for the energetic electron tail.Non-Maxwellian distributions can only be described using the kinetic theory of discharges,which we introduce in Chapter 18.SheathsPlasmas,which are quasi-neutral (n i %n e ),are joined to wall surfaces across thin positively charged layers called sheaths .To see why,first note that the electron thermal velocity (e T e =m )1=2is at least 100times the ion thermal velocity (e T i =M )1=2because m =M (1and T e &T i .(Here,T e and T i are given in units of volts.)Consider a plasma of width l with n e ¼n i initially confined between two grounded (F ¼0)absorbing walls (Fig.1.10a ).Because the net charge density r ¼e (n i Àn e )is zero,the electric potential F and the electric field E x is zero every-where.Hence,the fast-moving electrons are not confined and will rapidly be lost to the walls.On a very short timescale,however,some electrons near the walls are lost,leading to the situation shown in Figure 1.10b .Thin (s (l )positive ion sheaths form near each wall in which n i )n e .The net positive r within the sheaths leads to a potential profile F (x )that is positive within the plasma and falls sharply to zero near both walls.This acts as a confining potential “valley”for electrons and a “hill”for ions because the electric fields within the sheaths point from the plasma to the wall.Thus the force ÀeE x acting on electrons is directed into the plasma;this reflects electrons traveling toward the walls back into the plasma.Conversely,ions from the plasma that enter the sheaths are accel-erated into the walls.If the plasma potential (with respect to the walls)is V p ,then we expect that V p a few T e in order to confine most of the electrons.The energy of ions bombarding the walls is then E i a few T e .Charge uncovering is treated quan-titatively in Chapter 2,and sheaths in Chapter 6.Figure 1.11shows sheath formation as obtained from a particle-in-cell (PIC)plasma simulation.We use PIC results throughout this book to illustrate various dis-charge phenomena.In this simulation,the left wall is grounded,the right wall is floating (zero net current),and the positive ion density is uniform and constant in time.The electrons are modeled as N sheets having charge-to-mass ratio Àe =mFIGURE 1.9.Electron distribution function in a weakly ionized discharge.1.2PLASMAS AND SHEATHS 1112INTRODUCTION(b)FIGURE1.10.The formation of plasma sheaths:(a)initial ion and electron densities andsheath.potential;(b)densities,electricfield,and potential after formation of the Array FIGURE1.11.PIC simulation of positive ion sheath formation:(a)v x–x electron phase space,with horizontal scale in meters;(b)electron density n e;(c)electricfield E x;(d)potential F;(e)electron number N versus time t in seconds;(f)right hand potential V r versus time t.that move in one dimension (along x )under the action of the time-varying fields pro-duced by all the other sheets,the fixed ion charge density,and the charges on the walls.Electrons do not collide with other electrons,ions,or neutrals in this simu-lation.Four thousand sheets were used with T e ¼1V and n i ¼n e ¼1013m À3at time t ¼0.In (a ),(b ),(c ),and (d ),we,respectively,see the v x –x electron phase space,electron density,electric field,and potential after the sheath has formed,at t ¼0.77m s.The time history of N is shown in (e );40sheets have been lost to form the sheaths.Figures 1.11a –d show the absence of electrons near each wall over a sheath width s %6mm.Except for fluctuations due to the finite N ,the field in the bulk plasma is near zero,and the fields in the sheaths are large and point from the plasma to the walls.(E x is negative at the left wall and positive at the right wall to repel plasma electrons.)The potential in the center of the discharge is V p %2:5V and falls to zero at the left wall (this wall is grounded by definition).The potential at the right wall is also low,but we see in (f )that it oscillates in time.We will see in Chapter 4that these are plasma oscillations .We would not see them if the initial sheet positions and velocities were chosen exactly symmetrically about the midplane,or if many more sheets were used in the simulation.If the ions were also modeled as moving sheets,then on a longer timescale we would see ion acceleration within the sheaths,and a consequent drop in ion density near the walls,as sketched in Figure 1.10b .We return to this in Chapter 6.The separation of discharges into bulk plasma and sheath regions is an important paradigm that applies to all discharges.The bulk region is quasi-neutral,and both instantaneous and time-averaged fields are low.The bulk plasma dynamicsare FIGURE 1.11.(Continued ).1.2PLASMAS AND SHEATHS 1314INTRODUCTIONdescribed by diffusive ion loss at high pressures and by free-fall ion loss at low pressures.In the positive space charge sheaths,highfields exist,leading to dynamics that are described by various ion space charge sheath laws,including low-voltage sheaths and various high-voltage sheath models,such as collisionless and collisional Child laws and their modifications.The plasma and sheath dynamics must be joined at their interface.As will be seen in Chapter6,the usual joining condition is to require that the mean ion velocity at the plasma-sheath edge be equal to the ion-sound(Bohm)velocity:u B¼(e T e=M)1=2,where e and M are the charge and mass of the ion,respectively,and T e is the electron temperature in volts.1.3DISCHARGESRadio Frequency DiodesCapacitively driven radio frequency(rf)discharges—so-called rf diodes—are commonly used for materials processing.An idealized discharge in plane parallel geometry,shown in Figure1.12a,consists of a vacuum chamber containing two planar electrodes separated by a spacing l and driven by an rf power source.The sub-strates are placed on one electrode,feedstock gases are admitted toflow through the discharge,and effluent gases are removed by the vacuum pump.Coaxial discharge geometries,such as the“hexode”shown in Figure1.12b,are also in widespread use. Typical parameters are shown in Table1.1.The typical rf driving voltage is V rf¼100–1000V,and the plate separation is l¼2–10cm.When operated at low pressure,with the wafer mounted on the powered electrode,and used to remove substrate material,such reactors are commonly called reactive ion etchers (RIEs)—a misnomer,since the etching is a chemical process enhanced by energetic ion bombardment of the substrate,rather than a removal process due to reactive ions alone.For anisotropic etching,typically pressures are in the range10–100mTorr, power densities are0.1–1W/cm2,the driving frequency is13.56MHz,and mul-tiple wafer systems are common.Typical plasma densities are relatively low, 109–1011cm23,and the electron temperature is of order3V.Ion acceleration ener-gies(sheath voltages)are high,greater than200V,and fractional ionization is low. The degree of dissociation of the molecules into reactive species is seldom measured but can range widely from less than0.1percent to nearly100percent depending on gas composition and plasma conditions.For deposition and isotropic etch appli-cations,pressures tend to be higher,ion bombarding energies are lower,and fre-quencies can be lower than the commonly used standard of13.56MHz.The operation of capacitively driven discharges is reasonably well understood. As shown in Figure1.13for a symmetrically driven discharge,the mobile plasma electrons,responding to the instantaneous electricfields produced by the rf driving voltage,oscillate back and forth within the positive space charge cloud of the ions.The massive ions respond only to the time-averaged electricfields.Oscil-lation of the electron cloud creates sheath regions near each electrode that containnet positive charge when averaged over an oscillation period;that is,the positive charge exceeds the negative charge in the system,with the excess appearing within the sheaths.This excess produces a strong time-averaged electric field within each sheath directed from the plasma to the electrode.Ions flowing out of the bulk plasma near the center of the discharge can be accelerated by the sheath fields to high energies as they flow to the substrate,leading to energetic-ion enhanced processes.Typical ion-bombarding energies E i can be as high as V rf =2for symmetric systems (Fig.1.13)and as high as V rf at the powered electrode for asymmetric systems (Fig.1.12).A quantitative description of capacitive discharges is given in Chapter11.FIGURE 1.12.Capacitive rf discharges in (a )plane parallel geometry and (b )coaxial “hexode”geometry (after Lieberman and Gottscho,1994).1.3DISCHARGES 15。
文章编号:1674 − 7054(2022)05 − 0496 − 06施铁对普通野生稻田甲烷排放的影响王 晟1,2,但建国1(1. 海南大学 植物保护学院,海口 570228; 2. 海南大学 生态与环境学院,海口 570228)摘 要: 为了探究施铁对普通野生稻田甲烷的减排效果,对1个根表铁膜形成能力较强的普通野生稻居群进行了水泥池小区对比试验,观测了施铁处理和对照的CH 4排放速率、土壤孔隙水Fe 2+浓度和根表铁膜。
结果表明:施铁导致CH 4总排放量减少了29.51%,在普通野生稻生长前期CH 4减排效应尤为明显。
移栽后第19天,施铁小区的土壤孔隙水Fe 2+浓度为0.57 mmol·L −1 ,显著大于对照小区。
根生物量和单株根表铁膜数量在施铁处理和对照之间的差异随植株年龄增大而增大。
因此,施铁措施对具有厚铁膜潜力的普通野生稻居群的CH 4减排能起到明显的促进作用。
关键词: 甲烷排放;普通野生稻;根表铁膜;土壤孔隙水中图分类号: S 511.9;S 143.7 文献标志码: A引用格式: 王晟,但建国. 施铁对普通野生稻田甲烷排放的影响[J]. 热带生物学报,2022, 13(5):496−501.DOI :10.15886/ki.rdswxb.2022.05.010甲烷(CH 4)是一种重要的温室气体,对全球气候变暖的贡献约占16%,仅次于CO 2。
2020年,大气的CH 4浓度已上升至1 889 μg·L −1,是工业革命前的2.62倍[1]。
水稻田是CH 4主要排放源之一,所释放的CH 4是CH 4的产生、氧化和传输的净效应[2 − 4],其年平均排放量为30 Tg ,约占全球人为CH 4排放量的8%[5 − 6]。
稻田CH 4的排放随水稻品种而异[7 − 13],人们试图靠选育和推广高产量、低CH 4排放的水稻品种来实现稻田CH 4的长效减排[4,8,13]。
高二英语气候变迁阅读理解25题1<背景文章>Climate change is one of the most significant challenges facing our planet today. The Earth's climate has been changing for millions of years, but in recent decades, the rate of change has accelerated dramatically. Global temperatures are rising, causing a wide range of impacts. One of the most visible effects is the melting of glaciers and ice caps, which is leading to a rise in sea levels. This poses a serious threat to coastal communities and low-lying islands.The increase in temperature is also affecting weather patterns. We are seeing more extreme weather events such as hurricanes, floods, droughts, and wildfires. These events can cause significant damage to infrastructure, agriculture, and human lives.Another consequence of climate change is the disruption of ecosystems. Many species are struggling to adapt to the changing climate, and some may even face extinction. This can have a domino effect on the entire food chain.Scientists are working hard to understand the causes and consequences of climate change. They are also looking for solutions to mitigate its effects. One of the key strategies is to reduce greenhouse gasemissions. This can be achieved by increasing the use of renewable energy sources such as solar and wind power, improving energy efficiency, and reducing deforestation.In conclusion, climate change is a complex and urgent problem that requires immediate action. We all have a role to play in protecting our planet for future generations.1. What is one of the most visible effects of climate change?A. Increase in population.B. Melting of glaciers and ice caps.C. Decrease in temperature.D. Increase in deforestation.答案:B。
AV Patterns AV 型斜视AC/A 比率accommodative convergence/accommodation ratio AC/A ratioA型超声检查A-scan ultrasonographyB-型超声检查B-scan ultrasonographyBehcet 病Behcet’diseaseDNA甲基化DNA methylationDuane 眼球后退综合征Duane’retraction syndrome DRSFarnsworth D-15色调检测法Farnsworth D-15 Hue TestFarnsworth-Munsell FM)-100色调检测法Farnsworth-Munsel 100 Hue Test Fuchs 角膜内皮营养不良Fuchs’endothelial dystrophyFuchs 综合征Fuchs’syndromeGoldmann压平眼压计Goldmann applanation tonometerGullstrand 精密模型眼Gullstrand exact model eyeHertel眼球突度计Hertel exophthalmometerLeber 遗传性视神经病变Leber hereditary optic neuropathySchirmer 试验Schirmer testStevens-Johnson综合征Stevens-Johnson syndrome SSTerrien边缘变性Terrien marginal degenerationThygeson 浅层点状角膜炎superficial punctuate keratitis of ThygesonVogt-小柳原田综合征Vogt-Koyanagi syndrome VKH综合征Wagner 玻璃体视网膜变性Wagner vitreoretinal degenerationWernicke 偏盲性瞳孔强直Wernicke hemianopic papillary reactionA阿托品atropine安慰剂placebo暗点scotoma暗适应dark adaptationB白内障cataract白内障囊内摘除术intracapsular cataract extraction ICCE 白内障囊外摘除术extracapsular cataract extraction ECCE白内障手术率cataract surgical rate白内障针拔术couching of lens白瞳症leukocoria瘢痕性睑内翻cicatricial entropion瘢痕性睑外翻cicatricial ectropion瘢痕性类天疱疮cicatricial pemphigoid半乳糖性白内障galactose cataract包涵体性结膜炎inclusion conjunctivitis暴露性角膜炎exposure keratitis杯凹optic cup被动牵拉试验forced duction test鼻睫状神经nasociliary nerve鼻泪管nasolacrimal duct闭合小带zonula occludens边缘性角膜变性marginal degeneration扁平部pars plana扁平角膜applanation表层巩膜炎episcleritis表皮外胚叶surface ectoderm表型模拟pheoncopy并发性白内障complicated cataract病毒性结膜炎virus conjunctivitis病毒性眼睑皮炎virus palpebral dermatitis病理性近视pathologic myopia玻璃膜Bruch membrane玻璃膜疣drusen玻璃体vitreous body玻璃体后脱离posterior vitreous detachment PVD玻璃体积血vitreous hemorrhages玻璃体基底部vitreous base玻璃体劈裂vitreoschisis玻璃体脱出vitreous loss玻璃体纸样黄斑病变cellophane maculophthy不等像aniseikonia不规则散光irregular astigmatism部分调节性内斜视partially accommodative esotropia 彩色超声多普勒成像color Doppler imaging蚕蚀性角膜溃疡mooren ulcer常年性过敏性结膜炎perennial allergic conjunctivitis超级性细菌性结膜炎hyperacute bacterial conjunctivitis 穿通伤penetrating injury超声ulrtasoud超声生物显微镜ultrasound biomicroscopy UBM超声乳化白内障吸除术phacoemulsification垂直分离性斜视dissociated vertica deviation DVD垂直性斜视hypertropia春季角结膜炎vernal keratoconjunctivitis VKC春季结膜炎vernal conjunctivitis磁共振成像magnetic resonance imaging ,MRID大角膜megalocornea大泡性角膜病变bullous keratopathy带状光检影镜streak retinoscopes带状角膜病变band-shaped keratopathy单纯近视散光simple myopic astigmatism单纯疱疹病毒herpes simplex virus,HSV单纯疱疹病毒性角膜炎herpes simplex keratitis HSK单纯性表层巩膜炎simple episcleritis单纯远视散光simple hyperopic astigmatism单眼运动monocular rotation ,dunction倒睫trichiasis滴眼液eyedrops地图-点状-指纹状营养不良map-dot-finger print dystrophy 第二玻璃体secondary vitreous第二斜视角secondary deviation第二眼位secondary positions第三玻璃体tertiary vitreous第一斜视角primary deviation第一眼位primary position点状光检影镜spot retinoscopes电光性眼炎electric ophthalmia动脉硬化性视网膜病变arteriosclerotic retinopathy 动态视野检查kinetic perimetry动眼神经麻痹third crania nerve/oculomotor palsy 对比敏感度contrast sensitivity钝挫伤blunt trauma多焦ERG multifocal ERG多形性腺癌pleomorphic adenomasE恶性黑色素瘤malignant melanoma儿童盲children blindness恶性青光眼malignant glaucomaF发病率incidence房角后退性青光眼angle-recession glaucoma房角切开术goniotomy房角粘连goniosynechia房水aqueous humor房水引流装置植入术implantation drainage device放射状角膜切开术Radial keratotomy ,RK非编码RNA noneoding RNA非穿透性小梁手术nonpenetrating trabecular surgery非调节性内斜视nonaccommodative esotropia非共同性内斜视incomitant esodeviation非接触眼压计non-contact tonometer非正视ametropia分开divergence分析性研究analytic study负相对调节negative relative accommodation,NRA复合近视散光compound myopic astigmatism复合远视散光compound hyperopic astigmatism复视diplopiaG干眼dry eye感觉剥夺性内斜视sensory deprivation esodeviation感觉融合sensory fusion感觉性外斜视sensory exotropia高AC/A型调节性内斜视high AC/A ratio accommodative esotropia 高血压性视神经视网膜病变hypertensive neuroretinopathy高血压性视网膜病变hypertensive retinopathy HRP高眼压症ocular hypertension巩膜sclera巩膜葡萄肿sclera staphyloma巩膜炎scleritis骨性眼眶bony orbit贯通伤perforating injury光动力疗法photodynamic therapy,PDT光损伤photic damage光学相干断层扫描optical coherence tomography光晕halo规则散光regular astigmatism过敏性结膜炎allergic conjunctivitisH海绵窦血栓cavernous sinus thrombosis海绵状血管瘤cavernous hemangioma核性白内障nuclear cataract恒定性外斜视constant exotropia红色盲protanopia虹膜iris虹膜后粘连posterior synechia of the iris虹膜夹型iris-claw虹膜角膜内皮综合征iridocorneal endothelial syndrome ,ICE 虹膜囊肿iris cyst虹膜膨隆iris bombe虹膜前粘连anterior synechia of the iris虹膜缺损coloboma of the iris后弹力层膨出descementocele后房posterior chamber后发性白内障after cataract后巩膜加固术posterior sclera reinforcement,PSR 后巩膜炎posterior scleritis后囊膜混浊posterior capsular opacification后囊下白内障posterior subcapsular cataract 后葡萄膜炎posterior uveitis坏死性前巩膜炎necrotizing anterior scleritis患病率prevalence黄斑macula lutea黄斑部视网膜前膜macular epiretinal membrane 黄斑分裂macular splitting黄斑格栅样光凝grid pattern photocoagulation 黄斑回避macular sparing黄斑裂孔macular hole黄斑囊样水肿cystoid macular edema,CME黄斑中心凹fovea centralis黄色瘤xanthelasma混合散光mixed astigmatism混合型调节性内斜视mixed accommodative esotropia混淆视confusion活性氧reactive oxygen species ,ROS获得性上斜肌麻痹acquired superior oblique muscle palsy,ASOP J肌炎myositis基本型内斜视basic esotropia基底细胞癌basal cell carcinoma激光虹膜造瘘术laser sclerostomy激光虹膜切开术laser eridotomy激光扫描拓扑仪scanning laser topography急性闭角型青光眼acute angle-closure glaucoma急性共同性内斜视acute comitant esotropia急性泪囊炎acute dacryocystitis急性泪腺炎acute dacryoadenitis急性视网膜坏死综合征acute retinal necrosis syndrom ,ARN棘阿米巴角膜炎acanthamoeba keratitis集合convergence集合近点检查near point of convergence计算机体层成像computerized tomography,CT季节性过敏性结膜炎seasonal allergic conjunctivitis继发性青光眼secondary glaucoma继发性视神经萎缩secondary optic atrophy继发性外斜视consecutive exotropia家族性渗出性玻璃体视网膜病变familial exudative vitreoretinopathy,FEV甲状腺相关免疫眼眶病变thyroid related immune orbitopathy,TRIO 甲状腺相关眼病thyroid associated ophthalmopathy TAO假同色图pseudoisochromatic plate假性视盘水肿pseudo-papilledema假性视盘炎pseudo-papollitis间隙性外斜视intermittent exotropia睑板腺功能障碍Meibomian gland dynfunction,MGD睑板腺囊肿chalazion睑结膜palpebral conjunctiva睑结膜瘢痕tarsal conjunctival scarring睑裂palpebral fissure睑裂斑pinguecula睑内翻entropion睑外翻ectropion睑腺炎hordeolum睑缘palpebral margin睑缘炎blepharitis简略眼reduced eye渐变多焦点镜片progressive addition lens交叉柱镜Jackson cross cylinder,JCC交感性眼炎sympathetic ophthalmia交替遮盖法alternate cover test胶原盾collagen cornea shield椒盐状眼底salt and pepper fundus角结膜干燥症keratoconjunctivitis sicca角膜cornea角膜白斑corneal leucoma角膜斑翳corneal macula角膜变性corneal degeneration角膜云翳corneal nebula角膜穿孔corneal perforation角膜地形图检查corneal topography角膜共焦显微镜corneal confocal microscopy角膜后沉着物keratic precipitate ,KP角膜混浊corneal opacification角膜基质环植入术Intrastromal corneal ring segments,ICRS 角膜基质炎interstitial keratitis角膜胶原交联术Corneal collagen cross-linking ,CXL角膜浸润corneal infiltration角膜溃疡corneal ulcer角膜老年环cornea arcus senilis角膜鳞状细胞癌corneal squamous cell carcinoma角膜瘘corneal fistula角膜内皮镜corneal specular microscopy角膜皮样癌corneal dermoid tumor角膜葡萄肿corneal staphyloma角膜曲率计keratometer角膜屈光手术keratorefractive surgery角膜软化症keratomalacia角膜塑形镜orthokeratology ,OK角膜炎keratitis角膜营养不良corneal dystrophy角膜映光法Hischberg test角膜缘limbus角膜缘干细胞功能障碍limbal stem cell deficiency,LSCD 角膜脂质变性lipid degeneration接触镜contact lens接触性睑皮炎contact dermatitis of lids拮抗肌antagonist结节性表层巩膜炎nodular episcleritis结节性前巩膜炎nodular anterior scleritis结膜conjunctiva结膜结石conjunctival concretion结膜滤泡follicular conjunctival inflammation结膜囊conjunctival sac结膜囊肿conjunctival inclusion cyst结膜皮样瘤dermoid tumor结膜乳头状瘤conjunctival papilloma结膜色素痣conjunctival nevi结膜血管瘤conjunctival angioma结膜炎conjunctivitis睫状长神经long ciliary nerve睫状短神经short ciliary nerve睫状冠pars plicata睫状后长动脉long posterior ciliary artery睫状后短动脉short posterior ciliary artery睫状环阻塞性青光眼ciliary-bolck glaucoma睫状肌麻痹验光cycloplegic refraction睫状前动脉anterior ciliary artery睫状前静脉anterior ciliary vein睫状神经节ciliary ganglion睫状视网膜动脉阻塞cilioretinal artery occlusion 睫状体ciliary body睫状体光凝术cyclophotocoagulation睫状体冷凝术cyclocryotherapy睫状体透热术cyclodiathermy睫状突ciliary processes近点near point近视myopia近视性黄斑变性myopic macular degeneration经瞳孔温热疗法transpupillary therapy ,TTT晶状体lens晶状体板lens placode晶状体泡lens vesicle痉挛性睑内翻spastic entropion静态视野检查static perimetry巨乳头性结膜炎giant papillary conjunctivitis,GPC巨细胞动脉炎giant cell arteritis,GCA锯齿缘ora serrataK颗粒状角膜基质营养不良granular dystrophy空蝶鞍综合征empty sella syndrome孔源性视网膜脱离rhegmatogenous retinal detachment 枯草热性结膜炎hay fever conjunctivitis框架眼镜spectacles眶隔orbital septum眶隔前蜂窝织炎preseptal cellulitis 眶上裂superior orbital fissure眶深部蜂窝织炎deep orbital cellulite 眶下裂inferior orbita fissure溃疡性睑缘炎ulcerative blepharitis蓝色盲tritanopia老年性白内障senile cataract老年性睑外翻senile ectropion老视presbyopia泪道lacrimal passages泪点lacrimal puncta泪膜破裂时间breaking up time ,BUT 泪囊lacrimal sac泪器lacrimal apparatus泪腺Lacrimal gland泪腺脱垂lacrimal glands prolapsed泪腺炎dacryosdenitis泪小管lacrimal canaliculi泪液分泌过多lacrimal hypersecretion 泪液分泌过少lacrimal huposecretion 泪液分泌器secretory apparatus泪液排出器excretory apparatus泪溢epiphora棱镜度prismatic diopter立体视检查stereopsis testing立体视觉stereoscopic vision裂伤laceration裂隙灯活体显微镜slit-lamp biomecroscope临床试验clinical trial鳞屑性睑缘炎squamous blepharitis鳞状细胞癌squamous cell carcinoma流泪lacrimation流行性出血性结膜炎epidemic hemorrhagic conjunctivitis 流行性角结膜炎epidemic keratoconjunctivitis绿色盲deuteranopia乱睫aberrant lashesM麻痹性睑外翻paralytic ectropion马凡综合征Marfan syndrome马切山尼综合征Marchesani syndrome埋藏性玻璃膜疣buried drusen脉络膜choroid脉络膜恶性黑色素瘤malignant melanoma of the choroid脉络膜骨瘤choroidal osteoma脉络膜缺损coloboma of the choroid脉络膜新生血管膜choroidal neovascularization CNV脉络膜血管瘤choroidal hemangioma脉络膜转移癌metastatic carcinoma of the choroid慢性闭角型青光眼chronic angle-closure glaucoma慢性泪腺炎chronic dacryoadenitis慢性滤泡性结膜炎chronic follicular conjunctivitis慢性细菌性结膜炎chronic conjunctivitis盲法blind trial毛细血管瘤capillary hemangioma弥漫性层间角膜炎diffuse lamellar keratitis,DLK弥漫性结膜感染diffuse conjunctival inflammation弥漫性前巩膜炎diffuse anterior scleritis弥漫性眼眶炎症diffuse orbital inflammation棉绒斑cotton-wool spots免疫性结膜炎immunologic conjunctivitis描述性研究descriptive studyN内镜下泪囊鼻腔吻合术endoscopic dacryocystorhinostomy EDCR 内斜视esotropis,ET内转adduction内眦赘皮epicanthus难治性青光眼refractory glaucoma脑膜脑膨出meningoencephalocele逆规散光astigmatism against the rule年龄相关性白内障age-related cataract年龄相关性黄斑变性age-relate macular degeneration,ARMD 颞侧偏盲temporal hemianopsia脓毒性视网膜炎septic retinitisP旁中心注视eccentric fixation泡性角结膜炎phlyctenular keratoconjunctivitis胚裂embryonic fissure胚眼embryonic eye配偶肌yoke muscles皮痒脂肪瘤dermolipoma皮脂腺癌sebaceous gland carcinoma皮质盲cortical blindness皮质性白内障cortical cataract葡萄膜uvea葡萄膜炎uveitisQ牵拉性视网膜脱离tractional retinal detachment TRD牵牛花综合征morning-glory gyndrome前部缺血性视神经病变anterior ischemic optic neuropathy,AION 前房anterior chamber前房积血hyphema前房角anterior chamber angle前房角镜gonioscope前房闪辉anterior chamber flare前房细胞anterior chamber cell前巩膜炎anterior scleritis前葡萄膜炎anterior uveitis浅层点状角膜炎superficial punctuate keratitis,SPK强制性脊椎炎ankylosing spondylitis青光眼glaucoma青光眼睫状体炎综合征glacuomatocyclitic crisis青年性视网膜劈裂症juvenile retionschisis青少年型青光眼juvenile glaucoma穹窿结膜fornical conjunctiva球后视神经炎retrobulbar optic neuritis球结膜bulbar conjunctiva球结膜下出血subconjunctival hemorrhage球镜度数diopter of spherical power曲安奈德triamcinolone acetonide,TA屈光refraction屈光不正refractive error屈光参差anisometropia屈光度diopter屈光力refractive power屈光性调节性内斜视refractive accommodative esotropia 屈光状态refractive status全葡萄膜炎generalized uveitis全色盲monochromasia全视网膜光凝panretinal photocoagulation,PRPR染色质重塑chromosome remodeling人工晶状体植入术intraocular lens implantation日常生活视力presenting vision溶血性青光眼hemolytic glaucoma融合fusion融合储备力检查fusion potential融合交叉柱镜fused cross cylinder,FCC乳头状瘤papilloma软镜soft contact lens弱视amblyopiaS三棱镜度prism diopter,PD三棱镜加角膜映光法Krimsky test三棱镜加遮盖试验prism plus cover testing散光astigmatism散光性角膜切开术Astigmatic keratotomy ,AK扫描激光偏振仪scanning laser polarimetry色盲镜anomaloscope色素性青光眼pigmentary glaucoma色素痣nevus沙眼trachoma沙眼衣原体Chlamydia trachomatis闪光ERG Flash ERG上睑下垂ptosis上皮基底膜营养不良epithelial basement membrane dystrophy 上皮内上皮癌intraepithelial epithelioma上斜肌肌鞘综合征Brown syndrome上斜肌麻痹superior oblique muscle palsy上转supraduction ,elevation神经等量支配定律Hering’s law神经交互支配定律Sherrington‘s law神经麻痹性角膜炎neuroparalytic keratitis神经外胚叶neuroectodem神经褶neural fold渗出性视网膜脱离exudative retinal detachment ERD 实验研究experimental study世界卫生组织World Heslth Organization,WHO视杯optic cup视放射optic radiation视光学optometry视沟optic sulcus视觉科学vision science视交叉optic chiasm视交叉综合征chiasmatic syndrome视茎optic stalk视觉诱发电位visual evoked potential ,视力表vision chart视力损伤visual impairment视路visual pathway视能矫正训练orthoptics视盘optic disc视盘玻璃膜疣optic disc drusen视盘黑色素细胞瘤melanocytoma of the optic disc视盘静脉炎papilla phlebitis视盘损伤coloboma of optic disc视盘水肿optic disc edema,papilloedema 视盘小凹optic pit视盘血管瘤hemangioma of the optic disc 视盘血管炎optic disc vasculitis视盘炎papillitis视泡optic vesicle视皮质visual cortex视锐度visual acuity视神经optic nerve视神经发育不全optic nerve hypoplasia视神经管optic canal视神经脊髓炎neuromyelitis optica视神经胶质瘤glioma of optic nerve视神经孔optic foramen视神经脑膜瘤meningioma of optic nerve 视神经乳头optic papilla视神经视网膜炎neuroretinitis视神经撕脱avulsion of the optic nerve视神经头部optic nerve head视神经萎缩optic atrophy视神经炎optic neuritis视神经周围炎optic perineuritis视束optic tract视网膜retina视网膜电图electroretingogram,ERG视网膜对应retinal correspondence视网膜分支静脉阻塞branch retinal artery occlusion,BRAO 视网膜静脉周围炎retinal periphlebitis视网膜静脉阻塞retinal vein occlusion,RVO视网膜毛细血管扩张症retinal telangiectasia视网膜母细胞瘤retinoblastoma,RB视网膜前膜epiretinal membrane视网膜色素上皮retinal pigment epithelium,RPE视网膜神经感觉层neurosensory retina视网膜脱离retinal detachment,RD视网膜血管瘤retinal angiomatosis视网膜血管炎retinal vasculitis视网膜震荡commotio retinae视网膜中央动脉central retinal artery,CRA视网膜中央动脉阻塞central retinal artery occlusion,,CRAO 视网膜中央静脉central retinal vein,CRV视网膜中央静脉阻塞central retinal vein occlusion,CRVO视窝optic pit视野visual field视野计perimeter视紫蓝质iodopsin视紫红质rhodopsin手足抽搐性白内障tetany cataract双目间接检眼镜binocular indirect ophthalmoscope双上转肌麻痹double elevator palsy双行睫distichiasis双眼颞侧偏盲binocular temporal hemianopsia双眼视觉binocular vision双眼同向运动conjugate movement,version双眼异向运动disjunctive movement,vergence水平视差horizontal visual disparity水平斜视horizontal strabismus水液缺乏性干眼aqueous tear deficiency,ATD顺规散光astigmatism with the rule丝状角膜炎filamentary keratitis随机点立体图random-dot stereogramT糖尿病diabetic mellitus糖尿病性白内障diabetic cataract糖尿病性视网膜病变diabetic retinopathy,DR糖皮质激素性青光眼corticosteroid-induced glaucoma调节accommodation调节幅度amplitude ,AMP调节性内斜视accommodative esotropia 调整缝线adjustable sutures铁质沉着症siderosis同侧偏盲homonymous hemianopsia 同视机法synoptophore同型胱氨酸尿症homocystinuria铜质沉着症chalcosis瞳孔pupil瞳孔闭锁seclusion of pupil瞳孔残膜persistent pupillary membrane 瞳孔光反射light reflex瞳孔近反射pupil near reflexW歪头试验Bielschowsky head tilt test 外侧膝状体lateral geniculate body外伤性白内障traumatic cataract外斜视exotropia,XT伪盲malingering blindness伪装综合征masquerade syndrome涡静脉vortex vein无虹膜aniridiaX细菌性角膜溃疡bacterial corneal ulcer 细菌性角膜炎bacterial keratitis细菌性结膜炎bacterial conjunctivitis 下颌瞬目综合征jaw-winking syndrome 354。
Original ArticleBiochemical and molecular characterization of rice (Oryza sativa L.)roots forming a barrier to radial oxygen lossKonstantin Kulichikhin,Takaki Yamauchi,Kohtaro Watanabe &Mikio NakazonoGraduate School of Bioagricultural Sciences,Nagoya University,Furo-cho,Chikusa,Nagoya 464-8601,JapanABSTRACTThe formation of a barrier to radial oxygen (O 2)loss (ROL)in the root is an important adaptation of plants to root flood-ing,but the biochemical changes in plant roots where the barrier is formed are unclear.In this study,we analysed meta-bolic profiles and gene expression profiles in roots of rice (Oryza sativa L.)plants grown under stagnant deoxygenated conditions,which induce suberization in the outer cell layers of the roots and formation of barrier to ROL.Under these conditions,two distinctive biochemical features of the roots were the accumulations of malic acid and very long chain fatty acids (VLCFAs).We also showed that the expressions of some genes encoding plastid-localized enzymes,which convert malic acid to acetyl coenzyme A (AcCoA),were simultaneously up-regulated under stagnant conditions.The expression levels of these genes in specific root tissues iso-lated by laser microdissection suggested that malic acid is converted to AcCoA predominantly in the plastids in the outer cell layers of rice roots.We propose that the physio-logical role of malic acid accumulation in rice roots grown under stagnant conditions is to provide a substrate for the biosynthesis of fatty acids,which,in turn,are used in the biosynthesis of suberin.Key-words :laser microdissection;malic acid;metabolomics;microarray;rice;ROL barrier;VLCFA.INTRODUCTIONRice (Oryza sativa L.)is usually cultivated in flooded,anaerobic environments.The main adaptations of rice plants to this extreme condition are (1)formation of aerenchyma to provide internal aeration of flooded roots (Barber et al .1962;Armstrong 1979)and (2)induction of a strong apoplastic barrier in the peripheral cell layers of the roots (reviewed by Watanabe et al .2013).The barrier reduces radial oxygen (O 2)loss (ROL)from the root aerenchyma to anaerobic soil or medium (Armstrong 1971;Colmer 2003b),as well as pre-vents the entry of phytotoxic compounds (reduced forms of metals and organic acids)to the roots from the soil (Armstrong 1979).Potential components of the barrier to ROL are suberin and/or lignin,which are accumulated at thecell wall in the peripheral cell layers of the root (De Simone et al .2003;Soukup et al .2007;Kotula et al .2009;Shiono et al .2011).The chemical composition of the apoplastic barrier in rice roots suggests that ROL is restricted by the formation of a suberized hypodermis (exodermis)and/or lignified scleren-chyma in the outer part of the root (Kotula et al .2009).Suberin is a biopolymer consisting of three distinct groups of monomers:(1)an aliphatic domain represented by fatty acids,including very long chain fatty acids (VLCFAs)and their derivatives;(2)an aromatic domain represented by ferulic and coumaric acids and their derivatives;and (3)glycerol (Bernards 2002;Franke &Schreiber 2007).Suberin monomers are the products of three distinct metabolic pathways posses-sing different subcellular localizations.Suberization leads to massive rearrangement of primary carbon metabolism,increased energy demand and redirection of carbon and energy fluxes to the biosynthesis of phenolic acids and fatty acids.The components of the aliphatic domain of suberin –fatty acids and VLCFAs –are produced exclusively from acetyl coenzyme A (AcCoA).Apart from fatty acid biosynthesis,AcCoA is involved in many important aspects of plant metabolism such as the tricarboxylic acid (TCA)cycle (Siedow &Day 2000).In plant cells,AcCoA can be synthe-sized in different compartments,such as the cytosol,mitochondria,plastids and glyoxysomes.In plastids and mito-chondria,AcCoA is formed from pyruvic acid through oxi-dative decarboxylation by pyruvate dehydrogenase (PDH).Additionally,AcCoA can be formed by acetyl-CoA synthetase using acetic acid as a substrate,but this reaction requires additional ATP .In the cytosol,ATP-citrate lyase produces AcCoA from citric acid transported from the mito-chondria (Somerville et al .2000;Rawsthorne 2002).Cytosolic AcCoA is the main source of AcCoA for VLCFA elongation (Harwood 1988).Biosynthesis of VLCFA consists of two steps:(1)biosynthesis of C 16–C 18fatty acids in the plastids and (2)elongation of these fatty acids to C 30and longer in the endoplasmic reticulum (ER)(Beisson et al .2012).Thus,the plastidic and ER pools of AcCoA are derived from different metabolic pathways.When plants are grown under flooded conditions,the above-described processes should be able to cope with possible energy deficits in the roots;such deficits originate from O 2restriction,which can decrease ATP yield from 24–36mol per mol of glucose metabolized under aerated conditions to 2–3mol under complete anoxia (Gibbs &Greenway 2003).Correspondence:K.Kulichikhin.Fax:+81527894017;e-mail:konstantin_kulichikhin@;and M.Nakazono.Fax:+81527894017;e-mail:nakazono@agr.nagoya-u.ac.jp Plant,Cell and Environment (2014)37,2406–2420doi:10.1111/pce.12294©2014John Wiley &Sons Ltd2406Apoplastic barriers isolated from various plant species differ dramatically in suberin and lignin contents,suberin-to-lignin ratio,aliphatic-to-aromatic suberin monomer ratio and aliphatic suberin composition(De Simone et al.2003; Soukup et al.2007;Kotula et al.2009).It is unclear which of these components are required to prevent ROL(reviewed by Watanabe et al.2013).Moreover,little is known about the soluble metabolites in root tissues undergoing suberization or lignification.To our knowledge,only one study(of potato wound periderm)has examined the effect of suberization on the profile of extractable metabolites(Yang&Bernards 2007).Here,we attempted to characterize the reorganization of primary carbon metabolism in rice roots during ROL barrier formation.To this end,we obtained the profiles of polar metabolites and of fatty acids in different root zones of rice plants grown in a stagnant deoxygenated medium and a well-aerated medium.To better interpret the differences in metabolic profiles,we combined the biochemical data with the results of a microarray analysis,and we used quantitative RT-PCR(qRT-PCR)to study the expressions of several genes that stood out in the microarray analysis. MATERIALS AND METHODSPlant materials,treatments and harvestingSeeds of rice(O.sativa L.,cv.Nipponbare)were sterilized with70%ethanol for1min;this was followed by sterilization with NaClO solution(2.5%available chlorine)for30min and then washing several times with de-ionized water.The sterilized seeds were germinated in the dark at28°C for2d. Seedlings were transferred to a hydroponic container with quarter-strength aerated nutrient solution[28°C,light con-ditions,photosynthetically active radiation200–250μmol m−2s−1]for4d.The composition of the nutrient solution was as described by Colmer et al.(2006).After4d,the seedlings were transferred to aerated full-strength nutrient solution. After3d(at age9d),half of the seedlings were transferred to stagnant deoxygenated nutrient solution.The stagnant solution contained0.1%(w/v)dissolved agar and was deoxygenated(dissolved O2,<0.5mg L−1)before use by beingflushed with N2gas.The aerated and stagnant nutrient solutions were renewed weekly.To prevent iron deficiency in the seedlings grown under aerated conditions,FeSO4(up to a final concentration of5μm)was added on days9,13,16and 20after germination.At14d after the start of stagnant treat-ment(23d after germination),the plants were used for ROL measurement or were harvested for biochemical analysis, RNA extraction or enzyme activity measurement.Adventi-tious roots(100–150mm long)were harvested from rice plants grown in either the aerated or the stagnant solution, and10mm segments were cut with a sterile razor blade from regions0to10(0–10)mm,10to20(10–20)mm,20to30 (20–30)mm and30to40(30–40)mm from the root apex,and collected and processed separately.For enzyme activity measurement,the materials were processed immediately.For biochemical analysis and RNA extraction,the root segments were plunge-cooled in liquid nitrogen and stored at−80°C.Histochemical staining of suberinFresh roots were harvested as described earlier and whole roots were embedded in5%agar.Further,50μm sections were made at the distances of10,20,30,40,50and60mm from the root apex using a vibrating microtome(VT1200S; Leica Biosystems Nussloch GmbH,Nussloch,Germany). Root cross sections were cleared by incubation at70°C for 1h in lactic acid saturated with chloral hydrate(Lux et al. 2005);this was followed by staining with the lipophilic fluorochrome Fluorol Yellow088at room temperature for 1h to visualize suberin lamellae(Brundrett et al.1991).The aliphatic component of suberin in the cell walls was detected with a charge-coupled device(CCD)camera(DP70; Olympus Optical Co.Ltd.,Tokyo,Japan)as yellowfluores-cence upon excitation by UV light under afluorescence microscope Olympus BX60equipped with U-MWUfiltre cube(Olympus Optical Co.Ltd.).ROL measurementRates of ROL from the adventitious roots of intact plants were measured using root-sleeving platinum O2electrodes as described by Kotula et al.(2009),in accordance with the methods of Armstrong(1967)and Armstrong&Wright (1975).The root systems of plants from either aerated or stagnant culture were immersed in a chamber containing a deoxygenated solution of5m m KCl,0.5m m CaSO4and0.1% (w/v)agar(Colmer2003a;Kotula&Steudle2009).The shoot base wasfixed to the top of the chamber so that the shoot was in air(21%O2,v/v),the roots were in the O2-free medium, and the root–shoot junction was1–2cm below the surface of the medium.Thefirst measurements were taken2h after transfer of the plant to the chamber.One adventitious root (100–150mm long)of each plant was inserted through the cylindrical platinum electrode(inner diameter of2.25mm, height of5mm),which wasfitted with guides to keep the root at the centre of the electrode.ROL was measured along the root with the centre of the electrode at positions5,10,20,30, 40,50and60mm from the apex.Measurements were taken at28°C in the growth chamber where the plants had previ-ously been grown.Metabolite extraction and analysisMetabolite extractionRoot segments stored at−80°C were freeze-dried for36h before the extraction procedure.Metabolites were extracted from3to20mg of lyophilized tissue ground in a glass homogenizer with1.2mL of biphasic solvent system CHCl3–MeOH–H2O[50:25:25(v:v:v)].MeOH and half of CHCl3 were addedfirst to inhibit enzyme activity;this was followed by the addition of H2O and the remainder of CHCl3. Heneicosanoic acid(C21:0,5μg mg−1of dry weight)was added as an external standard for gas chromatography(GC)analy-sis.After centrifugation of the extract at800g for10min,the CHCl3and MeOH–H2O phases were collected separately into glass vials.Extraction was performed three times;the Metabolic profiles of rice root under waterlogging2407©2014John Wiley&Sons Ltd,Plant,Cell and Environment,37,2406–2420non-polar and polar phases were combined separately and the solvent was evaporated using a stream of pure N2gas in the case of the CHCl3fraction or by centrifugation under vacuum in the case of the MeOH–H2O fraction.Dried samples were stored at−80°C,and vials containing the CHCl3fraction residues werefilled with pure N2gas before being placed into the refrigerator.CHCl3and MeOH and root tissue extracts were dispensed via glass microsyringe (Hamilton,Reno,NV,USA);contact between the organic solvents and any plastic materials was thus avoided at all stages of sample extraction.Sample preparation for nuclear magnetic resonance(NMR)analysisImmediately before NMR analysis,the MeOH/H2O fractions of the samples were reconstituted into220μL of deuterium oxide(D2O;99.9%D,Cambridge Isotope Laboratories, Andover,MA,USA)containing100m m KD2PO4.The solvent was evaporated by vacuum centrifugation to remove the traces of H2O,the residue was reconstituted in220μL of D2O(99.96%D,Cambridge Isotope Laboratories)and0.5–5μL of50m m sodium3-(trimethylsilyl)propionate-2,2,3,3-d4 (TMSP-d4)was added as a chemical shift and quantification reference.Sodium azide was added to afinal concentration of 0.5m m to prevent microbial growth.The pD of the samples was adjusted to7.40±0.02with KOD and DCl solutions in D2O using a glass microelectrode.pD value was calculated from the apparent pH value(pH*)of the sample using the equation,pD=pH*+0.4(Glasoe&Long1960).NMR analysisThe samples were analysed with JEOL ECA-600or JEOL ECA-800NMR spectrometers(JEOL Ltd.,Tokyo,Japan).All 1H-NMR spectra were collected with a3mm broadband probe using a JEOL-defined pulse program(single_pulse.ex2). The probe was tuned manually(ECA-800)or automatically (ECA-600).Samples were locked by the D2O signal,and magneticfield homogeneity was optimized manually using up to10shims followed by the automatic gradient shimming option.The probe temperature was maintained at298K,and spinning at20Hz was applied during acquisition.Free induc-tion decays(FIDs)were collected into65536data points.A relaxation delay of5s was used,and one dummy transient was followed by the co-addition of1024scans for a total experiment time of3.00h.Several FIDs(up tofive,depend-ing upon the amount of material used in the analysis)were collected for each sample,and additional shimming was per-formed in between the acquisitions to improve the magnetic field homogeneity.NMR data processingNMR spectra were processed using MestReNova version8.1 (Mestrelab Research S.L.,Santiago de Compostela,Spain). FIDs collected for the same sample were summed up before Fourier transform was applied.All spectra were manually phased,and the baseline was manually corrected using the multipoint baseline correction feature.Peaks were integrated manually,and metabolites were quantified by comparing the peak area of the compound of interest with the peak area of TMSP-d4.Metabolites were identified by acquiring two-dimensional spectra[total correlation spectroscopy(TOCSY) and J-resolved spectroscopy]to reveal the correlation between the signals and the pattern of signal multiplicity, respectively,and through comparison of the experimental data with the data from publicly available databases(Fan 1996;Cui et al.2008)and with the spectra of pure compounds. GC-MS analysis of fatty acidsThe fatty acid composition of the non-polar fraction of plant extracts was analysed by the Shimadzu Analytical and Measuring Center,Kyoto,Japan.Briefly,the residue was reconstituted in500μL of CHCl3and an aliquot of50–100μL was transferred into a10mL screw-capped vial with1mL of MeOH.Thirty microlitres of0.3%(w/v)butylated hydroxytoluene in MeOH was added to prevent sample oxi-dation,and5μL of0.2%(w/v)nonadecylic acid(C19:0;10μg in total)was added as an internal standard.Finally,1mL of 10%HCl in MeOH was added to the mixture,the cap was closed and the vial was placed in a dry bath at80°C for1h for methanolysis.After the mixture had been cooled,fatty acid methyl esters(FAMEs)were extracted by vortexing with two portions of n-hexane(1.5and1mL).The two por-tions of hexane were combined in a glass vial;the solvent was removed by a stream of N2gas at40°C,and the residue was reconstituted in200μL of n-hexane and subjected to GC analysis.The FAMEs were separated in an Rtx2330column (Shimadzu Co.Ltd,Kyoto,Japan).RNA extractionTotal RNA was extracted from frozen-fixed tissues from four sequential regions of the adventitious roots using an RNeasy Plant Mini Kit(Qiagen,Valencia,CA,USA)in accordance with the manufacturer’s instructions.The quality of total RNA was assessed with an RNA6000Pico kit on an Agilent2100 Bioanalyzer(Agilent Technologies,Palo Alto,CA,USA). Microarray analysisTotal RNAs(400ng)were labelled with a Quick Amp Label-ing Kit(Agilent Technologies)in accordance with the man-ufacturer’s instructions.Aliquots of Cy5-labelled cRNA and Cy3-labelled cRNA(825ng each)were used for hybridiza-tion in a rice44K oligo-DNA microarray(Agilent Technol-ogies).Three biological replicates were analysed.The hybridized slides were scanned with a DNA microarray scanner G2505C(Agilent Technologies),and signal inten-sities were extracted using Feature Extraction software (version10.5.1.1;Agilent Technologies).A complete set of microarray data was deposited in the Gene Expression Omnibus(GEO;/geo/)reposi-tory under accession number GSE52128.2408K.Kulichikhin et al.©2014John Wiley&Sons Ltd,Plant,Cell and Environment,37,2406–2420For microarray data analysis,the Benjamini–Hochberg false discovery rate(FDR)method was used to obtain P-values corrected for multiple testing.The fold change of each probe between one set of conditions and the other was calculated using an average of three biological replicates.We identified the genes for which there was at least a twofold change in expression between the two conditions on average and for which the FDR P-value was<0.05.For gene ontology(GO)analysis,we analysed the fre-quency of GO terms of up-regulated and down-regulated genes using GO Slim Assignments(http://rice.plantbiology /downloads_gad.shtml).Laser microdissection(LM)Segments of adventitious roots in the region10–20mm from the root apex werefixed in100%acetone.Afterfixation,the samples were embedded in paraffin and sectioned at a thick-ness of20μm.Serial sections were placed onto PEN mem-brane glass slides(Life Technologies,Carlsbad,CA,USA)for LM,as described by Takahashi et al.(2010).To remove paraf-fin,slides were immersed in Histo-Clear II solution(National Diagnostics,Atlanta,GA,USA)for10min;this was followed by air drying at room temperature.The central cylinder,the cortex and the outer cell layers were collected from the root tissue sections using a Veritas Laser Microdissection System LCC1704(Molecular Devices,Toronto,ON,Canada). Quantitative RT-PCR(qRT-PCR)For qRT-PCR,5ng of total RNA extracted from the adven-titious roots or the laser-microdissected tissues was used as a template.Transcript levels were measured using a StepOnePlus Real-Time PCR System(Applied Biosystems, Foster City,CA,USA)and One Step SYBR PrimeScript RT-PCR Kit II(Takara Bio Inc.,Otsu,Japan),as described by Yamauchi et al.(2014).The quantified mRNA levels of each gene were normalized against the mRNA levels of the tran-scription factor TFIIE gene as a control.qRT-PCR was per-formed with total RNA from three biological replicates.The primer sequences used for the experiments are shown in Supporting Information Table S1.Enzyme activity measurementsExtraction procedureExtracts of plant material were obtained as described by Kulichikhin et al.(2009).Freshly harvested root segments (15–20segments)were weighed and ground in a glass homogenizer with1mL of extraction medium containing 0.1m HEPES-KOH(pH7.5),12.5%(v/v)glycerol,0.5%(w/v) l-ascorbic acid,5m m dithiotreitol and5%(w/v)polyvinyl polypyrrolidone(PVPP,Polyclar AT).cOmplete Mini EDTA-free(Protease Inhibitor Cocktail Tablets;Roche Diagnostics, Mannheim,Germany)was added to prevent proteolytic cleav-age of the proteins.The homogenate was centrifuged at 15000g for10min.The pellet was then discarded and the supernatant was used for the enzyme activity measurements.Enzyme activity measurementThe activities of NAD-malate dehydrogenase(NAD-MDH;E.C. 1.1.1.37),phosphoenolpyruvate carboxylase(PEPC;E.C. 4.1.1.23),NADP-malic enzyme(NADP-ME; E.C.1.1.1.40)and pyruvate phosphate dikinase(PPDK; E.C.2.7.9.1)were measured spectrophotometrically at a wave-length of340nm with a JASCO V-570spectrophotometer (JASCO Corp.,Tokyo,Japan),as described by Moons et al. (1998),with some modifications in the case of PPDK,and by Kulichikhin et al.(2009)in the case of the other enzymes. Measurements were taken at25°C for NAD-MDH and NADP-ME and at30°C for PEPC and PPDK.The assay mixture was incubated at the corresponding temperature for 3min before the reaction was started by the addition of the reaction substrate.Enzyme activity was expressed in enzyme units(EU)per milligram of protein.Protein in the extracts was assayed with Coomassie Brilliant Blue G250in accord-ance with the method of Bradford(1976)using a Bio-Rad Protein Assay reagent(Bio-Rad,Hercules,CA,USA),with bovine serum albumin(BSA)as a reference.The detailed compositions of the assay mixtures for each enzyme are pre-sented in Supporting Information File S1.RESULTSROL from adventitious roots in rice under aerated and stagnant conditionsWe plotted the profiles of ROL along adventitious roots of plants(23d old)grown under aerated or stagnant conditions for14d(Fig.1).Adventitious roots of plants grown under aerated conditions showed the highest rate of ROL at the most basal part;there was a gradual decrease in ROL towards the root apex(Fig.1).Growth under stagnant con-ditions resulted in a dramatic alteration in the ROLprofile Figure1.Profiles of radial O2loss(ROL)along adventitious roots of intact rice plants grown in either aerated or stagnant nutrient solution.Data are means±SE(n=3).Metabolic profiles of rice root under waterlogging2409©2014John Wiley&Sons Ltd,Plant,Cell and Environment,37,2406–2420(Fig.1).The adventitious roots of plants grown under stag-nant conditions showed the highest rates of ROL at 5–10mm from the apex.Towards the root base,the ROL declined substantially:at 20mm from the apex,it was only 7.3%of the value at 10mm from the apex;and at 30mm,it was 6.1%of the value.Little or no ROL was found at 40and 50mm from the root apex,and only a tiny amount of O 2was released at 60mm (Fig.1),probably because of the presence of lateral roots (data not shown).Thus,growth under stagnant condi-tions induced the formation of a strong barrier to ROL in rice adventitious roots.Histochemical staining for suberinWe performed histochemical staining for suberin in cross sections of rice roots from plants grown in aerated or stagnant solutions (Fig.2).Under aerated conditions,no suberin stain-ing of hypodermal cell walls was detected in the regions 10,20and 30mm from the root apex.In the more basal regions,suberin staining was detected in some individual cells,but the cell walls of the majority of hypodermal cells were not stained (Fig.2).Growth under stagnant conditions led to suberization of hypodermal cell walls.Suberin staining was detected at 30mm from the root apex,and fully developed suberinlamellae were detected at 40mm or farther from the root apex (Fig.2).On the basis of the results of the ROL measurements and suberin histochemical staining,we chose the region from 0to 40mm for further biochemical and molecular studies.Metabolic profiles in adventitious roots under aerated and stagnant conditions1H-NMR profiles of polar metabolitesThe signals from more than 20compounds have been iden-tified on the 1H-NMR spectra of polar extracts from rice roots (Supporting Information Table S2),and most of them have been quantifiable.The concentrations of all polar metabolites,with the exception of malic acid,in both aerated and stagnant roots decreased in the direction from the root apex to the root base (Supporting Information Table S3).In contrast,the content of malic acid was minimal in the apical region (0–10mm)and at 10–20mm in roots under stagnant conditions,gradually increasing towards the root base (Fig.3).Roots of plants grown under stagnant conditions were characterized by elevated levels of soluble sugars (sucrose,glucose and fructose;Fig.3),some amino acids (isoleucine,leucine)and organic acids (quinic acid,shikimic acid and especially malic acid)(Fig.3;Supporting Informa-tion Table S3).Aerated roots were more abundant in glutamine,asparagine and alanine,but only in the regions 0–10mm (alanine)or 0–20mm (glutamine,asparagine)from the root apex (Supporting Information Table S3).The most abundant polar metabolites in both aerated and stagnant roots were soluble sugars (sucrose,glucose and fruc-tose)and malic acid (Fig.3).The sucrose content of the apical region of stagnant roots was 8.1μmol g −1fresh weight;this was 1.7times higher than the content in the apical region of the roots of plants grown under aerated conditions.In the region 20–30mm,the sucrose content decreased to 3.1and 1.9μmol g −1fresh weight in the stagnant and aeratedroots,Figure 2.Cross sections of adventitious rice roots stained forsuberin with Fluorol Yellow 088.Plants were grown under either aerated or stagnant conditions.Yellow fluorescence indicates the presence of suberin.Bar =50μm.The distance from the root apex is indicated.The appearance of suberin at 30mm from the root apex under stagnant conditions is indicated by arrows.ep ,epidermis;hy ,hypodermis.Figure 3.Soluble sugar and malic acid contents in differentregions of roots from rice plants grown under either aerated or stagnant conditions.Significant differences between the aerated and stagnant conditions at P <0.05,P <0.01or P <0.001(two-sample t -test)are denoted by *,**or ***,respectively.Data are means ±SE (n =3).2410K.Kulichikhin et al .©2014John Wiley &Sons Ltd,Plant,Cell and Environment,37,2406–2420respectively,and the difference became insignificant.From the region20–30mm to the region30–40mm,the sucrose content did not change significantly under either condition (Fig.3).The glucose content in the root apices of plants grown under stagnant conditions was31.7μmol g−1fresh weight (Fig.3);this was3.9times that in the apical region of the roots of aerated plants(8.1μmol g−1fresh weight).In more proximal regions of the aerated root,the glucose content decreased rapidly,and it was only1.1μmol g−1fresh weight at 10–20mm and0.4μmol g−1fresh weight at20–30mm;no glucose was detected at30–40mm from the apex(Fig.3).In roots under stagnant conditions,the glucose content decreased slower,reaching 5.8μmol g−1fresh weight at 30–40mm from the apex(Fig.3).In both aerated and stagnant roots,fructose was the most abundant polar metabolite in the region from0to20mm from the root apex(Fig.3).The profiles of fructose were similar to those of glucose,except that both stagnant and aerated roots contained the same high fructose concentra-tions(exceeding40μmol g−1fresh weight)in the apical region(0–10mm from the root apex).In the more proximal regions of the aerated roots,fructose content dramatically decreased:at10–20mm from the root apex,it was25%of the value at the apical region(0–10mm from the root apex);and at20–30mm,it was4%of the value.As in the case of glucose, no signal from fructose was recognizable on the spectra of extracts taken at30–40mm from the apex in aerated roots (Fig.3).Under stagnant conditions,the fructose content decreased gradually in the direction from root apex to base: at30–40mm from the apex,the fructose content was approximately40%of that at0–10mm(Fig.3).The profile of malic acid in rice roots grown under aerated conditions was similar to the profiles of glucose and fructose, with the highest concentration(15.6μmol g−1fresh weight)detected at0–10mm from the apex(Fig.3).In the more proximal regions,malic acid content decreased in the direc-tion from root apex to base,to a value of1.6μmol g−1fresh weight at30–40mm(Fig.3).The drop in concentration was slower than those for glucose and fructose,and malic acid was the dominant polar metabolite at20mm or more from the root apex.Under stagnant conditions,the malic acid con-tents were27.0and26.1μmol g−1fresh weight at0–10and 10–20mm,respectively,from the apex;these values were significantly higher than those in the corresponding regions of aerated roots.Malic acid content gradually increased to 32.3μmol g−1fresh weight at20–30mm from the root apex and further increased to38.3μmol g−1fresh weight at 30–40mm(Fig.3).This ascending trend from root apex to base was a unique feature of the malic acid profile(Fig.3), distinguishing it from the profiles of all other polar metabo-lites quantified(Fig.3;Supporting Information Table S3). Profiles of fatty acidsThe fatty acid profiles in rice roots were represented by satu-rated fatty acids from C14:0to C24:0,with small amounts of C26:0, as well as a set of mono-unsaturated fatty acids from C16:1to C22:1with different locations of the double bond,the di-unsaturated acids C18:2and C20:2,and the tri-unsaturated acid C18:3Δ9,12,15(Supporting Information Table S4).Palmitic acid (C16:0),linoleic acid(C18:2Δ9,12)andα-linolenic acid(C18:3Δ9,12,15)accounted for82–89%of the total amount of fatty acids. Growth under stagnant conditions did not affect the amount of palmitic acid(C16:0)in rice roots(Fig.4a).On the contrary, the roots of rice plants grown under stagnant conditions were characterized by significantly elevated levels of linoleic acid (C18:2Δ9,12)at0–10mm from the root apex.In contrast,at 10–20mm,the contents of both linoleic acid(C18:2Δ9,12)and α-linolenic acid(C18:3Δ9,12,15)were significantly lower than in the corresponding regions in aerated roots(Fig.4a).The most distinguishing effect of stagnant treatment on the fatty acid profiles of rice roots was a dramatic elevation in VLCFA(C26:0,C28:0and C30:0)levels at10–20mm from the apex and more proximally(Fig.4b).The levels of these three VLCFAs peaked at20–30and30–40mm from the root apex. Initiation of VLCFA biosynthesis at10–20mm from the apex under stagnant conditions led to a decrease in the amount of C24:0fatty acids(Fig.4b),but in the proximal regions(20–30 and30–40mm from the apex),the level of this compound was similar to those found in aeratedroots.Figure4.Fatty acid contents in different regions of roots from rice plants grown under either aerated or stagnant conditions: (a)C16:0,C18:2Δ9,12and C18:3Δ9,12,15;(b)very long chain fatty acids (VLCFAs)(C24:0,C26:0,C28:0and C30:0).Significant differences between the aerated and stagnant conditions at P<0.05,P<0.01 or P<0.001(two-sample t-test)are denoted by*,**or***, respectively.Data are means±SE(n=3).Metabolic profiles of rice root under waterlogging2411©2014John Wiley&Sons Ltd,Plant,Cell and Environment,37,2406–2420。
藕莲根状茎表面的铁膜特性和成分分析孙雨辰;于浩;郑寨生;张尚法;丁林贤;蔡妙珍【摘要】以10个藕莲(Nelumbo nucifera Gaertn.)品种为材料,比较分析了其根状茎表面的铁膜厚度及化学组成.结果显示:总Fe含量最高的是‘尖头白荷’,其次是‘鄂莲6号’和‘温州山东藕’,最低的是‘鄂莲7号’和‘苏州花藕’;根状茎表面的铁膜中Fe(Ⅲ)和Fe(Ⅱ)分别占总Fe含量的64.1%~ 85.8%和14.2%~35.9%.扫描电子显微镜(SEM)观察发现,铁膜表面呈絮状或颗粒状;能谱分析(EDX)检测到铁膜中存在Fe、C、O、Al、Si,随着铁膜增厚还在‘尖头白荷’根状茎表面的铁膜中检测到K、P和Ca.本研究通过对藕莲根状茎表面的铁膜特性及成分比较,发现供试的10个品种中‘鄂莲7号’和‘苏州花藕’属于铁膜低沉积品种.【期刊名称】《植物科学学报》【年(卷),期】2015(033)002【总页数】7页(P244-250)【关键词】藕莲;根状茎;铁膜特性;化学组成【作者】孙雨辰;于浩;郑寨生;张尚法;丁林贤;蔡妙珍【作者单位】浙江师范大学地理与环境科学学院,浙江金华321004;浙江师范大学地理与环境科学学院,浙江金华321004;浙江省金华市农业科学研究院,浙江金华321000;浙江省金华市农业科学研究院,浙江金华321000;浙江师范大学地理与环境科学学院,浙江金华321004;浙江师范大学地理与环境科学学院,浙江金华321004【正文语种】中文【中图分类】Q946.91;S645.1莲(Nelumbo nucifera Gaertn.)因具有较高的经济价值、丰富的营养和医疗保健作用,其种植面积和总产量位居水生蔬菜之首[1]。
浙江省的藕莲种植面积在近几年呈现出持续增加的趋势,据统计,至2008年栽培面积已达7 × 10³ hm2[2]。
然而,随着藕莲的产业化发展,影响其生产的一系列问题慢慢凸现,如根状茎表面产生的褐红色铁膜已成为保鲜与加工产业化发展的主要限制因素之一[3]。
Tyre use in Formula OneBy Steven De Groote on 03 Jul 2008, 17:53Tyre regulations have changed a lot in Formula One history in order to limit cornering and acceleration speeds of the cars. As it is vital to the car's performances under cornering, the FIA have often tried to change dimensions, introduce grooves but have eventually decided to only allow one single tyre manufacturer in Formula One. The change fits in the cost cutting idea which the FIA is pursuing, while the excessive development rate of tyres can be efficiently slowed down. Since 2011, Pirelli is F1's sole tyre supplier after it was chosen by the FIA following a tender. Before that, Bridgestone was already a sole supplier since2007,Bridgestone after Michelin left because it found the regulations not to suit the sport's and company's values.Tyre basicsFor every racing car, the tyres are the only direct contact patch between the track and the car. The performance of such racing tyres are therefore highly important and are all centred around increasing grip. On the tyre side, how a tyre derives its grip, or its friction with the circuit, can be characterised in two main ways; adhesion and hysteresis loss by deformation.Adhesion is where the tyre compound forms a chemical bond with either the circuit surface, or rubber that has already been laid down on the circuit surface. It's the stickiness of the tyre. Deformation is where the tyre, or more particularly the tyre compound, can move to fit around the irregularities of the track surface. Energy loss occurs here and friction results. This also helps adhesion too, as the more a tyre compound is able to deform around the track surface irregularities, the greater the contact area for adhesion to occur.In developing its tyre compounds Bridgestone looks at adhesion by concentrating on the chemical makeup of the rubber. Changes in the polymers than makeup the rubber mean that the compound reacts differently to the track surface. Processing the data for compounds and track surface interaction consumes a lot of resource at Bridgestone's technical centres.How soft the tyre compound is influences deformation, but the nature of the deformation is an important factor in the tyre design too. How quickly the tyre in its entirety deforms and regains its shape is related to tyre pressure, tyre construction and rubber compound. The compound on its own is the primary consideration in the deformation around the track surface irregularities. A racing tyre compound is therefore designed to deform quite quickly and regain its shape quite slowly, helping to maintain grip.Manufacturing and designFrom the 220 different materials used in a tyre, more than 100 aremixed to create an optimal compound. The compound (image, 1) isbased on three main elements: carbon, oil and sulphur. More or lesssoft depending on the characteristics of each circuit, this sectorchanges considerably from one race to the next, whereas thestructure evolves little by little throughout the season. To keep thetyre together there are bracing plies embedded in the rubber (image,2). The carcass (image, 3) is composed of a Nylon and polyesterframework, in a complex weave. This is the skeleton of the tyre. Itprovides rigidity against high aerodynamic load (more than onetonne of force at 250 km/h), strong longitudinal forces (4 G), lateral forces (5 G), and violent crossing of the vibrating strips.The grooved tyres as they exist between 1998 and 2008 posed an extra problem to the tyre structure. Changes in direction are harder with the grooves, as the rubber in contact with the track between the grooves has a tendency to become deformed. Another headache.The dimensions of the dry surface tyre are dictated above all by the maximum dimensions stipulated by regulations. However, tyres are sometimes designed to be smaller than the maximum limit for aerodynamic reasons. One must take into account that a few extra millimeters added to the width of a tyre can gain or lose several tenths of a second a lap, especially on circuits where high top speeds are achieved.Using a tyre efficientlyA dry-weather racing tyre in Formula One generally operates at anoptimal temperature of around 100° C. In contrast, intermediatespec tyres are operate at between 40°C to 100°C, depending on thewetness of the track, while full wets approximate 30°C to 50°C. Allheat that is created due to the tyre's friction with the surface should,in theory, be ideally distributed between the outside, the centre andthe inside of the tyre tread (a bad distribution is often adapted to bychanging camber). This temperature should also be identical fromleft to right, and from the front to the rear of the car. Too much heat at the front tyres will cause understeer while non-optimal temperatures in the rear tyres will result in oversteering.Measuring the tyre pressure as often as possible is also a priority. Although low pressure (of about 1.1 kg/cm2) allows the envelope to grip the track better and provides a greater contact area, a variation of just 0.2 kg/cm2 can "ruin" the performance of the car. Therefore, any tyre supplier gives a range in which the teams can pressurise their tyres, and it is then up for the team's engineers and tyre specialists to see at what pressure they run them. In order to ensure the lowest possible variations in tyre pressure (heat increases the pressure), F1 tyres are filled with a special mixture of gasses."Moisture in the air makes setting tyre pressures very difficult," explains Tetsuro Kobayashi, Bridgestone Motorsport Technical Manager. "If you set the pressure in the pits with a cold tyre, or even one that's been warmed by a tyre blanket, the pressure will be different when the tyre has been brought right up to full operating temperature. This happens even when we use dried air, but this happens in a more progressive and predictable manner than when there is moisture present. If there was moisture present then there would be different amounts in different tyres depending on when and how they were filled so it would be impossible to predict the pressure change and it would be difficult to engineer the tyres to deliver their maximum performance"Whilst Bridgestone uses dried air by default, there are other gases available and teams will often try or make use of these in their pursuit for an advantage. In various series, not only in Formula One, nitrogen, carbon dioxide and other mixtures have been used. The most important consideration for whatever gas is used is stability or a predictable change in density relative to temperature change to enable the optimum tyre pressure to be both attained and maintained. A second factor can also be the reactivity of the gas with rubber, a point where oxygen scores badly. At high temperatures, the oxygen molecules in air can react with the rubber and hence reduce the tyre pressure. It is sometimes also believed that the mass of thegas is taken into account as being important, but the truth is that the differences are marginal compared to the other factors. Recently however, the FIA moved to limit the allowed gases to air, nitrogen and carbon dioxide.In order to allow the tyre to be filled completely with the specific gas, each rim has two valves, one to let air out, while the other is used to pump it up.Evolution timeline∙1977: Michelin introduces radial tyres at the same time that Renault enters Formula One with the Renault RS01. A year later, Ferrari would also race with the Michelin radials after unoficially having a testing agreement with the tyre supplier since 1969.∙1978: The first win on radial slicks is a fact when Carlos Reutemann wins the Brazilian GP, the second race of the season. He did so in a Ferrari 312T2.∙1979: Jody Schekter becomes the first driver to be World Champion on radial tyres, ina Ferrari 312T4, the first Ferrari in Formula One with ground effect.∙Early on in the 1980's, tyre suppliers gradually switched from bias ply to radial tyres because of the performance benefits. Generally speaking, radial tyres allow for better and constant contact patch but operate at smaller slip angles and are therefore harder to drive at the limit. As a result, today's manufacturers produce their F1 tyres so that they lean somewhat to the design of bias ply tyres, attempting to benefit from the best of both worlds. Good comparisons of the different tyre designs can be foundat michelin and rs-racing.∙1983: Goodyear introduces its radial rain tire for Formula One cars at the Monaco Grand Prix. The racing radial features the unidirectional "gatorback" style tread pattern toimprove wet traction.∙1984: Goodyear introduces its radial slick tires to Formula One.∙1985: First use of a tyre heating blanket. Pre-heater systems for the tyres are very beneficial in the first laps out of the pit, as without heating, a Formula One tyre would require up to 2 laps to get up to temperature. Until that time, the car behaves slippery and loses considerable time to cars with warm tyres.∙... - 1998: No rules were existent concerning grooves in tyres, which allowed slicks to be used.∙1998: F1 cars come on the track again with grooved tyres, even in dry weather conditions, after an abscence since 1971, when the slicks was introduced in FormulaOne. The rear tyres have 4 grooves, while front tyres have to be foreseen with 3longitudinal grooves.∙1999 - ... : Both front and rear tyres must have 4longitudinal grooves.This regulation change also meant a (periodical)departure of Goodyear out of Formula one, as theywere not prepared to make such investments. Theintroduction of the grooved tyres caused a lot ofprotest of multiple drivers, including 1996 world champion Damon Hill, and 1997 world champion Jacques Villeneuve, stating that the cars are more difficult to stop and aremore prone to spinning hence not generating more safety, but actually raise thepossibility of severe crashes. His outings later on forced him to excuse himself with the FIA for his "inappropriate behaviour".∙2007: Contrary to previous years, all cars are required to race both available tyre compounds sometime during the race. To mark the difference, Bridgestone came upwith an idea to paint one of the grooves white when it consists of a soft compound (thesofter one of two dry weather tyre compounds available) or the full wets (compared to no marking on the intermediate tyres).During its attempt to cut cost and especially to improve overtaking, the FIA have been looking on ways how to reduce aerodynamic dependency and increase mechanical grip.After several tests during 2008, the FIA decided to re-allow slick tyres as of 2009 after 10 years of grooved tyres. One year earlier, GP2 also made the same move, stressing that motorsport should go back in time to improve competition.Formula One regulations12.6.1 All dry-weather tyres must incorporate circumferential groovessquare to the wheel axis and around the entyre circumference of the contact surface of each tyre.12.6.2 Each front dry-weather tyre, when new, must incorporate 4grooves which are :- arranged symmetrically about the centre of the tyre tread ;- at least 14mm wide at the contact surface and which taper uniformlyto a minimum of 10mm at the lower surface ;- at least 2.5mm deep across the whole lower surface ;- 50mm (+/- 1.0mm) between centres.Furthermore, the tread width of the front tyres must not exceed 270mm.12.6.3 Each rear dry-weather tyre, when new, must incorporate 4grooves which are :- arranged symmetrically about the centre of the tyre tread ;- at least 14mm wide at the contact surface and which taper uniformlyto a minimum of 10mm at the lower surface ;- at least 2.5mm deep across the whole lower surface ;- 50mm (+/- 1.0mm) between centres.The measurements referred to in b) and c) above will be taken when the tyre is fitted to a wheel and inflated to 1.4 bar.12.6.4 A wet-weather tyre is one which has been designed for use on a wet or damp track. All wet-weather tyres must, when new, have a contact area which does not exceed 280cm² when fitted to the front of the car and 440cm² when fitted to the rear. Contact areas will be measured over any square section of the tyre which is normal to and symmetrical about the tyre centre line and which measures 200mm x 200mm when fitted to the front of the car and 250mm x 250mm when fitted to the rear. For the purposes of establishing conformity, void areas which are less than 2.5mm in depth will be deemed to be contact areas.12.6.5 An extreme-weather tyre is one which has been designed for use on a wet track. All extreme-weather tyres must, when new, have a contact area which does not exceed 240cm²when fitted to the front of the car and 375cm² when fitted to the rear. Contact areas will be measured over any square section of the tyre which is normal to and symmetrical about the tyre centre line and which measures 200mm x 200mm when fitted to the front of the car and 250mm x 250mm when fitted to the rear. For the purposes of establishing conformity, void areas which are less than 5.0mm in depth will be deemed to be contact areas.。
ORIGINAL PAPERDynamic changes in radial oxygen loss and iron plaque formation and their effects on Cd and As accumulationin rice (Oryza sativa L.)Xun Wang •Haixin Yao •Ming Hung Wong•Zhihong YeReceived:18December 2012/Accepted:26March 2013/Published online:14June 2013ÓSpringer Science+Business Media Dordrecht 2013Abstract Temporal variations and correlationsbetween radial oxygen loss (ROL),iron (Fe)plaque formation,cadmium (Cd)and arsenic (As)accumula-tion were investigated in two rice cultivars at four different growth stages based upon soil pot and deoxygenated solution experiments.The results showed that there were significant differences in ROL (1.1–16l mol O 2plant -1h -1),Fe plaque formation (4,097–36,056mg kg -1),Cd and As in root tissues (Cd 77–162mg kg -1;As 49–199mg kg -1)and Fe plaque (Cd 0.4–24mg kg -1;As 185–1,396mg kg -1)between these growth stages.ROL and Fe plaque increased dramatically from tillering to ear emergence stages andthen were much reduced at the grain-filling stage.Furthermore,significantly positive correlations were detected between ROL and concentrations of Fe,Cdand As in Fe plaque.Our study indicates that increased Fe plaque forms on rice roots at the ear emergence stage due to the increased ROL.This stage could therefore be an important period to limit the transfer and distribution of Cd and As in rice plants when growing in soils contaminated with these toxic elements.Keywords Iron plaque ÁDynamic changes ÁRice ÁCadmium ÁArsenicIntroductionCadmium (Cd)is an element that is of great environ-mental and toxicological concern due to its acute and chronic toxic effects on biota and human through contamination of the food chain (Liu et al.2007b ).It can be released into the environment by natural processes and through human activities,such as disposal of industrial effluents and mining wastes,and agricultural application of sewage sludge orphosphate fertilizer (Ye et al.2000;Williams et al.2009).Soil pollution by Cd has been of public concern since the occurrence of Itai–Itai disease in Japan in the1950s and 1960s,due to high levels of Cd contained in rice (Oryza sativa L.)(Obata and Umebayashi 1997;McLaughlin et al.1999).In addition to Cd,arsenic (As)is a toxic metalloid pollutant,the risk of which for human health has also attracted the world’s attention in recent years (Williams et al.2006,2007;Zhu et al.X.Wang ÁH.Yao ÁZ.Ye (&)Key Laboratory of Biodiversity Dynamics andConservation of Guangdong Higher Education Institutes,School of Life Sciences,Sun Yat-sen University,Guangzhou 510006,People’s Republic of China e-mail:lsshzhh@;lssyzhh@M.H.WongCroucher Institute for Environmental Sciences,Hong Kong Baptist University,Hong Kong SAR,People’s Republic of ChinaM.H.WongDepartment of Biology,Hong Kong Baptist University,Hong Kong SAR,People’s Republic of ChinaEnviron Geochem Health (2013)35:779–788DOI 10.1007/s10653-013-9534-y累积本页已使用福昕阅读器进行编辑。
福昕软件(C)2005-2009,版权所有,仅供试用。
统计,[数] 相关去氧的n. [植] 分蘖;发棵n. 污水污泥;下水污泥痛痛病2008b ;Hanh et al.2010).Grains of rice harvestedfrom As-contaminated paddy fields provide an impor-tant risk source of As for consumers,as a consequenceof the high efficiency of rice in accumulating As(Williams et al.2009;Zhao et al.2010).Rice is thestaple food in Asia;therefore,minimizing grain Cdand As in rice production,especially in Cd/As-contaminated areas,is of great importance.In order to adapt to anaerobic conditions,rice develops aerenchyma to transfer O 2from the aerialparts to its roots,resulting in O 2diffusing toward theroot apex and its rhizosphere (Justin and Armstrong1987)—a process which is termed radial oxygen loss(ROL)(Colmer 2003).ROL can oxidize rhizosphericsoil substances and cause precipitation of toxic metalsonto the rhizosphere soil and root surfaces (Otte et al.1989).Recent studies indicated that rice cultivars withhigher rates of ROL possess higher capacities forlimiting the transfer of Cd (Wang et al.2011)and As(Mei et al.2009)to above-ground tissues.Like other wetland plant species,rice can form Feplaque on its roots by oxidizing Fe 2?to Fe 3?,resultingfrom ROL from plants (Taylor et al.1984)andbiological oxidation by microorganisms (Weiss et al.2003).Due to the high capacity of functional groupson Fe hydroxides,Fe plaque is able to sequestermetal(loid)s by adsorption and/or co-precipitation,thus affecting the bioavailability of these elements inthe rhizosphere,which may lead to changes in theuptake and accumulation of elements by the plants (Mei et al.2009,2012;Wang et al.2011).Thepresence of Fe plaque has been reported to influencemetal tolerance and uptake in aquatic plants (Ye et al.1997;Batty et al.2000).However,the exact effects ofFe plaque on Cd and As uptake in rice plants are stillunclear.It has also been reported that the Fe plaque onrice roots may have positive,negative or negligibleimpacts on Cd uptake (Liu et al.2001,2007a ,b ,2008).Liu et al.(2001)found that Cd in the plaque was at ahigher concentration than that in the root tissues of 14rice cultivars,indicating that the plaque had a strongabsorbing capacity and blocked Cd absorption.Incontradiction,Liu et al.(2008)found that enhance-ment of Fe uptake by rice can diminish the negativeeffects of Cd,but that Fe plaque on root surfaces is oflittle significance in affecting uptake and accumula-tion of Cd by rice plants.Ye et al.(1998)alsosuggested that root tissue rather than Fe plaque is themain barrier for Cd transport.Fe plaque may act as an effective Fe reservoir to increase Fe ion concentrations in active cells and then ameliorate metal toxicity.For As,it has been suggested that the formation of Fe plaque on the roots significantly limits the uptake of As by rice,under both glasshouse (Chen et al.2005)and paddy field conditions (Garnier et al.2010).Chen et al.(2005)reported that the Fe plaque had a significant effect on the absorption kinetics of As by rice roots,decreasing arsenate uptake but increasing arsenite uptake.However,it should be emphasized that the rhizosphere effect on metal(loid)s (e.g.,Cd,As)uptake by rice plants is complex,and Fe plaque may serve as a sink or a source of metal(loid)s at different growth stages of plants (Zhao et al.2010).It is also worth noting that rice root Fe plaque may change in amount and composition during rice growth,and this variation may cause changes in the amount and speciation of Fe oxides in the rice rhizosphere (Zhang et al.2012).Nanzyo et al.(2010)reported that the quantity of root Fe plaque reaches its peak at the tillering stage,after which it gradually decreased.Besides that,root secretions may lead to an increase in dissolved organic matter (DOM),which could provide protons and electrons for reductive dissolution of Fe plaque (Zhang et al.2012).The level of DOM is the highest in the earing and flowering stage and decreases gradually from the grain-filling stage to the ripening stage (Wang et al.2004).However,there is a lack of information on how ROL and Fe plaque formation change over the entire growing season of rice,and what effects these changes may have on the accumu-lation and translocation of Cd or As in rice.Thus,the aims of the present study were to determine the effects of Fe plaque on Cd and As uptake by rice,investigate the dynamic changes of ROL and Fe plaque formation and temporal variations in Cd and As accumulation and translocation at four (tillering,bolting,ear emer-gence and grain filling)definable growth stages.Materials and methods Preculture of rice seedlings Two rice cultivars,a hybrid Tianyou 116(TY)and a conventional Huaxinzhan (HX),were selected for this investigation as they are both grown widely in China.Seeds were surface sterilized with 30%v/v H 2O 2for 30min and then washed thoroughly with deionized780Environ Geochem Health (2013)35:779–788杂交本页已使用福昕阅读器进行编辑。