Off-lattice simulation of the solid phase DNA amplification
- 格式:pdf
- 大小:174.52 KB
- 文档页数:8
基于格子玻尔兹曼法的三维溃坝流数值模拟与验证叶永;张芯菲;郑保敬【摘要】溃坝问题一直是验证数值模拟方法有效性的经典问题.利用基于格子玻尔兹曼离散方法研发的XFlow软件来模拟三维溃坝问题,以此验证其有效性并提出进一步的改进方向.为了对比前人所做的实验和模拟结果,计算了无障碍三维溃坝流相应监测点的压力、水位等要素,得到了水流演进过程,并提出了用增强固壁函数法处理固壁边界以增强计算的稳定性,另外还考虑了有矩形障碍物的三维溃坝问题.研究结果表明:该方法能捕捉到某一时间点的自由液面,相关数据计算结果准确,且无需划分网格,能减少工作量,但结果稳定性较差,合理运用边界处理方法能有效解决这一问题.%Dam-break flood simulation is a classical issue to verify the effectiveness of numerical simulation.In this paper,3D dam-break flood is simulated and studied by XFlow software based on Lattice Boltzmann Method to verify its validity and find out improvement approach.In order to compare the results of previous experiments and simulations,the pressure,water level etc.at the corresponding monitoring points for barrier -free 3D dam-break flow are calculated and the evolution process of the flooding is obtained.In the calculation,solid boundary is treated by Enhanced Solid wall to increase calculation stability.In ad-dition,3D dam-break flood discharge with rectangular obstacle is also considered.The research results show that the proposed method can capture the free liquid surface at a certain time point,the relevant calculation results are accurate and the work load is reduced because of meshingneedless.However,the stability of the results is poor and the problem canbe effectively solved by reasonably using the boundary treatment method.【期刊名称】《人民长江》【年(卷),期】2018(049)012【总页数】6页(P93-97,106)【关键词】格子玻尔兹曼方法;三维溃坝流;固壁边界;障碍物【作者】叶永;张芯菲;郑保敬【作者单位】三峡大学水利与环境学院,湖北宜昌443000;三峡大学水利与环境学院,湖北宜昌443000;三峡大学水利与环境学院,湖北宜昌443000【正文语种】中文【中图分类】TV122溃坝洪水是极具破坏力的灾害之一,由于地震、滑坡等原因突然失去阻挡物的水体会以极快速度冲向下游,造成下游财产损失及人身伤害。
PartI words Chapter1 Introductionalluvial mining---冲积矿床开采aluminium—铝an optimum grind size—最佳磨矿粒度barytes—重晶石comminution—粉碎degree of liberation—解离度diamond ores—金刚石矿石Electrical conductivity properties—导电性fluorite—萤石fundamental operations—基本选别流程release/liberation—解离Galena—leadsulphide—方铅矿sphalerite-zincsulphide—闪锌矿cassiterite-tin oxide—锡石grinding—磨矿Laboratory and pilot scale test-work—试验室和半工业实验Line flowsheet—线流程locking of mineral and gangue—连生体Middlings—中矿mill(concentrator)--- 选矿厂milling costs—磨矿消耗Minerals definition(p.1)metallic ore processing –金属矿石加工gangue—脉石Mineral—矿物ore—矿石crust of the earth—地壳sea-bed—河床non-metallic ores—非金属矿石bauxite—氧化铝optical properties—光学性质Ore bodies—矿体part per million(ppm)Primary grind—粗磨product handling—产品处理pyrite –黄铁矿Recovery—回收率Refractory bricks—耐火砖abrasives—磨料Separation—分离Smelter—熔炼sorting—拣选subsequent concentration process—后续选别流程Tailings retreatment—尾矿再处理as-mined(run of mine)—原矿mineral processing(ore dressing/mineral dressing/milling(磨选))—矿物加工portion/concentrate—精矿discard/tailing—尾矿the flowsheet—工艺流程The minimum metal content(grade)—最低金属含量The valuable mineral—有用矿物complex ores—复合矿The waste minerals—脉石enrichment process—富集工艺metal losses—金属损失the enrichment ratio—富集比efficiency of mineral processing operations—矿物加工作业效率The ratio of concentration –选别比the grade/assay—品位ultra-fine particles—超细颗粒unit concentration processes—单元选别流程Chapter2Ore handingopen-pit ore(露天开采的矿石p30,左下)run-of-mine ore(原矿)Typical washing plant flowsheet(洗矿车间典型流程figure 2.2) tipper (卸料器p33 右上)Shuttle belt (梭式胶带p33 右中)Gravity bucket elevator (斗式重力提升机p33 右下)Ore storage(矿物储存p35 右上)包括:stockpile (矿场)bin(矿仓)tank (贮槽)Front-end loader (前段式装载机p35 右上)Bucket-wheel reclaimer(斗轮式装载机p35 右上)Reclaim tunnel system(隧道装运系统p35 右上)The amount of reclaimable material/the live storage(有效贮量p35 右中figure 2.7) Conditioning tank (调和槽p36 左上)Chain-feeder (罗斯链式给矿机figure 2.9)Cross-section of elliptical bar feeder (椭圆形棒条给矿机figure 2.10)Vibrating grizzly feeder (振动格筛给矿机p37 左上)Apron feeder (板式给矿机figure 2.11)Belt feeder (胶带给矿机p37 右下)Chapter 4 particle size analysisacicular(针状);adverse(相反的);algorithm(算法);angular(多角状);aperture(孔径);apex (顶点);apparatus(仪器);arithmetic(运算器,算术); assaying(化验);attenuation(衰减);beaker decantation(烧杯倾析); blinding(阻塞);calibration(校正);charge(负荷);congest(充满);consecutive(连续的);contract(压缩);convection current(对流); conversion factor(转化因子); crystalline(晶体状);cyclosizer(旋流分析仪);de-aerated(脱气);derive:(得出);dilute(稀释);dimensionless quantity(无量纲量); dispersing agent(分散剂);distort(变形);duplicate(重复); electrical impedence(电阻); electroetching(电蚀刻); electroform(电铸);elutriation(淘析);epidote(绿帘石);equilateral triangle(等边三角形); flaky(薄片状);flask(烧瓶);fractionated sample(分级产品); gauze(筛网);geometric(几何学的);granular(粒状的);graticule(坐标网);gray scale(灰度);ground glass(毛玻璃);hand sieve(手动筛);histogram(直方图);immersion(浸没);inter-conversion(相互转变); interpolate(插值);intervals(区间);laminar flow(粘性流体);laser diffraction(激光衍射);light scattering method(光散射法); line of slope(斜率);logarithmic(对数的);machine sieve(机械筛); mechanical constraint(机械阻力);mesh(目);modular(系数的,制成有标准组件的);near size(临界筛孔尺寸);nominal aperture();nylon(尼龙);opening(开口);ordinate(纵坐标);perforated(多孔的);pipette(吸管);plotting cumulative undersize(累积筛下曲线); median size(中间粒度d50);polyhedron(多面体); reflection(反射); procure(获得);projected area diameter(投影面直径);ratio of the aperture width(筛比);refractive index(折射率);regression(回归) ;reproducible(可再生的);sedimentation balance(沉降天平); sedimentation(沉降) ;segment(片);sensor section(传感器); sieve shaker(振动筛,振筛器); spreadsheet(电子表格);simultaneously(同时地);size distribution(粒度分布);spectrometer(摄谱仪);stokes diameter(斯托克斯直径);subdivide(细分);sub-sieve(微粒);suction(吸入);syphon tube(虹吸管);tabulate(列表);tangential entry(切向入口);terminal velocity(沉降末速);truncate(截断);twill(斜纹图);two way cock(双通塞);ultra sonic(超声波);underside(下侧);vertex(顶点);vortex outlet (涡流出口);wetting agent(润湿剂);Chapter 5 comminutionattrition----- 研磨batch-type grindability test—小型开路可磨性实验bond’s third theory—邦德第三理论work index----功指数breakage—破碎converyor--- 运输机crack propagation—裂隙扩展crushing and grinding processes—破碎磨矿过程crushing----压扎crystalline material—晶状构体physical and chemical bond –物理化学键diameter—直径elastic—弹性fine-grained rocks—细粒岩石coarse-grained rocks—粗粒岩石chemical additives—化学添加剂fracture----碎裂free surface energy—自由表面能potential energy of atoms—原子势能graphical methods---图解法grindability test—可磨性实验crushing and grinding efficiency--- 破碎磨矿效率grinding media—磨矿介质gyratory crusher---旋回破碎机tumbling mill --- 筒形磨矿机impact crusher—冲击式破碎机high pressure griding roll--高压辊磨impact breaking-冲击破碎impact—冲击jaw—颚式破碎机material index-材料指数grindability—可磨性mill----选矿厂non-linear regression methods--- 非线性回归法ore carry--- 矿车Parameter estimation techniques—参数估计技术reduction ratio—破碎比roll crusher—辊式破碎机operating work indices—操作功指数Scraper—电铲slurry feed—矿浆SPI(SAG Power Index)—SAG 功指数simulation of comminution processes and circuits—粉碎工艺流程模拟stirred mill—搅拌磨stram energy---应变能the breakage characteristics—碎裂特性the crystalline lattice—晶格the reference ore---参比矿石product size distribution--- 产品粒度分布theory of comminution—粉碎理论brittle—脆性的tough material--- 韧性材料platstic flow—塑性流动Tracer methods—示踪法vibration mill-- 振动磨矿机Chapter 6CrushersAG/SAG mills(autogenousgrinding/semiautogenous grinding) 自磨、半自磨Alternating working stresses交替工作应力Amplitude of swing 摆幅Arrested or free crushing 夹压碎矿、自由碎矿Bell-shaped 钟形Belt scales 皮带秤Binding agents 粘结剂Bitumen 沥青Blending and rehandling 混合再处理Breaker plate 反击板Capital costs 基建费用Capstan and chain 铰杆铰链Cast iron or steel 铸铁铸钢Chalk 白垩Cheek plates 夹板Choke fed 阻塞给矿(挤满给矿)Choked crushing 阻塞碎矿Chromium carbide 碳铬合金Clay 粘土Concave 凹的Convex 凸的Corrugated 波纹状的Cross-sectional area 截面积Cross-section剖面图Crusher gape 排矿口Crusher throat 破碎腔Crushing chamber 破碎腔Crushing rolls 辊式碎矿机Crushing 破碎Discharge aperture 排矿口Double toggle 双肘板Drilling and blasting 打钻和爆破Drive shaft 驱动轴Eccentric sleeve 偏心轴套Eccentric 偏心轮Elliptical 椭圆的Epoxy resin 环氧树脂垫片Filler material 填料Fixed hammer impact mill 固定锤冲击破碎机Flakes 薄片Flaky 薄而易剥落的Floating roll 可动辊Flywheel 飞轮Fragmentation chamber 破碎腔Grizzlies 格条筛Gypsum 石膏Gyratory crushers 旋回破碎机Hammer mills 锤碎机Hydraulic jacking 液压顶Idle 闲置Impact crushers 冲击式破碎机Interparticle comminution 粒间粉碎Jaw crushers 颚式破碎机Limestone 石灰岩Lump 成块Maintenance costs 维修费Manganese steel mantle 锰钢罩Manganese steel 锰钢Mechanical delays 机械检修Metalliferous ores 有色金属矿Nip 挤压Nodular cast iron 球墨铸铁Nut 螺母Pack 填充Pebble mills 砾磨Pillow 垫板Pitman 连杆Pivot 轴Plates 颚板Primary crushing 初碎Receiving areas 受矿面积Reduction ratio 破碎比Residual stresses 残余应力Ribbon 流量Rivets 铆钉Rod mills 棒磨Roll crushers 辊式碎矿机Rotary coal breakers 滚筒碎煤机Rotating head 旋回锥体Scalp 扫除Secondary crushing 中碎Sectionalized concaves分段锥面Set 排矿口Shales 页岩Silica 二氧化硅Single toggle 单肘板Skips or lorries 箕斗和矿车Spider 壁架Spindle 竖轴Springs 弹簧Staves 环板Steel forgings 锻件Stroke 冲程Stroke 冲程Surge bin 缓冲箱Suspended bearing 悬吊轴承Swell 膨胀Swinging jaw 动颚Taconite ores 铁燧岩矿石Tertiary crushing 细碎The (kinetic) coefficient of friction (动)摩擦系数The angle of nip啮角The angle of repose 安息角The cone crusher 圆锥破碎机The cone lining 圆锥衬里The gyradisc crusher 盘式旋回碎矿机Thread 螺距Throughput 处理量Throw 冲程Tripout 停机Trommel screen 滚筒筛Valve 阀Vibrating screens 振动筛Wear 磨损Wedge-shaped 锥形Chapter 7 grinding millsAbrasion 磨蚀Alignment Amalgamation 融合/汞剂化Asbestos 石棉Aspect ratio 纵横比/高宽比Attrition 磨蚀Autogenous mill 自磨机Ball mill 棒磨Barite 重晶石Bearing 轴承Bellow 吼叫Belly 腹部Best-fit 最优化Bolt 螺栓Brittle 易碎的Build-up 增强Butt-weld 焊接Capacitance 电容量Cascade 泻落Cataract 抛落Central shaft 中心轴Centrifugal force 离心力Centrifugal mill 离心磨Chipping 碎屑Churning 搅拌器Circulating load 循环负荷Circumferential 圆周Clinker 渣块Cobbing 人工敲碎Coiled spring 盘簧Comminution 粉碎Compression 压缩Contraction 收缩Corrosion 腐蚀Corrugated 起褶皱的Crack 裂缝Critical speed 临界速度Crystal lattice 晶格Cushion 垫子Cyanide 氰化物Diagnose 诊断Dilute 稀释Discharge 放电Drill coreElastic 有弹性的Electronic belt weigher 电子皮带秤Elongation 延长率Emery 金刚砂Energy-intensive 能量密度Entangle 缠绕Expert system 专家系统Explosives 易爆炸的Flange 破碎Fracture 折断、破碎Front-end loader 前段装备Gear 齿轮传动装置Girth 周长Granulate 颗粒状的Grate discharge 磨碎排矿GreenfieldGrindability 可磨性Grinding media 磨矿介质Groove 沟槽Helical 螺旋状的High carbon steel 高碳钢High pressure grinding roll 高压滚磨Hopper 加料斗Housing 外壳Impact 冲击Impeller 叶轮IntegralInternal stress 内部压力Kinetic energy 运动能Least-square 最小平方Limestone 石灰岩Liner 衬板Lock 锁Lubricant 润滑剂Magnetic metal liner 磁性衬板Malleable 有延展性的Manhole 检修孔Material index 材料指数Matrix 矿脉Muffle 覆盖Multivariable control 多元控制Newtonian 牛顿学的Nodular cast iron 小块铸铁Non-Newtonian 非牛顿的Normally 通常Nuclear density gauge 核密度计Nullify废弃Oblique间接地,斜的Operating 操作Orifice 孔Output shaft 产量轴Overgrinding 过磨Parabolic 像抛物线似地Pebble 砾石Pebble mill 砾磨PendulumPilot scale 规模试验Pinion 小齿轮Pitting 使留下疤痕Plane 水平面PloughPotential energy 潜力Pressure transducer 压力传感器Prime moverPrismatic 棱柱形的Probability 可能性/概率Propagation 增值Pulp density 矿浆密度Pulverize 粉碎Quartzite 石英岩Radiused 半径Rake 耙子Reducer还原剂Reduction ratio 缩小比Retention screenRetrofit 改进Rheological 流变学的Rib骨架Rod 棒Roller-bearing 滚动轴承Rotor 旋转器Rubber liner 橡胶衬板Rupture 裂开ScatsScoop铲起Scraper 刮取器Screw flight 螺旋飞行Seasoned 干燥的SegregationSet-point 选点Shaft 轴Shear 剪Shell 外壳Simulation 模拟SlasticitySpalling 击碎Spigot 龙头Spill 溢出/跌落Spin 使什么旋转Spiral classifier 螺旋分级机Spout 喷出Stationary 静止的Stator 固定片Steady-state 不变的Steel plate 钢盘Steel-capped 钢帽Stirred mill搅拌磨Stress concentration 应力集中Sump 水池Taconite 铁燧岩Tensile stress 拉伸力Thicken 浓缩Throughput 生产量Thyristor 半导体闸流管Time lag 时间间隔Tower mill塔磨Trajectory 轨迹Trial and error 反复试验Trunnion 耳轴Tube millTumbling mill 滚磨Undergrinding 欠磨Underrun 低于估计产量Unlock 开启Vibratory mill 振动磨Viscometer 黏度计Viscosity 黏性Warp 弯曲Wearing linerWedged 楔形物Work index 功指数Chapter 8Industrial screeningBauxite 铝土矿Classification 分级Diagonal 斜的Dry screening 干筛Efficiency or partition curve 效率曲线、分离曲线Electrical solenoids 电磁场Elongated and slabby particles 细长、成板层状颗粒Granular 粒状Grizzly screens 格筛Hexagons 六边形Hydraulic classifiers 水力旋流器Linear screen 线性筛Mesh 网眼Mica 云母Near-mesh particles 近筛孔尺寸颗粒Octagons 八边形Open area 有效筛分面积Oscillating 振荡的Perpendicular 垂直的Polyurethane 聚氨酯Probabilistic 概率性的Resonance screens 共振筛Rhomboids 菱形Rinse 漂洗Rubber 橡胶Screen angle 颗粒逼近筛孔的角度Shallow 浅的Static screens 固定筛Tangential 切线的The cut point(The separation size)分离尺寸Trommels 滚筒筛Vibrating screens 振动筛Water sprays 喷射流Chapter9 classification added increment(增益)aggregate(聚集)alluvial(沉积)apex(顶点) deleterious(有害) approximation(概算,近似值)apron(挡板)buoyant force(浮力)correspond(符合,相符)critical dilution(临界稀释度)cut point(分离点)descent(降落)dilute(稀释的)drag force(拖拽力)duplex(双)effective density(有效比重)emergent(分离出的)equilibrium(平衡)exponent(指数)feed-pressure gauge(给矿压力表)free-settling ratio(自由沉降比)full teeter(完全摇摆流态化)geometry(几何尺寸)helical screw(螺旋沿斜槽)hindered settling(干涉沉降)hollow cone spray(中空锥体喷流)Hydraulic classifier(水力分级机)imperfection(不完整度)incorporated(合并的)infinite(任意的)involute(渐开线式)Mechanical classifier(机械分级机)minimize(最小限度的)multi-spigot hydro-sizer(多室水力分级机)pressure-sensitive valve(压敏阀)Newton’s law(牛顿定律)orifice(孔)overflow(溢流)parallel(平行的,并联的)performance or partition curve(应用特性曲线)predominate(主导)pulp density(矿浆比重)quadruple(四倍)quicksand(流砂体)Reynolds number(雷诺数)scouring(擦洗)Settling cones(圆锥分级机)shear force(剪切力)simplex(单)simulation(模拟)slurry(矿浆)sorting column(分级柱)spherical(球形的)spigot(沉砂)Spiral classifiers(螺旋分级机)Stokes’ law(斯托克斯定律)surging(起伏波动)suspension(悬浮液)tangential(切线式)Teeter chamber(干涉沉降室)teeter(摇摆)terminal velocity(末速)The rake classifier(耙式分级机) turbulent resistance(紊流阻力)underflow (底流)vertical axis(垂直轴)vessel(分级柱)viscosity(粘度)viscous resistance(粘滞阻力) vortex finder(螺旋溢流管)well-dispersed(分散良好的)Chapter 10gravity concentrationactive fluidised bed(流化床); amplitude(振幅);annular(环状的); asbestos(石棉); asymmetrical (非对称的); baddeleyite (斜锆石); barytes (重晶石); cassiterite (锡石); chromite(铬铁矿);circular (循环的); circumference (圆周); closed-circuit (闭路);coefficient of friction (摩擦系数); compartment (隔箱);concentration criterion (分选判据); conduit(管);contaminated(污染);counteract (抵消);degradation (降解);density medium separation (重介质分选); detrimental(有害的);diaphragm (隔膜);dilate (使膨胀);displacement (置换);divert (转移);dredge (挖掘船);eccentric drive(偏心轮驱动); encapsulate (密封);equal settling rate(等沉降比);evenly(均匀的);excavation (采掘);exhaust (废气);feed size range (给矿粒度范围); fiberglass (玻璃纤维);flash floatation (闪浮);flattened(变平);float (浮子);flowing film (流膜);fluid resistance (流体阻力);gate mechanism (开启机制);halt(停止);hand jig (手动跳汰机);harmonic waveform (简谐波);helical(螺旋状的);hindered settling (干涉沉降);hutch(底箱);immobile (稳定);interlock (连结);interstice (间隙);jerk(急拉);kyanite (蓝晶石);lateral (侧向的,横向的);linoleum (漆布);mica(云母);momentum (动量) ;mount(安装);multiple (多重的);multi-spigot hydrosizer (多室水力分级机); natural gravity flower (自流); neutralization (中和作用);nucleonic density gauge (核密度计); obscure (黑暗的,含糊不清的); obsolete (报废的);onsolidation trickling (固结滴沉);open-circuit (开路);pebble stone/gravels(砾石); periphery(周边的);pinched (尖缩的) ;platelet(片晶);platinum(铂金);plunger (活塞);pneumatic table(风力摇床); pneumatically (靠压缩空气); porus(孔);preset(预设置);pressure sensing(压力传感的); pressurize (加压);pulsating (脉动的);pulsion/suction stroke (推/吸冲程); quotient (商);radial(径向的);ragging (重物料残铺层);rate of withdraw (引出速率);raw feed (新进料);reciprocate(往复);refuse (垃圾);render (使得);residual (残留的);retard(延迟);riffle (床条);rinse(冲洗);rod mill (棒磨);rotary water vale (旋转水阀); rubber(橡胶);saw tooth (锯齿形的);scraper(刮板);sectors(扇形区);semiempirical(半经验的); settling cone (沉降椎);shaft (轴);side-wall (侧壁);sinterfeed (烧结料);sinusoidal (正弦曲线);slime table(矿泥摇床);sluice (溜槽);specular hematite (镜铁矿); spinning (自转;离心分离); splitters (分离机);starolite (星石英);staurolite (十字石);stratification (分层); stratum (地层); submerge (浸没);sump (池); superimposed (附加的); surge capacity (缓冲容量); synchronization (同步的); throughput(生产能力); tilting frames (翻筛); timing belt (同步带); trapezoidal shaped (梯形的); tray (浅盘) ;trough(槽);tungsten (钨);uneven (不均匀的);uniformity(均匀性);uranolite (陨石);validate(有效);vicinity (附近);water (筛下水);wolframite (黑钨矿,钨锰铁矿);Chapter 11 dense medium separation(DMS) barite(重晶石)Bromoform(溴仿)bucket(桶)carbon tetrachloride(四氯化碳)centrifugal(离心的)chute(陡槽)Clerici solution(克莱利西溶液)corrosion(腐蚀)dependent criterion(因变判据)discard(尾渣)disseminate(分散,浸染)DMS(重介质分选)dominant(主导)Drewboy bath(德鲁博洗煤机)drum separator(双室圆筒选矿机)Drum separator(圆筒选矿机)Dyna Whirlpool()effective density of separation(有效分选比重)envisage(设想)feasibility(可行性)ferrosilicon(硅铁)flexible sink hose(沉砂软管)fluctuation(波动)fluorite(萤石)furnace(炉)grease-tabling(涂脂摇床)hemisphere(半球)incombustible(不可燃烧的)incremental(递增的)initially(最早地)installation(设备)LARCODEMS(large coal dense medium separator)lead-zinc ore(铅锌矿)longitudinal(纵向)magneto-hydrostatic(磁流体静力)mathematical model(数学模型)metalliferous ore(金属矿)nitrite(亚硝酸盐)Norwalt washer(诺沃特洗煤机)olfram(钨)operating yield(生产回收率)optimum(最佳)organic efficiency(有机效率)paddle(搅拌叶轮)Partition coefficient or partition number(分配率)Partition or Tromp curve(分配或特劳伯曲线)porous(多孔的)probable error of separation;Ecart probable (EP)(分选可能误差)raw coal(原煤)recoverable(可回收的)residue(残渣)revolving lifter(旋转提升器)two-compartmentrigidity(稳定性)sand-stone(砂岩)shale(页岩)siliceous(硅质的)sink-discharge(排卸沉砂)sodium(钠)sulphur reduction(降硫)tabulate(制表)tangential(切线)tedious (乏味)Teska Bash()Tetrabromoethane(TBE,四溴乙烷)theoretical yield(理论回收率)toxic fume(有毒烟雾)tracer(示踪剂)typical washability curves(典型可选性曲线)Vorsyl separator(沃尔西尔选矿机)weir(堰板)well-ventilated(通风良好的)Wemco cone separator(维姆科圆锥选矿机)yield stress(屈服应力)yield(回收率)Chapter 12 Froth flotationActivator(活化剂)adherence (附着,坚持)adhesion(附着)adhesion(粘附)adjoining(毗邻,邻接的)adsorption(吸附)aeration(充气)aeration(充气量)aerophilic(亲气疏水的)aerophilic(亲气性)Aggregation(聚集体)agitation(搅动)agitator(搅拌机)allegedly(据称)Amine(胺)baffle(析流板)Bank(浮选机组)barite(重晶石)Barren(贫瘠的)batch(开路)Borne(承担)Bubble(泡沫)bubble(气泡)bubble-particle(泡沫颗粒)bulk flotation (混合浮选)capillary tube(毛细管)cassiterite (锡石)cerussite(白铅矿) chalcopyrite(黄铜矿)circulating load(循环负荷)cleaner(精选)clearance(间隙)Collector(捕收剂)collide(碰撞,抵触)compensate(补偿,抵偿)component(组成)concave(凹)concentrate trade(精矿品位)Conditioning period(调整期)conditioning tank(调和槽)cone crusher(圆锥破碎机)configuration(表面配置,格局) Conjunction(关联,合流)contact angle measurement(接触角测量)contact angle(接触角)copper sulphate(硫酸铜)copper-molybdenum(铜钼矿)core(核心)correspondingly(相关的)cylindrical(圆柱)Davcra cell(page305)decantation(倾析)depressant(抑制剂)deteriorating(恶化)Dilute(稀释)Direct flotation(正浮选)disengage(脱离,解开)dissemination(传播)dissolution(解散)distilled water(蒸馏水)diverter(转向器)drill core(岩心)drill(钻头,打眼)duplication(复制)dynamic(动态,能动)economic recovery(经济回收率)Elapse(过去,推移)electrolyte(电解质)electrowinning(电积)Eliminating(消除)enhance(提高、增加)Entail(意味着)entrainment(夹带)erosion(腐蚀)Fatty acid(脂肪酸)fatty acids(脂肪酸)faulting(断层)FCTRfiltration(过滤)fine particle(较细颗粒)floatability(可浮性)flotation rate constant(浮选速率常数)flowsheet(工艺流程)fluctuation(波动)fluorite(萤石)frother(起泡剂)Frother(起泡剂)Gangue(脉石)grease(润滑脂)grindability(可磨性)gross(毛的,)Hallimond tube technique(哈利蒙管)hollow(凹,空心的)hydrophilic(亲水性)Hydrophobic(疏水)Impeller(叶轮)in situ(原位)Incorporate(合并)indicator(指标,迹象)inert(惰性的)intergrowth(连生)intermediate-size fraction(中等粒度的含量)ionising collector(离子型捕收剂)amphoteric(两性)irrespective(不论)jaw crusher(颚式破碎机)jet(喷射,喷出物)laborious(费力的)layout(布局,安排)layout(布局,设计)liable(负责)magnitude(幅度)maintenance(维修)malachite(孔雀石)manganese(锰)mathematically (数学地) mechanism(进程)metallurgical performance(选矿指标)metallurgical(冶金的)MIBC(methyl isobutyl carbinol)(甲基异丁甲醇)Microflotation(微粒浮选)Mineralized(矿化的)mineralogical composition(矿物组成) mineralogy(矿物学)mineralogy(岩相学)MLA(mineral liberation analyser)modify(改变)molybdenite(辉钼矿)multiple(复合的)multiple-step(多步)Natural floatability(天然可浮性)hydrophobic(疏水性的)neutral(中性的)non-metallic(非金属)non-technical(非技术)nozzle(喷嘴)optimum(最佳)organic solvent(有机溶剂)oxidation(氧化)oxyhydryl collector(羟基捕收剂)xanthate(黄药)Oxyhydryl collector(羟基捕收剂)palladium(钯)parallel(平行)penalty(惩罚,危害)penetrate(穿透)peripheral(周边)peripheral(周边的)permeable base(透气板)personnel(人员)pH modifier(pH调整剂)pinch(钉)platinum(铂)pneumatic(充气式)polishing(抛光)portion(比例)postulate(假设)predetermined value(预定值)prior(优先)Pulp potential(矿浆电位)pyramidal tank(锥体罐)pyrite(黄铁矿)QEMSCAN(p288)reagent(药剂)rectangular(长方形)regulator(调整剂)reluctant(惰性的)residual(残留物)reverse flotation(反浮选)rod mill(棒磨机)rougher concentrate(粗选精矿)rougher-scavenger split(粗扫选分界)scale-up(扩大)scavenger(少选精矿)scheme(计划,构想)SE(separation efficienty)sealed drum(密封桶)severity(严重性)Sinter(烧结)sleeve(滚轴)slipstream(汇集)smelter(熔炼)sparger(分布器)sphalerite(闪锌矿)sphalerite(闪锌矿)Standardize(标定,规范)stationary(静止的)stator(定子,静片)storage agitator(储存搅拌器) Straightforward(直接的)Subprocess(子过程)subsequent(随后)Sulphide(硫化物)summation(合计)sustain(保留)swirling(纷飞)tangible(有形,明确的)tensile force(张力)texture(纹理)theoretical(原理的)thickener (浓密机)titanium(钛)TOF-SIMStonnage(吨位)Tube(管,筒)turbine(涡轮)ultra-fine(极细的)undesirable(不可取) uniformity(统一性)unliberated(未解离的)utilize(使用)Vigorous(有力,旺盛)weir-type(堰式)whereby(据此)withdrawal(撤回)Work of adhesion(粘着功)XPSAgglomeration-skin flotation(凝聚-表层浮选p316 左中)Associated mineral (共生矿物)by-product (副产品)Chalcopyrite (黄铜矿)Coking coal (焦煤p344 左下)Control of collector addition rate(p322 last pa right 捕收剂添加率的控制) Control of pulp level(矿浆液位控制p321 last pa on the right )Control of slurry pH(矿浆pH控制p322 2ed pa on the left)DCS--distributed control system(分布式控制系统p320 右中)Denver conditioning tank(丹佛型调和槽figure 12.56)Electroflotation (电浮选p315 右中)feed-forward control(前馈控制p323 figure 12.60)Galena(方铅矿)Molybdenum (钼)Nickel ore (镍矿的浮选p343 左)PGMs--platinum group metals(铂族金属)PLC--programmable logic controller(可编程序逻辑控制器p320 右中)porphyry copper(斑岩铜矿)Table flotation (摇床浮选俗称“台选”p316 左中)Thermal coal (热能煤p344 左下)Ultra-fine particle(超细矿粒p315 右中)Wet grinding(湿式磨矿)Chapter 13 Magnetic and electrical separationCassiterite(锡石矿) wolframite(黑钨矿) Diamagnetics(逆磁性矿物) paramagnetics(顺磁性矿物) Ferromagnetism(铁磁性) magnetic induction(磁导率)Field intensity(磁场强度) magnetic susceptibility(磁化系数) Ceramic(瓷器) taconite(角岩)Pelletise(造球) bsolete(废弃的)Feebly(很弱的) solenoid(螺线管)Cobbing(粗粒分选) depreciation(折旧)Asbestos(石棉) marcasite(白铁矿)Leucoxene(白钛石) conductivity(导电性)Preclude(排除) mainstay(主要组成)Rutile(金红石) diesel(柴油)Cryostat(低温箱)Chapter 14 ore sortingappraisal(鉴别);audit(检查);barren waste(废石); beryllium isotope(铍同位素); boron mineral(硼矿物); category(范围);coil(线圈);downstream(后处理的); electronic circuitry(电路学); feldspar(长石); fluorescence(荧光);grease(油脂);hand sorting(手选);infrared(红外的);irradiate(照射);laser beam(激光束); limestone(石灰石); luminesce(发荧光); luminescence(荧光); magnesite(菱镁矿); magnetic susceptivity(磁敏性); matrix(基质); microwave(微波);monolayer(单层);neutron absorption separation(中子吸收法); neutron flux (中子通量);oleophilicity(亲油的);phase shift(相变);phosphate(磷酸盐);photometricsorting(光选);photomultiplier(光电倍增管);preliminary sizing(预先分级);proximity(相近性);radiometric (放射性的);scheelite(白钨矿);scintillation(闪烁);seam(缝隙);sequential heating(连续加热);shielding(防护罩);slinger(投掷装置);subtle discrimination(精细的鉴别);talc(滑石);tandem(串联的);thermal conductivity(热导率);ultraviolet(紫外线); water spray(喷水); Chapter15DewateringAcrylic(丙烯酸) monomer(单分子层) Allotted(分批的)jute(黄麻) Counterion(平衡离子) amide(氨基化合物) Diaphragm(隔膜) blanket(覆盖层) Electrolyte(电解液) gelatine(动物胶) Flocculation(聚团) decant(倒出)Gauge(厚度,测量仪表) rayon(人造纤维丝) hyperbaric(高比重的) Membrane(薄膜) coagulation(凝结) miscelaneous(不同种类的) barometric(气压的) Potash(K2CO3)tubular(管状的) Sedimentation(沉淀) filtration(过滤)Thermal drying(热干燥) polyacrylamide(聚丙烯酰胺)Chapter16 tailings disposalBack-fill method—矿砂回填法tailings dams—尾矿坝impoundment—坝墙Cyclone—旋流器Dyke—坝体slimes—矿泥Floating pump—浮动泵站compacted sand—压实矿砂Lower-grade deposits -- 低品位矿床heavy metal—重金属mill reagent—选矿药剂Neutralization agitator—中和搅拌槽thickener---浓密池overflow –溢流River valley—河谷upstream method of tailings-dam construction –上流筑坝法Sulphur compound—硫化物additional values—有价组分the resultant slimes—脱出的矿泥surface run-off-- 地表水lime—石灰the downstream method—下游筑坝法the centre-line method –中线筑坝法drainage layer—排渗层Underflow—沉砂water reclamation—回水利用reservoir—贮水池Part II ElaborationsChapter2 Ore handing1.The harmful materials and its harmful effects(中的有害物质,及其影响) -----P30 右2.The advantage of storage (贮矿的好处)-----p35 左下Chapter 4 particle size analysis3.equivalent diameter (page90);4.:stokes diameter (page98) ; median size (page95,left and bottom); 80% passing size (page95,right) ; cumulative percentage(page94-95under the title’presentation of results’); Sub-sieve;(page 97,right)5.why particle size analysis is so important in the plant operation? (page90, paragraph one); some methods of particle analysis, their theory and the applicable of thesize ranges.(table4.1+theory in page91-106)7.how to present one sizing test?(page94)8.how to operate a decantation test?(page98 sedimentation test)9.advantage and disadvantage of decantation in comparison with elutriation? (Page99 the second paragraph on the left +elutriation technique dis/advantage in page 102 the second paragraph on the left)Chapter 6Crushers10.The throw of the crusher: Since the jaw is pivoted from above, it moves a minimum distance at the entry point and a maximum distance at the delivery. This maximum distance is called the throw of the crusher.11.Arrested(free) crushing: crushing is by the jaws only12.Choked crushing: particles break each other13.The angle of nip:14.1)the angle between the crushing members2)the angle formed by the tangents to the roll surfaces at their points of contact withthe particle(roll crushers)15.Ore is always stored after the crushers to ensure a continuous supply to the grinding section. Why not have similar storage capacity before the crushers and run this section continuously?(P119,right column, line 13)16.The difference between the jaw crusher and the gyratory crusher?(P123,right column, paragraph 3)17.Which decide whether a jaw or a gyratory crusher should be used in a particular plant?(p125,left column, paragraph 2)18.Why the secondary crushers are much lighter than the heavy-duty, rugged primary machines?(P126,right column, paragraph 4)19.What’s the difference between the 2 forms of the Symons cone crusher, the Standard and the short-head?(P128,left column, paragraph3 )20.What’s the use of the parallel section in the cone crusher?(P128,left column, paragraph4)21.What’s the use of the distributing plate in the cone crusher?(P128,right column, paragraph1)22.Liner wear monitoring(P129,right column, paragraph2)23.Water Flush technology(P130, left column, paragraph1)24.What’s the difference between the gyradisc crusher and the conventional cone crusher?(P130,right column, paragraph 4)25.What’s the use of the storage bin?(P140,left column, paragraph 2)26.Jaw crushers(p120)27.the differences between the Double-toggle Blake crushers and Single-toggle Blakecrushers(p121, right column, paragraph 3)28.the use of corrugated jaw plates(p122, right column, line 8)29.the differences between the tertiary crushers and the secondary crushers?(p126,right column, paragraph 5)30.How to identify a gyratory crusher, a cone crushers?(p127, right column, paragraph 3)31.the disadvantages of presence of water during crushing(p130,right column, paragraph 2)32.the relationship between the angle of nip and the roll speed?(p133, right column)33.Smooth-surfaced rolls——used for fine crushing; corrugated surface——used for coarse crushing;(p134, left column, last paragraph)Chapter 7 grinding mills34.Autogenous grinding:An AG mill is a tumbling mill that utilizes the ore itself as grinding media. The ore must contain sufficient competent pieces to act as grinding media.P16235.High aspect ratio mills: where the diameter is 1.5-3 times of the length. P16236.Low aspect ratio mills:where the length is 1.5-3 times of the diameter. P16237.Pilot scale testing of ore samples: it’s therefore a necessity in assessing the feasibility of autogenous milling, predicting the energy requirement, flowsheet, and product size.P16538.Semi-autogenous grinding: An SAG mill is an autogenous mill that utilizes steel balls in addition to the natural grinding media. P16239.Slurry pool:this flow-back process often leads to higher slurry hold-up inside an AG or SAG mill, and may sometimes contribute to the occurrence of “slurry pool”, which has adverse effects on the grinding performance.P16340.Square mills:where the diameter is approximately equal to the length.P16241.The aspect ratio: the aspect ratio is defined as the ratio of diameter to length. Aspect ratios generally fall into three main groups: high aspect ratio mills、square mills and low aspect ratio mills.P16242.grinding circuit: Circuit are divided into two broad classifications: open and closed.( 磨矿回路p170)43.closed circuit: Material of the required size is removed by a classifier, which returns oversize to the mill.(闭路p170左最后一行)44.Circulation load: The material returned to the mill by the classifier is known as circulation load , and its weight is expressed as a percentage of the weight of new feed.(循环负荷p170右)45.Three-product cyclone: It is a conventional hydrocyclone with a modified top cover plate and a second vortex finder inserted so as to generate three product streams. (p171右)46.Parallel mill circuit: It increase circuit flexibility, since individual units can be shut down or the feed rate can be changed, with little effect on the flowsheet.(p172右) 47.multi-stage grinding: mills are arranged in series can be used to produce。
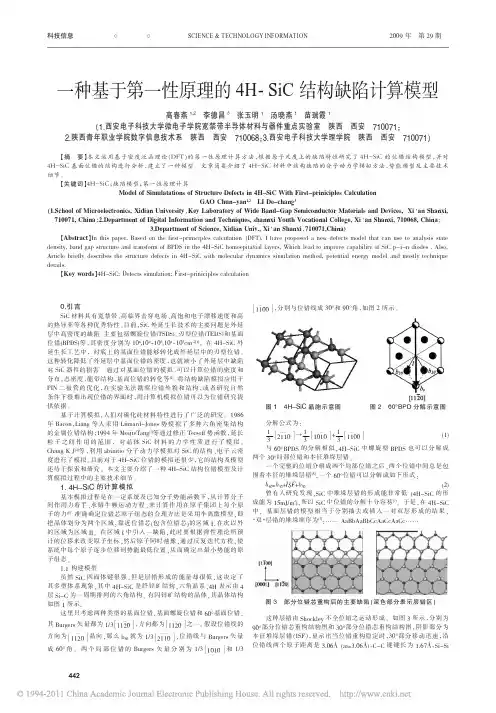
0.引言SiC 材料具有宽禁带、高临界击穿电场、高饱和电子漂移速度和高的热导率等各种优秀特性。
目前,SiC 外延生长技术的主要问题是外延层中高密度的缺陷。
主要包括螺旋位错(TSDS)、刃型位错(TEDS)和基面位错(BPDS)等,其密度分别为104,104~105,104~105cm -2[1]。
在4H-SiC 外延生长工艺中,衬底上的基面位错能够转化成外延层中的刃型位错。
这种转化降低了外延层中基面位错的密度,也就减小了外延层中缺陷对SiC 器件的损害。
通过对基面位错的模拟,可以计算位错的密度和分布,态密度,能带结构,基面位错的转化等[2]。
将结构缺陷模拟应用于PIN 二极管的优化,在实验无法勘察位错外貌和结构,或者研究自然条件下很难出现位错的界面时,用计算机模拟位错可以为位错研究提供依据。
基于计算模拟,人们对碳化硅材料特性进行了广泛的研究。
1986年Bacon ,Liang 等人采用Linnard-Jones 势模拟了多种六角密集结构的金属位错结构;1994年MeijieTang [3]等通过修正Tersoff 势函数,延长粒子之间作用的范围,对晶体SiC 材料的力学性质进行了模拟。
Chang K J [4]等,利用abinitio 分子动力学模拟对SiC 的结构、电子云密度进行了模拟。
目前对于4H-SiC 位错的模拟还很少,它的结构及模型还待于探索和研究。
本文主要介绍了一种4H-SiC 结构位错模型及计算模拟过程中的主要技术细节。
1.4H-SiC 的计算模拟基本模拟过程是在一定系统及已知分子势能函数下,从计算分子间作用力着手,求解牛顿运动方程,来计算作用在原子集团上每个原子的力[5]。
准确确定位错芯原子组态的合理方法是采用半离散模型,即把晶体划分为两个区域:靠近位错芯(包含位错芯)的区域I ,在次以外的区域为区域II 。
在区域I 中引入一缺陷,此时要根据弹性理论所预计的位移来改变原子坐标,然后原子同时弛豫,通过反复迭代方程,使系统中每个原子逐步位移到势能最低位置,从而确定出最小势能的原子组态。
基于格子-玻尔兹曼方法的三维虚拟树冠阻力特性张克;付海明【摘要】为了给预测实际树冠的风阻提供理论依据,运用Visual Basic程序设计语言建立三维虚拟树冠模型,使用基于格子-玻尔兹曼方法(Lattice-Boltzmann method,LBM)的计算流体动力学软件——XFlow进行模拟计算,研究不同叶面积指数和风速条件下,树冠对空气流动阻力特性的影响.采用叶面积指数表征树冠的形态结构特征,讨论其对树冠流动阻力的影响规律,并提出阻力系数与叶面积指数、风速之间的关联表达式.利用风洞对人工树模型进行试验,测试结果与关联表达式的预测结果吻合较好.研究结果表明:树冠的阻力系数与叶面积指数、风速呈指数函数关系;当风速大于5 m/s时,阻力系数接近常数,风速对阻力系数的影响不再显著.【期刊名称】《东华大学学报(自然科学版)》【年(卷),期】2019(045)002【总页数】7页(P306-312)【关键词】虚拟树冠;叶面积指数;风速;阻力系数【作者】张克;付海明【作者单位】东华大学环境科学与工程学院,上海201620;东华大学环境科学与工程学院,上海201620【正文语种】中文【中图分类】X513;S731.2随着绿化屋面系统的普及,其风阻性能正在变得越来越受关注,特别是在台风地区。
风阻性能研究已成为绿化屋面系统设计的先决条件,以便确定树木的空气动力学特征,为绿化设计提供基础科学数据。
此外,高大建筑的大量出现导致建筑周边行人高度的风环境变得更加复杂。
在街道、广场等开放空间中,形成的局地强风给人们的出行带来诸多不便。
除了优化建筑设计外,还可以通过在建筑周围种植绿化带以减弱甚至消除局地强风的影响。
绿化带对强风遮蔽作用的机理亟待研究,以便合理地建设绿化带。
因此,研究树木冠层对风环境的影响具有非常重要的现实意义。
长期以来,树冠对风场阻力特性的研究主要采用野外观测、风洞试验以及数值模拟等方法。
Green[1]采用圆锥状树冠简化模型进行风洞试验,研究树冠对周围流场的影响。
Physical Chemistry of Solid StateElectrolytesSolid-state electrolytes (SSEs) have been studied extensively in recent years due to their potential to revolutionize energy storage technologies by enabling solid-state batteries with higher energy densities, longer cycle lives, and improved safety. Physical chemistry is an essential aspect of SSEs in understanding their fundamental properties and developing new materials with enhanced performances.Crystal Structures of SSEsThe crystal structure of SSEs is crucial for their ionic conduction properties. Most SSEs are composed of metal cations or non-metal anions arranged in a crystal lattice that forms a periodic network of voids or channels. The ionic conductivity of SSEs primarily depends on the accessibility of these channels for the movement of ions.For example, the lithium ion conductor Li10GeP2S12 (LGPS) features a tetragonal crystal structure composed of a three-dimensional network of corner-shared GeS4 tetrahedra. The large 12-coordinate Li+ ions occupy the large voids (12-fold coordination sites) between these tetrahedra, while the small 4-fold coordinated P5+ and S2- ions occupy the smaller voids (4-fold coordination sites), forming a disordered distribution pattern in the channels. This unique structure results in high lithium ion conductivity along the three crystallographic directions, achieving values up to 10^-3 S cm^-1 at room temperature.Defect Chemistry of SSEsThe presence of structural defects in SSEs can lead to enhanced ionic conductivity and electrochemical properties. Point defects (vacancies, interstitials) and line defects (dislocations, grain boundaries) can provide additional sites for charge carriers to move more easily through the material. These defects also affect the chemical stability andmechanical strength of SSEs, thus balancing the trade-off between ion conductivity and the electrolyte's structural integrity.For instance, the Li-ion conductor Li7La3Zr2O12 (LLZO) adopts a cubic garnet structure composed of alternating metal oxide layers and Li+ conducting channels. The presence of lithium and oxygen vacancies in the garnet structure can promote Li+ hopping between adjacent octahedral coordination sites, which is the rate-determining step of ionic conduction in LLZO. The introduction of excess lithium ions via Li2CO3 doping can further increase the ionic conductivity of LLZO by creating new lithium vacancies as well as enhancing the lithium-ion diffusivity.Interface Chemistry of SSEsThe interfacial behavior between the SSE and active electrode materials significantly impacts the battery's performance and stability. Understanding the interface chemistry can help design new SSE-electrode material combinations with enhanced electrochemical performance.For example, the Li-ion cathodes used in lithium-ion batteries usually feature a layered oxide structure, such as LiCoO2, which undergoes structural changes (e.g., structural phase transitions, oxygen loss) during cycling that can result in capacity fading and safety issues. The use of SSEs, such as LiPON (Li3.3PO3.8N0.2) or LLZO, as the electrolyte can suppress the side reactions and prevent the degradation of the electrode material. LiPON forms a thin, uniform, and dense interfacial layer between the cathode and electrolyte that blocks the diffusion of active species and protects the cathode from environmental degradation. LLZO, on the other hand, provides a greater degree of mechanical stability and electrochemical reliability due to its high chemical stability and compatibility with most electrodes.ConclusionThe physical chemistry of SSEs plays a critical role in determining their electrochemical properties and their interactions with other materials in energy storage devices such as batteries and supercapacitors. SSEs need to balance their ionicconductivity with thermal stability, mechanical integrity, and chemical compatibility to enable the development of solid-state batteries with better performance. Further studies on SSEs, including their crystal structures, defect chemistry, and interface chemistry, are necessary to improve the energy density, cycle life, and safety of SSE-based energy storage devices.。
The Properties of Different Types ofSolidsIntroduction:Solids are one of the three states of matter, along with liquids and gases. They have a definite shape and volume, and their particles are arranged in a fixed pattern. However, not all solids are the same. There are different types of solids that exhibit different properties based on their internal structure and composition. In this article, we will explore the properties of different types of solids.I. Metallic Solids:Metallic solids are characterized by a tightly packed lattice structure, in which metallic atoms are bonded to each other through metallic bonding. Metallic bonding involves the sharing of valence electrons between metal atoms, which results in a highly conductive and ductile material. Metallic solids are also shiny and reflect light well due to their free electrons, which allow them to absorb and re-emit light. Some common examples of metallic solids are iron, gold, silver, and copper.II. Covalent Network Solids:Covalent network solids are composed of atoms that are bonded to each other through covalent bonds, which are strong chemical bonds resulting from the sharing of electrons between atoms. The atoms are arranged in a lattice structure, with each atom bonded to several neighboring atoms. Covalent network solids are extremely hard and have high melting and boiling points due to the strength of the covalent bonds. They are also poor conductors of electricity and are generally insoluble in water. The most well-known example of a covalent network solid is diamond, which is the hardest natural substance known to man.III. Ionic Solids:Ionic solids are made of positive and negative ions that are bonded to each other through ionic bonds, which are strong electrostatic attractions resulting from the transfer of electrons from one atom to another. The ions are arranged in a lattice structure, with each ion being surrounded by several oppositely charged ions. Ionic solids are hard, brittle, and have high melting and boiling points due to the strength of the ionic bonds. They are also good conductors of electricity when molten or dissolved in water, but not in the solid state. Some common examples of ionic solids are table salt (sodium chloride) and calcium carbonate.IV. Molecular Solids:Molecular solids are composed of discrete molecules that are held together through intermolecular forces such as van der Waals forces or hydrogen bonding. The molecules are arranged in a lattice structure, with each molecule being attracted to several neighboring molecules. Molecular solids are generally soft, have low melting and boiling points, and are poor conductors of electricity. They are also often soluble in polar solvents such as water due to their polar or hydrogen bonding properties. Examples of molecular solids include ice, sugar, and caffeine.Conclusion:In conclusion, while all solids share certain properties such as definite shape and volume, each type of solid has unique properties based on its internal structure and composition. Metals are highly conductive and ductile, covalent network solids are extremely hard with high melting and boiling points, ionic solids are brittle with high melting and boiling points, and molecular solids are usually soft with low melting and boiling points. Understanding the properties of different types of solids is important in fields such as materials science, chemistry, and physics.。
溶剂化英语Solvation: An Essential Concept in ChemistrySolvation is a fundamental concept in chemistry that plays a crucial role in the behavior of solutions and the interaction between solutes and solvents. It refers to the process by which solvent molecules surround and interact with solute particles, leading to the dissolution of the solute in the solvent. This phenomenon is essential for understanding various chemical and physical processes, including the formation of solutions, reaction rates, and the properties of substances in different environments.When a solute is added to a solvent, the solvation process begins. For instance, when table salt (sodium chloride) is dissolved in water, the polar water molecules surround the positively charged sodium ions (Na⁺) and negatively charged chloride ions (Cl⁻). The positive end of the water molecules is attracted to the chloride ions, while the negative end of the watermolecules is attracted to the sodium ions. This interaction helps to separate the ions from the solid crystal structure and disperse them throughout the solution.The efficiency of solvation depends on various factors, including the nature of the solute and solvent, temperature, and pressure. Polar solvents, such as water, are generally effective at solvating ionic and polar solutes due to their ability to interact through dipole-dipole interactions and hydrogen bonding. Nonpolar solvents, on the other hand, are better suited for dissolving nonpolar substances through London dispersion forces.One important aspect of solvation is the concept of solvation energy, which is the energy released or absorbed during the solvation process. This energy is crucial for determining whether a solute will dissolve in a given solvent. If the solvation energy is sufficiently high to overcome the lattice energy of the solute and the interaction energy between solventmolecules, the solute will dissolve. Conversely, if the solvation energy is insufficient, the solute may remain undissolved.Solvation is not only important for solution formation but also for influencing the rates of chemical reactions. The solvation of reactants can affect the activation energy and reaction kinetics. For example, in aqueous solutions, the solvation of ions can stabilize charged intermediates, thereby facilitating certain reactions.Furthermore, solvation has practical implications in various fields, including pharmaceuticals, environmental science, and industrial processes. In drug development, understanding solvation helps in designing effective drug formulations that ensure proper dissolution and absorption in the body. In environmental science, solvation affects the behavior and mobility of pollutants in water and soil. In industrial processes, solvation principles are applied to optimize solvent extraction and separationtechniques.In conclusion, solvation is a key concept in chemistry that underpins many aspects of solution chemistry and chemical interactions. Its influence extends from fundamental scientific research to practical applications in various industries. Understanding the principles of solvation provides valuable insights into the behavior of substances in solution and helps in advancing both theoretical and applied chemistry.。

DESIGNER TO ANALYST PROCESS SOLUTIONSInnovate. Evaluate. Validate.SOLIDWORK S Simulation tools deliver actionable results for both the casual designer or engineer as well as the dedicated analyst. They provide a completely integrated design-and-analysis strategy, without ever having to leave the familiar SOLIDWORKS environment. Other benefits include:PRODUCT DESIGN REFINEMENTDetermine operational loads and timing with Motion Analysis. Evaluate alternative assembly methods.Calculate Factor of Safety (FoS) and product performance. Measure flow rates and the impact of fluid flow on yourAlter your design automatically for optimal strength andENGINEERDESIGNERANALYSTSTREAMLINE DESIGN FOR STRUCTURAL STRENGTH, STIFFNESS AND ENDURANCE.Ensuring the required structural streng th, rig idity, andendurance of a desig n has traditionally been in the realmof either physical testing or of specialist analysis tools.SOLIDWORKS Simulation delivers powerful analysiscapabilities tog ether with the SOLIDWORKS ease of use,resulting in a suite of structural analysis tools that can beused by both the designer and analyst.SOLIDWORKS Simulation can assist in determining a product’scapacity in the face of several factors:• Motion• Linear• Frequency• Fatigue• Thermal Structural• Optimization• Non-Linear• DynamicSIMULIA SIMULATION ENGINEERUnderstanding product performance under extreme loading anddeformation requires a robust non-linear solution. SimulationEngineer enables analysts to tackle the most challenging ofstatic non-linear problems using:• Abaqus solver• Advanced meshing• Comprehensive material models• Robust component contact formulationSTRUCTURAL ANAL YSISFOR DESIGN“ T he power of the Simulation Engineer product is the ability to come up with solutions rapidly and reliably to complex problems that become part of the design process.”— Laurence Marks, Director Strategic Simulation & AnalysisSOLIDWORKS FLOW SIMULATIONAdvanced fluid flow simulation made easyUnderstanding the impact of fluid flow in and around yourdesign can be key to evaluating its performance. Consider thesedesign elements:• Internal external liquid and gas flow• Free surface flow• Non-Newtonian flows• Low speed to supersonic flows• Fans and rotating components• Conjugate heat transfer• Electronics cooling module• Pressure and temperature transfer to SOLIDWOR SSimulation for structural analysisSOLIDWORKS PLASTICSThe design of plastic components cannot be complete withoutan analysis of their manufacturing process and the levelof mod performance. SOLIDWORK S Plastics Simulationenables designers and analysts to simulate the plastic injectionmolding process, including:• Confidence of component fill• Component wall thickness and rib placement evaluation• Weld line visualization• Optimize injection gate location• Visualize the plastic flow front and check if the part will fillthe mold completely• Determine maximum injection pressure needed to fillthe mold• Optimize gate locations to avoid or at least minimizeweld linesSee the full range of SOLIDWORKS software fordesign, simulation, technical communication, and datamanagement at /products2018.To learn more about SOLIDWORKS, visit/solutions.Our 3D EXPERIENCE® platform powers our brand applications, serving 12 industries, and provides a rich portfolio of industry solution experiences. Dassault Systèmes, the 3D EXPERIENCE® Company, provides business and people with virtual universes to imagine sustainable innovations. Its world-leading solutions transform the way products are designed, produced, and supported. Dassault Systèmes’ collaborative solutions foster social innovation, expanding possibilities for the virtual world to improve the real world. The group brings value to over 220,000 customers of all sizes in all industries in more than 140 countries. For more information, visit .Europe/Middle East/Africa Dassault Systèmes 10, rue Marcel Dassault CS 4050178946 Vélizy-Villacoublay Cedex France Americas Dassault Systèmes 175 Wyman Street Waltham, Massachusetts 02451-1223USA Asia-Pacific Dassault Systèmes K.K.ThinkPark Tower 2-1-1 Osaki, Shinagawa-ku,Tokyo 141-6020Japan ©201I M U L I A , G E O V I A , E X A L E A D , 3D V I A , 3D S W Y M , B I O V I A , N E T V I B E S , I F W E a n d 3D E X C I T E a r e c o m m e r c i a l t r a d e m a r k s o r r e g i s t e r e dt r a d e m a r k s o f D a s s a u l t S y s t èm e s , a F r e n c h “s o c i ét é e u r o p ée n n e ” (V e r s a i l l e s C o m m e r c i a l R e g i s t e r # B 322 306 440), o r i t s s u b s i d i a r i e s i n t h e U n i t e d S t a t e s a n d /o r o t h e r c o u n t r i e s . A l l o t h e r t r a d e m a r k s a r e o w n e d b y t h e i r r e s p e c t i v e o w n e r s . U s e o f a n y D a s s a u l t S y s t èm e s o r i t s s u b s i d i a r i e s t r a d e m a r k s i s s u b j e c t t o t h e i r e x p r e s s w r i t t e n a p p r o v a l.SOLIDWORKS PRODUCT DEVELOPMENT SOLUTIONS SOLIDWORKS software provides users with intuitive 3D development environments that help maximize the productivity of your design and engineering resources to create better products faster and more cost-effectively.SOLIDWORKS Simulation comes in several different packages, depending on whether the user is a designer, an analyst, or both.SIMULATION STANDARD SIMULATION PROFESSIONAL SIMULATION PREMIUM SIMULATION ENGINEER FLOW SIMULATION SOLIDWORKS PLASTICS Design for StrengthThermal Analysis Design for Endurance(high cycle fatigue)Easy multi-physicsNon-Linear AnalysisDynamic AnalysisMulti-Scale, Non-LinearLarge displacement contactproblemsComplex material problemsHigh and Low Speed fluid flowInternal and External fluid flowConjugate heat transferMixing flowsPlastic part validationMold design validation。
基于有限元方法的陀螺仪的盘型制动系统的尖叫分析作者:Jaeyoung Kang【摘要】本文对一辆车的制动系统中旋转阀瓣接触两个固定垫的动力失稳性进行了研究。
在现行的近似几何中,盘被有限元分析法以帽盘型结构为模型。
从参考坐标系和移动坐标系见的坐标变换,对盘和垫之间的接触运动学进行了阐述。
通过引入统一的二维网的方法来构造阀瓣相应的陀螺矩阵。
陀螺仪的非保守性制动系统的动力不稳定性是对系统参数的数值预测。
结果表明, 尖叫声倾向于转速,转速取决于参与尖叫声模式下的振动模式。
而且,它强调摩擦系数的负斜率对在盘的面内扭转模式下产生尖叫声起着至关重要的作用。
【关键词】陀螺仪;盘型制动;制动尖叫;耦合模式1.介绍盘式制动尖叫已经被许多学者研究了数十年。
通过对尖叫机械的研究积累了许多有价值的信息。
Kinkaid等[1]提供了关于各种盘型制动尖叫研究的概述。
Ouyang 等[2]发行了以汽车盘型制动尖叫的数值分析为集中研究的评论性文章。
他们显示一个主要研究制动尖叫的方法,是线性稳定分析。
从线性化的运动微分方程来看,真正的部分特征值被计算出来,用于决定均衡的稳定性。
在文献中,有两个关于线性尖叫分析的主要方向:静态平稳的复杂特征值分析——滑动平稳[3–8]和旋转制动系统的稳定性分析[9–12,14]。
固定盘和垫的静态的滑动稳定的稳定性分析提供尖叫原理作为频繁摩擦领域里的合并模式的特性。
Huang等[6]使用本征值摄动法发展必要的条件没有直接的本征结果。
Kang等[7]推导了盘对之间的合并模式的封闭解。
由于固定盘假设,有限元(FE)方法被容易地应用于上面提到的评论性文章[2]. 同样的,Cao 等[13]从一个有移动垫和固定盘的FE盘型制动模型模型研究了移动荷载效应,因此,陀螺仪的影响被忽视了。
Giannini等[15,16]验证其合并模式行为,通过使用实验尖叫频率作为尖叫开始。
另一方面,旋转盘型制动的稳定性已经调查了分析的方法。
锂离子电池硅薄膜电极充电膨胀的有限元仿真及其实验验证季家磊;朱孔军;刘鹏程;钱国明;王裕;刘劲松【摘要】硅基负极锂离子电池材料因其具有高的理论容量(4200m Ah/g)而成为最有希望的高容量负极材料之一.但硅负极在充放电过程中的体积效应,将引起电极材料粉化以及循环性能变差.为解决上述问题,将硅与惰性过渡金属材料复合,过渡金属充当体积效应的缓冲层.本文利用有限元软件abaqus对比了三种不同的硅薄膜材料(Si/Si-M n/Si-Zr).通过磁控溅射方法制备了上述三种硅薄膜材料,并对其进行了SEM、XRD、循环性能等测试,实验得出的结论与仿真结果一致,加入的过渡金属材料有利于缓解体积效应,且Mn材料的缓解效应更强.%Si is the most promising anode material for high energy lithium ion battteries because of its high specific capacity(4200mAh·g -1).But its undesirable volume enpansion results in me-chanical degration and capacity reduction.It is a promising way to combine Si and inert metal to relieve the expansion duringLi+insertion/extraction.In this article,use Abaqus to compare three different Si thin films(Si,Si-Mn,Si-Zr).Si thin film was deposited on Cu foil by magne-tron supttering for use as lithium ion battery anode material.The electrochemical performance of Si film was investgated by cyclic voltammetry and constant current charge/discharge test.The results consistent with simulation.The use of metal material is useful for the electronical per-formance and Zr is more useful than M n.【期刊名称】《电池工业》【年(卷),期】2017(021)006【总页数】9页(P19-27)【关键词】锂离子电池;硅薄膜负极;惰性金属;Abaqus;磁控溅射【作者】季家磊;朱孔军;刘鹏程;钱国明;王裕;刘劲松【作者单位】南京航空航天大学航空宇航学院,江苏南京 210016;南京航空航天大学航空宇航学院,江苏南京 210016;广州大学机械与电子工程学院,广东广州510006;南京航空航天大学航空宇航学院,江苏南京 210016;南京航空航天大学材料科学与工程学院,江苏南京 210016;南京航空航天大学材料科学与工程学院,江苏南京 210016【正文语种】中文【中图分类】TM910.21 IntroductionDue to their advantages of high energy density, long life, low toxicity and environmental friendliness, lithium-ion batteries(LIBs) have become the most promising and widely applied rechargeable batteries.[1] LIBs have been widely used in portable electronics such as mobile phone, digital camera, DV, laptop, and (hybrid) electrical vehicles. The theoretical capacity of commercial graphite (used as anode) is only 372mAh/g[2], and can not meet the increasing demands for lithium-ion batteries with high energy density and long cycling life. In recent years, the development of new high capacity anode material has attracted significant interest. It is well known that some elements can electrochemical react with Li with high capacity.Some alloying elements with high theoretical capacities, such as Si, Sn, Ge Al[3-6], and conversion electrodes such as NiO, and Co3O4[7-8],have been studied extensively. Among these material, Si has high theoretical capacity,4100mAh/g, ten times of graphite[9]. However, Si shows a massive volume expansion/contraction during Li+ insertion/extraction, larger than 300% after fullly lithium insertion[10]. This causes the pulverization of Si particle and loose contacts between Si particles and current collector, which will further result in mechanical in mechanical instability and poor cyclability[11-13]. To solve such problems, combine Si and inert metal materials which can relieve the huge volume change of Si thin films during lithiation and delithiation. Researchers have made attempts to improve the electrochemical performance of Si thin films as anode material, among which, the introduction of a secondary material is an effective way[14-16].In this study, choose secondary materials which have good conductivity and ductility and act as buffer to alleviate the particle pulverization. Use Abaqus to compare the stree and strain in three different thin films(Si, Si-Mn, Si-Zr) during Li+ insertion/extraction and analyse the role of the inert metal. Then, fabricate above Si thin films by magnetron supttering. The electrochemical performance of Si film was investgated by cyclic voltammetry and constant current charge/discharge test. The experimental results consist with the simulation. The use of metal material is useful for the cycling performance and Mn is more useful.2 Finite Element ModelLi+ insertion will result in a distorted lattice, volumetric expansion, mechanical stresss occures because of the constraint of Cu substrate. The size and stiffness of the substrate(Cu foil) is much lower than Si thin film, the deformation of Cu foil is then much lower than Si thin film and can be neglected, we assume the substrate to be rigid. Cracking and interface debonding are not considered, body force and inertia effects are neglected. Mechaniacl deformaion is thought to be quasi-static because it is much slower than diffusion process.An axisymetric finite element model under a cylindrical polar coordinate system(r,θ,z) is used in Abaqus. Si thin film is assumed to be homogeneous and isotropic and be firmly bonded to the rigid substate. Because mechanical stress and diffusion process influence each other, fully coupled thermal-mechanical transient analysis procedure is used. First-order elements are used for the highly nonliner problem, finite element size is set to 1% of the height of Si thin film and fine mesh is used due to stress concentration. To improve convergence of the nonliner problem, liner search algorithm and maximum 5 interations are used.There is no diffusion-stress aanalysis in Abaqus,use the method proposed by Prussin[17] as convention. Mechanical response under concetration loading is analogous to that under temperature loading, stress caused by diffusion is analogous to thermal stress.Extending the 1D relation given by Prussin[17] to 3D, the constitutive equation for diffudsion-induced deformation of an elastic solid can be expressed(1)Fig.1 Structure of thin filmwhere εij(i,j=1,2,3) are componts of strain tensor; σij(i,j=1,2,3) are componts of stress tensor; c(mol m3) is concentration of diffusion componts; Ω is partial molar volume representing v olume expansion caused by diffusion of Li+; E is elastic modulus; υ is posson’s ratio. Stress caused by diffusion is analogous to that caused by temperature gradient, Ω/3 plays the same role as thermal expansion coefficient in thermal stress analysis.2.1 Structure and MaterialThe model of anode is based on the 2016-type cell which is used to be tested later. The anode of 2016-type cell is wafer thin film The thickness and radius of the Si thin film is D and R, the thickness of transition metal material is d. According to 2016-type cell, R is set to be 6μm. BourderauS[18] fabricated the Si thin film with 1.2μm which had bad cycling performance, while thin film with 275nm[19] had better cycling performance, thus D is set to be 500nm. Transition metal just works as buffer layer and not participate in LI+ insertion/extraction, d is smaller than Si and set to be 200nm(Fig. 1.).Based on volumes of lithiated silicon at different Li-Si alloy phases[20], and linear relations between Li fraction and elastic constants[21- 22], dependence of elastic constants on concentration c (fmol mm-3) is expressed.E=E0+k1 c,υ=υ0+k2 c.(2)Where E0=130Gpa, V0=0.22[23]. k1= -0.13Gpa.μm3fmol-1,k2=-0.00047μm3fmol-1(minus k1、k2 represents the soften of Si electrode during lithium intercalation.)The choice of transition metal must have good ductility, it acts as the buffer to alleviate the huge expansion, at the same time, it doesn’t act with Li+. Metal choosed here is Mn and Zr.2.2 Boundary ConditionAs metioned previous,the structure of the electrode is wafer type and symmetry, also the electrode is surrounded by invariant Li-ion concentration,the electrod can be treated as a symmetric finite model, and for simplify, we choose a section for analysis.The initial condition iswhen t=0, c=0.(3)In potentiostatic operation,the electrode surfaces are surrounded by an invariant Li-ion concentration, cs, so the concentration of Li-ion on the top surface and edge surface is fixed.when 0<t<t1, r=R, c=cs.(4)when 0<t<t1, z=h, c=cs.(5)Cu foil is rigid substrate and doesn’t take part in Li+ diffusion,(6)Under the cylindrical polar coordinate system, the structure, boundary conditions and loading conditions are all axisymmetric.when t>0,r=0, ur=0.(7)Volume change consistsin stress because of the constraint of substrate. Because the film is firmly adherent to the substrate, there is no lateral displacements occures on the interface.when t>0,z=0,ur=uθ=uz=0.(8)There is no mechanical loading applied on the top surface and side sur face.when t>0,在z=h处,σz=0.(9)when t>0, r=R, z>0, σr=0.(10)3 Simulation Results3.1 Concentratin, Displacement and Stress FieldsThe concentration field before fully insertion is showed in Fig. 2a. Due to the edge diffusion, concention is dependent on radial coordinate. For the central region of the electrode, concentration is dependent on axial displacement.The displacement and stress field after fully insertion is showed in Fig. 2b-e.Fig. 2d-e. shows the expansion caused by lithium-ion insertion includes radial extension and bending.The radial displacement is concentrated at the edge of the top surface and the maximum radial displacement occures at the edge on the top surface, also there is little radial displacement in the central region of the film.The maximum axial displacement occures at the center of the top surface. Axial displacement in the central region can be regarded to be independent of radial coordinate. Due to the fixed constraint of the rigid substrate, negative axial displacement is possible near the edge on the interface. A dome-like morphology is formed due to the axial and lateral expansions.Fig.2 Concentration, displacemt and stress fields (a.concentration field, b.stress field, c, d, e. displacement field in equilibrium state) Fig.2b shows the stress caused by lithium-ion insertion mainly occures at the center of the top surface and the edge of the bottom surface.3.2 ComparasionofDisplacement/StressFieldsinDifferentSi-MThinFilms The displacement after fully insertion is showed in Fig.3. The distribution of displacement in different Si-M electrode is similar. No matter the total displacement or vertional/radial displacement declines while the metal is used.Same conclusion can be achieved in the stress fields (Fig. 4). The maximun of von mises of Si-M thin film is less than Si thin film. Both the results of displacement and stress comparasion fields reveals that use of metal is beneficial to the Si anode to experience less destroy during insertion.Fig.3 Comparasion of displacement fields (a.total, b.radial, c.axial displacement)Fig. 4 Comparasion of stress fields(a.Si, b.Si-Mn,c.Si-Zr)4 Experimental Results4.1 ExperimentalSi thin films were prepared in an PVD 75 multi-target magnetron sputtering system(KJLC, Co.). The samples were deposited on both Si wafer for thickness measurement and Cu foil for electrochemical measurements. The target was N-type monocrystalline Si with 2 inch diameters and 99.999% purity, Mn with 99.9% purity and Zr with 99.5% purity. The target-substrate distance of the sputtering system was set to be 50mm. After the base pressure reached 8.3×10⁻⁴ Pa, Ar (99.999%) was introduced into the chamber. The working pressure was kept at 8mtorr. Si thin films were deposited using a constant radio frequency power supply of 100W.Thefilm thickness was controlled by deposition time.The amount of deposited Si was calculated assuming a density of 2.33g·cm-3 for the Si thin film.The morphology and accurate thickness of Si thin films were measured by the field emission scanning electron microscopy (FSEM, SIGMA, Germany). The phase structure of was analyzed by X-ray diffraction (XRD, Bruker D8 Advance, Germany).To evaluate the electrochemical properties of the Si thin film anode, 2025-type half-cells were assembled in an argon-filled glove box with H2O andO2 concentrations of less than 1ppm. A lithium metal foil was used as a counter electrode, and Celgard2400 was used as a separator. Theelectrolyte solution was 1.0 M LiPF6 in EC/DEC (1∶1 vol/vol). Cyclic voltammetry measurements were performed using an electrochemical workstation (Princeton PARSTAT MC) at a scan rate of 0.01 mV in the potential range 0V~1.5V.Galvanostatic charge/discharge measurement was carried out using a Land battery test system (LAND CT2001A) with the cut off potentials being 0V versus Li/Li+ for discharge and 1.5V versusLi/Li+ for charge.4.2 Results and DiscussionFig.5 SEM images(a.cross-ssection, subface of b.Si, c. Si-Mn, d. Si-Zr)The cross-sectional SEM image of Si thin film deposited on a Si wafer is presented in Fig. 5a. The thickness of the dense Si、Mn、Zr can be observed,and the corresponding growth rate can be calculated,finally actual operating time was obtained accoring to the target thickness(Tab 1). Table1SputteringParameterTargetSiMnZrPower(W)100100100Time(min)606030Th ickness(nm)320200170Rate(nm/min)5.33.35.7TargetThickness(nm)500 200200ActualTime(min)946035Fig.6. shows the XRD pattern of Si thin film deposited on Cu foil. All the diffraction peaks are attributed to the Cu foil, and no peak of Si appears, especially the typical peak for crystal Si at 28°. This indicates that the Si thin film is amorphous.Fig.6 XRD patterns of Si thin filmsThe L+ insertion/extraction reactions of Si thin film were studied by cyclic voltammetry. For all of the three thin films, three cyclic voltammetriccurves of the Si thin film are shown in Fig. 7. In the first scanning cycle, there is a cathodic peak at 0.32V, which disappears from the second cycle. This cathodic peak is attributed to the formation of a solid electrolyte interphase (SEI) layer due to decomposition of electrolyte on the film surface. Two cathodic peaks at 0.20V and 0.05V, as well as two anodic peaks at 0.50V and 0.33V, are observed on all three cyclic voltammograms; these are ascribed to the electrochemical reactions of Li+ insertion and extraction in the Si thin film. The slight difference in the intensity and the potential for each peak can be attributed to the kinetic effect involved in the cyclic voltammetry measurement.Fig.7 Cyclic voltammetry plots (scanning rate 0.1Mv/s,potential range0V~1.5V, a. Si; b.Si-Mn; c.Si-Zr)Fig.8.shows the first three times of the discharge/charge curves. The first discharge capacity of the Si, Si-Mn, Si-Zr thin film is 2045.0mAh·g-1, 2203.1mAh·g-1, 2505.0mAh·g-1, and initial coulombic efficiency is 101.76%, 103.98%, 102.89%. The first and second reversible capacity of the Si-Mn thin film is 1900.3mAh·g-1 and 1976.0mAh g-1,for Si-Zr, 1997.0mAh·g-1, 2054.7mAh·g-1,which is much larger than that of a graphiteanod e(1662.9mAh·g-1, 1692.3mAh· g-1,respectively). The irreversible capacity is attributed to the formation of a SEI layer in the first cycle. In evidence, a SEI-formation voltage plateau is observed near 0.32V, which disappears in the second cycle. This observation is also in good agreement with CV results.Fig.8 Discharge/charge curves (a. Si; b.Si-Mn; c.Si-Zr)Cycling performance of the Si thin films are shown in Fig. 9 a-c. The first reversible capacity 100mA/g for Si, Si/Mn, Si/Zr is 1692.3mAh/g,1830.8mAh/g, 1955.6mAh/g respectively, and 71.2%, 83.9%, 88.2% capacity remained after 50 cycles.The introduce of transition metal can enhance both the first reversible capacity and the capacity retention effectively, which proves that the metal can improve the cycling performance of Si thin films. Rate performance of the Si thin films are shown in Fig. 9 d-f.Fig.9 Eletronical performance of Si thin films (Cycling performance of a.Si, b. Si-Mn, c. Si-Zr, rate performance of d. Si, e. Si-Mn, f. Si-Zr)To further evaluate the performance of Si thin films, the rate capability measurements (Fig. 9d-f) at the quickly increased current density from 0.1A/g to 1A/g were carried out. For Si thin films, the discharge capacity of 2045.3mAh/g, 1413.2mAh/g, 1128.8mAh/g, 919.5mAh/g, 732.7mAh/g can be obtained at 0.1A/g, 0.2A/g, 0.3A/g, 0.5A/g, 1.0A/g, 0.1A/g. For Si-Mn, 2203.1mAh/g, 1718.9mAh/g, 1535.7mAh/g, 1329.6mAh/g, 1044.3mAh/g can be obtained, and for Si/Zr, 2505.0mAh/g, 1859.4mAh/g, 1661.2mAh/g, 1500.6mAh/g, 1117.8mAh/g can be delievered. Although suffering from the rapid change of the current density, the cell can still exhibit a stable cycling at each current. Importantly, 80% of the first reversible capacity can be remained for Si thin film when the current density is turned back to1A/g, and for Si-Mn, Si-Zr, 89.0% and 92.9% can be remained.It proved that use of metal is beneficial to the electrocal performance again.5 ConclusionIn this article, Si and inert metal is combined to relieve the expansion during Li+ insertion/ extraction. Use Abaqus to compare three different Si thin films (Si, Si-Mn, Si-Zr).we found that the use of inert metal reduces the displacement and stress induced during the Li+ insertion. Also, Si-M thin film used as anode material.was deposited by magnetron supttering The morphology of the Si-M thin films are similar, and XRD results reveals that the structure of Si thin films is amorphous. The electrochemical performance of Si thin films consistents with the simulation, use of metal can relieve the expansion and result in better cycling and rate performance. Among Mn and Zr, Mn is more useful.References:【相关文献】[1] Goodenough J B, Park K S, The Li-ion Rechargeable Battery: A Perspective[J],American Chemical Society, Journal,2013. 135(4):1167-76.[2] Wachtler M, Besenhard J O, Winter M, Tin and tin-based intermetallics as new anode materials for lithium-ion cells[J], Journal of Power Sources, 2001 , 94 (2) :189-193.[3] Obrovac M N, Krause L J, Reversible Cycling of Crystalline Silicon Powder[J],Journal of the Electrochemical Society, 2007,154 (2) :A103-A108.[4] Graetz J, Ahn C C, Yazami R, and Fultz B, Nanocrystalline and Thin Film Germanium Electrodes with High Lithium Capacity and High Rate Capabilities[J], 2004, 151 (5): A698-A702.[5] Wolfenstine J,Foster D,Read J, Behl W K, and Luecke W, Experimental confirmation of the model for microcracking during lithium charging in single-phase alloys[J], Journal of Power Sources, 2000 , 87 (1-2) :1-3.[6] Liu Y, Hudak N S, Huber D L, Limmer S J, Sullivan J P, and Huang J Y, In situ transmission electron microscopy observation of pulverization of aluminum nanowiresand evolution of the thin surface Al2O3 layers during lithiation-delithiation cycles[J], Nano Letters, 2011, 11 (10) :4188.[7] Wang Y, Qin Q Z, A Nanocrystalline NiO Thin-Film Electrode Prepared by Pulsed Laser Ablation for Li-Ion Batteries[J], Journal of the Electrochemical Society, 2002,149 (7):A873-A878.[8] Fu Z W, Wang Y, Zhang Y, and Qin Q Z, Electrochemical reaction of nanocrystallineCo3O4, thin film with lithium[J], Solid State Ionics, 2004,170:105-109.[9] Huggins R A, Advanced batteries: Materials science aspects[M], SpringerBerlin, 2009.[10] Lee S J, Lee J K, Chung S H, Lee H Y, Lee S M, and Baik H K, Stress effect on cycle properties of the silicon thin-film anode[J],Journal of Power Sources, 2001, 97: 191-193. [11] Winter M, Besenhard J O, ChemInform Abstract: Electrochemical Lithiation of Tin and Tin‐Based Intermetallics and Composites[J], Electrochimica Acta, 1999. 45:31-50.[12] Yoshio M, Tsumura T, Dimov N, Electrochemical behaviors of silicon based anode material[J], Journal of Power Sources, 2006 , 153 (2) :375-379.[13] Wang D Y, Wu X D, Wang Z X, and Chen L Q, Cracking causing cyclic instability of lifepo 4, cathode material[J], Journal of Power Sources, 2005, 140 (1) :125-128.[14] Datta M K, Maranchi J, Chung S J, Epur R, Kadakia K, and Jampani P, Amorphous silicon-carbon based nano-scale thin film anode materials for lithium ion batteries[J], Electrochimica Acta, 2011, 56 :4717-4723.[15] Zhou Y N, Li W J, Chen H J, Liu C, Zhang L, and Fu Z, Nanostructured nisi thin films asa new anode material for lithium ion batteries[J], Electrochemistry Communications, 2011,13 (6) :546-549.[16] Imai Y, Watanabe A, Energetics of compounds related to Mg 2 Si as an anode material for lithium-ion batteries using first principle calculations[J], Journal of Alloys & Compounds, 2011, 509 (30) :7877-7880.[17] Prussin S, Generation and Distribution of Dislocations by Solute Diffusion[J], Journal of Applied Physics, 1961 ,32(10):1876-1881.[18] Bourderau S, Brousse T, Schleich D M, Amorphous silicon as a possible anode material for Li-ion batteries[J], Journal of Power Sources, 1999 ,81-82 (9) :233-236. [19] Chen L B, Xie J Y, Yu H C, and Wang T H, An amorphous si thin film anode with high capacity and long cycling life for lithium ion batteries[J], Journal of Applied Electrochemistry, 2009 , 39 (8) :1157-1162.[20] He Y, Yu X, Li G, Wang R, Li H, and Wang Y, Shape evolution of patterned amorphous and polycrystalline silicon microarray thin film electrodes caused by lithium insertion and extraction[J], Journal of Power Sources, 2012 , 216 (11) :131-138.[21] Shenoy V B, Johari P, Qi Y, Elastic softening of amorphous and crystalline Li-Si Phases with increasing Li concentration: A first-principles study[J], Journal of Power Sources, 2010,195 (19) :6825-6830.[22] Zeng Z, Liu N, Zeng Q, Ding Y, Qu S, and Cui Y, Elastic moduli of polycrystalline li15si4, produced in lithium ion batteries[J], Journal of Power Sources, (2013), 253 :431-431. [23] Hopcroft M A, Nix W D, Kenny T W, What is the Young's Modulus of Silicon[J], Journal of Microelectromechanical Systems, 2010 ,19(2):229-238.。
时效热处理英语The realm of materials science is a captivating dance between structure and property, a constant pursuit of tailoring materials to meet the demands of our ever-evolving world. Among the many tools in this pursuit, heat treatment stands out as a transformative process, capable of unlocking the hidden potential within metals and alloys. It's like an artist's brush, delicately manipulating the internal microstructure, the very essence of a material, to paint a masterpiece of desired properties. Age hardening, a specific type of heat treatment, plays a pivotal role in this artistic endeavor. Imagine a metal alloy as a bustling city, its atoms arranged in a well-defined lattice, much like buildings lining the streets. Introducing specific alloying elements is akin to inviting new residents into the city, ones who bring their unique characteristics and preferences. These new residents, finding their place within the existing lattice, can create local distortions, like subtle shifts in the cityscape, ultimately making the material stronger and more resistant to deformation. The magic truly unfolds during the age hardening process. The alloy is first heated to a high temperature, dissolving these alloying elements into a solid solution, much like a vibrant melting pot of cultures. Then, as the alloy is rapidly cooled, or quenched, these dissolved elements become trapped, like suspended particles in a liquid, unable to return to their original state. This creates a supersaturated solid solution, a temporary and unstable state, like a city holding its breath, waiting for the next act to unfold. This is where the aging process comes in, a patient wait at a lower temperature, allowing the alloy to relax and find a new equilibrium. The trapped alloying elements begin to precipitate out of the solid solution, forming tiny clusters or precipitates, like new communities establishing themselves within the city. These precipitates act as barriers to the movement of dislocations, the line defects that enable plastic deformation in metals, effectively strengthening the material. It's like strategically placing roadblocks within the city, making it more difficult for anything to move through. The beauty of age hardening lies in its controllability. By adjusting the aging time and temperature, the size and distribution of these precipitates can be fine-tuned, leading to a spectrum of mechanical properties. Imagine an artist carefully selecting the colors andbrushstrokes to evoke specific emotions in a painting. Similarly, a materials engineer can tailor the strength, hardness, and ductility of an alloy to suit specific applications, from the lightweight yet robust aluminum alloys in aircraft to the wear-resistant steel in gears and bearings. Age hardening, therefore, is not just a process but an art form, a testament to the ingenuity of materials science. It allows us to sculpt the inner structure of materials, transforming them from mere lumps of metal into the building blocks of our modern world, enabling us to reach for the skies and delve into the depths of the Earth, all thanks to the intricate dance between atoms orchestrated by the subtle touch of heat.。
Computational Fluid Dynamics Computational Fluid Dynamics (CFD) is a branch of fluid mechanics that uses numerical analysis and data structures to solve and analyze problems that involve fluid flows. It has become an integral part of engineering and science, playing a crucial role in the design and optimization of various systems and processes. However, despite its widespread use and importance, CFD also presents a number of challenges and limitations that need to be addressed. One of the main challenges of CFD is the accuracy of the simulations. While CFD models are based on mathematical equations that describe fluid flow, these equations are often simplified and approximated to make them solvable using numerical methods. As a result, the accuracy of CFD simulations heavily depends on the assumptions and simplifications made, as well as the quality of the input data. This can lead to discrepancies between the simulated results and real-world observations, making it crucial for engineers and scientists to carefully validate and calibrate their CFD models. Another challenge of CFD is the computational cost associated with solving complex fluid flow problems. CFD simulations require significant computational resources, especially for high-fidelity simulations that involve complex geometries, turbulent flows, and multiphase interactions. This often leads to long simulation times and high computational expenses, limiting thepracticality of using CFD for certain applications. As a result, researchers are constantly seeking ways to improve the efficiency of CFD solvers and algorithms, as well as exploring new computing technologies such as parallel processing and cloud computing to reduce the computational burden. In addition to accuracy and computational cost, CFD also faces challenges related to the validation and verification of its models. Validating CFD simulations against experimental data is essential for establishing the credibility of the results and ensuring their reliability for making design decisions. However, experimental validation can be costly and time-consuming, and it may not always be feasible for certain applications. This raises questions about the reliability of CFD predictions and the level of confidence that can be placed in the simulation results, especially in critical engineering applications such as aerospace and automotive design. Moreover, the complexity of fluid flow phenomena presents a significant challengefor CFD, particularly in simulating turbulent flows and multiphase flows. Turbulent flows are characterized by chaotic and unpredictable behavior, making them notoriously difficult to model and simulate accurately. Similarly, multiphase flows, which involve the interaction of different phases of matter such as gas-liquid or liquid-solid, pose significant challenges due to the complex interfacial dynamics and phase interactions. As a result, CFD practitioners often resort to empirical modeling and simplifications to tackle these complexities, which can introduce uncertainties and limitations in the simulation results. Despite these challenges, CFD continues to advance and evolve, driven by ongoing research and development efforts aimed at addressing its limitations. Researchers are exploring new modeling approaches, such as large eddy simulation (LES) and direct numerical simulation (DNS), to improve the accuracy of turbulent flow predictions. They are also investigating new numerical methods and algorithms, such as immersed boundary methods and lattice Boltzmann methods, to enhance the capability and efficiency of CFD solvers. Furthermore, the integration of machine learning and artificial intelligence techniques into CFD holds promise for improving the predictive accuracy and reliability of simulations, particularly in cases where traditional modeling approaches fall short. In conclusion, while CFD presents several challenges and limitations, it remains a powerful tool for understanding and predicting fluid flow behavior in a wide range of engineering and scientific applications. By addressing the accuracy, computational cost, validation, and complexity challenges, ongoing research and development efforts continue to push the boundaries of what is achievable with CFD, opening up new possibilities for innovation and discovery in the field of fluid mechanics. As CFD continues to evolve, it is essential for practitioners to remain vigilant in critically evaluating and improving the reliability of CFD simulations, ensuring that they provide meaningful and trustworthy insights for engineering design and decision-making.。
Simulation and Analysis in SolidWorksSolidWorks is a powerful computer-aided design (CAD) software that is widely used in the engineering and manufacturing industries. One of its most valuable features is its ability to simulate and analyze various aspects of a design, helping engineers and designers make informed decisions before moving forward with the production process. In this article, we will explore the simulation and analysis capabilities of SolidWorks and discuss how they can enhance the design process.SolidWorks offers a range of simulation tools that enable engineers to test and evaluate the performance of their designs under various conditions. These tools can simulate physical phenomena such as structural behavior, heat transfer, fluid flow, and more. By accurately predicting how a design will behave, engineers can make adjustments and improvements early in the design process, saving both time and resources.One of the key simulation features in SolidWorks is Finite Element Analysis (FEA). FEA allows engineers to analyze the structural integrity and strength of a design by dividing it into smaller elements and solving mathematical equations to describe their behavior. This analysis helps identify areas of high stress or potential failure, enabling designers to optimize their models to meet specific requirements.SolidWorks also offers Computational Fluid Dynamics (CFD) simulation capabilities. CFD allows engineers to predict the behavior of fluids, such as air or liquid, within or around a design. This analysis can help optimize the design of heat exchangers, ventilation systems, and other components that rely on fluid flow. By simulating fluid behavior, engineers can make informed decisions about the placement of cooling channels, optimize the efficiency of their designs, and ensure proper heat dissipation.Another valuable tool in SolidWorks is the Motion Analysis feature. This feature enables engineers to simulate the movement and interaction of parts within an assembly. By defining constraints, forces, and motion inputs, engineers can evaluate how a design will perform in real-world conditions. Motion Analysis allows designers to detect anyinterference or collisions, ensure optimal functioning of mechanisms, and improve overall performance.Thermal analysis is another important simulation capability in SolidWorks. This feature allows engineers to predict and analyze the thermal behavior of their designs. By simulating heat transfer, heat dissipation, and temperature distribution, engineers can optimize their designs to withstand extreme temperatures, prevent overheating, and ensure the longevity of their products.Aside from these simulation features, SolidWorks also provides tools for analyzing mold flow, structural vibrations, and even electrical systems. These capabilities make SolidWorks a comprehensive software for simulating and analyzing various aspects of a design, ensuring that engineers and designers have a thorough understanding of their products before starting the production process.The benefits of using simulation and analysis in SolidWorks are numerous. First and foremost, it allows engineers to identify and rectify design flaws early in the process, preventing costly mistakes and rework. By simulating real-world conditions, engineers can optimize their designs to meet performance criteria and minimize risks associated with structural failures, thermal issues, or fluid flow problems.Additionally, simulation and analysis in SolidWorks facilitate collaboration within a team. Engineers can easily share their simulation results and discuss potential improvements or modifications, leading to a more streamlined and efficient design process. Furthermore, these simulation capabilities enable engineers to communicate their design intentions and analysis findings to stakeholders, such as clients or manufacturing teams, ensuring a clear and accurate understanding of the design's functionality and performance.In conclusion, simulation and analysis in SolidWorks are instrumental in enhancing the design process. By allowing engineers to predict and evaluate the behavior of their designs under various conditions, SolidWorks enables them to make informed decisions, optimize their designs, and minimize risks. The comprehensive simulation tools within SolidWorks, such as FEA, CFD, motion analysis, and thermal analysis, provide engineerswith a powerful toolkit to ensure the success of their designs. With its ability to streamline collaboration and improve communication, SolidWorks remains a top choice for engineers and designers in the industry.。
a r X i v :q -bio/4129v1[q-bi o.BM]5Dec24Off-lattice simulation of the solid phase DNA amplification M.J.Krawczyk ∗and K.Ku l akowski †Department of Applied Computer Science,Faculty of Physics and Applied Computer Science ,AGH University of Science and Technology al.Mickiewicza 30,PL-30059Krak´o w,Poland.∗E-mail:∗krawczyk@.pl,†kulakowski@.pl February 9,2008Abstract Recent simulations of the solid phase DNA amplification (SPA)by J.-F.Mercier et al (Biophys.J.85(2003)2075)are generalized to include two kinds of primers and the off-lattice character of the primer distribu-tion on the surface.The sigmoidal character of the primer occupation by DNA,observed experimentally,is reproduced in the simulation.We dis-cuss an influence of two parameters on the efficience of the amplification process:the initial density p 0of the occupied primers from the interfacial amplification and the ratio r of the molecule length to the average dis-tance between primers.The number of cycles till the saturation decreases with p 0roughly as p −0.260.For r =1.5,the number of occupied primers is reduced by a factor two,when compared to the case of longer molecules.Below r =1.4,the effectivity of SPA is reduced by a factor 100.PACS numbers:82.37.Rs,07.05.Tp 1Introduction The standard polymerase chain reaction (PCR)allows to produce multiple copies of DNA in vitro .It is known as a revolutionary technique for molec-ular biology [1].The reaction takes place in the whole volume of a vial.If different molecules of DNA are to be amplified,the reaction products must be separated by other methods [2].This separation is successfully omitted in a re-cently introduced technique of the solid phase DNA amplification [3,4],which can be classified as an application of the emerging biochip technology [5,6].The technique,termed as SPA,contains three stages.At first,primers of two kinds are attached by their 5’ends to a solid surface.They are to be com-plementary to two ends of the investigated DNA strands,then their proportions should be 1:1.Next,small amount of DNA is attached to some of the primers in one thermal cycle.This stage is termed as the interfacial amplification (IA).At third stage (surface amplification,SA),the solution of DNA is washed out,and it is only the attached strands which are multiplicated in subsequent cycles.They attach their free ends to neighbouring primers.Next,they are copied by standard PCR.One thermal cycle can be separated in three distinct steps -1annealing,extension and denaturation,which are repeated in an iterative way. In this way,the concentration of occupied primers(i.e.primers with attached DNA)increases.In thisfinal stage of SPA the area of occupied primers widens by a slow motion of its borders:the border velocity is not larger than the strand length per cycle.A detailed and transparent description of the process can be found in[2],together withfirst Monte Carlo simulations.The aim of this work is to investigate numerically the range of experimental parameters,where the surface amplification is effective.Our contribution can be treated as a computational supplement to Ref.[2].However,there are two main differences between our approach and Ref.[2].First,our simulation is performed in the off-lattice scheme,i.e.the positions of the primers on the sur-face do not form a square lattice,but they are randomly distributed.Second, we take into account the fact that there are primers of two kinds.Both mod-ifications are introduced to make the simulation more realistic.In particular, we intend to capture the limitation of SPA which arise when the length of the strands used is of the order of the mean distance between the primers.The dis-tance distribution between primers is deformed by the assumption of the square lattice,and this deformation is particularly strong for short distances.Here this assumption is omitted.On the other hand,once a molecule of DNA is attached to a given kind of primer by one end,its free end can only be attached to the primer of the other kind.If the distance between primers is of the order of the molecule length,this condition additionally limits the surface amplification process.Again,here this limitation is captured properly.We also investigate an influence of other parameters:of the efficiency of the interfacial amplification and of the mutual proportion of two kinds of primers. The results can be useful for designing the range of parameters,where SPA is optimal.If the concentration of occupied primers after the interfacial amplifi-cation is low,the number of SPA cycles must be large,what raises costs.Note that this concentration is connected directly with the density of the investi-gated DNA in the sample,and we are obviously interested in the possibility of detecting low amounts of DNA.In the next section we discuss the values of the input parameters for the calculation.One of them,the densityρ0of occupied primers at the beginning of the simulated process,is the output of IA and therefore it can be treated as a measure of its efficiency.In this section we describe also the simulation method. In subsequent section our numerical results are reported.The text is closed by discussion.2CalculationsIn our computational model we refer to the data on SPA given in Ref.[4]. There,an optimal value of the density of the primers on a surface has been found to be15fmol/mm2.After two cycles of IA and SA,the densityρ0of occupied primers is0.0011fmol/mm2,i.e.a molecule of DNA is attached to one per15000primers.This amount comes mainly from IA[4].Subsequent282cycles of SA lead to an increase ofρto0.0029fmol/mm2.If the process of SPA is performed without washing the sample,IA and SA occur simultaneously.In this case,28cycles lead toρ=0.019fmol/mm2.These data allow to estimate the efficiency of both IA and SA at one cycle of SPA,for the case whenρis small enough.This condition,true at few initial cycles,allows to neglect the slowing down of the amplification because of the overcrowding by occupied primers.Then,the densityρincreases in subsequent cycles of SA by a constant factorα,andρn=αnρ0.From the data given above we deduce thatα28=29/11,i.e.α=1.035.For such a small rate of amplification,the increase ofρinfirst two cycles of IA+SA is due mainly to IA.As we expect that this increase is linear with the number of cycles,we get its value equal to x=ρ0/(1+α)=0.00055fmol/mm2per cycle.For smallρ,at each cycle of IA+SA the density of occupied primers should increase according to the rule:ρn+1=x+ρn∗α(1) Applying this rule again28times withρ0=0.0011fmol/mm2,we getρ28= 0.029fmol/mm2,which is about50percent larger,than the experimental value. We deduce that this value cannot be treated as small,and the effect of a local overcrowding should be taken into account.This means,that Eq.(1)cannot be applied:a simulation is necessary.The area of the surface used for SPA is about1mm2,and the number of primers pN there is equivalent to15fmol,i.e.about9∗109primers.This amount is too large for our computational resources.We work with K=15000 primers,which is equivalent to the area S about1µm2covered with the den-sity15fmol/mm2.To improve statistics,we average the results over k runs. The positions of the primers are selected randomly with a constant probability distribution on a squared area with periodic boundary conditions.Then,DNA strands is attached to some primers.The amount of these primers is a measure of the effectiveness of IA.Simultaneously,it is proportional to the starting value of p for the simulation of SA.The amount of occupied primers isρS=pK(2) The density valueρ=0.0011fmol/mm2is equivalent to p=1/15000,i.e. one occupied primer as a starting point for the simulation.Two kinds of primersfit to two ends of the investigated molecules of DNA. Let us denote the primers by±1.For each occupied primer i,the algorithm of the simulation of SA selects a primer j which is i)its closest neighbour ii)of opposite sign and iii)it is free.The additional condition is that the distance between i and j cannot excess the molecule length.During each cycle of SPA, the molecule attached to i with one end is attached with another end to j with probability depending on the distance according to the Gaussian function, multiplied by a phenomenological factorγ.The choice of the Gaussian function reflects the random-walk character of the free end of the molecule.The factorγis set as to reproduce the experimental value of IA,expressed byα=1.035.This3value means that during one cycle of SPA,only a few percent of DNA strands are amplified.Our algorithm is approximate,because we neglect the possibility that the free molecule end is attached to another primer,which is not the closest one.This simplification is introduced to speed up the calculations.According to the Gaussian distribution,the attaching probability strongly decreases with the distance.That is why this approximation seems to be acceptable.3ResultsIn Fig.1we show the ratio p of the number of occupied primers to their total number against time,the latter expressed in the number N of thermal cycles. The starting value of p is taken as p0=1/15000,and it is due to the amount of primers occupied in the interfacial amplification.The increase of p shown in the picture is a consequence of the surface amplification.The curve is obtained by averaging over14simulations.The error bars are due to the statistics.The sigmoidal curve allows to evaluate the overall dynamics of the process of SA.In Fig.2,the number N of cycles needed to obtain the saturation p=1 is shown as dependent on the number of primers p0occupied by means of the interfacial amplification.As we see,N decreases as p−φ0,at least for p0far from the target value p=1.We getφ=0.264.Note that the data in Fig.2are not equivalent to those in Fig.1.To obtain each point of the plot,a separate simulation is performed.During the process of SA,spatial correlations between occupied primers develop from an initially random configuration.In Fig.3we show the number N of cycles needed for the saturation,against the ratio r=L/d,where L is the molecule length and d=(S/K)1/2is the mean distance between primers.The plot shows a plateau for r>1.8;below this value,N abruptly increases.In Fig.4the limit value of p is shown,which stabilizes after many steps of SA,as dependent on the ratio r.As we see,below r=1.4,the process of SA does not work.In Fig.5we show how SPA is sensitive to a variation of the ratio c of the numbers of two kinds of the primers.Obviously,an optimum of the technique is for c=0.5,when we have in the average the same numbers of the primers appropriate for both ends of the investigated molecules of DNA.However,the method works also for other values of c.We see that for r=2,the saturated state p=1can be reached for the range of c as wide as(0.2,0.8).This means, that for shorter molecules or for a smaller density of primers,the proportion of two kinds of primers should be controlled more precisely.4DiscussionThe exponential character of the results presented in Fig.2allow to evaluate the time of measurement by SA as dependent on p0.The value of p0is directly proportional to the efficiency of the interface amplification,which depends both on the time of IA and on the concentration of DNA in investigated samples.4Further,the results shown in Fig.3prove,that the efficiency of the surface amplification depends on the molecule length only if the latter is of order of the distance d between primers.The same conclusion can be drawn from Fig.4. We note that in this case,d can be evaluated asρ1/2.These results provide a direct information on the range of parameters where the technique of the surface amplification can be used.Also,the obtained limitations of the range of the parameter c can be of interest for applications.Actually,this result show that the technique works quite well even if the proportion of two kinds of primers is between1:4and4:1.A drawback of our simulation is that interactions between the molecules of DNA is not taken into account.This interaction is known to prevent the saturation;the obtained values of p stabilize near1/300instead of1.0[4].This is a severe limitation of the efficiency of the whole technique.However,we expect that with an appropriate rescaling of the value of the parameter of p at saturation,our results remain qualitatively correct.References[1]S.L.Wolfe,Molecular and Cellular Biology,Wadsworth Publ.Co.,Belmont1993.[2]J.-F.Mercier,G.W.Slater and P.Mayer,Biophysical Journal85(2003)2075.[3]D.H.Bing, C.Boles, F.N.Rehman,M.Audeh,M.Belmarsh,B.Kelley andC.P.Adams,in Genetic Identity Conference Proceed-ings,Seventh International Symposium on Human Identification,1996 (/geneticidproc/ussymp7proc/0726.html).[4]C.Adessi,G.Matton,G.Ayala,G.Turcatti,J.-J.Mermod,P.Mayer andE.Kawashima,Nucleic Acid Research28(2002)e87.[5]Microarray Biochip Technology,ed.by M.Schena,Eaton Publ.,Natick,MA2000.[6]Biochip Technology,ed.by J.Cheng and L.J.Kricka,Harwood Acad.Publ.,Bridgeport,NY2001.50.00.20.40.60.81.0020040060080010001200140016001800p(N)N Figure 1:Fraction of occupied primers p against the cycle number N .1001000100001e-050.00010.0010.010.11p 0N(p 0)Figure 2:The number of cycles N needed to obtain the saturation p =1as dependent on the initial density p 0.61400145015001550160016501700175018001850051015202530354045r N(r)Figure 3:The number of cycles N needed to obtain the saturation p =1as dependent on theratio r =L/d .r p(r)Figure 4:The final occupation p as dependent on the ratio r =L/d .7pcFigure5:Thefinal occupation p as dependent on the ratio c.8。