CGDK 使用说明
- 格式:pdf
- 大小:4.32 MB
- 文档页数:15
1、产品概述:CGD-ZK点型可燃气体探测器是本公司研制的一款直接输出RS485数据信号的现场探测器。
该产品具有高稳定,高准确和高智能化的特点,并通过简单设置即可进行现场检测与报警。
目前版本已集成有1路24V报警输出。
该主要应用于需要检测可燃气体的场合中,与控制器配套可显示待检气体的数值指标量,当现场的某种待检气体的指标超出或低于所设置的标准时,系统会自动进行一系列报警动作,如报警,排风,跳闸等(根据用户的不同设置而不同)。
本仪表按国家现行标准GM3836.1-2000《爆炸性气体环境用电气设备第1部分:通用要求》、GB3836.2-2000《爆炸性气体环境用电气设备第2部分:隔爆型“d”》和GB15322.1-2003《可燃气体探测器第一部分:测量范围为0~100%LEL的点型可燃气体探测器》有关规定进行设计,并通过国家级仪器仪表防爆安全检验站的审核。
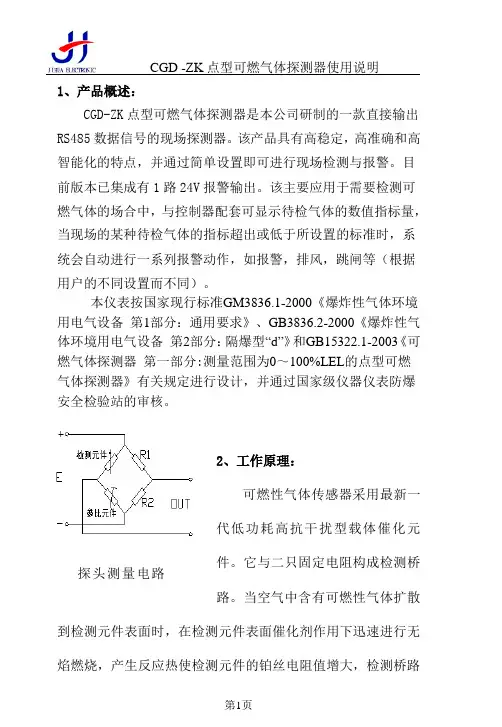
2、工作原理:可燃性气体传感器采用最新一代低功耗高抗干扰型载体催化元件。
它与二只固定电阻构成检测桥探头测量电路路。
当空气中含有可燃性气体扩散到检测元件表面时,在检测元件表面催化剂作用下迅速进行无焰燃烧,产生反应热使检测元件的铂丝电阻值增大,检测桥路输出一个差压信号。
这个电压信号的大小与可燃性气体浓度成正比例关系。
它经过放大后,进行电压电流转换并把可燃性气体爆炸下限值以内的百分含量(%LEL)转换成RS485数据信号输出。
3、技术参数:3.1、探测器工作原理:催化燃烧3.2、量程范围:0~100% LEL●精确度:±3%LEL(≤50%LEL);±5%LEL(>50%LEL)● 零点漂移:≤5%LEL/年3.3、响应时间:T90≤30秒。
3.4、使用环境:温度:-40°C—70°C相对湿度<95%RH3.5 工作电压DC12~24V3.6、系统功率:最大功耗<2W。
3.7、信号输出:RS485数据信号3.8、系统连接线要求:采用四线制接法,单芯线直径≥1.5mm,线长≤1000m。
概述1主要技术性能及指标һ·S-Video输入其中第一路为音视频复用NTSC或黑白视频输入 768 X 576 X 24BIT NETSC: 640 X 480 X 24BIT 对比度色饱和度软件可调 支持计算机内容与图像同屏显示RGB888RGB555及256色模式 支持单场连续场1.2 QP 二组复合视频输入一组复合视频输入可与QP-MPEG的输出连接NTSC或黑白视频输入概述PAL 亮度色调ͼÐθ²¸Ç¹¦ÄÜ 支持任意形状的图像采集 支持裁剪与比例压缩模式 支持RGB8888RGB565µ¥Ö¡Á¬ÐøÖ¡µÄ²É¼¯·½Ê½ 支持四路单声道音频采集两路PAL/NTSC复合视频两路LINE拾音器输入由两个DH-CG300单路模块组成输入信号相当于DH-CG300的视频输入源路2视频压缩部分具有DH-MPEG-V 的所有图像采集压缩功能相关性能及软件编程请参阅DH-MPEG/QPMPEG使用说明书概述1.4 基本结构及工作原理工作原理框图A/D解码将数据送到数据缓冲器比例压缩及数据格式转换后数据目标位置由软件确定也可以是计算机内存由RISC控制将数据传到指定的内存位置DH-CGMPEG原理框图概述1.5 数据格式RGB32 (RGB 8:8:8:8)Pixel Data[31:0]DWORD Byte 3[31:24]Byte 2[23:16]Byte 1[15:8]Byte 0[7:0]Dw0 Alpha R G BRGB24 (RGB 8:8:8)Pixel Data[31:0]DWORD Byte 3[31:24]Byte 2[23:16]Byte 1[15:8]Byte 0[7:0]Dw0 B1 R0 G0 B0 Dw1 G2 B2 R1 G1 Dw2 R3 G3 B3 R2RGB16 (RGB 5:6:5)Pixel Data[31:0]DWORD Byte 3[31:24]Byte 2[23:16]Byte 1[15:8]Byte 0[7:0]Dw0 {R1[31:27],G1[26:21],B1[20:16]}{R0[15:11],G0[10:5],B0[4:0]}概述RGB15 (RGB 5:5:5)Pixel Data[31:0]DWORD Byte 3[31:24]Byte 2[23:16]Byte 1[15:8]Byte 0[7:0]Dw0{0,R1[30:26],G1[25:21],B1[20:16]}{0,R0[14:10],G0[9:5],B0[4:0]} YUY2-YCrCb 4:2:2Pixel Data[31:0]DWORD Byte 3[31:24]Byte 2[23:16]Byte 1[15:8]Byte 0[7:0]Dw0 Cr0 Y1 Cb0 Y0 Dw1 Cr2 Y3 Cb2 Y2BtYUV-YCrCb 4:1:1Pixel Data[31:0]DWORD Byte 3[31:24]Byte 2[23:16]Byte 1[15:8]Byte 0[7:0]Dw0 Y1 Cr0 Y0 Cb0 Dw1 Y3 Cr4 Y2 Cb4 Dw2 Y7 Y6 Y5 Y4Y8 (8-bit Packed Gray Scale)概述Pixel Data[31:0]DWORD Byte 3[31:24]Byte 2[23:16]Byte 1[15:8]Byte 0[7:0]Dw0 Y3 Y2 Y1 Y0 说明安装2 安装2.1 图像卡硬件安装打开计算机的机箱盖用螺钉将档片固定在机箱上接好视频源输出接口2.2.1 DH-CG300图一 DH-CG300输入输出示意图外部接口:J6复合视频输入2J8S-VIDEO输入或复合视频输入4安装J9缺省是连接S-VIDEO输入需要一根扩展连线S-VIDEO输入端亮度信号 色度信号2.2.2 DH-QP300图二 DH-QP300输入输出示意图外部接口J1J2安装J3J4第二组视频输入第一个CG300模块的复合视频输入1第二个CG300模块的复合视频输入1第三个CG300模块的复合视频输入1第四个CG300模块的复合视频输入1第二组四个复合视频输入1为高阻输入对应两路单声道音频输入第三个与第四个CG300模块的音频输入J7音频插头示意图如下安装2.2.3 DH-CGMPEG输入到第一个 CG300模块输入到第二个 CG300模块接地安装安装图三将图像卡插入计算机PCI扩展槽中找到新硬件并提示要求安装设备的驱动程序下一步在指定位置中搜索驱动程序并指定随卡提供的磁盘或光盘中目录然后Windows应能够自动找到相应的驱动程序配置文件并安装用户还需要安装驱动程序Cg300Qp300\Win9x\Driver.Ins\SetupEx.exe²¢ÖØÐÂÆô¶¯¼ÆËã»úÓû§»¹¿É°²×°Ê¾Àý³ÌÐòCg300Qp300\Win9x\Demo.Ins\SetupEx.exeCg300Qp300\安装Cg300说明书.Doc; CG300用户开发文档\Win9x\dhcapta.inf ; CG300音频驱动程序配置文件dhcaptv.inf ; CG300视频驱动程序配置文件\Driver.Ins\SetupEx.exe ; 驱动安装程序\Demo.Ins\SetupEx.exe ; 示例安装程序设置显示模式显示格式依赖于主机显示卡的显示模式即8位32768色对应图像卡图像格式的RGB55565535色对应图像卡图像格式的RGB56516mil色对应图像卡图像格式的RGB888相关函数参见CG300SetColorSpace¾Í¿ÉÔËÐÐCg300DemoÔËÐпØÖÆÃæ°åÖеÄÉêÇë1024页(4兆)大小的内存如果只向屏幕采集图像而不向内存采集图像安装2.4 附件输入线DH-CG300 FOR WIN9x驱动安装盘一册以光盘中的电子文档为准安装2.5 常见问题的处理由于PCI总线目前还不十分规范我们在总结了前一阶段的使用情况后2.5.1关于显示卡目前已使用正常的显示卡9685 S3 Trio64S3 Trio64V2/DXS3 VIGER/DX S3 83C765,S3 87C375ET4000-W32 S3 Trio64V+S3 TrioV3/DX S3 S600/DXASUS V264SIS 6326/AGP TNT,TNT2,MGA100,MGA200,MGA400等必须是586 并且有PCI扩展槽CPU主频由用户根据任务需要而定演示程序使用说明3 演示程序使用说明3.1 WINDOWS环境下演示程序1. 申请主机内存,参照38页设置图像卡显示模式设置显示模式3. 进入DH-CG300菜单按菜单提示运行演示程序当Windows的显示模式为800ͼÏñ´°¿Ú²»Äܳ¬¹ý768PAL640NTSC软件编程说明4 WINDOWS 环境下软件编程说明在Microsoft Windows9x/ME环境中使用动态连接库G300D32.DLL控制图像卡的工作MS-VB或Borland C/C++C++ Builder等32位语言编程工具的程序中调用函数使用过程中对于使用C/C++编程工具供应用程序在链接(Link)时使用包含在CG300-32.H头文件中DH-QP300是四路同时输入它实际上是将四个CG300集成在一块卡上对于开发人员来说编写的代码也是一样的只要顺序调用我们dll库中的BeginCG3002BeginCG3004ÒÔºóͨ¹ýÕâËĸöÉ豸¾ä±úÀ´Çø·ÖÒ»¿éQP300中不同的CG300模块设备详细的说明请参阅库函数调用接口说明软件编程说明4.1库函数调用接口说明BeginCG300原型说明获取该图像卡的设备句柄凡是对图像卡的操作都要求使用该句柄以获得图像卡句柄int iImageDevice返回值返回图像卡句柄HCG300123½¨Òé关闭其它应用程序来释放更多的内存 或者重新安装驱动程序以便对驱动程序注册图像卡初始化错误1. 如果系统中安装了两块或两块以上的CG300HCG300 hCadr1 = BeginCG300(1); //打开图像卡1HCG300 hCadr2 = BeginCG300(2); //打开图像卡2……… ………… //类推…软件编程说明2. 如果正在使用QP300开发HCG300 hCadr1 = BeginCG300(1); //打开第一个CG300HCG300 hCadr2 = BeginCG300(2); //打开第二个CG300HCG300 hCadr3 = BeginCG300(3); //打开第三个CG300HCG300 hCadr4 = BeginCG300(4); //打开第四个CG3002. 函数int __stdcall EndCG300(HCG300 hcg300)释放图像卡句柄在对图像卡的操作完成之后以释放图像卡句柄和内存HCG300 hcg300调用成功返回1示例CG300Capture原型BOOL Enable)图像卡采集图像控制HCG300 hcg300ENABLE 采集DISABLE 冻结返回值返回1示例CG300Snap原型抓取一帧图像待采完一帧完整图像后即关闭参数图像卡句柄返回值否则返回零CG300Snap(hCadr1);5. 函数int __stdcall CG300SetInpVideoWindow(HCG300 hcg300int Top int Height)设置视频采集输入窗口不是在显示卡上图像显示的窗口视频窗口最大是0576 对于NTSC制0640参数图像卡句柄int Left ÊýֵӦΪ4的倍数int Top ÊýֵӦΪ2的倍数窗口宽度int Height ÊýֵӦΪ2的倍数调用成功返回1示例CG300SetDispWindow原型int Leftint Width 说明图像卡支持图像显示的裁剪功能和按比例压缩功能显示窗口只能等于或小于视频窗口显示窗口中的图像为全部视频输入图像的一个局部或全部当显示窗口小于视频窗口时即为按比例压缩方式参数图像卡句柄int Left ÊýֵӦΪ4的倍数窗口顶部坐标int Width ÊýֵӦΪ4的倍数窗口高度注意:参数Top是屏幕坐标如果采集图像到内存Left=0, Top=0调用成功返回1示例ReadDispWindow原型int Leftint WidthBYTE *lpDestBuf)读取窗口内图像数据存于lpDestBuf中按先行后列的顺序存放每个像素对应其灰度值每个像素有红蓝三个各8位相关函数参见有关图像数据读写的进一步信息及相关函数的使用可参见 Windows 应用程序接口 (API) 中的函数GetPixel以及SetPixelHDC hdc窗口左部坐标int Top窗口宽度int HeightBYTE *lpDestBuf ÓÉÓû§申请和释放Left返回值否则返回零ReadDispWindow(hCard1,144,200,512,512,pBuf);8CG300SetVideoStandard原型设置图像卡视频信号制式在设置制式的同时相关说明及函数参见G300SetInpVideo WindowHCG300 hcg300PAL PAL 制NTSC NTSC制返回值否则返回零。
K系列可编程数显仪表使用说明书一、概述K系列可编程智能报警变送仪表是在x系列数显电测表基础上增加以下功能和特点:1、显示倍率、通讯地址、波特率等通过面板上按钮可任意设置,使用非常灵活方便。
2、可选择被测量值的变送输出,输出为4--20mA,0—5V,4—12—20mA等可选。
3、带RS-485数字接口,采用标准MODBUS-RTU协议,具备字通讯和字节通讯方式,自带上位机测试软件。
4、使用范围广、组合功能强。
5、具有上下限报警功能,上下限报警允许设定功能,用户可以灵活组合使用以实现某些控制功能。
6、数字校零、数字校调,精度高,性价比极高。
二、通用技术指标精度等级:显示精度:0.5% 0.2%显示:四位LED 另加符号位量程:AC1A、AC5A、DC20mA,AC100V、AC220V 、AC380V、DC75mV等,特殊量程可定做工作频率:50/60HZ工作电源:AC220V、DC220V、AC110V、DC110V(由客户指定)功耗:小于3V A平均无故障工作时间:大于50000H工作条件:环境温度:-10至55℃相对温度小于93% 海拔小于2500米报警输出口:端子COM-NC为常闭触点端子COM-NO 常开触点通讯接口:端子GND为485地线,端子A为485+ 端子B为485-三、外形及接线图(具体以实物为准)四、编程说明仪表共设四个按键,分别为“←”“→”“MENU”“”“←”键:左移键菜单进行左移动选择,或是对所设定数字进行减功能,设定大数据时持续按该键可实现快速减功能。
“→”键:右移键,对菜单进行右移动选择,是对所设定数字进行加功能,在设定大数据时持续按该键可实现快速加功能。
“MENU”键:编程键,用此键可进入编程菜单,或是跳回上一级菜单,忽略操作。
“”键:确认键,用于进入下一层菜单或操作确认。
仪表参数设定说明:该仪表采用四键制设定输入,用“MENU”键进入编程菜单前,须输入编程密码“0001”,仪表共有13项设定功能。
cgdk d100温控器说明书
1.按▲(上键)和▼(下键)按2下,在画面闪动的时候,按▲或▼,可设定希望的温度。
2.偏差温度设定(设定温度与启动温度,温差设定)
(上键)与▼(下键)同时按3秒会显示“d1F”字母,按,或▼可以调节温差
3.温度矫正方法
先按▲,再按电源,3秒后会显示“Cor”继续按3秒会校正为0.0℃(出厂设定为
0.0℃,设定范围为士10℃)
4.特殊功能调节
先▼(下键)按往不动,再按电源,会显示“ty2”继续按3秒,可设定所有的功能,每按一
次电源,会显示各种菜单。
“ty2”为温感线感应温度。
5.时段供电温度调节方式
按▲(上键),会显示“stp”继续按3秒,会显示1-5时段显示,出厂1档,设定范围0-5挡
6.定时关机设定方法
(下键)按住3秒钟,显示“t_t”继续按3秒,在“too状态,可设定定时关机功能,设定时间范围0-99个小时。
设定时间内正常工作,到了时间自自动关机(出厂设定为0时)如显示“to9”9个小时就会自动关机,设定关机时间,会显显示剩下多少时间,剩余时
间显示“t11”就是剩11小时,“t8.5”就剩余8个小时50分钟。
定定时,时间的变动,关机重启的话变成“0”。
CG-PRO使用说明V 1.6.0 - 2019.12@深圳长广科技有限公司目录1.文档声明 (3)2.注意事项 (3)3.设备简介 (4)3.1 名词解释 (4)3.2 产品列表 (4)1.文档声明尊敬的用户,感谢您选择了我们的CG-PRO产品。
本使用说明将会为您详细介绍本产品的一些设备、软件和功能等信息,使用本产品之前先阅读本使用说明将有助于您了解本产品。
使用本产品之前请谨记下列几点:●CG-PRO 设备仅限用于正常、合法的设备车辆维修,请勿用于非法的用途;●如非法使用CG-PRO设备,则造成的一切风险与法律责任将由使用者自行承担;●本使用说明会尽力为您详细介绍CG-PRO,如还有疑问,可咨询售前售后。
2.注意事项为避免设备车辆损坏以及财产的损失,请遵守下列几个注意事项:●请在进行焊接操作之前,确保设备与各器件都处于断电状态,避免造成设备的短路;●请在无静电的环境中进行焊接、操作设备;●请勿将设备长期放置于潮湿、多灰、阳光直射等环境中,切勿重压、衰落、浸水设备等行为;●请在操作设备之前,确认接线的正确性,避免造成设备或器件的损坏;●请勿接入规格不符的电源;●请在操作过程中保持小心谨慎的态度,避免由于疏忽带来的设备、器件损坏等损失。
3.设备简介3.1 名词解释●EEPROM:电可擦可编程存储器,用于存储芯片数据。
●DFLASH:数据闪存,用于存储芯片数据。
●PFLASH:程序闪存,用于存储芯片程序。
●分区:9S12X系列特有操作,用于EEPROM与DFLASH容量大小的设定。
●解密:部分芯片特有操作,可将芯片从加密状态变为未加密状态,数据未变。
●加密:部分芯片特有操作,可将芯片从未加密状态变为加密状态,数据未变。
3.2 产品列表①CG-PRO主机②DB25连接线③USB数据线④M35080适配器⑤8脚/V850系列适配器⑥HC711适配器⑦12P连接线⑧35160WT适配器⑨CAN适配器综合适配器:(选配,需另外购买)⑩CG-PRO扩展板11 AM29BLXXX适配器12 AM29FXXX适配器13 HC705/908适配器3.3 主机接口简介以下为CGPRO主机接口的介绍。
HIROSS恒温恒湿机房精密空调操作手册HIMOD系列北京****科技有限公司技术部2009年01月01日目录第一章HIMOD系列海洛斯空调概述....................................................................................1.1型号多 ....................................................................................................................................1.2控制技术先进 ........................................................................................................................1.3制冷系统 ................................................................................................................................1.4送风系统 ................................................................................................................................1.5加湿系统 ................................................................................................................................1.6加热系统 ................................................................................................................................1.7其它 ........................................................................................................................................ 第二章HIMOD系列海洛斯空调型号含义............................................................................ 第三章有关空调的一些资料 ..................................................................................................3.1气流组织方式 ........................................................................................................................3.2盖板纽开启方式 ....................................................................................................................3.3空调重量 ............................................................................................................................3.4机组尺寸及维护空间 ............................................................................................................ 第四章制冷循环管路示意图 ..................................................................................................4.1风冷却(A型).....................................................................................................................4.2水冷却(W型)....................................................................................................................4.3双冷源(D型).....................................................................................................................4.4单系统(C型).....................................................................................................................4.5双系统(C型)..................................................................................................................... 第五章调速风机调速接线示意图........................................................................................... 第六章MICROFACE概述......................................................................................................6.1概述 ........................................................................................................................................6.2Microface面板简介................................................................................................................6.3LCD液晶显示屏介绍 ............................................................................................................ 第七章MICROFACE面板的操作.......................................................................................... 第八章控制器的使用 ..............................................................................................................8.1控制器(HIROMATIC)概述 ..............................................................................................8.2控制器的操作 ........................................................................................................................8.3菜单结构 ................................................................................................................................ 第九章日常维护及特殊维护 ..................................................................................................9.1日常维护 ................................................................................................................................9.2特殊维护 ................................................................................................................................ 第十章常见报警及处理 ................................................................................................................10.1低压报警 ..............................................................................................................................10.2高压报警 ..............................................................................................................................10.3加湿报警 ..............................................................................................................................10.4失风报警 ..............................................................................................................................10.5电加热过热报警 ..................................................................................................................10.6显示器发黑 ..........................................................................................................................10.7空调不制冷 ..........................................................................................................................附录1:参数列表 ....................................................................................................................附录2:报警内容列表 .............................................................................................................附录3:各菜单项含义 .............................................................................................................第一章HIMOD系列海洛斯空调概述HIMOD系列海洛斯空调(HIMOD空调)是当今世界上最先进的机房专用恒温恒湿机房专用精密空调。
为一台饮水机设置周一到周五早8点到11点和周一到周五下午13点到17点的2个时间段开启步骤:★、校对现在的时刻,同时按下“时钟”和“小时”即可调整时钟的小时显示,按一次增加一小时,长按可快速调整,采用同样的方法,可以设置当前的星期,分钟。
★、首先连续按“模式”键,将工作模式由“关”切换到“自动”模式(显示屏下部显示自动字样)。
★、设定第一时间段的开与关(20组中的一组)A、按“设定”键,液晶显示时间段“1”、“开”字样(第一组开的时间)B、调整定时开的分钟,按“分钟”键,设定分钟为00C、调整定时开的小时,按“小时”键,设定小时为8D、调整定时开的星期,连续按“星期”键,直到液晶屏显示星期模式为:星期一,星期二,星期三,星期四,星期五。
E、再按“设定”键,液晶显示时间段“1”、“关”字样(第一组关的时间F、调整定时关的分钟,按“分钟”键,设定分钟为00G、调整定时关的小时,按“小时”键,设定小时为11H、调整定时关的星期,连续按“星期”键,直到液晶屏显示星期模式为:星期一,星期二,星期三,星期四,星期五。
★、按照类似方法可完成第二个时间段定时开与关的设定。
★、将定时器插入电源插座,注意此时通电灯应处于熄灭状态,否则请将控制模式先调整为“关”,再将“模式”切换到“自动关”(注:现在时间在设置时段内放到“自动开”;现在时间在设置时段外放到“自动关”)这样就设置完成了,请将饮水机的插头插到定时器的万能输出插座就可以了.1)出门.出差或旅游定时热水器经常出差或偶尔出门,这时一回到家就想洗热水澡,如果一直开着热水器会不停地加热,即不安全而且又费电,这时幸好有了微电脑定时开关,想让它几点加热都能办到,可以按照你的要求去实现.2)定时煮饭出门逛街,8:30回家,精疲力尽,真不想开锅做饭,可是,饭还得吃......矛盾怎么解决?微电脑定时开关解决方案:出门前淘好米,洗好菜,定好18:00时开始通电煮饭,回到家便有饭吃。
ENGLISHGX Tank 1404 Channel | 4 to 20mA | 0 to 10VDCRev. 00 03/2021This manual is also available in HTML5.Table of Contents1. Introduction (1)1.1. Overview (1)1.2. What's in the box? (2)2. Installation (3)2.1. Mounting (3)2.2. Electrical connections (3)2.2.1. Power supply (3)2.2.2. Voltage output sensors (0 to 10VDC) (4)2.2.3. Current output sensors (4 to 20mA) (5)2.2.4. Terminal blocks (5)2.2.5. Sensor cable (6)2.2.6. Electrical Isolation (6)3. Configuration (7)3.1. Setup menu (7)3.2. Device menu (8)3.3. Analog inputs menu (8)3.4. Tank pump menu (9)4. Monitoring (10)4.1. Boat and motorhome overview (10)4.2. Tank overview (10)4.3. Device list (11)4.4. VRM Portal (11)5. Troubleshooting (12)5.1. Error (12)5.2. Tank level stuck (at ~40 to 55%) (12)6. Warranty (13)1.1. OverviewThe GX Tank 140 is an accessory used with a Victron GX device, it enables up to four tank level sensors to be connected and monitored.Features:•Interfaces with either 4 to 20mA or 0 to 10V tank level sensors (including a combination of both).•Connection to the GX Device via USB interface.•Channel 1 and 2 use a fused power source from the V in connection for sensor excitation.•Channel 3 and 4 use an integrated 24V power source for sensor excitation, which is powered via the USB interface.The integrated 24V power source simplifies the installation/wiring process, as no additional power source is required.•Configurable input range, for example to connect a 0 to 5V sensor.•Configurable averaging filter (1 to 60 seconds) to dampen the effect of fluid movement.•Sensor fault detection: an alarm is raised if the input signal is out of normal/acceptable operating range.•Full integration with a GX device for configuration, monitoring and tank pump (relay) control.Note that other sensor types or sensors that operate outside of the normal/acceptable operating range are notcompatible and may result in permanent damage of the unit, particularly if the input voltage limit is exceeded.1.2. What's in the box?The following items are included in the package:•GX Tank 140 unit with non-detachable 1.5m long USB cable•1x 2 way pluggable terminal block (for external power supply)•4x 3 way pluggable terminal block (for sensor connection)2.1. MountingThe GX Tank 140 enclosure is mounted using the slotted flanges which protrude from either side of the base.Use pan/truss head screws with washers to secure the unit, ensure that the screw thread outer diameter is a clearance fit within the flange slots (3.0mm max OD) and do not over tighten.2.2. Electrical connectionsAll electrical connections are located on the front face of the GX Tank 140 unit and made using the pluggable terminal blocks supplied.A clearly labelled wiring schematic diagram is also conveniently printed on the top face of the unit.2.2.1. Power supplyThe GX Tank 140 unit is self powered from USB interface and does not require an external power source.Sensors can be powered through the unit in two different ways, depending on the channel used:•Channels 1 and 2: External Power SupplyThe connector labeled “Ext. Power” can be used to distribute power from an external source to sensors connected on channels1 and 2.A self-resetting fuse (20mA) in this circuit prevents the unit from damage, even in case of a wiring short circuit or faulty sensor.•Channels 3 and 4: Internal 24VDC Power SupplyChannels 3 and 4 are powered by an internal supply (isolated from USB) with a voltage of 24VDC.The outputs are equipped with a self-resetting fuse that limits the current to a maximum of 20mA per channel.Before connecting tank sensors that provide a voltage output signal, ensure that the manufacturers datasheet is reviewed to confirm compatibility, as well as wiring and configuration details specific to that sensor.The wiring schematic diagram below depicts the wiring connections and how the voltage signal is measured by the GX Tank 140: between “In” (+) and “GND” (-).The table below shows the wiring connections in a tabular format, including the tank sensor connection names and common wiring colours.*V out: Channels 1 and 2, 24V: Channels 3 and 4** Confirm wiring colours with the tank sensor datasheet before connectionBefore connecting tank sensors that provide a current output signal, ensure that the manufacturers datasheet is reviewed to confirm compatibility, as well as wiring and configuration details specific to that sensor.The wiring schematic diagram below depicts the wiring connections and how the current signal is measured by the GX Tank 140: there is a load (RL) between “In” and “GND” which is used as a shunt to establish the current flow (based on the voltage drop across RL and the known resistance).Accordingly, the sensor must be connected to “Vout/24V” and “In”, while “GND” can be left unconnected.The table below shows the wiring connections in a tabular format, including the tank sensor connection names and common wiring colours.*V out: Channels 1 and 2, 24V: Channels 3 and 4** Confirm wiring colours with the tank sensor datasheet before connection2.2.4. Terminal blocksTo physically connect the tank sensor wiring to the pluggable terminal blocks, it is advised to use a crimped bootlace ferrule. Bootlace ferrules can be inserted directly into the spring loaded terminals on the pluggable terminal blocks and reduce the risk of wiring issues.Bare stranded copper wire can be used (without a bootlace ferrule), however care must be taken during the installation process; strip the insulation to reveal at least 10mm of bare copper wiring, then fully depress the orange tab on the pluggable terminal block with a precision screwdriver while the wiring is carefully inserted (ensure that there are no stray strands).Once the wiring is properly installed/seated within the spring loaded terminals on the pluggable terminal blocks, the orange tab must be fully depressed with a precision screwdriver in order to remove the secured wiring/bootlace ferrule (if ever necessary). The pluggable terminal blocks can be easily connected and disconnected to/from the mating sockets on the GX Tank 140 unitas required, for installations in space constraint locations it can be easier to connect the wiring to the pluggable terminal blocks independently, before they are plugged in.2.2.5. Sensor cableIt is recommended to use shielded twisted core cabling between the tank sensor and the GX Tank 140 unit, in order to prevent electrical interference/noise from the external environment from falsifying/effecting the measurements.Most sensors are already equipped with shielded cabling and may be directly connected if there is sufficient length.It is also recommended to route the tank sensor cabling as far as practical away from DC and AC power cabling and to ground the cable shield on bare metal of the vehicle or boat.2.2.6. Electrical IsolationThe USB cable is electrically isolated from the sensors, as such there is no risk of ground loops occurring between the sensors and the USB socket of the GX device.The "GND" connections of all four channels are internally connected, they are not individually isolated from each other.After initial connection, the GX Tank 140 requires some basic configuration through the 'Settings' menu of the GX Device, which can be accessed via the display of the GX device, or via Remote Console on LAN or VRM.3.1. Setup menuSensor type - Voltage or CurrentThe GX Tank 140 can be used with either voltage or current output tank sensors; select the 'Sensor type' being used.A combination of both sensor types can be used with the same GX Tank 140 unit, and configured independently (Voltage is the default 'Sensor type' setting).Setting the wrong 'Sensor type' will not damage the GX Tank 140.Sensor value when empty / fullUsed to configure the functional operating range of the sensor.Fluid typeSelect from Fuel, Fresh water, Waste water, Live well, Oil and Black water. The selection automatically determines the icons and colors used in the display.In case no specific tank 'Name' is configured, the 'Fluid type' is shown instead.Volume unitSelect from Litre, Cubic meter, Imperial gallon and U.S. gallon.Custom shapeIt is possible to configure custom shapes for non-linear shaped tanks using this setting.For example: if a tank that is wider up top, the tank shape can be configured so that a sensor reading of 50% equals only 25% of volume.Up to 10 positions can be set to accurately describe the relationship between sensor reading and tank shape, even for highly irregular tanks. The tank volume is linearly interpolated between positions.Averaging timeThe averaging time setting is used to dampen the effect of dynamic fluid movement within the tank.Set the averaging time as required between 1 and 60 seconds (10 seconds is the default 'Averaging time' setting).Sensor valueThis field entry shows the current/raw sensor reading, without any averaging; used mainly for troubleshooting.3.2. Device menuThe 'Device menu' includes identification information in relation to the GX Tank 140 device and also each particular channel/tank. NameThe 'Name' setting is used to allocate a custom tank name to each tank for easy identification while monitoring.VRM InstanceThe 'VRM instance' number is mapped to the instance on the VRM Portal.3.3. Analog inputs menuEach of the four tank channel inputs can be enabled and disabled via the 'Settings' > 'I/O' > 'Analog Inputs' menu.By default all four tank channels are enabled. Disable the tank channel inputs that are not in use, to remove unnecessary clutter from the 'Device list'.After disabling, use the 'Remove disconnected devices' option at the bottom of the 'Device list' to complete the removal, without the need to reboot the GX device.3.4. Tank pump menuThe tank level can be used to automatically run a pump (for example to automatically replenish a day-tank), this functionality is configured within the 'Tank pump' menu.First the relay function must be set to 'Tank pump', this is changed in the 'Settings' > 'Relay' menu.Then access the 'Settings' > 'Tank pump' menu, select the desired sensor and configure the desired start/stop levels.When set to 'Auto' mode, the pump will run automatically once the tank volume % falls below the configured 'Start level' and stop automatically once the tank level increases above the configured 'Stop level'.The pump 'Mode' can be easily toggled between 'Auto', 'On' and 'Off' as required.Tank levels and Tank pump status is also available on the 'Boat and motorhome overview' page (which needs to be enabled in the 'Settings' > 'Display and language' menu):It is also possible to change the pump 'Mode' (between 'Auto', 'On' and 'Off') directly via the 'Boat and motorhome overview' page.Tank level data is accessible on the GX Device screen (ie. on a GX Touch or CCGX), as well as through 'Remote Console' on LAN and remotely via the VRM Portal.4.1. Boat and motorhome overviewThe tank level values can be displayed on the home screen of the GX device by using the 'Boat and motorhome overview' page (which needs to be enabled in the 'Settings' > 'Display and language' menu).Once the 'Boat and motorhome overview' is activated, that additional page becomes available for selection as the home screen. To cycle through the available home screen options, simply swipe across the home page.The 'Boat and motorhome overview' page enables the entire system and tank levels to all be monitored from a single screen, including the ability to change the 'Tank pump' mode.4.2. Tank overviewThe tank level values can also be displayed on the home screen of the GX device by using the 'Tank overview' page (which needs to be enabled under 'Settings' > 'Display and language' menu).Once the 'Tank overview' is activated, that additional page becomes available for selection as the home screen. To cycle through the available home screen options simply swipe across the home page.The 'Tank overview' page provides a neat way to organise and monitor a large quantity of tanks via the GX device or 'Remote console'.4.3. Device listThe tank volume level of each enabled tank sensor is also shown beside the tank name (or type if no name is allocated) in the'Device List' page.4.4. VRM PortalIf enabled, the tank values are also reported to the VRM (Victron Remote Management) Online Portal and logged.This data can be viewed remotely in 'realtime' via the 'VRM Dashboard' page, and historical data can be visualised over any given time period via the 'VRM advanced' page, by simply enabling the related widget.Dashboard pageAdvanced page - 'Tank summary' and 'Tank level'Please refer to the VRM Manual for further details about VRM.5.1. ErrorIn case the measured voltage/currents exceeds the limits (voltage: >10V, current: <4mA or >20mA) an error will be triggered. Check that the tank sensor type and specification is compatible, that the tank sensor is functioning correctly (within the acceptable range) and the cabling/connections for any issues.5.2. Tank level stuck (at ~40 to 55%)In a setup with a current output sensor, a permanently fixed reading of ~40 to 55% can be caused by a tripped internal fuse.The internal self-resetting fuse has a permanent current flow of ~11 to 13mA when tripped and the GX Tank 140 cannot detect this state as a fault.Check the cabling and connections for a short circuit or any other issue.Five year limited warrantyThis limited warranty covers defects in materials and workmanship in this product, and lasts for five years from the date of original purchase of this product.The customer must return the product together with the receipt of purchase to the point of purchase.This limited warranty does not cover damage, deterioration or malfunction resulting from alteration, modification, improper or unreasonable use or misuse, neglect, exposure to excess moisture, fire, improper packing, lightning, power surges, or other acts of nature.This limited warranty does not cover damage, deterioration or malfunction resulting from repairs attempted by anyone unauthorized by Victron Energy to make such repairs.Victron Energy is not liable for any consequential damages arising from the use of this product.The maximum liability of Victron Energy under this limited warranty shall not exceed the actual purchase price of the product.。

GRUNDFOS 说明书KPL, KPG and KWM11-700 kW, 50 Hz11-800 kW, 60 Hz, DIN安装和使用说明书Installation and operating instructionsKPL, KPG and KWM/qr/i/96770326中文 (CN)2中文 (CN) 安装和使用说明书翻译原来的英文版本安装与操作指导对11-800 kW的格兰富KPL、KPG和KWM泵进行了说明。
章节1-5介绍了以安全的方式打开包装、安装并启动本产品所需的信息。
章节6-12介绍了有关产品的重要信息,以及有关服务、故障查找和产品处置的信息。
目录页1. 概述1.1 目标群体这些安装与操作说明面向专业安装人员。
1.2 本文献中所用符号1.2.1 对死亡或人身伤害危险的警告随附在“危险”、“警告”和“注意”三个危险符号之后的文字表述如下:1.2.2 其他重要事项1.概述21.1目标群体21.2本文献中所用符号22.接收产品33.安装产品33.1安全信息和准备33.2吊装产品33.3KPL和KWM的机械安装53.4KPG的机械安装113.5电气连接123.6变频器操作144.启动154.1启动准备154.2启动175.产品的搬运与储存175.1产品搬运175.2产品储存176.产品概述186.1应用186.2概述187.标识197.1型号说明197.2铭牌208.保护及控制系统218.1传感器218.2水泵控制249.维修和维护产品259.1安全指导和要求259.2维护259.3备件269.4受污染的泵2610.对产品进行故障查找2711.技术数据2811.1运行条件2811.2尺寸和重量2811.3液位要求2911.4液位要求,KPL 2912.产品处置31开始安装前,请先阅读本文件。
安装和操作必须遵守当地规章制度并符合公认的良好操作习惯。
危险指示危险情况,如果不避免,可能导致死亡或严重的人身伤害。
AK56-1K1-CG智能水泵控制器产品说明书版本V1.0220220727目录一、系统简介 (1)二、接线端子介绍 (5)三、工作模式介绍 (5)四、产品接线图 (7)一、系统简介1、概述AK56-1K1水泵控制器是本公司新型研发的“智能控制器”本产品采用高新科技电子集成化设计,具有操作简单,指示直观、外形精美。
本产品主要适用于,排污设备、水塔供水等多种恒压自动/手动供水控制箱配套使用。
2、技术参数(1)、额定工作电压:AC220V50/60Hz(2)、控制器额定功耗:<1.5W(2)、内部继电器输出负载电流:7A/AC240V(3)、适配交流接触器线圈电压:AC220V(4)、控制器控制类型:无源输入控制(5)、检测位置:低水位、高水位、超高水位(6)、启动方式:手动/自动、外部启动、应急启动3、使用环境(1)、工作环境温度:-10℃~40℃(2)、工作环境:无水滴、蒸汽、腐蚀、易燃、灰尘及金属微粒的场所(3)、工作环境湿度:<95%4、产品外形尺寸及开孔尺寸(单位:mm)(1)、外形尺寸:165*102*50(2)、开孔尺寸:155*90(建议开孔157*92)5、操作面板介绍(1)、A 区:LED 状态指示(2)、B 区:按键操作6、LED 指示灯状态说明(1)、电源(指示灯):系统上电后,电源指示灯亮;(2)、报警信号(指示灯):检测到超高水位时指示灯点亮;(3)、自动(指示灯):系统处于自动状态点亮,闪烁表示巡检开启;(4)、手动(指示灯):系统处于手动状态点亮;(5)、运行(指示灯):运行时点亮,巡检时闪烁;(6)、故障(指示灯):故障反馈时点亮;(7)、自动(指示灯)与手动(指示灯):同时亮表示开启自动巡检,同时闪烁表示退出自动巡检。
(8)、故障(指示灯):闪烁表示故障信号输入检测常开或常闭自定义中。
B7、按键介绍按键名称按键图标按键功能启动1、按【启动】键启动泵;停止1、按【停止】键停止泵;2、长按【停止】键5秒,故障信号指示灯闪烁,故障检测点常开变常闭,常闭变常开。
精心整理XXX公园自动浇灌系统设计说明书二 O一一年七月目录目录 ............................................. 错误 ! 未指定书签。
第一章基本资料 ................................... 错误 ! 未指定书签。
一、设计依照 ............................................. 错误 ! 未指定书签。
二、概略 ................................................. 错误 ! 未指定书签。
第二章浇灌系统设备选型 ........................... 错误 ! 未指定书签。
一.浇灌系统构成 ......................................... 错误 ! 未指定书签。
二. 浇灌系统主要构成部分说明 .............................. 错误 ! 未指定书签。
2.1 、首部设备 .................................................................................. 错误 !未指定书签。
2.2 、浇灌管网 .................................................................................. 错误 !未指定书签。
2.3 、浇灌设备 .................................................................................. 错误 !未指定书签。
2.4 、浇灌自动控制系统 .................................................................. 错误 !未指定书签。
可铭连续喷墨绘图机使用说明目录序言--------------------------------------------------------------------------1第一章安全操作注意事项----------------------------------------------2第二章技术性能参数----------------------------------------------------3第三章可铭连续喷墨绘图机各部件名称及功能-------------------4第四章绘图机安装详细说明-------------------------------------------5第五章可铭连续喷墨绘图机安装步骤-------------------------------51.绘图机安装2.电脑驱动软件安装请在使用可铭高速连续喷墨机详细读懂目录详情序言尊敬的用户您好感谢您对“香港可铭”高速连续喷墨绘图机的信用与支持。
该机是我们自主设计研发在国外行业的先进软件技术融合完美对接。
性能稳定,操作规程简便,功能性价比高。
配有先进光感自动送收技术和纳米高精确度科技。
适合大中型服饰CAD设计院,家居CAD设计工程院。
适用大中型企业设计师们现代化高科技作业。
我们全体香港可名有限公司员工真诚贵院贵企事业单位对我司工作的认可,真诚希望对我们的产品提供宝贵意见。
诚信实事求是奋发向上是我们可名与时同进。
愿可铭高速连续喷墨绘图机的质量和服务能让您满意香港可铭国际有限公司研发监制长沙全胜信息技术有限公司生产第一章安全操作注意事项重要提示:为了保证可铭绘图机的安全和正常使用,请在安装使用前认真仔细阅读说明书详情。
以下是安全操作规程发点说明,请使用工作者严格管理遵守。
1. 使用机器电源时,务必保证电源稳定性,有效连接地线。
警告:一旦发生漏电雷电与闪电故障,会造成工作人员受到电击伤害,同时可能烧毁电路与机器,跟使机器无法正常工作。
声明欢迎使用中科蓝光产品,在使用产品之前,请首先阅读本使用手册。
本手册适用于蓝光变量卡-金刚版版本。
本手册由武汉中科蓝光科技开发有限公司制作。
未经中科蓝光许可,不得为任何目的而使用任何形式的复制或传播本手册的任何部分。
武汉中科蓝光科技开发有限公司有权更改本手册的内容,如手册内容与实际产品不符,以实际产品为准,恕不另行通知!中科蓝光对于产品、应用程序、版权和其中涵盖的其他知识产权拥有专利,若无中科蓝光的书面授权,不得擅用。
本手册中所提到的某些产品名称仅作识别之用,这些名称可能属于其它公司的注册商标或版权!2目 录使用手册阅读导航 (4)第一章 产品介绍 (5)1、产品说明 (5)2、产品规格 (5)3、产品特色 (6)4、系统需求 (7)5、硬件安装 (7)6、安装流程图 (8)第二章 在单机或网络中的第一台计算机上进行安装 (9)1、在本机已经安装操作系统情况下的安装步骤 (11)2、在本机无操作系统或需要安装多操作系统时的安装 (11)3、在操作系统中安装驱动程序 (16)4、系统的优化 (18)第三章 网络安装与网络拷贝 (19)1、进入网络拷贝 (20)2、进入接收端 (21)3、设置占位机 (21)4、分组 (22)5、发送数据、命令和修改IP (23)5、断点续传 (28)第四章 设 置 (29)1、密码设定 (30)2、参数设定 (31)3、分区信息 (34)4、网络拷贝 (34)5、重新分区 (35)36、版本升级 (35)7、移除 (36)8、关于 (37)9.计费扩展 (38)第五章 变量拷贝 (39)1、首先根据需要在一台机器上进行操作 (40)2、进入发射端 (40)3、部分变量和全部变量 (41)4、变量拷贝 (42)附录一、LINUX 安装指南 (42)附录二、常见问题解答 (46)使用手册阅读导航欢迎使用中科蓝光产品,在使用产品之前,请首先阅读本使用手册。
根据您的具体需要和实际情况,您可以按照不同的方式来阅读本手册。
KCGS742触摸屏恒压供水控制器使用手册湖南常德给排水自动化科技感谢您选用KCGS742智能变频恒压供水控制器。
为充分发挥本产品的卓越性能及确保使用者和设备的安全,在使用之前,请详细阅读本手册。
一、系统概述KCGS742第二代智能变频恒压供水控制器,专业为供水行业打造的高档人机界面控制器。
产品投入市场以来,深受新老客户喜爱。
该控制器可安全稳定运行于各种环境,几千台覆盖全国范围的使用,几乎零故障率。
相比第一代,人机界面更加友好,功能更加完备,性能更加稳定。
具有压力控制精度高、稳定性好,全自动8段时间压力控制及定时启停水泵。
KCGS742供水控制器采用7寸高清彩色液晶屏,触摸操作,全中文界面显示,所见即所得。
系统采用智能自适应PID调整,方便用户调试使用。
精心的设计使产品外观简洁,直观的人机界面带给你操作方便;工业级的元件,使产品经久耐用、运行稳定可靠、抗干扰能力强;独特完备的接口设计,能满足您不同的现场需求。
产品提供完备的输入输出信号,可与各种品牌的变频器配套使用。
另有市政压力或水箱液位等信号供使用。
可方便地切换控制器为水箱恒压供水或无负压供水。
可适应远传压力表和压力变送器信号。
并有RS485通讯接口与上位机服务器连接,实现远程控制和查询供水系统。
在用户的使用上,无需编程,只需有普通电工知识,依照我公司提供的原理图接线,简单设置后即可使您的供水系统正常投入使用。
高档的产品、极具竟争力的价格、稳定的质量和完善的售后服务是公司一贯的坚持。
目录系统概述 (2)控制器的安装 (4)注意事项 (4)功能特点 (5)技术指标 (6)接线端子图 (7)接线端子说明 (8)端子与部分变频器端子的连接表 (9)主界面与操作说明 (10)参数设置界面说明 (15)系统设置界面说明 (22)电气原理图 (26)RS485通讯协议 (30)KCGS742联网示意图 (32)常见故障处理 (33)部分客户名录 (34)品质保证 (35)二、控制器的安装1、控制器外形尺寸:210mm*150mm*50mm;2、控制柜安装开孔尺寸:177mm*128mm;3、控制器安装:安装时在控制柜前面板开一方孔(开孔尺寸:177mm*128mm),将控制器端子排拔下后镶嵌于前面板上,用随机的卡子固定,插上端子排,然后接线即可。
1.概述调速型液力偶合器一般安装在三相异步电机和工作机之间,它可在电机输入转速不变的条件下,以电动执行机构带动勺管改变其工作腔(泵轮与涡轮间)充液量从而对其输出转速(即工作机转速)进行无级调节,调速过程柔和平滑,输出转速稳定,动力传递可靠,广泛用于风机、水泵、皮带机等负载的工况调节。
调速型液力偶合器用于拖动特性为M∝n2的负载(如风机、水泵)其稳定调速范围约为1~1/5;用于拖动M=C负载(如皮带机)时,其稳定调速范围约为1~1/3。
2.主要技术参数(1) 产品型号注:上述型号说明为本企业标准,完全符合国标的基本规定。
(2) 技术参数(表一)(3) 结构图(图一)3.主要结构特点(图二)YOTCGP 及YOTCG调速型液力偶合器结构如图一所示,主要由箱体、旋转组件、供油组件、排油组件、勺管拖动调速装置、仪表系统、电加热器、冷却器等组成。
3.与风机、水泵类离心机械(M∝n2)或皮带机类恒矩机械(M=C)相匹配,其稳定的调速范围分别为1~1/5和1~1/3。
4.表中粗线左侧为滚动轴承结构(YOTCG);右侧为滑动轴承结构(YOTCH);粗线框中两种结构均有。
输入端输出端打开此法兰即可拆换吸油口滤清器1.输入轴2.供油组件3.背壳4.涡轮5.电加热器6.泵轮7.外壳8.勺管拖动调速装置 9.导管壳体10.输出轴 11.箱体 12.仪表系统图一(1) YOT CGP调速型液力偶合器结构图输入端输出端打开此法兰即可拆换吸油口滤清器1.输入轴2.泵壳体3.仪表系统4.背壳5.涡轮6.泵轮7.外壳8.输出轴9.勺管拖动调速装置 10.导管壳体 11.箱体 12.供油组件 13.电加热器图一(2)YOT CG调速型液力偶合器结构图图二 调速型液力偶合器调速原理图冷却水入冷却水出油冷却器输入轴吸口滤网油泵涡轮外壳背壳随机仪表输出轴电加热器箱体测速传感器 (探头)电动执行器勺管泵轮为活动勺管/出口调节/滚动轴承/有地脚水平剖分式箱体调速型液力偶其中YOTCGP为活动勺管/出口调节/滚动轴承/有地脚整体式箱体合器(参见图一(1));YOTCG调速型液力偶合器(参见图一(2))。
海德龙智能液位监控仪使用说明一、前言海德龙智能液位监控仪是一种先进的设备,用于监测和控制液体的液位。
本文将详细介绍海德龙智能液位监控仪的使用方法和注意事项。
二、产品概述海德龙智能液位监控仪采用先进的传感器技术和数据处理算法,能够准确地测量液体的液位,并实时传输数据到监控系统。
该监控仪具有高灵敏度、高精度和高可靠性的特点,可广泛应用于石油、化工、水处理、食品加工等领域。
三、使用方法1. 安装:将监控仪安装在液体容器上,并确保其与液体接触的部分完全密封。
注意避免与其他设备或管道发生干扰。
2. 连接:将监控仪与监控系统进行连接。
根据产品说明书,正确连接电源和数据线,确保稳定的信号传输。
3. 启动:按下监控仪上的启动按钮,并在监控系统上设置相关参数。
根据实际需求,可以选择不同的监测模式和报警设置。
4. 监测:监控仪将自动开始监测液体的液位,并将数据传输给监控系统。
用户可以通过监控系统实时查看液位数据,并进行进一步的分析和控制。
5. 维护:定期检查监控仪的工作状态和连接情况,确保其正常运行。
如发现异常,及时进行维修或更换。
四、注意事项1. 安全:在安装和维护过程中,务必遵循相关的安全操作规程,确保人员和设备的安全。
2. 校准:定期对监控仪进行校准,以确保测量结果的准确性。
根据产品说明书,按照指导进行校准操作。
3. 清洁:保持监控仪的清洁,避免灰尘和污物堆积影响其工作效果。
可以使用干净的布或刷子清洁监控仪的外部表面。
4. 环境:避免将监控仪暴露在极端的温度和湿度环境中,以免影响其性能和寿命。
5. 故障排除:如发现监控仪工作异常或数据传输中断,可以参考产品说明书进行故障排除,或联系售后服务人员进行维修。
五、总结海德龙智能液位监控仪是一种功能强大、易于使用的设备,能够提供准确的液位监测和控制功能。
通过正确安装、连接和设置,用户可以轻松实现对液体液位的监测和管理。
同时,用户还需要关注产品的维护和注意事项,以确保监控仪的长期稳定运行。
CGDK:An extensible CorelDRAW VBA program for geological draftingJun-Ting Qiu a,b,n,Wan-Jiao Song b,Cheng-Xin Jiang b,Han Wu c,Raymond M.Dong da China University of Geosciences,Beijing100083,Chinab School of the Earth Sciences and Resources,China University of Geosciences,Beijing100083,Chinac Geological Lab Center,China University of Geosciences,Beijing100083,Chinad University of Chicago,Chicago,IL60637,United Statesa r t i c l e i n f oArticle history:Received20October2011Received in revised form12July2012Accepted13July2012Available online5August2012Keywords:VBACorelDRAWExcelSoftwareCGDKGeological draftinga b s t r a c tCorel Geological Drafting Kit(CGDK),a program written in VBA,has been designed to assist geologistsand geochemists with their drafting work.It obtains geological data from a running Excel applicationdirectly,and uses the data to plot geochemical diagrams and to construct stratigraphic columns.Thesoftware also contains functions for creating stereographic projections and rose diagrams,which can beused for spatial analysis,on a calibrated geological map.The user-friendly program has been tested towork with CorelDRAW13–14–15and Excel2003–2007.&2012Elsevier Ltd.All rights reserved.1.IntroductionCorelDRAW TM Graphic Suite is a graphic software packageproduced by the Canadian Corel Corporation that provides power-ful tools for drawing geological maps,geological profiles,crosssections,and stratigraphic columns.Although CorelDRAW is oneof the most widely used graphic applications in geology,it hasseveral shortcomings.For example,when constructing a strati-graphic column,the user must draw,reposition,resize,andfillshapes manually,which is both time consuming and inaccurate.Additionally,because CorelDRAW does not provide features forplotting diagrams,users must plot diagrams in Microsoft Excel TMor some other statistical softwarefirst before copying and pastingthe diagrams to CorelDRAW for modification.Although the abovemethod is widely used,the diagrams moved from Excel toCorelDRAW usually contain many redundant or duplicativeshapes and lines,which must be removed before adding com-ments and explanations to the diagram.In order to improve the efficiency and convenience of geolo-gical drafting,this paper presents an extensible CorelDRAW VBAprogram,Corel Geological Drafting Kit(CGDK)for geologists andgeochemists.The main functions of CGDK include calibratinggeological maps,creating stereographic projections and rosediagrams,constructing stratigraphic columns and plotting geo-chemical diagrams.The details of CGDK and several examples ofthe program are presented in this paper.2.Features of CGDK2.1.InstallationAn executablefile named‘‘setup.exe’’is provided for softwareinstallation(Fig.1a).By double-clicking on thisfile,users start aninstallation procedure in which initially an environment test isperformed automatically to check whether the computer can runthe software.CGDK requires CorelDRAW13or later and Excel2003or2007to be installed on users’computer.If these requirements are met,the test will pass and a green text message will appear in thelower-left corner of the‘‘Deploy’’window(Fig.1b).Also,the‘‘Install’’button will become clickable.After clicking on the‘‘Install’’button(Fig.1b),the programbegins to deploy the softwarefiles.A few seconds later,a messagebox will pop up to inform the user of successful deployment(Fig.1c)and a toolbar with12buttons named‘‘Corel GeologicalDrafting Kit’’will be added in the active CorelDRAW workspace(Fig.1d).The whole procedure will be completed after restartingthe operating CorelDRAW application.2.2.Acquiring data from a running Excel applicationCGDK supports data acquisition from a running Excel applica-tion.The acquisition procedure can be performed byfirst clickingon the‘‘Data input’’button(Fig.2a)to open or activate anExcelfile,then specifying a data range in an Excel spreadsheet(Fig.2b),andfinally adding this range to CGDK by clicking on theContents lists available at SciVerse ScienceDirectjournal homepage:/locate/cageoComputers&Geosciences0098-3004/$-see front matter&2012Elsevier Ltd.All rights reserved./10.1016/j.cageo.2012.07.020n Corresponding author.Tel.:þ8615901022978;fax:þ861082326956.E-mail address:midimyself@(J.-T.Qiu).Computers&Geosciences51(2013)34–48Fig.1.CGDK installation.(a)Setup.exe.(b)Deploy window.(c)Message box that informs users of successful installation.(d)CGDK toolbar.Buttons displayed in CGDK toolbar (from left to right)are ‘‘Calibrate map’’,‘‘Show GPS’’,‘‘Plot on map’’,‘‘Move to’’,‘‘Draw projection’’,‘‘Common tool’’,‘‘Stratigraphic column’’,‘‘Template designer’’,‘‘Geochemical diagram’’,‘‘Series editor’’,‘‘Template manager’’,and‘‘About’’.Fig.2.Acquiring Data from Excel.(a)The ‘‘Data input’’button,which is shown as an Excel icon (left)is coupled with a ‘‘Data delete’’button (right).(b)An Excel spreadsheet.(c)Confirmation box.(d)The address of the data range is displayed in the textbox,indicating that the data have been added successfully.(e)The address of the data range is cleared by the program,indicating the data have been removed.J-T Qiu et al./Computers &Geosciences 51(2013)34–4835‘‘OK’’button located in upper-left corner of the screen (Fig.2c).Once a range is added,its address will be automatically displayed in the textbox on the left side of the ‘‘Data input’’button,indicating that the data have been added successfully (Fig.2d).The ‘‘Data input’’button is always coupled with a ‘‘Data delete’’button on its right side.By clicking on the ‘‘Data delete’’button,a selected range will be removed from CGDK and the address of the selected range will be cleared by the program (Fig.2e).2.3.Features designed for geochemistryGeochemical diagrams are basic and convenient geochemical analysis tools,helping geochemists classify rock types (e.g.,Le Maitre,1976;Herron,1988;Frost et al.,2001;Frost and Frost,2008),study crustal evolution (e.g.,Taylor and McLennan,1995;Rollinson,2008),distinguish between different tectonic settings (e.g.,Pearce and Cann,1971,1973;Pearce and Gale,1977;Wood,1980;Brown et al.,1984;Pearce et al.,1984),and interpret the provenance of sediments (e.g.,Belousova et al.,2002).Particularly valuable is the ability to plot data onto an existing diagram ortemplate (e.g.,MacDonald and Katsura,1964;Kuno,1966;Irvine and Baragar,1971),so users can compare their work with previous works and interpret their own data based on a larger number of statistical results.CGDK offers three main categories of templates:X –Y scatter plots,triangular plots,and ‘‘spider’’plots.Each category contains a series of templates,such as the total alkalis-silica (TAS)diagram,Alkalis-FeO n -MgO (AFM)diagram,and the primitive mantle normalized diagram.A ‘‘Template manager’’tool is available for template management.References for the templates offered by CGDK are listed in Appendix A1.Besides the templates offered by CGDK,new templates can be easily developed using the ‘‘Template designer’’tool,which provides a series of features for the establishment of a template coordinate system,and for the creation of template elements.2.3.1.Saving and loading a templateA diagram template is a group of CorelDRAW standard shapes,which are easy to modify but difficult to manage.The manage-ment difficulty arises in distinguishing a specific templatefromFig.3.Saving and loading a template.(a)CGDK toolbar with the ‘‘Template manager’’button highlighted.(b)The ‘‘Template manager’’window.(c)A selection area which contains all the template elements.(d)The ‘‘Save template’’window,in which users enter the name and description for a template.(e)Select a template from the template list.(f)Place the template on CorelDRAW page.J-T Qiu et al./Computers &Geosciences 51(2013)34–4836another.CGDK solves this problem by offering a ‘‘Template manager’’tool,which divides the templates into different groups by category and purpose.A name list is available for users to browse,and an information box is offered to display template descriptions.The ‘‘Template manager’’window can be opened by clicking on the ‘‘Template manager’’button in the CGDK toolbar (Fig.3a).A template group can then be selected from the drop-down list at the top of the ‘‘Template manager’’window (Fig.3b).If users need to save a template,they must specify a rectangle selection area on the CorelDRAW page that contains all the template elements (Fig.3c)and click on the ‘‘Save’’button (Fig.3b)to show the ‘‘Save template’’window (Fig.3d)where the template name and the description can be added.After inputting the name and the description,users must click on the ‘‘Save’’button in the ‘‘Save template’’window to finish the procedure (Fig.3d).Users can also load a template by selecting one from the list box and clicking on the ‘‘Load’’button (Fig.3e).After the operation,the mouse cursor changes into a cross,indicating that the program is ready for users to locate the template.By left clicking on a CorelDRAW page,users can place the template on the page (Fig.3f).2.3.2.Plotting a geochemical diagram with a templateOnce a diagram template has been placed on a CorelDRAW page,the first step in creating a plot is to click on the ‘‘Geochem-ical diagram’’button in the CGDK toolbar (Fig.4a)to open the ‘‘Plot geochemistry diagram’’window (Fig.4b).The ‘‘Plot geo-chemistry diagram’’window,whose components change with each template category,has the ability to distinguish between different categories of templates.After opening the ‘‘Plot geochemistry diagram’’window,a data acquisition procedure is required.The method of adding data has been described in Section 2.2,while the examples of data series used to create different categories of diagrams are displayed in Fig.5.Triangular diagrams need three series of data for the Top,Left,and Right axes (Fig.5a),X –Y scatter diagrams require two series of data for the X and Y axes (Fig.5b),and spider diagrams need only one data series for the Y axes.For spider diagrams,users must specify whether the Y values are arranged in columns (Fig.5c)or in rows (Fig.5d)by selecting the corresponding option button in the ‘‘Plot geochemistry diagram’’window.After inputting the entire data series for a sample,users must click on the ‘‘Add’’button to add the current sample series into CGDK series list (Fig.4b).Usually,several series of samples may be added,so it is recommended to enter a name for identification before adding the series to the list.Finally,users click on the ‘‘Plot’’(Fig.4b)button to create a geochemical diagram.The results are shown in Fig.5e.2.3.3.Customizing a sample seriesIn a default situation,the data points in one sample series are represented by rectangles and organized in a CorelDRAW shape group object (Fig.6a).The filling color,border width,line style,and text font of these data points can be easily modified by using the tools offered by CorelDRAW.Additionally,CGDK provides a ‘‘Series editor’’tool to automatically replace rectangles with custom symbols.By clicking on the ‘‘Series editor’’button (Fig.6b)in the CGDK toolbar,users can open the ‘‘Series editor’’window (Fig.6c).Before replacing data,users must set a custom symbol by selecting one (Fig.6d)and clicking on the ‘‘Set symbol’’button located in the ‘‘Series editor’’window (Fig.6c).ToperformFig.4.Plotting a geochemical diagram.(a)CGDK toolbar with the ‘‘Geochemical diagram’’button highlighted.(b)The ‘‘Plot geochemistry diagram’’window,in which users input the data series for plotting a diagram.J-T Qiu et al./Computers &Geosciences 51(2013)34–4837the replacement,users must select a sample series desired to be replaced (Fig.6e)and click on the ‘‘Replace’’button (Fig.6c).The result is shown in Fig.6f.2.3.4.Creating a new templateAlthough several templates are available for geochemical analysis,new ones can be supplemented to handle additional geochemical problems.Usually,a geochemical diagram contains a frame that defines diagram size,a coordinate system,and graphic elements,such as axes,classification lines,data points,and labels.The frame and labels can be created by using the tools provided by CorelDRAW,whereas other elements,including the coordinate system,axes,classification lines,and data points must be created with ‘‘Tem-plate designer’’tool.The ‘‘Template designer’’window consists of three pages:(1)Coordinate,(2)Axis,and (3)ers can switch between different pages by clicking on the buttons at the top of the ‘‘Template designer’’window.Once a frame is selected,a calibra-tion procedure can be performed by clicking on the ‘‘Coordinate’’button and defining the boundary values.The triangular template requires no boundary value,the X –Y scatter diagram requires four values for the left,right,top,and bottom boundaries,and the spider diagram requires two values for the top and bottom boundaries as well as a series of data obtained from Excel for the normalizing values.After calibration,axes can be added byclicking on the ‘‘Axis’’button and defining the axis interval values in the textbox where commas are employed to separate the values.The classification lines and data marks can be defined in the ‘‘Marks’’page.The method of creating classification lines and marks is similar to that of creating axis.The following example shows how to create a TAS (Le Maitre et al.,1989)template with the ‘‘Template designer’’tool.First,click on the ‘‘Template designer’’button (Fig.7a)to open the ‘‘Template designer’’window and choose a diagram type (Fig.7b)from the drop-down list at the top of the ‘‘Template designer’’window.Here,the second option ‘‘Scatter diagram’’should be selected since TAS is an X –Y scatter diagram.Then,create a template frame by drawing a rectangle on a CorelDRAW page (Fig.7c),build up the coordinate system for the frame by defining the left,right,top,and bottom values in the textboxes in the ‘‘Template designer’’window (Fig.7b),and click on the ‘‘Estab-lish’’button (Fig.7b).Next,click on the ‘‘Axis’’button (Fig.7d),enter interval values in X -axis and Y -axis textboxes using commas to separate each number,and click on the ‘‘Draw axis’’button (Fig.7d).Finally,click on the ‘‘Marks’’button,input the coordi-nates of each turning node of a classification line,and click on the ‘‘Draw curve’’button (Fig.7e).Fig.7f shows the relevant informa-tion that has been added for the creation of the classification lines in a TAS ers can also employ the tools offered by CorelDRAW to add labels to the template (Fig.7g).In addition,CGDK provides alternative ways to create a diagram template.For example,it allows users to develop templates withbmpFig.5.Examples of geochemical diagrams plotted by CGDK.(a)Data series for plotting a triangular diagram.(b)Data series for plotting an X –Y scatter diagram.(c)and (d)Data series for plotting a spider diagram.(e)The outputs of geochemical diagrams.J-T Qiu et al./Computers &Geosciences 51(2013)34–4838(Bitmap)pictures.The following example shows how to use a bmp format diagram to create a 10,000n Ga/Al vs.Nb template:First,copy a.bmp image from an article (e.g.,Wong et al.,2009)and paste it to CorelDRAW (Fig.8a).To calibrate the template,first draw a frame whose left,right,top,and bottom borders overlap with the original grid lines (Fig.8a).Next,open the ‘‘Template designer’’window,choose a diagram type,input the left,right,top,and bottom values according to the overlapped grid lines,and click on the ‘‘Establish’’button (Fig.8b).Finally,hide the frame and use ‘‘Template manager’’to save the template (Fig.8c).The method of creating a template with a.bmp image is less time consuming than the former method since an existent diagram is used as a background as opposed to having to create the graphic elements,but depends on the availability of a high-resolution.bmp image.In order to check the accuracy of plotting on the template created by this method,the geochemical data of Baijuhuajian granite (Wong et al.,2009)has been re-plotted on this template.The new plotted data points represented by stars overlap the original data points marked by rectangles.Fig.8ddisplays the results and indicates that the calibration of the template is accurate.2.4.Features designed for stratigraphyStratigraphic columns are widely used for stratigraphic unit division and comparison (e.g.,Vogel et al.,1998;Michelsen and Clausen,2002;Vilas et al.,2003).They can also be used to reflect the changing deposition environment (e.g.,Weissheimer de Borba et al.,2004).In some cases,elements of a stratigraphic column can be drawn by rectangles and filled with specified patterns and symbols that represent different rock types.The height of a rectangle normally represents thickness of a rock layer (Miall,1984;Tucker,1988),while the width normally represents the average grain size of the layer (Krumbein and Sloss,1963).In modern stratigraphic studies,other types of columns and diagrams,such as magnetostratigraphic columns,magnetostrati-graphic diagrams,chronostratigraphic columns,element concen-tration diagrams,and temperature change diagrams arealsoFig.6.Customizing a series.(a)Use tools offered by CorelDRAW to customize data points.(b)CGDK toolbar with the ‘‘Series editor’’button highlighted.(c)The ‘‘Series editor’’window.(d)Select a legend symbol.(e)Select the sample series desired to be replaced.(f)The rectangles are replaced with stars.J-T Qiu et al./Computers &Geosciences 51(2013)34–4839provided along with stratigraphic columns (e.g.,Cirilli et al.,2009;Glen et al.,2009).2.4.1.Drawing a stratigraphic columnDuring the process of creating a stratigraphic column,CGDK first reads the thickness and grain size data and creates rectangles with different heights and widths before trying to fill each rectangle based on its lithology.A rectangle whose lithology is not registered will automatically be unfilled by the program.The lithology registration can be done in the ‘‘Lithology’’window where there are two list boxes.The right list box displays all the lithologies that have been registered in the previous work,while the left list box displays the lithologies of the rectangles that are going to be filled.Registered lithologies in the left list box are marked so they can be distinguished from the unregistered lithologies.To perform a registration,choose an unregistered lithology from the left list box,select a legend shape filled with the desired colors or patterns from the CorelDRAW page,and click on the ‘‘Set’’button.The registered lithology will be stored by CGDK for future use.The following example shows the instructions for creating a stratigraphic column:First,click on the ‘‘Stratigraphic column’’button in the CGDK toolbar (Fig.9a)to show the ‘‘Draw stratigraphic columns’’window (Fig.9b).Then,get the thickness,grain size and lithology data from an Excel file (Fig.9b).Next,click on the ‘‘Set lithology’’button (Fig.9b)to show the ‘‘Lithology’’window (Fig.9c).Choose an unregistered lithology from the left list box (Fig.9c),select a legend shape from the CorelDRAW page (Fig.9d),and click on the ‘‘Set’’button (Fig.9c).After all legends have been registered,click on the ‘‘OK’’button (Fig.9c).Next,draw a rectangle whose height represents the total thickness of all layers and whose width stands for the maximum grain size of all layers (Fig.9e).Finally,click on the ‘‘Draw’’button (Fig.9b)to build the stratigraphic column (Fig.9e).2.4.2.Drawing other columnsBesides stratigraphic columns,CGDK provides three other categories of columns,including the polyline,smooth line,and magnetostratigraphic ers can choose a column type from the drop-down list at the top of ‘‘Draw stratigraphic columns’’window (Fig.10a).The polyline (Fig.10b)and the smooth line (Fig.10c)columns need two data series for ‘‘Thicknesses’’and ‘‘X values’’,where the ‘‘X ’’may represent grain size,element concentration,or another feature of a layer.For example,if ‘‘X ’’stands for grain size,the columns can be used to reflect the sea level change during periods of deposition formation (Nørgaard-Pedersen et al.,2006).Fig.7.Creating a template.(a)The ‘‘Template designer’’button in CGDK toolbar.(b)The ‘‘Template designer’’window.(c)Draw a rectangle.(d)Create axis intervals.(e)Create the classification lines.(f)Relevant information that has been added on the TAS template (g)Use text tools provided by CorelDRAW to add labels to the template.J-T Qiu et al./Computers &Geosciences 51(2013)34–4840The magnetostratigraphic column (Fig.10d)requires two data series for the thicknesses and polarities.The method of creating a magnetostratigraphic column is similar to that of building a stratigraphic column as described in Section 2.4.1.2.4.3.Drawing diagramsIn Sections 2.3.2and 2.3.4we introduced the methods for creating templates and plotting geochemical diagrams,and these methods can also be used to create diagrams for stratigraphic analysis.The following example shows how to create a TOC (Total Organic Carbon)vs.depth diagram.First,duplicate the rectangle that has been used for creating a stratigraphic column (Fig.11a).Then,open the ‘‘Template designer’’window,choose ‘‘Scatter diagram’’from the drop-down list,input the left,right,bottom and,top values,and click on the ‘‘Establish’’button (Fig.11b).Next,open the ‘‘Plot geochemical diagram’’window (Fig.11c),enter the X and Y values (Fig.11c and d),click on the ‘‘Add’’button,select the ‘‘Draw connecting curve’’checkbox,and click on the ‘‘Plot’’button to draw the diagram (Fig.11a).In some studies (e.g.,Brault et al.,2004;Mazumder and Sarkar,2004),rose diagrams are used to indicate paleocurrent directions.A series of rose diagrams along with a stratigraphic column reflect changes of paleocurrent directions through time (Fig.11e),which is significant for basin analysis.The rose diagram can be created by CGDK,and the methodology will be described in Section 2.5.2.2.5.Features designed for field geology2.5.1.Convenient tools for filling shapes and areasA geological map is used to show geological features of an area.Rock types and stratigraphic units are shown in different colors,patterns and symbols to indicate where they are exposed in the area.CorelDRAW provides several widely used tools,such as burette and paint barrel to copy and assign filling and outline styles from a legend to a specified shape or area.In some cases,however,users must flip between burette and paint barrel frequently,which is both tedious and inconvenient.CGDK provides a smart filling tool to solve this problem.The tool can memorize the filling and outline styles of a legend when left clicking on the legend with the ‘‘Shift’’key pressed,and can assign the remembered styles to a specified shape or area when clicking on the area with the ‘‘Shift’’key released.The following example shows the procedure:First,click on the ‘‘Common tool’’button to open the ‘‘Common tools’’window (Fig.12a)where there are two options (‘‘Fill’’and ‘‘Outline’’).With the first option (‘‘Fill’’)selected,the program fills the specified area with the memorized fill style,and with the second option (‘‘Outline’’)selected,the program assigns the out-line style to the specified shape.Then,click on the ‘‘Smart fill’’button (Fig.12b).Next,click on a legend shape with the ‘‘Shift’’key pressed (Fig.12c).Finally,click on an area with the ‘‘Shift’’key released to assign the memorized style to the area (Fig.12d).Continue clicking on the areas desired to be filled (Fig.12e)before pressing ‘‘ESC’’key to end the procedure.Not only can the ‘‘Smart filling’’tool be used to fill shapes,but it can also be used to modify geological boundaries,such as faults and unconformities (Fig.12f).2.5.2.Creating stereographic projections and rose diagramsStereographic projections and rose diagrams are important tools for structural analysis.The stereographic diagrams of joints,faults,folds,and cleavages along with a geological map help the user determine the stress field of an area (e.g.,Whitaker and Engelder,2005).Rose diagrams of bedding orientations and pebbles reflect paleocurrent directions (e.g.,Franks et al.,1959)and can thus be used to interpret the evolution of basins and orogenic belts (e.g.,Maejima et al.,2004).Fig.8.Developing a template with a BMP picture.(a)Copy a BMP picture from an article and draw a rectangle.(b)Input the coordinate information of the template.(c)Hide the rectangle and save the template with ‘‘Template manager’’.(d)The geochemical data of Baijuhuajian granite are re-plotted on the template and are represented by red stars that overlap the original data points,indicating an accurate calibration of the template.J-T Qiu et al./Computers &Geosciences 51(2013)34–4841To create a stereographic projection or rose diagram with CGDK,users need to follow the steps below:Click on the ‘‘Draw projection’’button (Fig.13a)to open the ‘‘Projection &diagram’’window,obtain azimuth and dip data from an Excel file (Fig.13b),and draw a circle (Fig.13c).If a stereographic projection is to be created,users must specify the type of structure (planar or linear)(Fig.13b),whereas if a rose diagram is to be created,users must define the type (strike,azimuth or dip)of rose diagram by selecting the corresponding option in the ‘‘Projection and diagram’’window (Fig.13b).Finally,click on the ‘‘Projection’’or ‘‘Rose diagram’’button to create a stereographic projection or rose diagram (Fig.13b).The results are shown in Fig.13d.2.5.3.Calibrating a UTM geological mapThe coordinate system in CorelDRAW is orthogonal with the origin located in the lower-left corner of the CorelDRAW page.Positions in this coordinate system are measured in document unit,rather than latitude and longitude.Although linear interpolationmay be used to convert latitudes and longitudes into X and Y coordinates,this method works only on small-sized maps with large scales at low latitudes.Because the earth is three-dimensional,several map projec-tions (e.g.,Mercator,Gauss–Kruger,Universal Transverse Merca-tor (UTM),and Lambert),and many datum planes (e.g.,WGS84,NAD83,GRS 80,WGS72)have been used to represent its surface on plane maps.As long as we know the map projection informa-tion,the datum plane and several calibration points with latitudes and longitudes,we can use these datasets to calibrate the map and exploit the datasets to represent other positions on the same map.A UTM conversion file 1has been revised and used to develop a feature of CGDK that allows users to calibrate a UTM WGS84map with two calibration points.By clicking on the ‘‘Calibrate map’’button in the CGDK toolbar,users start a calibration procedure during which users arepromptedFig.9.Drawing a stratigraphic column.(a)The ‘‘Stratigraphic column’’button in CGDK toolbar.(b)The ‘‘Draw stratigraphic columns’’window.(c)The ‘‘Lithology’’window.(d)Select a legend shape for a lithology.The registered lithology will be stored for future use.(e)The stratigraphic column that is created by CGDK.A legend list is also created along with the stratigraphic column.1/$taylorc/toolbox/geography/geoutm.html .J-T Qiu et al./Computers &Geosciences 51(2013)34–4842to specify two points with different longitudes and latitudes and give their geographic coordinates (Fig.14a).The two calibration points must be in the same UTM zone so that the zone number and central meridian can be determined by CGDK.The map will be calibrated after the point specification and will be available for plotting data and representing other positions.If users want to obtain the latitude and longitude of an arbitrary point on the map,they can click on the ‘‘Show GPS’’button and move the mouse cursor to the point.The latitude and longitude will be displayed in the floating window next to the mouse cursor (Fig.14b).By clicking on the ‘‘Show GPS’’button again,users can close the floating window.The method of plotting data on a calibrated map is similar to that of plotting data on geochemical diagrams.First,click on the ‘‘Plot on map’’button,click on a legend symbol,and click on the ‘‘Set symbol’’button.Next,obtain latitudes and longitudes from an Excel file,and click on the ‘‘Plot’’button (Fig.14c).In order to evaluate the accuracy of the calibration,the geographic coordinates of some guideline intersections have been plotted on a calibrated 1:250,000geological map from USGS 2.The result displayedin Fig.15shows that the data points are consistent with the guidelines intersections,indicating a good calibration.3.Advantages of CGDK 3.1.Data acquisitionOther software packages have been developed to plot geo-chemical diagrams,such as Newpet (Clarke,1993),Igpet (Carr,1995),and MinPet (Richard,1997).However,these programs access only plot functionalities without linking to a ers must convert an Excel file into an external file with a specific format before and after data processing.By providing an interface for importation directly from Excel to CorelDRAW,CGDK aims to integrate the data storage and manip-ulation advantages of Excel with the powerful vector drawing and editing features of CorelDRAW.This interface has three benefits:(1)the program can obtain data without format conversion and avoid importing useless data,(2)users may select data flexibly (for example,by row,by column,or even from different rows and columns in different sheets),and (3)CGDK obtains data from a running Excel application,which means all the features provided by Excel,such as autofill,data sort,and macros can be used during the data acquisition process.3.2.Plotting geochemical diagrams with graphic-based templates Microsoft Excel is widely used by geochemists for data storage and analysis,but only manual data organization and basic X –Y plots are available for data interpretation (Wang et al.,2008).Although several previous macro programs have been written for plotting triangular and spider plots in Excel (e.g.,Christie and Langmuir,1994;Sidder,1994;Marshall,1996),these programs do not meet present geochemists’needs because they are not capable of adding new diagram types for current geochemical analysis.GeoPlot (Zhou and Li,2006)and GCDPlot (Wang et al.,2008)are the latest macro programs with powerful functions for plotting triangular and discrimination diagrams,the capability of adding new diagram types,and the friendly user interface.However,the two programs provide data-based templates whose elements,including lines of various classifications,data points,and labels are exactly defined in VBA macros or configuration files,meaning these templates are difficult to update or share.Additionally,the appearances of these templates rarely meet publication requirements,so users must modify them prior to publication.The modifications must be repeated every time a new diagram is created.CGDK introduces the concept of a graphic-based template.In contrast to an abstract data-based template,the graphic-based template is concrete and can be easily modified and updated.The template is a standard CorelDRAW shape group object,which can be stored and shared conveniently.When plotting data on a template that has been optimized to meet publica-tion requirements,users can focus on customizing data points and adding comments and explanations rather than modifying the whole diagram.Additionally,a graphic-based template can be used with flexibility to create diagrams for other geolo-gical analysis,such as TOC vs.depth diagram for stratigraphic analysis.3.3.Creating stratigraphic columns along with other columns and diagramsSince the construction of a stratigraphic column is usually very time consuming,a series of applications have been providedsuchFig.10.Other available columns provided by CGDK.(a)Polyline column.(b)Smooth line column.(c)Magnetostratigraphic column.2/open-file/of01-262/PULL-MAP.PDF .J-T Qiu et al./Computers &Geosciences 51(2013)34–4843。