QTL detection of seven spike-related traits and their genetic
- 格式:pdf
- 大小:723.15 KB
- 文档页数:16


利用90k芯片技术进行小麦穗部性状QTL定位武炳瑾;简俊涛;张德强;马文洁;冯洁;崔紫霞;张传量;孙道杰【摘要】小麦穗部性状与产量密切相关,挖掘穗部性状基因及其关联分子标记具有重要意义.本研究以周8425B×小偃81衍生的RIL群体(F8)为材料,利用90k芯片标记构建的高密度遗传图谱对3个环境下的穗长、小穗数、不育小穗数、穗粒数、千粒重进行QTL定位.共检测到19条染色体上的71个QTL,变异解释率(PVE)范围为2.10%~45.25%,其中37个位点为主效QTL(PVE>10%).QSl.nafu-6A.2(穗长)、QSl.nafu-7A(穗长)、QSsn.nafu-2A.1(不育小穗数)、QSsn.nafu-2D(不育小穗数)和QGns.nafu-2B(穗粒数)在多个环境中被检测到,且LOD>10,PVE>20%.位于同一个基因簇中的QSl.nafu-6A.2(穗长)、QGns.nafu-6A(穗粒数)和QTgw.nafu-6A(千粒重)在多个环境中被检测到,且与已报道的相关位点位置相同或相近,在分子标记辅助育种中具有较大参考价值.%Spike traits are important to grain yieldin wheat. Molecular markers associated with genes/QTLs controlling spike traits are highly valuable to marker-assisted breeding. A recombinant inbred line (F8) population derived from Zhou 8425B ×Xiaoyan 81 were evaluated in three environments, and QTLs for spike length, spikelet number per spike, sterile spikelet number, grain number per spike and thousand-grain weigh were mapped into a high-density genetic map built by 90k chip. A total of 71 QTLs were located on 19 chromosomes, and the phenotype variation explained (PVE) by a single locus ranged from 2.10%to 45.25%. Thirty-seven loci were considered as main-effect QTLs owing to the PVE larger than 10%. QTLs QSl.nafu-6A.2 for spike length, QSl.nafu-7A for spike length, QSsn.nafu-2A.1 for sterile spikelet number, QSsn.nafu-2Dfor sterile spikelet number and QGns.nafu-2B for grain number per spike were identified repeatedly in different environments with the LOD value higher than 10 and PVE larger than 20%. QSl.nafu-6A.2 for spike length, QGns.nafu-6A for grain number per spike and QTgw.nafu-6A for thou-sand-grain weight were mapped in a cluster on chromosome 6A and might be applicable in marker-assisted selection because they have been detected in multiple environments and close to the loci reported.【期刊名称】《作物学报》【年(卷),期】2017(043)007【总页数】9页(P1087-1095)【关键词】小麦;穗部性状;90k基因芯片;QTL定位【作者】武炳瑾;简俊涛;张德强;马文洁;冯洁;崔紫霞;张传量;孙道杰【作者单位】西北农林科技大学农学院, 陕西杨凌 712100;西北农林科技大学农学院, 陕西杨凌 712100;西北农林科技大学农学院, 陕西杨凌 712100;西北农林科技大学农学院, 陕西杨凌 712100;西北农林科技大学农学院, 陕西杨凌 712100;西北农林科技大学农学院, 陕西杨凌 712100;西北农林科技大学农学院, 陕西杨凌712100;西北农林科技大学农学院, 陕西杨凌 712100【正文语种】中文武炳瑾简俊涛张德强马文洁冯洁崔紫霞张传量孙道杰*西北农林科技大学农学院, 陕西杨凌 712100小麦穗部性状是产量的重要构成要素, 对控制穗粒数、千粒重等主要穗部性状进行QTL定位, 明确其在染色体上的位置和效应, 对产量性状的遗传改良具有重要意义。
脑电双频指数(BIS)指导高龄患者七氟醚吸入麻醉的临床观察发表时间:2012-09-04T17:26:11.747Z 来源:《中外健康文摘》2012年第22期供稿作者:刘辉王胜国[导读] 高龄患者对麻醉药的敏感性增高,代谢降低,全麻中易发生麻醉药物过量,麻药残余从而导致术后苏醒延迟。
刘辉王胜国 (抚顺矿务局总医院麻醉科 113008)) 【中图分类号】R 【文献标识码】A【文章编号】1672-5085(2012)22-0445-01 【摘要】目的观察脑电双频指数(BIS)指导高龄患者七氟醚吸入麻醉的可行性。
方法 65岁以上行腹部手术病人70例,ASAⅡ-Ⅲ级,随机分为对照组和实验组,每组35例,对照组的麻醉医师根据平时的麻醉经验以及术中血压、心率的变化用七氟醚的吸入浓度调节麻醉深度;实验组根据BIS值调整术中七氟醚吸入浓度来调节麻醉深度。
术中维持BIS值在40-60,手术结束前调整BIS在60-70。
记录患者睁眼时间(从停止吸入麻醉药至病人睁眼时间),拔管时间,拔管即刻的七氟醚呼出末浓度,记录术中各种用药量;术后随访患者是否有术中知晓。
结果与对照组相比实验组睁眼时间、拔管时间明显缩短(P<0.05),两组术后随访均无术中知晓。
结论 BIS指导高龄患者吸入七氟醚能加快其麻醉恢复时间。
【关键词】BIS 高龄七氟醚 1 资料与方法 1.1 一般资料:年龄65以上,ASAⅡ-Ⅲ级择期行腹部手术患者70例,随机分为实验组和对照组,每35例,术前均无严重的中枢系统病史心、肝、肾等器官疾患。
预计手术时间2~4小时左右。
1.2 麻醉方法:所用病人入室后常规监测心电图、无创血压、心率、脉搏血氧饱和度,连接脑电双频指数(BIS)传感器。
以芬太尼2~3ug/kg、依托米脂0.3mg/kg,罗库溴铵1mg/kg诱导气管插管后连接Drager.medical麻醉工作站进行机械通气。
麻醉维持采用七氟醚、芬太尼、维库溴铵静吸复合麻醉。
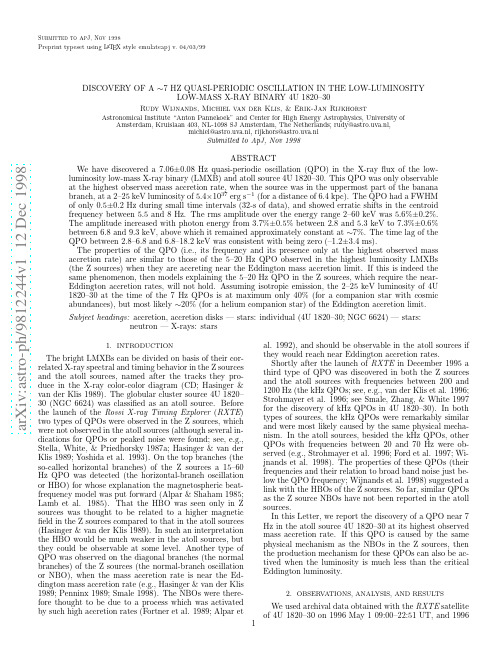
a r X i v :a s t r o -p h /9812244v 1 12 D e c 1998Submitted to ApJ,Nov 1998Preprint typeset using L A T E X style emulateapj v.04/03/99DISCOVERY OF A ∼7HZ QUASI-PERIODIC OSCILLATION IN THE LOW-LUMINOSITYLOW-MASS X-RAY BINARY 4U 1820–30Rudy Wijnands,Michiel van der Klis,&Erik-Jan RijkhorstAstronomical Institute “Anton Pannekoek”and Center for High Energy Astrophysics,University ofAmsterdam,Kruislaan 403,NL-1098SJ Amsterdam,The Netherlands;rudy@astro.uva.nl,michiel@astro.uva.nl,rijkhors@astro.uva.nlSubmitted to ApJ,Nov 1998ABSTRACTWe have discovered a 7.06±0.08Hz quasi-periodic oscillation (QPO)in the X-ray flux of the low-luminosity low-mass X-ray binary (LMXB)and atoll source 4U 1820–30.This QPO was only observable at the highest observed mass accretion rate,when the source was in the uppermost part of the banana branch,at a 2–25keV luminosity of 5.4×1037erg s −1(for a distance of 6.4kpc).The QPO had a FWHM of only 0.5±0.2Hz during small time intervals (32-s of data),and showed erratic shifts in the centroid frequency between 5.5and 8Hz.The rms amplitude over the energy range 2–60keV was 5.6%±0.2%.The amplitude increased with photon energy from 3.7%±0.5%between 2.8and 5.3keV to 7.3%±0.6%between 6.8and 9.3keV,above which it remained approximately constant at ∼7%.The time lag of the QPO between 2.8–6.8and 6.8–18.2keV was consistent with being zero (–1.2±3.4ms).The properties of the QPO (i.e.,its frequency and its presence only at the highest observed mass accretion rate)are similar to those of the 5–20Hz QPO observed in the highest luminosity LMXBs (the Z sources)when they are accreting near the Eddington mass accretion limit.If this is indeed the same phenomenon,then models explaining the 5–20Hz QPO in the Z sources,which require the near-Eddington accretion rates,will not hold.Assuming isotropic emission,the 2–25keV luminosity of 4U 1820–30at the time of the 7Hz QPOs is at maximum only 40%(for a companion star with cosmic abundances),but most likely ∼20%(for a helium companion star)of the Eddington accretion limit.Subject headings:accretion,accretion disks —stars:individual (4U 1820–30;NGC 6624)—stars:neutron —X-rays:stars1.INTRODUCTIONThe bright LMXBs can be divided on basis of their cor-related X-ray spectral and timing behavior in the Z sources and the atoll sources,named after the tracks they pro-duce in the X-ray color-color diagram (CD;Hasinger &van der Klis 1989).The globular cluster source 4U 1820–30(NGC 6624)was classified as an atoll source.Before the launch of the Rossi X-ray Timing Explorer (RXTE )two types of QPOs were observed in the Z sources,which were not observed in the atoll sources (although several in-dications for QPOs or peaked noise were found;see,e.g.,Stella,White,&Priedhorsky 1987a;Hasinger &van der Klis 1989;Yoshida et al.1993).On the top branches (the so-called horizontal branches)of the Z sources a 15–60Hz QPO was detected (the horizontal-branch oscillation or HBO)for whose explanation the magnetospheric beat-frequency model was put forward (Alpar &Shaham 1985;Lamb et al.1985).That the HBO was seen only in Z sources was thought to be related to a higher magnetic field in the Z sources compared to that in the atoll sources (Hasinger &van der Klis 1989).In such an interpretation the HBO would be much weaker in the atoll sources,but they could be observable at some level.Another type of QPO was observed on the diagonal branches (the normal branches)of the Z sources (the normal-branch oscillation or NBO),when the mass accretion rate is near the Ed-dington mass accretion rate (e.g.,Hasinger &van der Klis 1989;Penninx 1989;Smale 1998).The NBOs were there-fore thought to be due to a process which was activated by such high accretion rates (Fortner et al.1989;Alpar etal.1992),and should be observable in the atoll sources if they would reach near Eddington accretion rates.Shortly after the launch of RXTE in December 1995a third type of QPO was discovered in both the Z sources and the atoll sources with frequencies between 200and 1200Hz (the kHz QPOs;see,e.g.,van der Klis et al.1996;Strohmayer et al.1996;see Smale,Zhang,&White 1997for the discovery of kHz QPOs in 4U 1820–30).In both types of sources,the kHz QPOs were remarkably similar and were most likely caused by the same physical mecha-nism.In the atoll sources,besided the kHz QPOs,other QPOs with frequencies between 20and 70Hz were ob-served (e.g.,Strohmayer et al.1996;Ford et al.1997;Wi-jnands et al.1998).The properties of these QPOs (their frequencies and their relation to broad band noise just be-low the QPO frequency;Wijnands et al.1998)suggested a link with the HBOs of the Z sources.So far,similar QPOs as the Z source NBOs have not been reported in the atoll sources.In this Letter,we report the discovery of a QPO near 7Hz in the atoll source 4U 1820–30at its highest observed mass accretion rate.If this QPO is caused by the same physical mechanism as the NBOs in the Z sources,then the production mechanism for these QPOs can also be ac-tived when the luminosity is much less than the critical Eddington luminosity.2.OBSERVATIONS,ANALYSIS,AND RESULTSWe used archival data obtained with the RXTE satellite of 4U 1820–30on 1996May 109:00–22:51UT,and 199612Discovery of a ∼7Hz QPO in 4U 1820–30Fig.1.—Color-color diagram (left )and hardness-intensity diagram (right )of 4U 1820–30.The soft color is the 3.5–6.4/2.1–3.5keV count rate ratio,the hard color is the 9.7–16.0/6.4–9.7keV ratio,and the intensity is the count rate in the energy range 2.1–16.0keV.The colors and the intensity were calculated for the 3detectors that were always on.The count rates were background subtracted,but no dead-time correction was applied.The dead-time correction is approximately 1%.The boxes in the CD indicate the regions which were used to select the power spectra.Typical error bars on the colors and the intensity are shown.All data points are 16-s averages.May 322:15–May 418:05UT.A total of ∼40ks of data were obtained.No X-ray bursts were observed.The data were simultaneously collected with 16s time resolution in 129photon energy channels (covering 2–60keV),with 2ms in 16channels (covering 2–18.2keV),and with 16µs in 16channels (18.2–60keV).During ∼10%of the time,de-tector 4and/or 5(out of five)were off.For the color-color analysis we only used the data of the three detectors which were always on;for the power spectral analysis we used all available data.In order to create the CD and the hardness-intensity diagram (HID),we used as soft color the 3.5–6.4/2.1–3.5keV count rate ratio and as hard color the 9.7–16.0/6.4–9.7keV ratio.As intensity we used the count rate in the energy range 2.1–16.0keV.The CD and HID of all data are shown in Figure 1.In the right hand side of both di-agrams what seems to be a banana branch is observed,with an additional patch of data that might be either the lower banana branch or part of an island state.The power spectrum observed during this part (see below)indicates that the source was not in an island state but in the lower part of the banana branch,because the strong (∼20%rms amplitude)band-limited noise,characteristic of the island state,was not observed.We conclude that during these observations the source was in the banana branch contin-uously.The gap between the lower part of the banana branch with the rest is caused by the two day data gap between the 1996May 1and 1996May 3–4observations.During the May 1observation the source was in the lower part of the banana branch and during the May 3–4obser-vations the source moved up an down the banana branch.In order to study the timing behavior as a function of the position of 4U 1820–30on the banana branch,we made power spectra of 16-s data segments of the 2ms and 16µs data combined.This resulted in ∼2500power spec-tra between 1/16and 256Hz.The rms amplitude values quoted are those obtained for the energy range 2–60keV,unless otherwise stated.We selected the power spectra on basis of the position of the source in the CD by dividing the banana branch in the CD into six regions (Figure 1left ).Each region was analyzed separately.The power spectra corresponding to each region were averaged and the dead-time modified Poisson level (Zhang 1995;Zhang et al.1995)was subtracted.The average power spectra of regions 2and 3were fitted with a fit function consisting of a power law (representing the very-low frequency noise [VLFN])and an exponentially cutoffpower law (repre-senting the high-frequency noise [HFN]).For region 1a Lorentzian was included in the fit function as well,to fit a QPO near 70Hz.For the power spectra corresponding to the other three regions,we only used a power law for the VLFN and a Lorentzian for the 7Hz QPO (region 6)or the broad bump near 7Hz (regions 4and 5).The power spectra corresponding to each region are shown in Figure 2.In the lower banana branch (region 1)the atoll source VLFN and HFN components (see Hasinger &van der Klis 1989)were observed.A QPO at 71±1Hz was also observed,with an rms amplitude of 2.2%±0.2%and a FWHM of 21±4Hz.There are also indications for a broad noise components at ∼100Hz,similar to what has found in other atoll sources (Ford,van der Klis,&Kaaret 1998;Ford &van der Klis 1998;Wijnands &van der Klis 1998a),however,the limited time resolution be-low 18.2keV did not allow to investigate this in more de-tail.The VLFN was detected throughout the entire ba-nana branch except in region 6.Its rms amplitude (in-tegrated over 0.01–1Hz)varied erratically between 2.7%and 7.9%,with a 95%confidence upper limit in region 6of 3.4%.The power law index varied erratically between 1.0and 1.7.The HFN was observed in regions 1–3.Its3Region 1Region 2 (x 0.1)Region 3 (x 0.01)Region 4 (x 0.001)Region 5 (x 0.0001)Region 6 (x 0.000001)Fig. 2.—Power spectra of4U1820–30corresponding to the different regions in the CD indicated in Figure1.The power spectra appear flat at high frequencies,as for display purposes,only96%of the dead-time modified Poisson level was subtracted.rms amplitude(integrated over1–100Hz)and cutofffre-quency decreased from6.3%±0.1%and13.7±0.7Hz inregion1,to3.1%±0.1%and5.5±0.6Hz in region3.Thepower law index varied erratically between−0.9and−1.4.In regions4and5,broad peaked noise is present near7Hz.It is unclear whether the HFN evolved into this broadpeaked noise component or was replaced by it.In region6,a very significant(9σ)QPO is present near7Hz,whichmight be related to the peaked noise in region4and5.Wefitted this peaked noise as well as the QPO with aLorentzian and found frequencies of7.4±0.3Hz in region4and7.1±0.1Hz in region5,consistent with the QPOfrequency of7.06±0.08Hz in region6.While the FWHMof the Lorentzian decreased from6.4±1.8Hz in region4to1.3±0.3Hz in region6,the rms amplitude increased from3.4%±0.4%to6.2%±0.3%.We investigated the presence of the7Hz QPO in moredetail and we found that it was only present during ap-proximately160s of data during the1996May4obser-vation.The QPO could then be directly observed in the4Discovery of a∼7Hz QPO in4U1820–30light curve(Figure3bottom panel).When measured in 32-s time intervals the QPO frequency shifted erratically between5.5and8Hz and had at certain times a FWHM of only0.5±0.2Hz.The frequency drifts of the QPO caused the FWHM to be∼2Hz in all QPO data com-bined.We used these160s of data showing the QPO to study the energy dependence of its amplitude.Wefixed the frequency(7.2±0.1Hz)and FWHM(2.2±0.4Hz)to the values obtained by using the total energy range(rms amplitude of5.6%±0.2%;11.8σ).The rms amplitude in the energy bands2.8–5.3,5.3–6.8,6.8–9.3,9.3–10.8,and 10.8–18.2keV,were3.7%±0.5%,5.0%±0.8%,7.3%±0.6%, 7.1%±1.3%,and6.9%±0.9%,respectively.The95%con-fidence upper limits on the presence of the QPO outside the160s interval were between1%and1.5%(total energy range).We performed time lag measurements between the energy bands2.8–6.8and6.8–18.2keV.The time lag of–1.2±3.4ms is consistent with being zero.We determined the X-rayflux during the time of the QPO byfitting the X-ray spectrum with an absorbed black body plus a power law.We obtained a2–25keV X-ray flux of1.1×10−8erg s−1cm−2.This corresponds to a2–25keV X-ray luminosity of5.4×1037erg s−1,assuming a distance of6.4kpc(Vacca,Lewin,&van Paradijs1986). The power law index was∼2.8indicating that not much flux was present above25keV.3.DISCUSSIONWe have discovered a very significant∼7Hz QPO in the X-rayflux of the globular cluster LMXB and atoll source 4U1820–30.This QPO was only observed during a small part of the data,when the source was in the uppermost part of the banana branch in the CD.It is thought that the mass accretion rate increases monotonically along the ba-nana branch from the lower to the upper banana(Hasinger &van der Klis1989).If true,then the7Hz QPO was only detected during the highest observed mass accretion rate in this source.Note that,although the QPO was only detectable when the source was at the uppermost part of the banana branch,the count rate then was not the high-est observed(Fig.3).It seems that in this source,similar to what has been observed in the atoll sources4U1636–53 (van der Klis1990;Prins&van der Klis1997)and4U 1608–52(M´e ndez et al.1998),the count rate does not have a one-to-one relation with the mass accretion rate. Owing to the small amount of data showing the QPO it is difficult to compare this QPO with QPOs observed in other X-ray binaries.Similar frequency QPOs have been observed in a wide range of sources.For example,in black hole candidates(BHCs)QPOs with frequencies around7 Hz were observed in several systems(see van der Klis1995 for a review).However,recently it was shown(Wijnands& van der Klis1998b)that at least some of these BHC QPOs are most likely related to the QPOs seen in atoll sources between20and70Hz.When4U1820–30is on the lower part of the banana branch,thus at lower mass accretion rates,we detect a significant∼70Hz QPO(Fig.2),similar to what is observed in other atoll sources.This indicates that the7Hz QPO is most likely not related to the7Hz BHC QPOs,unless the70Hz QPO decreased in frequency from70to7Hz from the lower banana branch to the up-per part,opposite to what would be expected(e.g.,Ford &van der Klis1998).In the X-ray dipper4U1323–62a strong(∼10%rms am-plitude)QPO was recently discovered near1Hz(Jonker et al.1998).The production of this QPO is thought to be related to the high(>70◦)inclination of this system. Although the modulation of the X-rayflux at the11-min orbital period(Stella,Priedhorsky,&White1987b)sug-gested a high inclination for4U1820–30,the strong mod-ulation observed in the ultravioletflux of this source indi-cates that the inclination most likely is between35◦and 50◦(Anderson et al.1997),making a common production mechanism of the two types of QPOs unlikely.This con-clusion is further strengthened by the differences between the QPOs.The strength of the1Hz QPO in4U1323–62only marginally increased with photon energy and it is observed almost continuously(even in the dips and the X-ray bursts),both contrary to the case of our7Hz QPO. The most likely identification of the7Hz QPO in4U 1820–30is with the7Hz QPOs observed in the Z sources, when they are accreting near the Eddington mass accretion rate(see van der Klis1995).This identification cannot be tested by comparing the time lags of the different QPOs. The non-detection of time lags in4U1820–30is consis-tent with the non-detection in Scorpius X-1(Dieters et al.1999),but inconsistent with the large(∼80ms)time lags reported in Cygnus X-2(Mitsuda&Dotani1989). However,besides the similar frequencies,also the power spectral evolution with increasing mass accretion rate is very similar between the Z sources and4U1820–30.In the Z sources at low observed accretion rates,relatively strong(10–20%)band limited noise is present,which de-creases in amplitude when the accretion rate is increasing. At a certain accretion rate,this noise is hardly detectable, but a new component arises near7Hz,which evolves in a clear QPO.The power spectral evolution of4U1820–30 is remarkably similar(Fig.2).Seen in this light,it is not surprising that the7Hz QPO in4U1820–30is only ob-served in the highest observed mass accretion rate.The NBOs in the Z sources are observed when these sources accretion near the Eddington accretion rate(Hasinger& van der Klis1989;see,e.g.,Penninx1989and Smale1998 for the value of the accretion rate when the Z sources are on their normal branches).However,the X-ray luminosity in4U1820–30is,assuming isotropic emission,at max-imum∼40%of the Eddington critical luminosity if the companion star has cosmic abundance.As the compan-ion star is most likely a helium white dwarf(Stella et al. 1987a),the X-ray luminosity might be only∼20%of the (helium)Eddington critical luminosity.Thus,barring a large anisotropy in the X-ray emission,the accretion rate in4U1820–30is well below the Eddington critical accre-tion rate and below the accretion rate of the Z sources when they exhibited their7Hz QPOs.This would mean that,if the7Hz QPO in4U1820–30is caused by the same physical mechanism as similar frequency QPOs in the Z sources,then the formation mechanism behind these QPOs is already activated in4U1820–30well below the critical Eddington luminosity.Note added in manuscript:After we submitted this Let-ter,we analyzed the PCA data of4U1820–30used by Smale et al.(1997)and Zhang et al.(1998).During some of their observations the7Hz QPO was detected,again only at times when the source was in the uppermost part of the banana branch.When the source was at slightly5 Fig. 3.—The2–18.2keV light curves of4U1820–30on1996May4.In the top panel each point corresponds to1s,in the middle panelto0.25s,and in the bottom panel to1/64s.Typical errors are70counts s−1in the top panel,125counts s−1in the middle panel,and500 counts s−1in the bottom panel.The QPO is only visible between∼3150and3350s since the start of the observation.lower inferred mass accretion rate,broad peaked noise waspresent near10Hz,which might be related to the QPO.These observations will be discussed in a forthcoming pa-per.This work was supported in part by the NetherlandsFoundation for Research in Astronomy(ASTRON)grant781-76-017.This research has made use of data ob-tained through the High Energy Astrophysics ScienceArchive Research Center Online Service,provided by theNASA/Goddard Space Flight Center.We thank JeroenHoman for stimulating discussions and comments on anearlier version of this document.6Discovery of a∼7Hz QPO in4U1820–30REFERENCESAlpar,M.A.&Shaham,J.1985,Nature,316,239Alpar,M.A.,Hasinger,G.,Shaham,J.,&Yancopoulos,S.A&A, 257,627Dieters,S.,Vaughan,B.,Kuulkers,E.,&van der Klis,M.1999, A&A,submittedAnderson,S.F.,Margon,B.,Deutsch,E.W.,Downes,R.A.,& Allen,R.G.ApJ,482,L69Ford,E.,Kaaret,P.,Tavani,M.,Barret,D.,Bloser,P.,Grindlay, J.,Harmon,B.A.,Paciesas,W.S.,Zhang,S.N.1997,ApJ,475, L123Ford,E.,&van der Klis,M.1998,ApJ,506,L39Ford,E.C.,van der Klis,M.,&Kaaret,P.1998,ApJ,498,L41 Fortner,B.,Lamb,F.K.,&Miller,G.S.1989,Nature,342,775 Hasinger,G.,&van der Klis,M.1989,A&A,225,79Jonker,P.G.,van der Klis,M.,&Wijnands,R.1998,ApJLetters, submittedM´e ndez,M.,van der Klis,M.,Ford,E.C.,Wijnands,R.,&van Paradijs,J.1998,ApJLetters,in pressMitsuda,K.&Dotani,T.1989,PASJ,41,557Penninx,W.1989,In:23rd ESLAB Symposium on Two Topics in X Ray Astronomy,Bologna,Italy,13–20September,1989,p.185–196(eds.J.Hunt&B.Battrick),ESA SP–296Prins,S.&van der Klis,M.1997,A&A,319,498Smale,A.1998,ApJ,498,L141Smale,A.,Zhang,W.,&White,N.E.1997ApJ,483,L119 Stella,L.,White,N.E.,&Priedhorsky,W.1987a,ApJ,315,L49Stella,L,Priedhorsky,W.,&White,N.E.1987b,ApJ,312,L17 Strohmayer,T.E.,Zhang,W.,Swank,J.H.,Smale,A.,Titarchuk, L.,&Day,C.1996,ApJ,469,L9van der Klis,M.,Hasinger,G.,Damen, E.,Penninx,W.,van Paradijs,J.,&Lewin,W.H.G.1990,ApJ,360,L19van der Klis,M.1995,in X-ray Binaries,W.H.G.Lewin,J.van Paradijs,&E.P.J.van den Heuvel(eds.),(Cambridge University Press),252van der Klis,M.,Swank,J.H.,Zhang,W.,Jahoda,K.,Morgan,E.H.,Lewin.W.H.G.,Vaughan,B.,&van Paradijs,J.1996,ApJ,469,L1Vacca,W.D.,Lewin,W.H.G.,&van Paradijs,J.1986,MNRAS, 220,339Wijnands,R.&van der Klis,M.1998a,ApJ,507,L63 Wijnands,R.&van der Klis,M.1998b,ApJ,in press(astro-ph/9810342)Wijnands,R.,van der Klis,M.,M´e ndez,M.,van Paradijs,J.,Lewin, W.H.G.,Lamb,F.K.,Vaughan,B.,Kuulkers,E.1998,ApJ,495, L39Yoshida,K.,Mitsuda,K.,Ebisawa,K.,Ueda,Y.,Fujimoto,R., Yaqoob,T.,Done,C.1993,PASJ,45,605Zhang,W.1995,XTE/PCA Internal MemoZhang,W.,Jahoda,K.,Swank,J.H.,Morgan,E.H.,&Giles,A.B.1995,ApJ,449,930Zhang,W.,Smale,A.P.,Strohmayer,T.E.,Swank,J.H.1998,ApJ, 500,L171。
麦类作物学报 2023,43(10):1344-1350JournalofTriticeaeCropsdoi:10.7606/j.issn.1009 1041.2023.10.16网络出版时间:2023 07 13网络出版地址:https://kns.cnki.net/kcms2/detail/61.1359.s.20230712.1927.021.html小麦分蘖数目遗传研究进展与展望收稿日期:2022 06 14 修回日期:2022 07 31基金项目:镇江市农业科学院青年基金项目(QNJJ2021002);江苏省作物基因组学和分子育种重点实验室开放课题项目(PL202008);江苏省农业自主创新资金项目(CX(21)3065)第一作者E mail:xueyi_shen@163.com通讯作者:温明星(E mail:wmxcell2007@163.com)申雪懿,李东升,陈琛,曲朝喜,郭瑞,姚维成,刘家俊,邓篧,温明星(江苏丘陵地区镇江农业科学研究所,江苏句容212400)摘 要:分蘖数目是决定小麦产量的重要性状之一。
在小麦生长发育过程中,分蘖是一个复杂的生理过程。
了解小麦分蘖数目的分子遗传机制有利于对小麦株型进行精准改良。
本文从分蘖生长发育过程、分蘖数目遗传位点的挖掘以及相关基因的克隆三方面进行综述,并对小麦分蘖数目性状的研究进行展望,以期为小麦分蘖遗传研究和品种改良提供参考。
关键词:小麦;分蘖数目;遗传位点;育种改良中图分类号:S512.1;S330 文献标识码:A 文章编号:1009 1041(2023)10 1344 07犘狉狅犵狉犲狊狊犪狀犱犘狉狅狊狆犲犮狋狅犳犌犲狀犲狋犻犮犚犲狊犲犪狉犮犺狅狀犜犻犾犾犲狉犖狌犿犫犲狉犻狀犠犺犲犪狋犛犎犈犖犡狌犲狔犻,犔犐犇狅狀犵狊犺犲狀犵,犆犎犈犖犆犺犲狀,犙犝犆犺犪狅狓犻,犌犝犗犚狌犻,犢犃犗犠犲犻犮犺犲狀犵,犔犐犝犑犻犪犼狌狀,犇犈犖犌犢犪狅,犠犈犖犕犻狀犵狓犻狀犵(ZhenjiangInstituteofAgriculturalSciencesintheHillyAreaofJiangsuProvince,Jurong,Jiangsu212400,China)犃犫狊狋狉犪犮狋:Tillernumberisoneofthemostimportanttraitswhichdetermineswheatyield.Duringthegrowthanddevelopmentofwheat,theregulationoftilleringisacomplexphysiologicalprocess.Un derstandingthegeneticandmolecularbasisoftillernumberinwheatisbeneficialforpreciseimprove mentofplantarchitecture.Inthispaper,wesummarizedthreeaspectsmadeinthegrowthanddevel opmentoftillering,thediscoveryofgeneticlocicontrollingtillernumber,andthecloningoftillernumberrelatedgenes,andgaveanoutlookforfutureresearchontillernumberinwheat.Thisreviewmayprovidereferenceforthegeneticresearchoftilleringandimprovementinwheatbreeding.犓犲狔狑狅狉犱狊:Wheat;Tillernumber;Geneticlocus;Breedingandimprovement 小麦是中国三大粮食作物之一。
引文格式:蒲芝雨, 杨玉菊, 张安勉, 等. 7个候选内参基因在樟叶越橘不同组织中的表达及稳定性分析[J]. 云南农业大学学报(自然科学), 2023, 38(5): 868−877. DOI: 10.12101/j.issn.1004-390X(n).2022080367个候选内参基因在樟叶越橘不同组织中的表达及稳定性分析*蒲芝雨1, 杨玉菊1, 张安勉1, 李国泽2, 余进德1, 赵 平3, 丁 勇1 **(1. 西南林业大学,云南省高校林木生物技术重点实验室,云南 昆明 650224;2. 保山中医药高等专科学校基础医学院,云南 保山 678000;3. 西南林业大学,西南地区林业生物质资源高效利用国家林业与草原局重点实验室,云南 昆明 650224)摘要: 【目的】筛选樟叶越橘不同组织部位基因表达分析的最适内参基因。
【方法】基于樟叶越橘三代转录组测序数据,筛选出PP2A -1、PP2A -2、EIF -4A -1、EIF -4A -2、60S -1、60S -2和ARP -1共7个候选内参基因;利用qRT-PCR 技术对目标基因在樟叶越橘不同组织(嫩叶、成熟叶、花芽、花、绿色果实、红色果实、绿果果梗和红果果梗)的表达水平进行检测,应用geNorm 、NormFinder 和BestKeeper 3种方法分析评估基因表达的稳定性,通过RefFinder 方法综合评价以筛选出樟叶越橘不同组织的最适内参基因;以樟叶越橘绿原酸合成途径中苯丙氨酸解氨酶基因(PAL )的组织表达情况验证内参基因稳定性评价结果的可靠性。
【结果】樟叶越橘的不同组织中,60S-2基因表达的稳定性居于首位,其次是PP2A-2基因,ARP -1、60S -1和EIF -4A -2基因表达的稳定性居中,EIF-4A-1基因表达的稳定性最差。
应用60S -2内参基因分析获得的樟叶越橘不同组织中PAL 基因表达量与绿原酸含量的变化趋势一致,表明PAL 基因参与了樟叶越橘体内绿原酸的合成。
能谱(Revolution )CT 胸腹联合胸痛三联CTA 扫描对急性胸痛患者疾病的差异分析左明飞左明飞,,温丽娟温丽娟,,焦宇齐齐哈尔医学院附属第三医院放射影像科,黑龙江齐齐哈尔 161000摘要 目的 分析能谱CT 胸腹联合胸痛三联CT 血管造影术(computed tomography angiography, CTA )扫描对急性胸痛患者疾病的差异。
方法 选取2022年9月—2023年2月齐齐哈尔医学院附属第三医院急诊收治的50例胸痛患者为研究对象,按照扫描时监测的心率分为低心率组(≤75次/min )和高心率组(>75次/min ),各25例,所有患者均行能谱CT 胸腹联合胸痛三联CTA 扫描,对比两组不同血管节段管腔平均CT 值、SNR 、CNR 。
结果 低心率组和高心率组患者肺动脉干的CT 值分别为(383.20±67.34)、(371.76±59.35)HU ,信噪比(signal noise ratio, SNR )分别为(10.35±2.65)、(10.65±2.99),噪声比(contrast noise ratio, CNR )分别为(19.75±3.16)、(20.18±4.65),两组比较,差异无统计学意义(t =0.637、0.375、0.388,P >0.05)。
两组患者主动脉、肺动脉、冠状动脉各个血管节段平均CT 值、SNR 、CNR 比较,差异无统计学意义(P >0.05)。
结论 能谱(Revolution )CT 胸腹联合胸痛三联CTA 诊断在不同心率的急性胸痛患者中应用无差异,可以满足临床应用的需求。
关键词 胸腹能谱CT ;胸痛三联CT 血管造影术;急性胸痛中图分类号 R 445 文献标志码 Adoi10.11966/j.issn.2095-994X.2023.09.08.01Differential Analysis of Disease in Patients with Acute Chest Pain by Revolution CT Chest and Abdomen Combined with Triple CTA Scanning for Chest PainZUO Mingfei, WEN Lijuan, JIAO YuDepartment of Radiologic Imaging, the Third Affiliated Hospital of Qiqihar Medical College, Qiqihar, Heilongjiang Province, 161000 China Abstract Objective To analysis differential of disease in patients with acute chest pain by revolution CT chest and abdomen combined with triple computed tomography angiograph (CTA) scanning for chest pain. Methods Fifty patients with chest pain admitted to the emergency de⁃partment of the Third Affiliated Hospital of Qiqihar Medical College from September 2022 to February 2023 were selected as study objects. According to the heart rate monitored at the time of scanning, they were divided into low heart rate group (≤75 beats/min) and high heart rate group (>75 beats/min), with 25 cases in each group. All patients underwent revolution CT chest and abdomen combined with chest pain triple CTA scanning, and the mean CT, SNR, CNR values of the lumen of different vascular segments were compared between the two groups. Re⁃sults The CT values of pulmonary arteries in low heart rate group and high heart rate group were (383.20±67.34) HU and (371.76±59.35) HU, signal noise ratio (SNR) were (10.35±2.65) and (10.65±2.99), and contrast noise ratio (CNR) were (19.75±3.16) and (20.18±4.65), respec⁃tively, and the differences were not statistically significant (t =0.637, 0.375, 0.388, P >0.05). There was no statistically significant difference in the mean CT value, SNR and CNR of each vascular segment of the aorta, pulmonary artery and coronary artery between the patients of two groups(P >0.05). Conclusion There is no difference in the application of revolution CT chest and abdomen combined with triple CTA diagnosis of chest pain in patients with acute chest pain with different heart rates, which can meet the needs of clinical application.Key words Revolution CT chest and abdomen; Chest pain triple CTA; Acute chest pain* 论著 *收稿日期:2023-06-01;修回日期:2023-06-21基金项目:齐齐哈尔市科技计划联合引导项目(LSFGG-2022027)。
Detection of Escherichia coli O157:H7virulence genes in isolates from beef,pork,water,human and animal species in the northwest province,South Africa:public health implicationsCollins Njie Ateba *,Moses Mbewe 1Dale Beighle Centre for Animal Health Studies,School of Agricultural Sciences,North-West University e Mafikeng Campus,P .Bag X2046,Mmabatho 2735,South AfricaReceived 6October 2010;accepted 8November 2010Available online 25January 2011AbstractThe aim of theandidentify Escherichia coliO157:H7from pigs,cattle,andwatersamplestheir by A total of 220samples coli O157:H7were for the by PCR and 130isolates was pigs and pork 88(67.7%)than in cattle water 3(2.3%)or was more frequently isolated from faecal (16.9%e 43.1%)than from meat samples (10.8%e 24.6%).A large proportion d 73isolates possessed the hlyA gene,while 48(36.9%)harboured the eaeA gene.Although there were no major differences in the number of isolates harbouring the stx 1and stx 2genes,respectively,only a small proportion 13(10%)harboured both shiga toxin genes.Despite this,the proportion of isolates that possessed the stx 129(22.3%)was higher the stx 2gene.None of the E.coli O157:H7isolates harboured all four shiga-toxin producing E.coli (STEC)virulence genes When comparing the proportion of isolates obtained from the different sample sources and/or stations,significant positive between isolates from Mafikeng and Lichtenburg (r ¼0.981,p <0.05)and those from Mafikeng and Rustenburg (r ¼0.991,p <0.05).These results therefore indicate that meat and faeces samples obtained from major cities in the northwest province were contaminated with E.coli O157:H7.We suggest that there is a need for improving the sanitary conditions of farms,abattoirs and butcher shops.This could reduce transmission of E.coli O157:H7to humans.Ó2011Institut Pasteur.Published by Elsevier Masson SAS.All rights reserved.Keywords:Escherichia coli O157:H7;rfb O157;fliC H7;Cattle;Pigs;Humans1.IntroductionShiga-toxin-producing Escherichia coli are food-borne pathogens that cause diseases in humans (Bell,2000;Leelaporn et al.,2003;Nunes et al.,2003;Maruzumi et al.,2005;Sugiyama et al.,2005).Serotype O157:H7,in particular,has attracted significant attention due to its ability to cause disease even when only a few bacterial cells are present in food and/or water(Armstrong et al.,1996;Buchanan and Doyle,1997).Diseases caused by E.coli O157:H7in humans include watery and/or bloody diarrhoea,haemorrhagic colitis (HC),haemolytic urae-mic syndrome (HUS)and thrombotic thrombocytopenic purpura (TTP)(Griffin and Tauxe,1991;Armstrong et al.,1996;Weir,2000;Sugiyama et al.,2005).These infections are usually severe in young children,elderly subjects and immunocom-promised individuals (Riley et al.,1983;Duffy et al.,2006;Razzaq,2006;Walch et al.,2006).The ability of E.coli O157:H7to cause disease is associated with production of potent toxins.Shiga toxin genes designatedstx 1and stx 2are the major virulence factors (Pie´rard et al.,1997;Law,2000).Alongside shiga toxins,other variants of stx 2,eaeA ,*Corresponding author.Tel.:þ27183892247;fax:þ27183892134.E-mail addresses:atebacollins1@ (C.N.Ateba),moses.mbewe@nwu.ac.za (M.Mbewe).1Tel.:þ27183892702,þ27728657464(mobile);fax:þ27183892748.Research in Microbiology 162(2011)240e 248/locate/resmic0923-2508/$-see front matter Ó2011Institut Pasteur.Published by Elsevier Masson SAS.All rights reserved.doi:10.1016/j.resmic.2010.11.008本页已使用福昕阅读器进行编辑。
QTL detection of seven spike-related traits and their genetic correlations in wheat using two related RIL populationsFa Cui•Anming Ding•Jun Li•Chunhua Zhao•Lin Wang•Xiuqin Wang•Xiaolei Qi•Xingfeng Li•Guoyu Li•Jurong Gao•Honggang WangReceived:16December2010/Accepted:4October2011/Published online:19October2011ÓSpringer Science+Business Media B.V.2011Abstract Spike-related traits contribute greatly to grain yield in wheat.To localize wheat chromosomes for factors affecting the seven spike-related traits—i.e.,the spike length(SL),the basal sterile spikelet number(BSSN),the top sterile spikelet number (TSSN),the sterile spikelet number in total(SSN), the spikelet number per spike(SPN),the fertile spikelet number(FSN)and the spike density(SD)—two F8:9recombinant inbred line(RIL)populations were generated.They were derived from crosses between Weimai8and Jimai20(WJ)and between Weimai8and Yannong19(WY),comprising485and 229lines,bining the two new linkage maps and the phenotypic data collected from the four environments,we conducted quantitative trait locus(QTL)detection for the seven spike-related traits and evaluated their genetic correlations.Up to190 putative additive QTL for the seven spike-related traits were detected in WJ and WY,distributing across all the21wheat chromosomes.Of these,at least nine pairwise QTL were common to the two populations.In addition,38QTL showed significance in at least two of the four different environments,and18of these were major stable QTL.Thus,they will be of great value for marker assisted selection(MAS)in breeding programs.Though co-located QTL were universal, every trait owned its unique QTL and even two closely related traits were not excluded.The two related populations with a large/moderate population sizeF.Cui,A.Ding,J.Li and C.Zhao contributed equally to this work.Electronic supplementary material The online version of this article(doi:10.1007/s10681-011-0550-7)contains supplementary material,which is available to authorized users.F.CuiÁA.DingÁJ.LiÁC.ZhaoÁX.QiÁX.LiÁG.LiÁJ.GaoÁH.Wang(&)State Key Laboratory of Crop Biology,Shandong Key Laboratory of Crop Biology,Taian Subcenter of National Wheat Improvement Center,College of Agronomy, Shandong Agricultural University,271018Taian,China e-mail:hgwang@F.CuiCenter for Agricultural Resources Research,Institute of Genetics and Developmental Biology,Chinese Academy of Sciences,050021Shijiazhuang,Hebei,Chinae-mail:sdaucf@ J.LiTianxing Biotechnology Co.Ltd.,Handian Industrial Zone,256200Zouping,Shandong,ChinaL.WangMunicipal Academy of Agricultural Sciences, 272031Jining,Shandong,ChinaX.WangMunicipal Academy of Agricultural Sciences, 277100Zaozhuang,Shandong,ChinaEuphytica(2012)186:177–192 DOI10.1007/s10681-011-0550-7made the results authentic and accurate.This study will enhance the understanding of the genetic basis of spike-related traits.Keywords WheatÁSpike-related traitsÁRILsÁQTLÁGenetic correlationsIntroductionWheat(Triticum aestivum L.)is a major food crop worldwide.Grain yield in cereals is generally controlled by polygenes,and environment greatly influences their expression.Thus,it is difficult to manipulate and improve breeding programs.In addition,as an allohex-aploid carrying the genomes AABBDD(2n=6x= 42),the large genome size of wheat makes it difficult to elucidate the genetic basis of yield-related traits.Three yield components—productive spikes per unit area,kernels per spike and kernel weight—together determine the yield level of wheat.Indeed,these component traits are also under quantitative trait locus (QTL)control,but they exhibit less environmentally sensitive and higher heritabilities than that of the yield (Ma et al.2007).Thus,it is efficient to dissect factors affecting yield by partitioning it into its components.Of these,spike characteristics determine the number of kernels per spike,thus,to a certain extent,determining the yield level.In addition,variation in spike morphol-ogy is one of the most widely used criteria for species determination and is extensively investigated.So it is of importance to unravel the control mechanism of spike-related traits at the QTL level.As we know,three major genes—Q,C and S1—play critical roles in determining gross spike mor-phology,and they were located on chromosomes5A, 2D and3D,respectively(Sears1954;Rao1977;Kato et al.1999;Sourdille et al.2000;Paillard et al.2003; Johnson et al.2008).As allelic variation hardly exists at these loci at the sub-species level,differences in spike morphology of different common wheat varie-ties cannot always be attributed to these three major genes.In fact,many previous studies have proven that almost all the twenty-one wheat chromosomes har-bored factors affecting spike-related traits(Kuspira and Unrau1957;Sourdille et al.2000;Kato et al. 2000;Bo¨rner et al.2002;Li et al.2002;Sourdille et al. 2003;Jantasuriyarat et al.2004;Aguilar et al.2005; Suenaga et al.2005;Liu et al.2006;Marza et al.2006;Kumar et al.2007;Kirigwi et al.2007;Ma et al.2007; Li et al.2007;Chu et al.2008;Deng et al.2010; Manickavelu et al.2010).In addition,the spikelet sterility is an important determinant of the kernel number per spike,when the total spikelet number per spike isfixed.However, limited QTL for sterile spikelet number per spike have now been documented(Ma et al.2007;Li et al.2007). Both basal spikelet and top spikelet are prone to be sterile,and they account for the total number of sterile spikelet number per spike jointly.Thus far,no report has provided information regarding QTL detection for the top sterile spikelet number and the basal sterile spikelet number.Population size has a great effect on the estimation of QTL number and genetic effect(Beavis1998; Mackay2001;Scho¨n et al.2004;Vales et al.2005; Zou et al.2005;Buckler et al.2009).The precision and efficiency of QTL detection will be enhanced by combining more than two related populations(Kumar et al.2007;Ma et al.2007;Buckler et al.2009;Uga et al.2010).For the present study,we performed QTL detection for seven spike-related traits using two related populations,one of which was a large popu-lation with up to485lines and the other of which was smaller,comprising229lines.The objectives of this study were to:(i)accurately identify the genetic factors affecting spike-related traits,(ii)identify markers that can be used in marker assisted selection (MAS)in wheat breeding programs and(iii)specify the genetic relationships among the seven spike-related traits at the QTL level.Materials and methodsExperimental populations and their evaluationTwo F8:9recombinant inbred line(RIL)populations derived from crosses between three Chinese common wheat varieties,i.e.,between Weimai8and Jimai20 (WJ)and between Weimai8and Yannong19(WY), comprising485and229lines,respectively,were used in the present study.Weimai8is a large-spike type of the ideotype model and was released by Weifang Municipal Academy of Agricultural Sciences,Shan-dong,China in2003;Jimai20and Yannong19,two superior quality wheat varieties,are multi-spike types, and they were released by Crop Research Institute,Shandong Academy of Agricultural Sciences,China in 2003,and by Yantai Municipal Academy of Agricul-tural Sciences,Shandong,China in2001,respectively (Donald1968).In addition,the common parent Weimai8is a1BL/1RS translocation line whereas the other two parents have the common1B chromo-some.The parents together with the RILs,were evaluated in four environments in Shandong province, China;Tai’an in2008–2009(E1),Tai’an in2009–2010 (E2),Zaozhuang in2009–2010(E3)and Jining in 2009–2010(E4).The485WJ RILs,229WY RILs and the three parents were planted in a single replication at each environment,using a two-row plot with rows2m long and30.0cm apart,and50seeds were planted in each row.Normal agricultural practices were applied for disease and weed control.From each plot,10 representational primary tillers in the middle row were selected before harvest as samples to measure the seven spike-related traits.Traits examined included the spike length(SL)in centimeters,measured from the base of the rachis to the top of the uppermost spikelet, excluding the awns;the basal sterile spikelet number (BSSN);the top sterile spikelet number(TSSN);the sterile spikelet number(SSN)equal to BSSN plus TSSN;and the spikelet number per spike(SPN) including SSN.The fertile spikelet number(FSN) was estimated by subtracting SSN from SPN.The spike density(SD)or compactness was calculated as SD=1009SPN/SL.Correlation coefficients were calculated to determine phenotypic correlations among traits.Analysis of molecular and biochemical markers Wheat leaf tissues from the RILs and the parents were collected for DNA extraction following the procedure described by Stein et al.(2001),but with minor modifications,using70%ethanol as washing solution. Molecular markers,including G-SSR,EST-SSR,ISSR, STS,SRAP and RAPD,were used to genotype the three parents and their derived lines.Of them,the relevant information regarding G-SSR markers—including BARC,CFA,CFD,CFT,GWM,GDM,GPW,WMC and PSP codes,as well as PCR-based STS markers of the MAG code—were taken from the GrainGenes Web site().Relevant information about EST-SSR markers prefixed CFE,KSUM and CNL were publicly available(da. gov/ITMI/EST-SSR/).EST-SSR markers of SWES and ww codes were developed and kindly provided by Professor Sishen Li,College of Agronomy,Shandong Agricultural University,China.EST-SSR markers with the prefixes CWEM,EDM and CWM were published in reference articles by Peng and Lapitan(2005),Mullan et al.(2005)and Gao et al.(2004),respectively.ISSR markers were developed by the University of British Columbia Biotechnology Laboratory(UBCBL)(Na-gaoka and Ogihara1997).Relevant information about chromosome1RS-specific markers of rye were detailed by Zhao et al.(2009),and functional markers,by Liu et al.(2008)and Liang et al.(2010),respectively.Each PCR reaction for G-SSR,EST-SSR and PCR-based STS markers was conducted in a total volume of 25l l in a TakaRa PCR thermal cycler or in a Bio-Rad 9600thermal cycler.PCR reaction mixture was compounded according to the formula described by Ro¨der et al.(1998).Amplifications were performed using a touchdown PCR protocol detailed by Hao et al. (2008).PCR reaction mixture,as well as PCR protocol for SRAP and ISSR markers followed the formula and the procedure detailed by Li et al.(2007),and for RAPD markers,by Suenaga et al.(2005).The PCR products were separated in6%non-denaturing poly-acrylamide gels.Gels were then silver stained and photographed.The types of high molecular weight glutenin subunits(HMW-GS)were detected by using sodium dodecyl sulfate polyacrylamide gel electro-phoresis(SDS–PAGE)(Singh and Shepherd1991). Markers of BARC,CFA,CFD,GWM,GDM and WMC codes were also screened against the nullisom-ic-tetrasomic stocks of Chinese Spring(CSNT)to assign them to chromosomes,where possible. Construction of the genetic linkage mapLinkage groups were constructed by MAPMAKER 3.0(Lander et al.1987).First,21groups were defined using‘‘make chromosome’’command.Then,the ‘‘ANCHOR’’command was used to locate marker loci to chromosomes based on the CSNT identifica-tion and the public genetic maps in GrainGenes 2.0(/GG2/index.shtml).The assignment of the remaining loci to chromosomes was made using the‘‘ASSIGN’’command at a LOD of3.0 with distance less than45cM.Based on the linkage group defined above,JoinMap,version4.0(Biometris, Wageningen,The Netherlands,http://www.joinmap. nl),was used to determine the order of markers oneach group and draw the linkage map.The groups identified from the same chromosome were not linked if the distance was more than50cM.Centimorgan units were calculated using the Kosambi mapping function(Kosambi1944).Phenotypic data analysis and QTL detectionBasic statistical analysis for the phenotypic data in the two RIL populations was implemented by the software SPSS13.0(SPSS,Chicago,USA).If both skewness and kurtosis were less than1.0in absolute,the trait followed a normal distribution in the RIL population. The estimated broad-sense heritability of the corre-sponding traits was calculated with the formula h2=r G2/(r G2?r e2).Due to replications r=1in the present study,it was not possible to estimate geno-type9enviroment interaction variance,error vari-ance(r e2)was calculated with the formular: r e2=r P2-r E2-r G2,where r P2,r E2and r P2are the phenotypic variance,environmental variance and genetic variance,respectively.QTL screen were conducted using inclusive composite interval mapping by IciMapping3.0based on stepwise regression of simultaneous consideration of all marker information (/).The missing phenotype was deleted using the‘‘Deletion’’command.The walking speed chosen for all QTL was1.0cM and the probability in stepwise regression was0.001.The threshold LOD scores were calculated using1,000 permutations,Type1error being0.05.However,we ignored the QTL with a LOD value of\2.5to make the QTL reported herein authentic and reliable.In both WJ and WY populations,phenotypic values of all RILs in E1,E2,E3,E4,and the combined phenotypic values(C)that were averaged from the four different environments above,were used for QTL detection, respectively.A QTL with a maximum LOD value of [3.0and a contribution rate of[10%was defined as a major QTL,and that showing significance in at least two of the four different environments as a stable QTL.The assignment of a QTL name is named according to the following rules:italic uppercase‘Q’denotes‘QTL’;letters following it before thefirst period are the abbreviation of the corresponding trait; the next uppercase letters before the second period indicates the population in which the corresponding QTL was detected;next,a numeral plus an uppercase letter,‘A’,‘B’or‘D’,indicates the wheat chromosome on which the corresponding QTL was detected;the last numeral after the third period denotes the number of trials in which the corresponding QTL was detec-ted;and if the name of two different QTL for the same trait look the same,a lowercase letter,e.g.,a,b,c or d, was used to distinguish them.ResultsPhenotypic performance of the two RILsand correlations among the seven spike-relate traits.Thefinal seven spike-related traits for the two RIL populations and the parents in the four environments are shown in Table1.Among the four environments, significant differences of SL existed at the0.05level between Weimai8and Jimai20,as did SL and SD between Weimai8and Yannong19.SSN,BSSN and TSSN showed inconsistency over environments,indi-cating strongly affected by environment.The common parent Weimai8owns longer spike but lower spike density,than that of the remaining two parents.In both mapping populations,FSN,SL,SD and SPN showed a goodfit to normal distribution in all the environments, with exception of two environments for SL in the WJ population.Phenotypic distributions of SSN,BSSN and TSSN showed inconsistency over environments, either normality or nonnormality,indicating that they were strongly influenced by environment.The seven spike-relate traits showed transgressive segregation in all the environments in both WJ and WY.The estimated broad-sense heritabilities of the seven spike related traits ranged from12.36to97.37%.Of these, SD had the highest heritability in both populations, next to SL;BSSN had the lowest heritability,next to SSN.Phenotypic correlations between pairwise spike-related traits are listed in Table2.In both WJ and WY,higher positive correlation coefficients were observed between SSN and BSSN,SSN and TSSN, FSN and SL,FSN and SD,FSN and SPN,SL and SPN and between SD and SPN,and higher negative correlation coefficients were between SSN and FSN, BSSN and FSN,TSSN and FSN,and between SL and SD.T a b l e 1P h e n o t y p i c v a l u e s f o r s p i k e -r e l a t e d t r a i t s o f t h r e e p a r e n t s a n d t h e t w o R I L p o p u l a t i o n s i n f o u r g r o w i n g e n v i r o n m e n t s i n w h e a tT r a i t (h 2%)(P v a l u e )aE n .bP a r e n tW J cW Y aW e i m a i 8J i m a i 20Y a n n o n g 19M e a n S .D .M i n –M a x S k e w n e s s K u r t o s i s M e a n S .D .M i n –M a x S k e w n e s s K u r t o s i sS S N E 11.403.602.902.470.990–5.670.260.352.610.970.64–0.850.640.85(14.26/22.34)E 202.401.300.640.740–6.003.1215.741.101.120–6.001.833.42(0.219/0.577)E 301.3001.471.080–5.000.39–0.332.351.040–6.000.420.19E 41.200.200.590.660–4.662.127.291.070.970–5.601.723.96B S S N E 11.402.402.002.110.780–4.30–0.080.032.280.790.33–5.000.470.45(12.36/15.99)E 201.001.000.330.370–1.601.150.650.490.460–2.200.790.09(0.234/0.463)E 301.2000.720.640–3.000.40–0.480.970.660–2.000.03–0.72E 400.200.160.280–2.000.282.300.470.450–2.601.352.02T S S N E 101.200.900.350.210–2.671.824.370.320.510–3.002.588.40(75.05/35.75)E 201.400.300.310.640–5.805.0033.570.611.040–5.402.284.91(0.457/1.00)E 300.1000.760.740–3.000.700.071.380.880–4.000.900.80E 41.2000.420.590–4.400.592.650.670.910–5.202.447.05F S N E 117.9013.1017.1017.811.6212.33–22.670.190.0416.231.799.67–20.33–0.410.38(45.33/38.79)E 218.4015.2017.1018.611.4912.80–22.800.110.7417.441.4213.20–21.40–0.290.55(0.108/0.914)E 322.0017.7022.0020.441.7016.00–25.000.10–0.1119.281.7013.00–23.00–0.210.13E 419.2019.2020.6020.071.4214.60–24.200.960.3318.981.3514.60–22.00–0.610.77S L E 110.849.029.3410.031.296.98–15.141.001.909.801.217.10–13.390.29–010(67.44/61.94)E 210.589.368.6010.051.837.10–15.161.180.689.210.976.88–12.180.19–0.20(0.015/0.008)E 312.0010.5010.0211.451.418.10–16.400.670.9910.711.267.70–14.800.24–0.12E 410.899.419.5510.390.877.91–13.340.260.289.890.817.55–14.650.650.98S D E 1178.41184.77213.98204.4921.90143.86–280.210.110.44194.4422.97144.40–269.650.330.04(96.75/97.37)(0.188/0)E 2173.91188.03213.95193.7222.07131.38–289.240.560.90203.3322.59152.29–284.880.450.24E 3183.33180.95220.00193.5724.36135.20–297.62–0.568.44204.7724.72148.65–298.700.420.58E 4187.33204.04217.80199.8517.53146.93–273.000.270.67203.9917.45137.88–275.5000.640.98Construction of genetic linkage mapsThe genetic map constructed based on the WJ population included 338loci on the wheat chromo-somes spanned 2,855.5cM,with an average density of one marker per 8.45cM.There were six linkage gaps with linkage distances [50cM.Marker distribution ranged from 44on chromosome 4A to 3on chromo-somes 4D and 7D.The WY population was used to establish a genetic map consisting of 357loci distrib-uted in 27linkage groups with 6linkage gaps,and it covered 3,010.70cM of the whole genome with an average distance of 8.43cM between the adjacent loci.The number of markers per chromosome ranged from 39on chromosome 1A to 3on chromosome 3D.The two linkage maps contained 69common loci.The chromosomal locations and the orders of the markers in the two maps were generally in agreement with the published reports in GrainGenes 2.0(/GG2/index.shtml ).Positions of the loci common to the two maps were approximately in accordance.In addition,a 1BL/1RS translocation event was confirmed by the linkage maps of chromo-some 1B in both WJ and WY (Fig.1).Functional markers and biochemical markers were accurately mapped to their corresponding chromosomes.The recommended map distance for genome-wide QTL scanning is an interval length less than 10cM (Doer-ge,2002).Thus,the maps were suitable for genome-wide QTL scanning in this study.QTL mapping in the WJ and WY population Up to 190putative additive QTL for the seven spike-related traits were detected in the two populations,nine pairwise of which,at least,were common to the two populations (Fig.1;Table 3,Supplementary Tables S1and S2).They together covered all the twenty-one wheat chromosomes.Of these,38QTL showed significance in at least two of the four different environments,accounting for 20.00%of the total QTL (Table 4).Forty-six QTL were major QTL contribut-ing to more than 10%of phenotypic variance,18of which were major stable QTL.Sterile spikelet numberOverall,in the five trials,fifteen segments were identified to govern SSN in WJ (Supplementary TableT a b l e 1c o n t i n u e dT r a i t (h 2%)(P v a l u e )aE n .bP a r e n tW J cW Y aW e i m a i 8J i m a i 20Y a n n o n g 19M e a nS .D .M i n –M a x S k e w n e s sK u r t o s i s M e a n S .D .M i n –M a x S k e w n e s sK u r t o s i sS P NE 119.3016.7020.0020.281.4013.67–24.33–0.060.9818.841.4315.00–23.000.99–0.11(51.04/42.90)E 218.4017.6018.4019.251.3816.20–25.800.630.7718.551.1815.40–21.800.30–0.30(0.100/0.808)E 322.0019.0022.0021.961.5818.00–27.000.370.2321.631.4317.00–25.00–0.26–0.19E 420.4019.2020.8020.661.3117.20–24.800.42–0.0720.051.0517.40–23.000.07–0.08S D S t a n d a r d d e v i a t i o n ,S S N S t e r i l e s p i k e l e t n u m b e r ,B S S N B a s a l s t e r i l e s p i k e l e t n u m b e r T S S N T o p s t e r i l e s p i k e l e t n u m b e r ,F S N F e r t i l e s p i k e l e t n u m b e r ,S L S p i k e l e n g t h ,S D S p i k e d e n s i t y ,S P N S p i k e l e t n u m b e r p e r s p i k eaA r a b i c n u m e r a l s i n t h e fir s t p a r e n t h e s e s a r e t h e e s t i m a t e d b r o a d -s e n s e h e r i t a b i l i t y o f t h e c o r r e s p o n d i n g t r a i t s ,c a c u l a t e d w i t h t h e f o r m u l a h 2=r G 2/(r G 2?r e 2),w h e r e r G 2i s t h e g e n e t i c v a r i a n c e a n d r e 2i s e x p e r i m e n t a l e r r o r ,a n d t h a t i n t h e s e c o n d p a r e n t h e s e s a r e P v a l u e s f o r t h e s i g n i fic a n c e o f d i f f e r e n c e b e t w e e n t h e p a r e n t s ,o f w h i c h ,t h e fir s t n u m e r a l r e f e r s t o W J ,a n d t h e s e c o n d ,t o W YbE 1,E 2,E 3a n d E 4r e p r e s e n t t h e e n v i r o n m e n t s o f 2008–2009i n T a i a n ,2009–2010i n T a i a n ,2009–2010i n Z a o z h u a n g a n d 2009–2010i n J i n i n g ,r e s p e c t i v e l ycW J a n d W Y r e p r e s e n t t h e p o p u l a t i o n s d e r i v e d f r o m t h e c r o s s e s b e t w e e n W e i m a i 8a n d J i m a i 20a n d b e t w e e n W e i m a i 8a n d Y a n n o n g 19,r e s p e c t i v e l yS1,Fig.1).Of these,one each was distributed on chromosomes1A,3B,4A,4D,5B,5D,6A,6B and7B, respectively,and two each on1D,2B and6D, respectively.QSsn.WJ.2B.3was verified in three trials,but with moderate additive effects; QSsn.WJ.3B.2and QSsn.WJ.4A.2could be identified reproducibly in two trials.The remaining12QTL could be detected only in one environment.These QTL individually explained 2.36–26.51%of the phenotypic variation.Nine putative additive QTL for SSN were revealed in WY.They individually accounted for4.92–37.59%of the phenotypic variance (Supplementary Table S2,Fig.1).These QTL were distributed across six chromosomes—three on1A,two on1D,and one each on1B,4D,6B and7B, respectively.Of these,QSsn.WY.1A.2a,accounting for35.75–37.59%of the phenotypic variation,was identified reproducibly in E2and E4,as was QSsn.WY.1A.2b in E2and C,although this explained a lower level of the phenotypic variance.The remain-ing seven QTL showed significance in only a solitary environment.In both WJ and WY,only two desirable QTL alleles for SSN were carried by Weimai8.Basal sterile spikelet numberIn total,11and eight putative additive QTL for BSSN were detected in WJ and WY,respectively(Supple-mentary Tables S1and S2,Fig.1).They were distrib-uted on chromosomes2A,2B,3D,4A,5B(2QTL), 6A,6D and7B(3QTL)in WJ,and1A,1B,2D,3A,3D, 4A,6B,7B in WY.QBssn.WJ.7B.1b exhibited48.45% of the phenotypic variation with a LOD value of9.80in WJ;however,it showed significance only in E4.Both QBssn.WJ.3D.3and QBssn.WY.7B.3were identified reproducibly in three trials,exhibiting11.17–32.90Table2Phenotypic correlations among the seven spike-related traits in both WJ and WY populations and the number of co-located QTL for pairs of traitsTrait NO.of co-located QTL a Correlation coefficient(E1/E2/E3/E4)bWJ WYSSN and BSSN5/10.592**/0.518**/0.740**/0.465**0.547**/0.377**/0.537**/0.467** SSN and TSSN6/50.835**/0.866**/0.811**/0.909**0.872**/0.912**/0.771**/0.884** SSN and FSN6/1–0.537**/–0.397**/–0.435**/–0.392**–0.606**/–0.593**/–0.543**/–0.633** SSN and SL4/1–0.112*/–0.027/–0.045/0.021–0.027/0.002/–0.059/–0.080SSN and SD5/10.162**/0.106*/0.130**/0.040–0.029/0.132*/0.104/0.132*SSN and SPN6/10.086/0.110*/0.216**/0.081–0.084/0.238**/0.084/0.105BSSN and TSSN4/20.218**/0.022/0.207**/0.0540.049/–0.036/–0.130/–0.110BSSN and FSN3/2–0.303**/–0.220**/–0.352**/–0.260**–0.337**/–0.229**/–0.319**/–0.306** BSSN and SL2/1–0.093*/–0.067/–0.060/0.0470.069/0.229**/0.108/0.035BSSN and SD1/20.104*/0.080/0.072/–0.081–0.058/–0.024/–0.073/0.096BSSN and SPN3/00.049/0.042/0.127**/–0.0470.025/0.345**/0.013/0.201**TSSN and FSN3/2–0.331**/–0.336**/–0.367**/–0.320**–0.485**/–0.634**/–0.403**/–0.623** TSSN and SL3/2–0.084/0.008/–0.17/0.002–0.157*/–0.099/–0.151*/–0.102 TSSN and SD1/00.172**/0.077/0.130**/0.0830.035/0.153*/0.171*/0.094TSSN and SPN1/20.102*/0.104*/0.204**/0.113*–0.196**/0.105/0.078/0.012FSN and SL7/10.496**/0.348**/0.372**/0.274**0.321**/0.287**/0.228**/0.246** FSN and SD2/10.228**/0.298**/0.211**/0.369**0.210**/0.190**/0.211**/0.203** FSN and SPN13/60.794**/0.869**/0.785**/0.885**0.843**/0.641**/0.791**/0.703**SL and SD8/3–0.818**/–0.786**/–0.724**/–0.726**–0.792**/–0.819**/–0.832**/–0.788** SL and SPN6/10.505**/0.363**/0.370**/0.308**0.383**/0.230**/0.231*/0.248**SD and SPN4/20.289**/0.271**/0.245**/0.421**0.244**/0.355**/0.326**/0.383**a For each entry,thefirstfigure refers to WJ,and the second to WYb**Correlation is significant at when P\0.01level*Correlation is significant at when P\0.05leveland8.14–11.44%of the phenotypic variation,respec-tively.QBssn.WJ.6A.2,QBssn.WY.1A.2,QBssn.WY .2D.2and QBssn.WY.3A.2were all verified in two trials,explaining 6.51–6.85,11.32–17.23,10.54–12.35and7.09–9.60%of the phenotypic variation, respectively.The remaining QTL could be detected only in one environment.The additive effect of ten QTL for BSSN in WJ were positive,with the Weimai8 parent increasing the effects,as did six of the eight QTL in WY.Top sterile spikelet numberIn total,ten and11significant additive QTL for TSSN were identified in WJ and WY,respectively(Supple-mentary Tables S1and S2,Fig.1).These QTL werelocated on chromosomes1D,2B(2QTL),2D,3B,5B(2 QTL),6D(2QTL)and7A in WJ,and on1A(4QTL), 1B(2QTL),1D,3B,4B and6B in WY.Three major QTL—QTssn.WJ.6D.3,QTssn.WY.1A.3and QTssn. WY.1B.3—were verified in three of thefive trials.They explained11.67–34.78,19.89–36.47and11.64–15.65% of the phenotypic variation,respectively.QTssn. WJ.2B.3was also detected in three trials,but with a moderate additive effect.QTssn.WJ.2B.2,a QTL with a small additive effect,showed additive effect values that were either positive or negative in the two different trials.QTssn.WJ.2D.2and QTssn.WY.1A.2could be verified in two trials,accounting for2.45–2.71and 8.29–18.69%of the phenotypic variation,respectively. Of the remaining environment–specific QTL,QTssn. WJ.5B.1a,QTssn.WY.1A.1a,QTssn.WY.1B.1,QTssn. WY.3B.1,QTssn.WY.4B.1,and QTssn.WY.7B.1,still explained more than10%of the phenotypic variation,at 13.51,16.56,19.29,13.97,28.80and12.40%,respec-tively.In both WJ and WY,more QTL alleles increasing the number of TSSN originated from Weimai8. Fertile spikelet numberQTL mapping detected22and16chromosomal regions governing FSN totally in thefive trials in WJ and WY,respectively(Supplementary Tables S1and S2,Fig.1).These QTL covered all of the twenty-one wheat chromosomes except1A,1B,3A,3D,6B and 7D.One of the major QTL,QFsn.WJ.5A.4,was stable across four of thefive trials,exhibiting9.49–15.03% phenotypic variance.QFsn.WY.2A.3explained8.78–11.49%phenotypic variance and was verified in three of thefive trials.Seven QTL for FSN could be identified reproducibly in two trials,of which, QFsn.WY.1D.2and QFsn.WY.2D.2accounted for more than10%of the phenotypic variance.QFsn. WY.2A.1,QFsn.WY.4D.1and QFsn.WY.7B.1a were three major QTL that were shown to be environment–specific,exhibiting17.74,17.65and16.25%pheno-typic variance,respectively.Similar to QTssn.WJ. 2B.2,QFsn.WJ.5B.2also showed either positive or negative additive effect values in the two different trials.Favorable alleles for FSN presented in the two parents equally in both WJ and WY.Spike lengthConcerning SL,four major QTL and20minor additive QTL,totally,were detected in the two populations (Supplementary Tables S1and S2,Fig.1).Of the four major QTL,QSl.WJ.5A.3and QSl.WY.6D.4—account-ing for6.79–14.36and6.97–14.63%of the phenotypic variance—were verified in three and four trials, respectively.Another two major QTL,QSl.WY.5A.1 and QSl.WY.6B.1,exhibiting26.82and10.47%phe-notypic variance,showed significance in only a solitary environment.QSl.WJ.2B.5,with a moderate additive effect,was detected in every trial and it explained 2.57–8.32%of the phenotypic variance.QSl.WJ.3B.4, QSl.WJ.5B.4and QSl.WY.2B.4showed significance in four of thefive trials with minor or moderate additive effects.QSl.WJ.4A.3and QSl.WJ.4D.3were identified reproducibly in three trials,accounting for2.04–3.09 and7.22–8.92%of the phenotypic variance.The remaining QTL showed significance either in one of Fig.1Genetic linkage maps and location of putative QTL for seven spike-related traits based on485RILs derived from Weimai89Jimai20and229RILs from Weimai89Yannong 19,with the prefixes WJ-Ch and WY-Ch,respectively.The positions of marker loci on chromosomes are listed to the left of the corresponding chromosomes.For the short arm of chromo-some1B,loci in italics are1RS-specific markers,with the exception of Glu-b3on WJ-Ch1B.The remaining loci named in italics are biochemical or functional gene markers.Map distances are shown in centiMorgans and were calculated using the Kosambi(1944)mapping function.A putative QTL with LOD[2.5is placed on its correspondingflanking markers. QTL symbols are described at the bottom right of Fig.1,and an uppercase letter E plus a numeral,1,2,3or4,or the uppercase letter C under the corresponding QTL symbol indicates the QTL was detected in Tai’an:2008–2009,Tai’an:2009–2010, Zaozhuang:2009–2010,Jining:2009–2010,or the combined environment where the data were averaged from the four environments above,respectivelyc。