1-s2.0-S0047637408002832-main
- 格式:pdf
- 大小:523.35 KB
- 文档页数:8
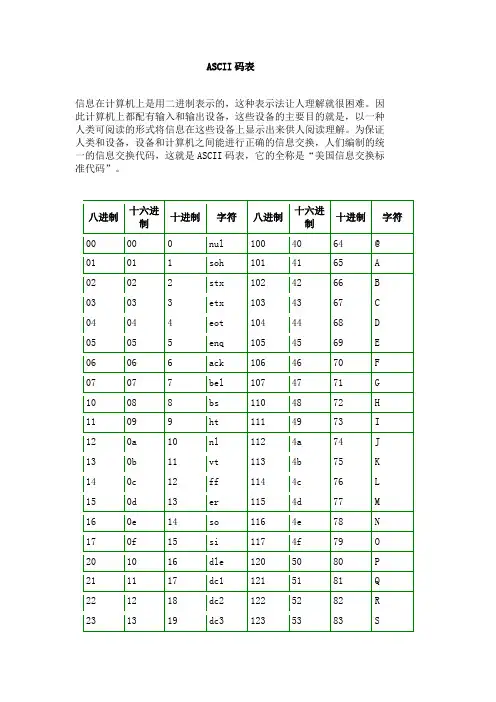
ASCII码表信息在计算机上是用二进制表示的,这种表示法让人理解就很困难。
因此计算机上都配有输入和输出设备,这些设备的主要目的就是,以一种人类可阅读的形式将信息在这些设备上显示出来供人阅读理解。
为保证人类和设备,设备和计算机之间能进行正确的信息交换,人们编制的统一的信息交换代码,这就是ASCII码表,它的全称是“美国信息交换标准代码”。
ASCII码对照表在Web开发时,如下的ASCII码只要加上&#和;就可以变成Web可以辨认的字符了在处理特殊字符的时候特别有用,如:' 单引号在数据库查询的时候是杀手,但是如果转换成'(注意:转换后的机构有:&# +字符的ASCII码值+; 三个部分组成)再来存数据库,就没有什么影响了。
其他的字符与ASCII码的对照如下表ASCII表键盘常用ASCII码ESC键 VK_ESCAPE (27)回车键: VK_RETURN (13)TAB键: VK_TAB (9)Caps Lock键: VK_CAPITAL (20) Shift键: VK_SHIFT ($10)Ctrl键: VK_CONTROL (17)Alt键: VK_MENU (18)空格键: VK_SPACE ($20/32)退格键: VK_BACK (8)左徽标键: VK_LWIN (91)右徽标键: VK_LWIN (92)鼠标右键快捷键:VK_APPS (93)Insert键: VK_INSERT (45) Home键: VK_HOME (36)Page Up: VK_PRIOR (33) PageDown: VK_NEXT (34)End键: VK_END (35)Delete键: VK_DELETE (46)方向键(←): VK_LEFT (37)方向键(↑): VK_UP (38)方向键(→): VK_RIGHT (39)方向键(↓): VK_DOWN (40)F1键: VK_F1 (112)F2键: VK_F2 (113)F3键: VK_F3 (114)F4键: VK_F4 (115)F5键: VK_F5 (116)F6键: VK_F6 (117)F7键: VK_F7 (118)F8键: VK_F8 (119)F9键: VK_F9 (120)F10键: VK_F10 (121)F11键: VK_F11 (122)F12键: VK_F12 (123)Num Lock键: VK_NUMLOCK (144) 小键盘0: VK_NUMPAD0 (96)小键盘1: VK_NUMPAD0 (97)小键盘2: VK_NUMPAD0 (98)小键盘3: VK_NUMPAD0 (99)小键盘4: VK_NUMPAD0 (100)小键盘5: VK_NUMPAD0 (101)小键盘6: VK_NUMPAD0 (102)小键盘7: VK_NUMPAD0 (103)小键盘8: VK_NUMPAD0 (104)小键盘9: VK_NUMPAD0 (105)小键盘.: VK_DECIMAL (110)小键盘*: VK_MULTIPLY (106)小键盘+: VK_MULTIPLY (107)小键盘-: VK_SUBTRACT (109)小键盘/: VK_DIVIDE (111)Pause Break键: VK_PAUSE (19) Scroll Lock键: VK_SCROLL (145)。
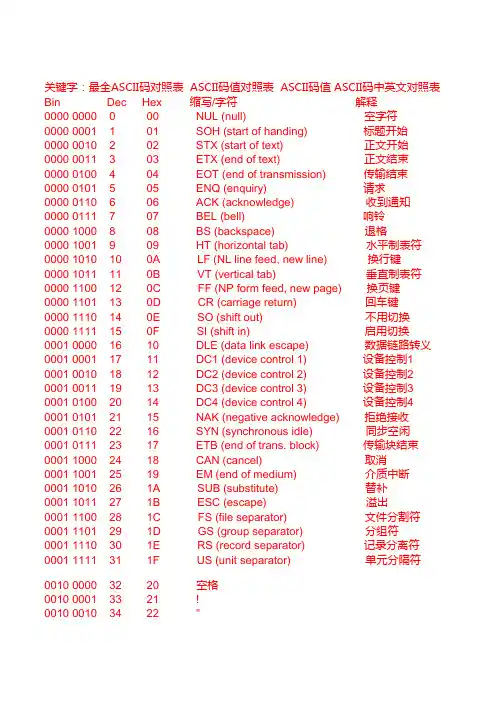
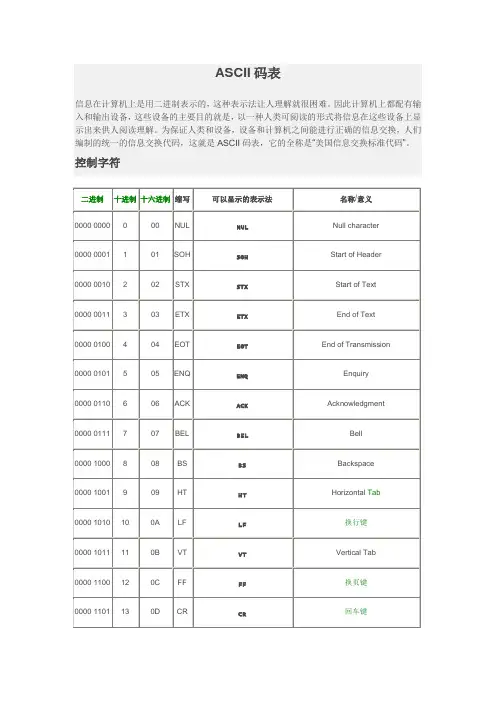
关键字:最全ASCII码对照表 ASCII码值对照表 ASCII码值 ASCII码中英文对照表Bin Dec Hex 缩写/字符解释0000 0000 0 00 NUL (null) 空字符0000 0001 1 01 SOH (start of handing) 标题开始0000 0010 2 02 STX (start of text) 正文开始0000 0011 3 03 ETX (end of text) 正文结束0000 0100 4 04 EOT (end of transmission) 传输结束0000 0101 5 05 ENQ (enquiry) 请求0000 0110 6 06 ACK (acknowledge) 收到通知0000 0111 7 07 BEL (bell) 响铃0000 1000 8 08 BS (backspace) 退格0000 1001 9 09 HT (horizontal tab) 水平制表符0000 1010 10 0A LF (NL line feed, new line) 换行键0000 1011 11 0B VT (vertical tab) 垂直制表符0000 1100 12 0C FF (NP form feed, new page) 换页键0000 1101 13 0D CR (carriage return) 回车键0000 1110 14 0E SO (shift out) 不用切换0000 1111 15 0F SI (shift in) 启用切换0001 0000 16 10 DLE (data link escape) 数据链路转义0001 0001 17 11 DC1 (device control 1) 设备控制1 0001 0010 18 12 DC2 (device control 2) 设备控制2 0001 0011 19 13 DC3 (device control 3) 设备控制3 0001 0100 20 14 DC4 (device control 4) 设备控制4 0001 0101 21 15 NAK (negative acknowledge) 拒绝接收0001 0110 22 16 SYN (synchronous idle) 同步空闲0001 0111 23 17 ETB (end of trans. block) 传输块结束0001 1000 24 18 CAN (cancel) 取消0001 1001 25 19 EM (end of medium) 介质中断0001 1010 26 1A SUB (substitute) 替补0001 1011 27 1B ESC (escape) 溢出0001 1100 28 1C FS (file separator) 文件分割符0001 1101 29 1D GS (group separator) 分组符0001 1110 30 1E RS (record separator) 记录分离符0001 1111 31 1F US (unit separator) 单元分隔符0010 0000 32 20 空格0010 0001 33 21 !0010 0010 34 22 "0010 0011 35 23 # 0010 0100 36 24 $ 0010 0101 37 25 % 0010 0110 38 26 & 0010 0111 39 27 ' 0010 1000 40 28 ( 0010 1001 41 29 ) 0010 1010 42 2A * 0010 1011 43 2B + 0010 1100 44 2C , 0010 1101 45 2D - 0010 1110 46 2E . 0010 1111 47 2F / 0011 0000 48 30 0 0011 0001 49 31 1 0011 0010 50 32 2 0011 0011 51 33 3 0011 0100 52 34 4 0011 0101 53 35 5 0011 0110 54 36 6 0011 0111 55 37 7 0011 1000 56 38 8 0011 1001 57 39 9 0011 1010 58 3A : 0011 1011 59 3B ; 0011 1100 60 3C < 0011 1101 61 3D = 0011 1110 62 3E > 0011 1111 63 3F ? 0100 0000 64 40 @ 0100 0001 65 41 A 0100 0010 66 42 B 0100 0011 67 43 C 0100 0100 68 44 D 0100 0101 69 45 E 0100 0110 70 46 F 0100 0111 71 47 G0100 1000 72 48 H 0100 1001 73 49 I 0100 1010 74 4A J 0100 1011 75 4B K 0100 1100 76 4C L 0100 1101 77 4D M 0100 1110 78 4E N 0100 1111 79 4F O 0101 0000 80 50 P 0101 0001 81 51 Q 0101 0010 82 52 R 0101 0011 83 53 S 0101 0100 84 54 T 0101 0101 85 55 U 0101 0110 86 56 V 0101 0111 87 57 W 0101 1000 88 58 X 0101 1001 89 59 Y 0101 1010 90 5A Z 0101 1011 91 5B [ 0101 1100 92 5C \ 0101 1101 93 5D ] 0101 1110 94 5E ^ 0101 1111 95 5F _ 0110 0000 96 60 ` 0110 0001 97 61 a 0110 0010 98 62 b 0110 0011 99 63 c 0110 0100 100 64 d 0110 0101 101 65 e 0110 0110 102 66 f 0110 0111 103 67 g 0110 1000 104 68 h 0110 1001 105 69 i 0110 1010 106 6A j 0110 1011 107 6B k 0110 1100 108 6C l0110 1101 109 6D m0110 1110 110 6E n0110 1111 111 6F o0111 0000 112 70 p0111 0001 113 71 q0111 0010 114 72 r0111 0011 115 73 s0111 0100 116 74 t0111 0101 117 75 u0111 0110 118 76 v0111 0111 119 77 w0111 1000 120 78 x0111 1001 121 79 y0111 1010 122 7A z0111 1011 123 7B {0111 1100 124 7C |0111 1101 125 7D }0111 1110 126 7E ~0111 1111 127 7F DEL (delete) 删除ESC键 VK_ESCAPE (27)回车键:VK_RETURN (13)TAB键:VK_TAB (9)Caps Lock键: VK_CAPITAL (20)Shift键:VK_SHIFT ()Ctrl键: VK_CONTROL (17)Alt键:VK_MENU (18)空格键:VK_SPACE (/32)退格键:VK_BACK (8)左徽标键:VK_LWIN (91)右徽标键:VK_LWIN (92)鼠标右键快捷键:VK_APPS (93)Insert键:VK_INSERT (45)Home键:VK_HOME (36)Page Up:VK_PRIOR (33)PageDown:VK_NEXT (34)End键: VK_END (35)Delete键:VK_DELETE (46)方向键(←):VK_LEFT (37)方向键(↑): VK_UP (38)方向键(→): VK_RIGHT (39)方向键(↓): VK_DOWN (40)F1键: VK_F1 (112)F2键: VK_F2 (113)F3键: VK_F3 (114)F4键: VK_F4 (115)F5键: VK_F5 (116)F6键: VK_F6 (117)F7键: VK_F7 (118)F8键: VK_F8 (119)F9键: VK_F9 (120)F10键: VK_F10 (121)F11键: VK_F11 (122)F12键:VK_F12 (123)Num Lock键: VK_NUMLOCK (144)小键盘0: VK_NUMPAD0 (96)小键盘1:VK_NUMPAD0 (97)小键盘2:VK_NUMPAD0 (98)小键盘3:VK_NUMPAD0 (99)小键盘4: VK_NUMPAD0 (100)小键盘5: VK_NUMPAD0 (101)小键盘6:VK_NUMPAD0 (102)小键盘7:VK_NUMPAD0 (103)小键盘8:VK_NUMPAD0 (104)小键盘9: VK_NUMPAD0 (105)小键盘.:VK_DECIMAL (110)小键盘*:VK_MULTIPLY (106)小键盘+:VK_MULTIPLY (107)小键盘-:VK_SUBTRACT (109)小键盘/:VK_DIVIDE (111)Pause Break键: VK_PAUSE (19)Scroll Lock键: VK_SCROLL (145)关键字:最全ASCII码对照表 ASCII码值对照表 ASCII码值 ASCII码中英文对照表。
A first step towards identification of tannin-derived black carbon:Conventional pyrolysis (Py–GC–MS)and thermally assisted hydrolysis and methylation (THM–GC–MS)of charred condensed tanninsJoeri Kaal a ,⇑,Klaas G.J.Nierop b ,Peter Kraal c ,Caroline M.Preston daInstituto de Ciencias del Patrimonio (Incipit),Consejo Superior de Investigaciones Científicas (CSIC),San Roque 2,15704Santiago de Compostela,Spain bDepartment of Earth Sciences –Organic Geochemistry,Faculty of Geosciences,Utrecht University,P.O.Box 80021,3508TA Utrecht,The Netherlands cSouthern Cross GeoScience,Southern Cross University,P.O.Box 157,Lismore,2480New South Wales,Australia dPacific Forestry Centre,Natural Resources Canada,506West Burnside Rd.,Victoria,BC,Canada V8Z 1M5a r t i c l e i n f o Article history:Received 5October 2011Received in revised form 13March 2012Accepted 26March 2012Available online 5April 2012a b s t r a c tTannins account for a significant proportion of plant biomass and are likely to contribute to the residues formed by incomplete biomass combustion (black carbon,BC).Nonetheless,the molecular properties of thermally modified tannins have not been investigated in laboratory charring experiments.We applied conventional analytical pyrolysis–gas chromatography–mass spectrometry (Py–GC–MS)and thermally assisted hydrolysis and methylation (THM–GC–MS)to investigate the effects of heat treatment with a muffle furnace on the properties of condensed tannins (CT)from Corsican pine (Pinus nigra )needles.Py–GC–MS showed a decrease in the relative abundance of the 1,2,3-trihydroxybenzenes (pyrogallols)at P 300°C and of the dihydroxybenzenes (mainly catechols)at P 350°C due to dehydroxylation of the CT B ring.Further dehydroxylation led to formation of monohydroxybenzenes (phenols),which showed a strong enrichment between 350and 400°C and,at higher temperatures,to a series of mono-cyclic and polycyclic aromatics [benzene,alkyl benzenes and polycondensed aromatic hydrocarbons (PAHs)].Degradation of the A ring could not be recognized via Py–GC–MS,probably because of the poor chromatographic behavior of 1,3,5-trihydroxybenzenes (phloroglucinols).The progressive dehydroxyla-tion and eventual polycondensation of the CT B ring was corroborated using THM–GC–MS.In addition,with THM–GC–MS the thermal rearrangement of CT A rings at 300°C and higher was inferred from the relative abundance of 1,3,5-trimethoxybenzenes (methylated phloroglucinol derivatives).These com-pounds were observed at moderate/high temperature (up to 450°C)and can not be produced from THM of lignin,suggesting that they may be markers of CT in natural BC samples.Ó2012Elsevier Ltd.All rights reserved.1.IntroductionTannins are among the most abundant plant biopolymers,typ-ically comprising 10–25%of foliar mass (Kraus et al.,2003).In leaves,needles and bark,tannin content often exceeds that of lig-nin (Hernes and Hedges,2004)and it is also present in woody tis-sue (Rogge et al.,1998).Tannins are strong antioxidants with multiple ecosystem functions,such as defense against herbivores,metal mobilization,radical scavenging and regulation of nutrient dynamics by protein precipitation and suppression of microbial activity (Zucker,1983;Kennedy et al.,1996;Fierer et al.,2001).Tannins from terrestrial plants can be divided into two main groups:condensed tannins (CT)and hydrolyzable tannins.Con-densed tannins are oligomers and polymers based on flavan-3-ol monomers linked through covalent bonds (Fig.1).Within thegroup of CT,there is variation in the distribution of OH groups on the aromatic B ring,forming procyanidin and prodelphinidin CT (e.g.Khanbabaee and van Ree,2001).Each CT monomer con-tains up to six OH functionalities concentrated on the aromatic A and B rings (Fig.1).These aromatic OH groups,especially those in adjacent positions on the B ring,give rise to the exceptional reactivity of CT in the environment (Slabbert,1992).Despite the fact that tannins form a major component of plant biomass,they have often been ignored as a possible source of poly-phenolic substances in soil organic matter;these have commonly been ascribed to lignin (Filley et al.,2006).This is also the case for phenolic moieties in biomass burning residue (black carbon,BC)(Baldock and Smernik,2002;Krull et al.,2003),which are abundant in BC formed at low/moderate temperature (e.g.Knicker et al.,2005,2007;Rumpel et al.,2006).In the light of growing interest in BC or ‘biochar’,amendment programs for soil ameliora-tion and C sequestration (Lehmann et al.,2006;Jeffery et al.,2011),the possible effects of charred tannins on soil microbial and nutri-ent dynamics must be understood (Warnock et al.,2010),as they0146-6380/$-see front matter Ó2012Elsevier Ltd.All rights reserved./10.1016/geochem.2012.03.009Corresponding author.Tel.:+34881813588;fax:+34881813601.E-mail address:joeri.kaal@incipit.csic.es (J.Kaal).may be anticipated to be vastly different from that of charred lig-nin.This is not possible,however,as methodologies for identifying charred tannins are not available and the thermal degradation pathways of tannins are largely unknown.The thermal alteration of plant tissue has been investigated in numerous studies,as reviewed by e.g.González-Pérez et al.(2004)and Preston and Schmidt (2006).Pyrolysis–gas chromatog-raphy–mass spectrometry (Py–GC–MS)is one method that can provide information on the molecular properties of BC (De la Rosa et al.,2008;Kaal and Rumpel,2009;Kaal et al.,2009;Fabbri et al.,2012),despite the fact that pyrolysis itself is a heat-induced scission reaction and that secondary rearrangements generate structures that may resemble the pyrolysis products of BC (Saiz-Jiménez,1994;Wampler,1999).Pyrolysis is a relatively inex-pensive and rapid technique that has also proven of value for tan-nin characterization (Galletti et al.,1995).Flash heating in the presence of tetramethylammonium hydroxide (TMAH)is referred to as thermally assisted hydrolysis and methylation (THM)or ther-mochemolysis.With THM,hydrolyzable bonds are cleaved and the resulting CO 2H and OH groups are transformed in situ to the corre-sponding methyl esters and methyl ethers,respectively (Challinor,2001;Hatcher et al.,2001;Shadkami and Helleur,2010),which are more amenable to GC than their underivatized counterparts.As such,THM–GC–MS provides additional information on tannin structure through detection of derivatized polyfunctionalized A and B rings (Nierop et al.,2005).In the present study the thermal degradation of CT was studied using laboratory charring experiments followed by characteriza-tion with Py–GC–MS and THM–GC–MS.The aim was to provide guidelines for the identification of CT-derived BC and identify the molecular changes as a function of charring temperature.2.Material and methodsCondensed tannins were isolated from Corsican pine (Pinus ni-gra var.maritima )needles from the coastal dunes in The Nether-lands (52°2004500N,4°3105700E)using the scheme proposed by Preston (1999)and described in detail by Nierop et al.(2005,2006).The CT were completely isolated from other components and had a prodelphinidin:procyanidin ratio of 2:1and average chain length of 6.6(Nierop et al.,2005).It has been used in various studies (Kaal et al.,2005;Nierop et al.,2006;Kraal et al.,2009).For the charring experiments,ca.200mg of CT were double wrapped in Al foil to simulate limited O 2availability during wild-fires.The samples were placed (30min)in a preheated muffle fur-nace at temperatures (T CHAR )from 200°C to 600°C.Similar experiments have been performed by Turney et al.(2006),Hall et al.(2008)and Wiesenberg et al.(2009).Weight loss was deter-mined gravimetrically before and after charring.C and H contents were determined by way of combustion using a LECO carbon ana-lyzer (model CHN-1000).Uncharred CT was used as a control.Py–GC–MS was performed in duplicate using a Pt filament coil probe Pyroprobe 5000pyrolyzer (CDS Analytical,Oxford,USA).Approximately 1–1.5mg sample was embedded in quartz tubes using glass wool.Pyrolysis was applied at 750°C for 10s (heating rate 10°C/ms).The method produces limited artificial charring during pyrolysis and a relatively high proportion of pyrolyzable biomass in comparison with pyrolysis at lower temperatures (Pastorova et al.,1994;Kaal et al.,2009;Song and Peng,2010).The pyrolysis interface was coupled to a 6890N GC instrument and 5975MSD (Agilent Technologies,Palo Alto,USA).The pyrolysis interface and GC inlet (split ratio 1:20)were set at 325°C.The GC instrument was equipped with a (non-polar)HP-5MS 5%phenyl,95%dimethylpolysiloxane column (30m Â0.25mm i.d.;film thickness 0.25l m)and He was the carrier gas (constant flow 1ml/min).The GC oven was heated from 50to 325°C (held 10min)at 20°C/min.The GC–MS transfer line was held at 270°C,the ion source (electron impact mode,70eV)at 230°C and the quadrupole detector at 150°C scanning a range between m /z 50and 500.Peak areas of the pyrolysis products were obtained from one or two characteristic or dominant fragment ions,the sum of which (total quantified peak area;TQPA)was set as 100%.Relative contributions of the pyrolysis products were calculated as %of TQPA.This is a semi-quantitative exercise that allows better comparison between samples than visual inspection of pyrolysis chromatograms alone.Benzofuran and styrene could not be quantified because of co-elution with contaminants.For THM–GC–MS,samples were pressed onto Curie-Point wires,after which a droplet of a 25%solution of TMAH in water was added,prior to drying under a 100W halogen lamp.THM was car-ried out using a Horizon Instruments Curie-Point pyrolyzer.Sam-ples were heated for 5s at 600°C.The pyrolysis unit was connected to a Carlo Erba GC8060furnished with a fused silica col-umn (Varian,25m Â0.25mm i.d.)coated with CP-Sil 5(film thick-ness 0.40l m).He was the carrier gas.The oven temperature program was:40°C (1min)to 200°C at 7°C/min and then to 320°C (held 5min)at 20°C/min.The column was coupled to a Fi-sons MD800MS instrument (m /z 45–650,ionization energy 70eV,cycle time 0.7s).Like Py–GC–MS,the relative contributions of the THM products were calculated as relative contributions to TQPA using 1–2dominant fragment ions.Benzene and toluene were not detected because they co-eluted with trimethylamine,the main side product of TMAH-based THM (Challinor,2001),i.e.with-in the solvent delay period (3min).Py–GC–MS and THM–GC–MS results were analyzed via princi-pal component analysis (PCA)to illustrate the major effects of heating on the pyrolysis and THM fingerprints,respectively,using SPSS 13.0.3.Results and discussion3.1.Weight loss and elemental compositionWeight loss from CT increased from 17%at T CHAR 200°C towards 56%at T CHAR 600°C (Table 1).The CT C content increased from 51%to 81%with increasing T CHAR .The atomic H/C ratio of the samples declined from 1.2to 0.6with increasing T CHAR ,reflecting loss of functional groups and formation of fused aromatic clusters through condensation (Braadbaart et al.,2004).Model structure of a condensed tannin oligomer;procyanidin,prodelphinidin,R =OH.47(2012)99–108chromatograms of uncharred(control)and charred(200–600°C)CT,from Py–GC–MS.Relative peak intensity vs.retention time3.2.Charred condensed tannin composition:Py–GC–MSPy–GC–MS total ion chromatograms are depicted in Fig.2.Total quantified peak area (Table 1),a rough measure of signal intensity,decreased with increasing T CHAR .This can be explained by the for-mation of non-pyrolyzable structures upon charring,probably through the formation of polycondensed aromatic clusters stable under pyrolysis conditions.However,this does not imply that the results from the high temperature chars should be dismissed for representing only a small and relatively volatilefraction:a more appropriate interpretation is that the samples consist largely of non-pyrolyzable fused aromatic clusters,corroborated by the dom-inant pyrolysis products of such samples (benzene and PAHs;see below)and lack of pyrolysis products from less intensely charred structures.The major pyrolysis products are listed in sponding retention times,fragment ions used and relative proportions.Products were structure,in particular the hydroxylation between benzenes (benzene and alkyl (with one OH),dihydroxybenzenes (DHB),(THB)and other compounds.The DHB are while the THB are based on pyrogallol moieties exclusively from prodelphinidin B rings.The uncharred CT isolate produced mainly pyrolysis (Table 2;Fig.3),which originate from prodelphinidin B rings,respectively.In contrast delphinidin:procyanidin ratio determined et al.,2005),the DHB were more abundant may be explained by way of the poor ‘‘visibility’’a non-polar GC column.The high proportion of and 4-methylpyrogallol points to scission of the the heterocyclic pyran C ring (Fig.1),which has sociation energy than the aromatic A and B acetone and acetic acid may represent the after pyrolysis.Products from the A ring were may be explained by the poor chromatographic rivatized 1,3,5-trihydroxybenzene principal pyrolysis product from the A ring (The lack of unambiguous A ring markers implies that Py–GC–MS cannot be used to study the degradation of the predominantly C-4/C-8and C-4/C-6intermonomeric linkages (Fig.1),and thus to investigate CT depolymerization.Some methoxyphenols (guaiacol and 4-vinylguaiacol)and catechol carbonate were detected.The guaiacols are commonly attributed to lignin and its derivatives (e.g.Kögel-Knabner,2002),but here they might alternatively orig-inate from C ring fission in CT (Galletti et al.,1995).The possibility of tannins as a source of the guaiacols is supported by the absence of resonances from methoxyphenols in liquid-state 13C NMR tra (Nierop et al.,2005)and guaiacols bearing a C 3side chain pyrolyzate,which should be detectable if residual lignin was ent in the fresh needle isolate (Saiz-Jiménez and de Leeuw,The results for uncharred CT were in good agreement with earlier pyrolysis experiments with tannin,catechin and gallocate-Relative proportion (TQPA)of pyrolysis product groups from CT vs.charring temperature (200–600°C);0°C,control (uncharred CT);THB,trihydroxybenzene;dihydroxybenzene;PAH,polycyclic aromatic hydrocarbon.Error bars reflect standard error of mean of two replicates.Note differences in y -axis scaling.Pyrolysis products plotted in PC1–PC2space (PCA).THB,trihydroxybenzene;dihydroxybenzene;PAH,polycyclic aromatic hydrocarbon.Arrow indicates trend in pyrolysis patterns with increasing charring temperature.The sample charred at200°C gave a pyrogram similar to that of uncharred CT,indicating limited thermal rearrangement at this temperature(Fig.2).At T CHAR300°C,the proportion of THB de-creased from ca.20%to ca.5%of the TQPA,while the proportion of DHB increased towards ca.70%(Fig.3).This reflects elimination of one OH from the prodelphinidin B ring during charring,causing a relative increase in the contribution of DHB to the pyrolyzate. Thus,the presence of DHB in pyrolyzates does not necessarily indi-cate the presence of uncharred CT.This sheds new light on results from previous studies(Quénéa et al.,2005a,b)in which the pres-ence of DHB in the pyrolyzate of BC-containing forest soil was interpreted as being from uncharred CT,whereas it may alterna-tively originate from CT-derived BC.A more drastic shift in pyro-lyzate composition occurred at T CHAR350°C:the relative abundance of DHB diminished,with a concomitant increase in phenols(from ca.10%to50%),as well as benzenes,PAH and other compounds(Fig.3).Also,the relative contribution of THB de-creased further.The results are indicative of strong B ring dehydr-oxylation at350°C.At T CHAR400°C,a further decrease in DHB contribution and increased relative abundance of benzenes and PAH were observed.The high biphenyl/naphthalene ratio may be specific for the pyrolyzate of CT-derived BC,as it is usually much lower in the pyrolyzate of char obtained from lignocellulose(Kaal et al.,2009).At T CHAR450°C,phenols decreased while the relative abundance of benzenes increased towards60%and that of PAHs to-wards10%,suggesting the loss of most of the OH groups from theB Fig.5.Total ion chromatograms of uncharred(control)and charred(200–600°C)CT,from THM–GC–MS.ring.The relatively weak signal for this sample (Table 1;Fig.2)sug-gested that a significant proportion of the CT was converted to non-pyrolyzable polycondensed aromatics.After charring at 600°C the phenolic pyrolysis products and the possible products of the C ring (acetylacetone,acetone and acetic acid)were absent,while the benzenes and PAH had increased to 75%and 20%,respec-tively (Fig.3).This combination constitutes a typical set of pyroly-sis products from strongly charred biomass (Kaal et al.,2009;Fabbri et al.,2012).The general trends for experimental charring of CT as deter-mined with Py–GC–MS became apparent with PCA.In Fig.4,the pyrolysis products are plotted in PC1–PC2space.PC1explained 62%of the total variance and PC222%.PC1and PC2reflect the same process however,namely thermally-induced dehydroxylation:benzenes and PAH had positive loadings on PC1(recording increas-ing abundance with increasing T CHAR )while DHB and THB had neg-ative loadings (compounds showing an opposite trend of decreasing abundance with increasing T CHAR ).PC2separated the phenols from the other pyrolysis products:the phenols had a small contribution to the pyrolyzate at the lower and highest tempera-tures,while they dominated the pyrolyzates of the samples charred between 350and 400°C.The arrow in Fig.4represents the dehydroxylation pathway of CT with increasing T CHAR .The pro-cess is reflected in the THB/DHB,DHB/phenol and phenol/benzene ratios (not shown),which decreased significantly with increasing T CHAR (P <0.001for all ratios).Under the experimental conditions of the present study,the thermal modification of the CT B ring oc-curred predominantly between 300and 400°C.3.3.Charred condensed tannin composition:THM–GC–MSTHM–GC–MS total ion chromatograms are depicted in Fig.5.Similar to TQPA from Py–GC–MS,TQPA decreased with increasing T CHAR (Table 1).The THM products are listed in Table 3,with corresponding relative contributions to TQPA.The likely origin of the THM products was identified on the basis of the substitution pattern of the functional groups.As such,the THM products were grouped according to the number of O-containing functional groups (OFG).Furthermore,trimethoxybenzenes with the methoxyl groups in the m positions (methylated phloroglucinol derivatives)were assumed to originate from A ring moieties,while the trimethoxybenzenes with the methoxyl groups in the o positions (methylated pyrogallol derivatives)were assumed to originate from prodelphinidin B ring moieties.For the uncharred CT,major products from the A ring were 1,3,5-trimethoxybenzene and 2-methyl-1,3,5-trimethoxybenzene,while procyanidin and prodelphinidin B ring products were pres-ent mainly as methyl esters of 3,4-dimethoxybenzoic acid and 3,4,5-trimethoxybenzoic acid,respectively.These compounds have been found to be the dominant THM products of CT isolated from various plant species (Nierop et al.,2005).The presence of A ring products and absence of CH 2-bridged diaromatic (i.e.diphenylme-thane-based)products suggests that CT was readily depolymerized during THM.The exact location of depolymerization is unknown because it cannot be elucidated whether the Me group in 2-methyl-1,3,5-trimethoxybenzene originated from the C-4carbon in the same monomer or from a C-4carbon in the C ring of an adja-cent monomer.The fact that uncharred CT produced no detectable intermonomeric THM products implies that charring-induced depolymerization cannot be studied either.Parameters used by Nierop et al.(2005)to indicate the %of procyanidin B rings of CT were ‘‘PC-acid’’(dimethoxybenzoic acid,methyl ester/sum di-and trimethoxybenzoic acids,methyl esters;26.9%)and ‘‘PC-THM’’(based on all compounds related to di-and trihydroxy B rings;36.2%),are 49.4%and 34.2%,respectively,for the (uncharred)CT used isolated from Corsican pine used here.The cause of the large difference in the ‘‘PC-acid’’parameter may be of an analytical nature.The fact that the ‘‘PC-THM’’values,which were often closer to those determined with NMR (Nierop et al.,2005),were similar suggests that this parameter to estimate the %procyanidin B rings from THM–GC–MS is reproducible.Analogous to Py–GC–MS,the THM–GC–MS pattern from the CT charred at 200°C was similar to the uncharred CT (Fig.5).At T CHAR 300°C,a major decline was observed for 1,3,5-trimethoxybenzene and 2-methyl-1,3,5-trimethoxybenzene from the A ring (Fig.6),which coincided with an increase in relative contribution of most of the products with two or three adjacent methoxyl groups de-rived from CT B-rings.This is suggestive of a greater thermalstabil-Relative proportion (%of TQPA)of THM product groups from CT vs.charring temperature (200–600°C).0°C,control (uncharred CT);OFG refers to number containing functional groups;PAH,polycyclic aromatic hydrocarbon.Note differences in y -axis scaling.ity of B rings than A rings.Between T CHAR300and400°C,the rela-tive contribution of compounds with three and four OFG de-creased,that of two OFG maximized,while that of compounds with only one OFG increased.The trend was especially strong for the compounds with three o methoxyl groups,suggesting thor-ough thermal rearrangement of prodelphinidin B rings in this tem-perature range.At higher charring temperatures,the proportions of benzene,alkyl benzenes and PAH increased strongly,while the proportions of the other compounds decreased.Like the benzenes, benzoic acid methyl ester increased progressively with increasing T CHAR,but it is not clear whether the carboxylic group was formed upon oxidation during the charring experiment or upon Cannizz-aro reactions during THM(Hatcher and Minard,1995;Tanczos et al.,1997).Relatively intact CT A ring products were still recog-nized at T CHAR450°C(R1,3,5-trimethoxybenzenes>10%of TQPA), suggesting that THM–GC–MS might allow unequivocal identifica-tion of CT markers in weak/moderately charred BC.McKinney et al.(1996)identified these THM products from cutan isolated from Agave americana.Apart from its presence in CAM plants only (Boom et al.,2005),a possible interference from cutan-derived 1,3,5-trimethoxybenzenes would be recognized by the presence of methylated aliphatic compounds including fatty acid methyl es-ters.More importantly,these1,3,5-trimethoxybenzenes are not formed upon THM of lignin(e.g.Chefetz et al.,2002;Nierop and Filley,2008;Shadkami and Helleur,2010),a more likely interfering component in plant-derived BC.No O-substituted PAH such as methoxynaphthalenes were de-tected,suggesting that thorough elimination of functional groups preceded the polycondensation reactions.Finally,methylated ben-zene polycarboxylic acids(with three or more carboxyl groups) found among the THM products of aged charcoal(Kaal et al., 2008)were not detected,probably because the necessary oxidation reactions occur during aging in soil and not during heat treatment under limited O2availability.The PC1(58%)–PC2(22%)plot of the THM products showed a similar distribution according to hydrox-ylation pattern(Fig.7).The arrow indicates the progressive loss of OFG with increasing T CHAR.Unsurprisingly,the main difference between Py–GC–MS and THM–GC–MS was the higher abundance of OFG among THM prod-ucts,independent of charring intensity,confirming the protection of functional groups resulting from TMAH derivatization and the loss and/or poor detection of polar compounds using conventional Py–GC–MS.4.ConclusionsThe charring of CT caused progressive dehydroxylation at T CHAR6400°C(under the conditions of the present study)and polyaromatization in the higher temperature range at T CHAR400–600°C.Based on Py–GC–MS,it is suggested that pyrogallol and, more tentatively,catechol derivatives may act as indicators of CT-derived BC formed at low temperature,while a high relative abundance of biphenyl might be indicative of a significant CT con-tribution in more severely charred material.Py–GC–MS is not suit-able for detection of A ring products.From THM–GC–MS,initial A ring degradation occurred at lower temperatures than B ring deg-radation.Nonetheless,the significant contribution of1,3,5-tri-methoxybenzenes from the phloroglucinol A ring up to T CHAR 450°C suggested that these compounds can be used to distinguish between lignin and CT-derived BC in weakly/moderately charred BC samples.The results show that CT is a possible source of pheno-lic moieties in BC and provide a framework for estimating the de-gree of thermal degradation of CT based on the functional group distribution of Py–GC–MS and THM–GC–MS products.Incubation experiments using this CT are currently being developed,aimed at determining the effects of CT charred at different temperatures on organic matter mineralization.AcknowledgmentsWe thank Carmen Pérez Llaguno(Universidade de Santiago de Compostela)for elemental analysis and two anonymous reviewers for their time and comments.Associate Editor—S.DerenneReferencesBaldock,J.A.,Smernik,R.J.,2002.Chemical composition and bioavailability of thermally altered Pinus resinosa(red pine)anic Geochemistry33, 1093–1109.Boom,A.,Sinninghe Damsté,J.S.,De Leeuw,J.W.,2005.Cutan,a common aliphatic biopolymer in cuticles of drought-adapted anic Geochemistry36, 595–601.Braadbaart,F.,Boon,J.J.,Veld,H.,David,P.,Van Bergen,P.F.,boratory simulations of the transformation of peas as a result of heat treatment:changes of the physical and chemical properties.Journal of Archaeological Science31, 821–833.Challinor,J.M.,2001.Review:the development and applications of thermally assisted hydrolysis and methylation reactions.Journal of Analytical and Applied Pyrolysis61,3–34.Chefetz, B.,Salloum,M.J.,Deshmukh, A.P.,Hatcher,P.G.,2002.Structural components of humic acids as determined by chemical modifications and13C NMR,pyrolysis-,and thermochemolysis–gas chromatography/mass spectrometry.Soil Science Society of America Journal66,1159–1171.De la Rosa,J.M.,Knicker,H.,López-Capel,E.,Manning,D.A.C.,González-Pérez,J.A., González-Vila,F.J.,2008.Direct detection of black carbon in soils by py–GC–MS, 13C NMR spectroscopy and thermogravimetric techniques.Soil Science Society of America Journal72,258–267.Fabbri, D.,Torri, C.,Spokas,K.A.,2012.Analytical pyrolysis of synthetic chars derived from biomass with potential agronomic application(biochar).Relationships with impacts on microbial carbon dioxide production.Journal of Analytical and Applied Pyrolysis93,77–84.Fierer,N.,Schimel,J.P.,Cates,R.G.,Zou,J.,2001.Influence of balsam poplar tannin fractions on carbon and nitrogen dynamics in Alaskan taigafloodplain soils.Soil Biology and Biochemistry33,1827–1839.Filley,T.R.,Nierop,K.G.J.,Wang,Y.,2006.The contribution of polyhydroxyl aromatic compounds to tetramethylammonium hydroxide lignin-based anic Geochemistry37,711–727.Galletti,G.C.,Reeves,J.B.,1992.Pyrolysis/gas chromatography/ion-trap detection of polyphenols(vegetable tannins):preliminary anic Mass Spectrometry27,226–230.Galletti,G.C.,Modafferi,V.,Poiana,M.,Bocchini,P.,1995.Analytical pyrolysis and thermally assisted hydrolysis–methylation of wine tannin.Journal of Agricultural and Food Chemistry43,1859–1863.González-Pérez,J.A.,González-Vila,F.J.,Almendros,G.,Knicker,H.,2004.The effect offire on soil organic matter–a review.Environment International30,855–870.THM products plotted in PC1–PC2space(from PCA).OFG refers to numberO-containing functional groups;PAH,polycyclic aromatic hydrocarbon.Theindicates the major trend in dominant THM products with increasing charringtemperature.47(2012)99–108107。
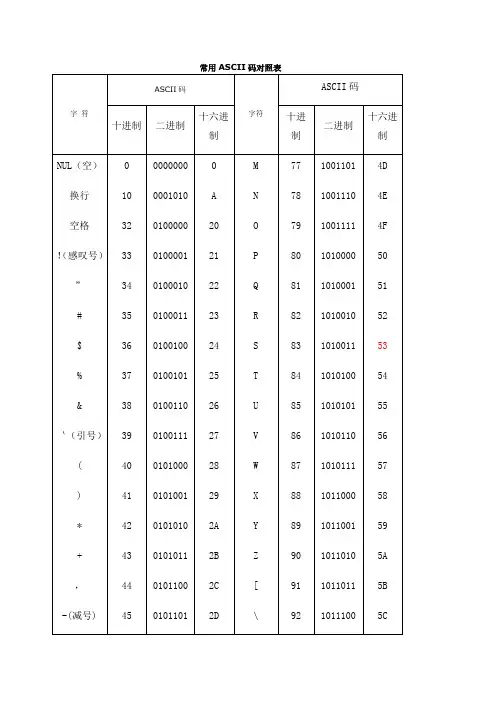
常用ASCII码对照表1. ASCII码在计算机内部,所有的信息最终都表示为一个二进制的字符串。
每一个二进制位(bit)有0和1两种状态,因此八个二进制位就可以组合出256种状态,这被称为一个字节(byte)。
也就是说,一个字节一共可以用来表示256种不同的状态,每一个状态对应一个符号,就是256个符号,从0000000到。
上个世纪60年代,美国制定了一套字符编码,对英语字符与二进制位之间的关系,做了统一规定。
这被称为ASCII码,一直沿用至今。
ASCII码一共规定了128个字符的编码,比如空格“SPACE”是32(十进制的32,用二进制表示就是00100000),大写的字母A是65(二进制01000001)。
这128个符号(包括32个不能打印出来的控制符号),只占用了一个字节的后面7位,最前面的1位统一规定为0。
2、非ASCII编码英语用128个符号编码就够了,但是用来表示其他语言,128个符号是不够的。
比如,在法语中,字母上方有注音符号,它就无法用ASCII码表示。
于是,一些欧洲国家就决定,利用字节中闲置的最高位编入新的符号。
比如,法语中的é的编码为130(二进制)。
这样一来,这些欧洲国家使用的编码体系,可以表示最多256个符号。
但是,这里又出现了新的问题。
不同的国家有不同的字母,因此,哪怕它们都使用256个符号的编码方式,代表的字母却不一样。
比如,130在法语编码中代表了é,在希伯来语编码中却代表了字母Gimel (),在俄语编码中又会代表另一个符号。
但是不管怎样,所有这些编码方式中,0—127表示的符号是一样的,不一样的只是128—255的这一段。
至于亚洲国家的文字,使用的符号就更多了,汉字就多达10万左右。
一个字节只能表示256种符号,肯定是不够的,就必须使用多个字节表达一个符号。
比如,简体中文常见的编码方式是GB2312,使用两个字节表示一个汉字,所以理论上最多可以表示256x256=65536个符号。
![[计算机]ASCII码对照表-精品文档](https://uimg.taocdn.com/3cc83c5801f69e31433294fc.webp)
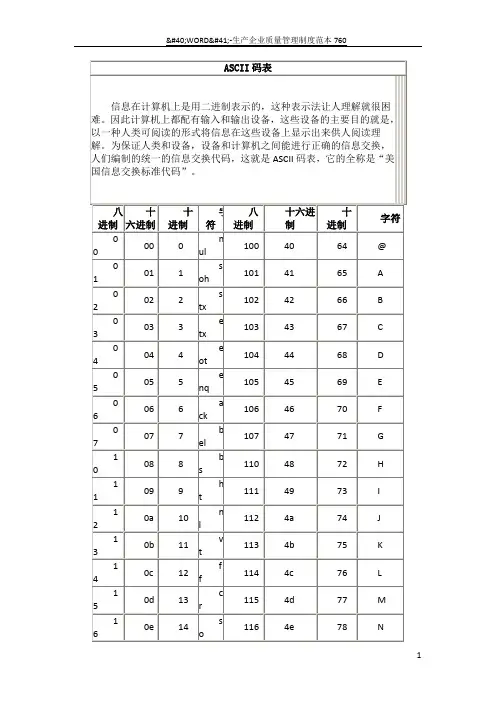
ASCII码对照表2009-04-23 19:43ASCII(American Standard Code for Information Interchange)定义从 0 到127 的共128个数字所代表的英文字母或一样的结果与意义。
由于使用7个位(bit)就可以表示从0到127的数字,大部分的电脑都使用8个位来存取字元集(character set),所以从128到255之间的数字可以用来代表另一组128个符号,称为extended ASCII。
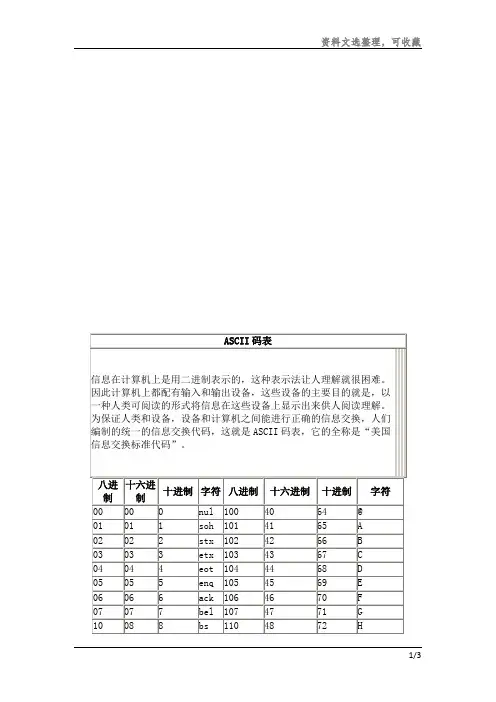
目前计算机中用得最广泛的字符集及其编码,是由美国国家标准局(ANSI)制定的ASCII码(American Standard Code for Information Interchange,美国标准信息交换码),它已被国际标准化组织(ISO)定为国际标准,称为ISO 646标准。
适用于所有拉丁文字字母,ASCII码有7位码和8位码两种形式。
因为1位二进制数可以表示(21=)2种状态: 0、1;而2位二进制数可以表示(22)=4种状态:00、01、10、11;依次类推,7位二进制数可以表示(27=)128种状态,每种状态都唯一地编为一个7位的二进制码,对应一个字符(或控制码),这些码可以排列成一个十进制序号0~127。
所以,7位ASCII码是用七位二进制数进行编码的,可以表示128个字符。
第0~32号及第127号(共34个)是控制字符或通讯专用字符,如控制符:LF(换行)、CR(回车)、FF(换页)、DEL(删除)、BEL(振铃)等;通讯专用字符:SOH(文头)、EOT(文尾)、ACK(确认)等;第33~126号(共94个)是可打印字符,其中第48~57号为0~9十个阿拉伯数字;65~90号为26个大写英文字母,97~122号为26个小写英文字母,其余为一些标点符号、运算符号等。
注意:在计算机的存储单元中,一个ASCII码值占一个字节(8个二进制位),其最高位(b7)用作奇偶校验位。
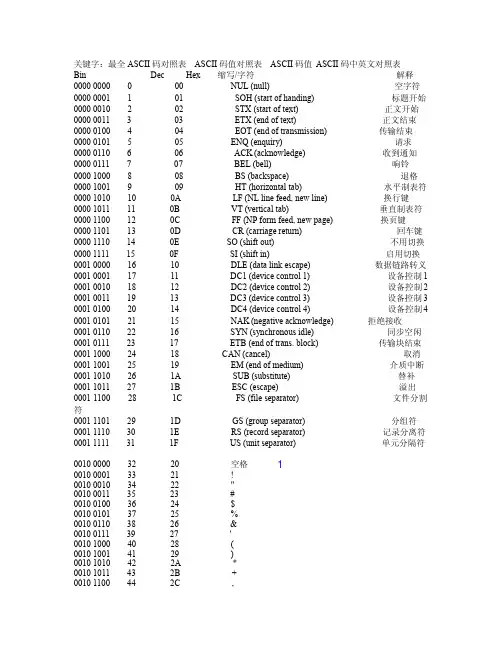
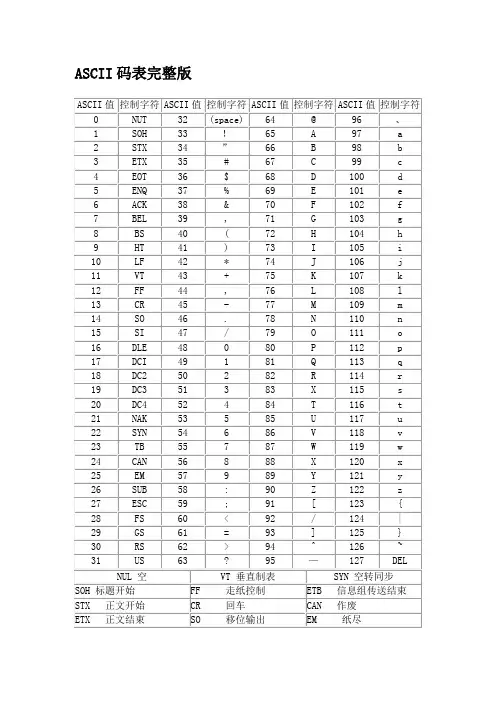
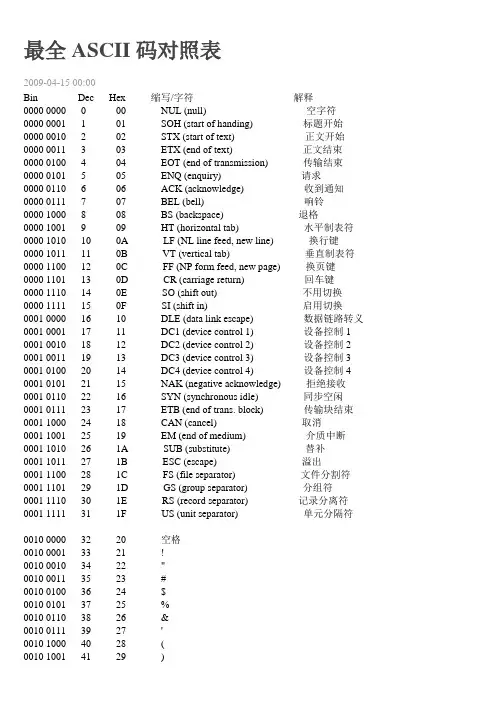
最全ASCII码对照表2009-04-15 00:00Bin Dec Hex 缩写/字符解释0000 0000 0 00 NUL (null) 空字符0000 0001 1 01 SOH (start of handing) 标题开始0000 0010 2 02 STX (start of text) 正文开始0000 0011 3 03 ETX (end of text) 正文结束0000 0100 4 04 EOT (end of transmission) 传输结束0000 0101 5 05 ENQ (enquiry) 请求0000 0110 6 06 ACK (acknowledge) 收到通知0000 0111 7 07 BEL (bell) 响铃0000 1000 8 08 BS (backspace) 退格0000 1001 9 09 HT (horizontal tab) 水平制表符0000 1010 10 0A LF (NL line feed, new line) 换行键0000 1011 11 0B VT (vertical tab) 垂直制表符0000 1100 12 0C FF (NP form feed, new page) 换页键0000 1101 13 0D CR (carriage return) 回车键0000 1110 14 0E SO (shift out) 不用切换0000 1111 15 0F SI (shift in) 启用切换0001 0000 16 10 DLE (data link escape) 数据链路转义0001 0001 17 11 DC1 (device control 1) 设备控制1 0001 0010 18 12 DC2 (device control 2) 设备控制2 0001 0011 19 13 DC3 (device control 3) 设备控制3 0001 0100 20 14 DC4 (device control 4) 设备控制4 0001 0101 21 15 NAK (negative acknowledge) 拒绝接收0001 0110 22 16 SYN (synchronous idle) 同步空闲0001 0111 23 17 ETB (end of trans. block) 传输块结束0001 1000 24 18 CAN (cancel) 取消0001 1001 25 19 EM (end of medium) 介质中断0001 1010 26 1A SUB (substitute) 替补0001 1011 27 1B ESC (escape) 溢出0001 1100 28 1C FS (file separator) 文件分割符0001 1101 29 1D GS (group separator) 分组符0001 1110 30 1E RS (record separator) 记录分离符0001 1111 31 1F US (unit separator) 单元分隔符0010 0000 32 20 空格0010 0001 33 21 !0010 0010 34 22 "0010 0011 35 23 #0010 0100 36 24 $0010 0101 37 25 %0010 0110 38 26 &0010 0111 39 27 '0010 1000 40 28 (0010 1001 41 29 )0010 1101 45 2D - 0010 1110 46 2E . 0010 1111 47 2F / 0011 0000 48 30 0 0011 0001 49 31 1 0011 0010 50 32 2 0011 0011 51 33 3 0011 0100 52 34 4 0011 0101 53 35 5 0011 0110 54 36 6 0011 0111 55 37 7 0011 1000 56 38 8 0011 1001 57 39 9 0011 1010 58 3A : 0011 1011 59 3B ; 0011 1100 60 3C < 0011 1101 61 3D = 0011 1110 62 3E > 0011 1111 63 3F ? 0100 0000 64 40 @ 0100 0001 65 41 A 0100 0010 66 42 B 0100 0011 67 43 C 0100 0100 68 44 D 0100 0101 69 45 E 0100 0110 70 46 F 0100 0111 71 47 G 0100 1000 72 48 H 0100 1001 73 49 I 0100 1010 74 4A J 0100 1011 75 4B K 0100 1100 76 4C L 0100 1101 77 4D M 0100 1110 78 4E N 0100 1111 79 4F O 0101 0000 80 50 P 0101 0001 81 51 Q 0101 0010 82 52 R 0101 0011 83 53 S 0101 0100 84 54 T 0101 0101 85 55 U 0101 0110 86 56 V 0101 0111 87 57 W 0101 1000 88 58 X0101 1100 92 5C \0101 1101 93 5D ]0101 1110 94 5E ^0101 1111 95 5F _0110 0000 96 60 `0110 0001 97 61 a0110 0010 98 62 b0110 0011 99 63 c0110 0100 100 64 d0110 0101 101 65 e0110 0110 102 66 f0110 0111 103 67 g0110 1000 104 68 h0110 1001 105 69 i0110 1010 106 6A j0110 1011 107 6B k0110 1100 108 6C l0110 1101 109 6D m0110 1110 110 6E n0110 1111 111 6F o0111 0000 112 70 p0111 0001 113 71 q0111 0010 114 72 r0111 0011 115 73 s0111 0100 116 74 t0111 0101 117 75 u0111 0110 118 76 v0111 0111 119 77 w0111 1000 120 78 x0111 1001 121 79 y0111 1010 122 7A z0111 1011 123 7B {0111 1100 124 7C |0111 1101 125 7D }0111 1110 126 7E ~0111 1111 127 7F DEL (delete) 删除ESC键VK_ESCAPE (27)回车键:VK_RETURN (13)TAB键:VK_TAB (9)Caps Lock键:VK_CAPITAL (20)Shift键:VK_SHIFT ()Ctrl键:VK_CONTROL (17)Alt键:VK_MENU (18)空格键:VK_SPACE (/32)退格键:VK_BACK (8)左徽标键:VK_LWIN (91)右徽标键:VK_LWIN (92)鼠标右键快捷键:VK_APPS (93) Insert键:VK_INSERT (45) Home键:VK_HOME (36) Page Up:VK_PRIOR (33) PageDown:VK_NEXT (34)End键:VK_END (35)Delete键:VK_DELETE (46)方向键(←):VK_LEFT (37)方向键(↑):VK_UP (38)方向键(→):VK_RIGHT (39)方向键(↓):VK_DOWN (40)F1键:VK_F1 (112)F2键:VK_F2 (113)F3键:VK_F3 (114)F4键:VK_F4 (115)F5键:VK_F5 (116)F6键:VK_F6 (117)F7键:VK_F7 (118)F8键:VK_F8 (119)F9键:VK_F9 (120)F10键:VK_F10 (121)F11键:VK_F11 (122)F12键:VK_F12 (123)Num Lock键:VK_NUMLOCK (144) 小键盘0:VK_NUMPAD0 (96) 小键盘1:VK_NUMPAD0 (97) 小键盘2:VK_NUMPAD0 (98) 小键盘3:VK_NUMPAD0 (99) 小键盘4:VK_NUMPAD0 (100) 小键盘5:VK_NUMPAD0 (101) 小键盘6:VK_NUMPAD0 (102) 小键盘7:VK_NUMPAD0 (103) 小键盘8:VK_NUMPAD0 (104) 小键盘9:VK_NUMPAD0 (105) 小键盘.:VK_DECIMAL (110) 小键盘*:VK_MULTIPLY (106) 小键盘+:VK_MULTIPLY (107) 小键盘-:VK_SUBTRACT (109) 小键盘/:VK_DIVIDE (111) Pause Break键:VK_PAUSE (19) Scroll Lock键:VK_SCROLL (145)。
ASCII码对照表ASCII编码ASCII(American Standard Code for Information Interchange,美国信息互换标准代码,ASCⅡ)是基于拉丁字母的一套电脑编码系统。
它主要用于显示现代英语和其他西欧语言。
它是现今最通用的单字节编码系统,并等同于国际标准ISO/IEC 646。
ASCII第一次以规范标准的型态发表是在1967年,最后一次更新则是在1986年,至今为止共定义了128个字符,其中33个字符无法显示(这是以现今操作系统为依归,但在DOS模式下可显示出一些诸如笑脸、扑克牌花式等8-bit符号),且这33个字符多数都已是陈废的控制字符,控制字符的用途主要是用来操控已经处理过的文字,在33个字符之外的是95个可显示的字符,包含用键盘敲下空白键所产生的空白字符也算1个可显示字符(显示为空白)。
ASCII控制字符二进制十进制十六进制缩写可以显示的表示法名称/意义0000 0000 0 00 NUL ␀空字符(Null)0000 0001 1 01 SOH ␁标题开始0000 0010 2 02 STX ␂本文开始0000 0011 3 03 ETX ␃本文结束0000 0100 4 04 EOT ␄传输结束0000 0101 5 05 ENQ ␅请求0000 0110 6 06 ACK ␆确认回应0000 0111 7 07 BEL ␇响铃0000 1000 8 08 BS ␈退格0000 1001 9 09 HT ␉水平定位符号0000 1010 10 0A LF ␊换行键0000 1011 11 0B VT ␋垂直定位符号0000 1100 12 0C FF ␌换页键0000 1101 13 0D CR ␍归位键二进制十进制十六进制缩写可以显示的表示法名称/意义0000 1110 14 0E SO ␎取消变换(Shift out)0000 1111 15 0F SI ␏启用变换(Shift in)0001 0000 16 10 DLE ␐跳出数据通讯0001 0001 17 11 DC1 ␑设备控制一(XON 启用软件速度控制)0001 0010 18 12 DC2 ␒设备控制二0001 0011 19 13 DC3 ␓设备控制三(XOFF 停用软件速度控制)0001 0100 20 14 DC4 ␔设备控制四0001 0101 21 15 NAK ␕确认失败回应0001 0110 22 16 SYN ␖同步用暂停0001 0111 23 17 ETB ␗区块传输结束0001 1000 24 18 CAN ␘取消0001 1001 25 19 EM ␙连接介质中断0001 1010 26 1A SUB ␚替换0001 1011 27 1B ESC ␛跳出0001 1100 28 1C FS ␜文件分割符0001 1101 29 1D GS ␝组群分隔符0001 1110 30 1E RS ␞记录分隔符0001 1111 31 1F US ␟单元分隔符0111 1111 127 7F DEL ␡删除ASCII可显示字符二进制十进制十六进制图形0010 0000 32 20 (空格)(␠)0010 0001 33 21 ! 0010 0010 34 22 " 0010 0011 35 23 # 0010 0100 36 24 $ 0010 0101 37 25 % 0010 0110 38 26 & 0010 0111 39 27 '二进制十进制十六进制图形0100 0000 64 40 @0100 0001 65 41 A0100 0010 66 42 B0100 0011 67 43 C0100 0100 68 44 D0100 0101 69 45 E0100 0110 70 46 F0100 0111 71 47 G0100 1000 72 48 H0100 1001 73 49 I二进制十进制十六进制图形0110 0000 96 60 `0110 0001 97 61 a0110 0010 98 62 b0110 0011 99 63 c0110 0100 100 64 d0110 0101 101 65 e0110 0110 102 66 f0110 0111 103 67 g0110 1000 104 68 h0110 1001 105 69 i0110 1010 106 6A j0010 1000 40 28 ( 0010 1001 41 29 ) 0010 1010 42 2A * 0010 1011 43 2B + 0010 1100 44 2C , 0010 1101 45 2D - 0010 1110 46 2E . 0010 1111 47 2F / 0011 0000 48 30 0 0011 0001 49 31 1 0011 0010 50 32 2 0011 0011 51 33 3 0011 0100 52 34 4 0011 0101 53 35 5 0011 0110 54 36 6 0011 0111 55 37 7 0011 1000 56 38 8 0011 1001 57 39 9 0011 1010 58 3A : 0011 1011 59 3B ; 0011 1100 60 3C < 0011 1101 61 3D = 0011 1110 62 3E > 0011 1111 63 3F ? 0100 1010 74 4A J0100 1011 75 4B K0100 1100 76 4C L0100 1101 77 4D M0100 1110 78 4E N0100 1111 79 4F O0101 0000 80 50 P0101 0001 81 51 Q0101 0010 82 52 R0101 0011 83 53 S0101 0100 84 54 T0101 0101 85 55 U0101 0110 86 56 V0101 0111 87 57 W0101 1000 88 58 X0101 1001 89 59 Y0101 1010 90 5A Z0101 1011 91 5B [0101 1100 92 5C \0101 1101 93 5D ]0101 1110 94 5E ^0101 1111 95 5F _0110 1011 107 6B k0110 1100 108 6C l0110 1101 109 6D m0110 1110 110 6E n0110 1111 111 6F o0111 0000 112 70 p0111 0001 113 71 q0111 0010 114 72 r0111 0011 115 73 s0111 0100 116 74 t0111 0101 117 75 u0111 0110 118 76 v0111 0111 119 77 w0111 1000 120 78 x0111 1001 121 79 y0111 1010 122 7A z0111 1011 123 7B {0111 1100 124 7C |0111 1101 125 7D }0111 1110 126 7E ~。
Whole-genome microarray analysis identifies up-regulation of Nr4a nuclear receptors in muscle and liver from diet-restricted ratsRadu C.Oita a ,1,Dawn J.Mazzatti a ,1,*,Fei Ling Lim a ,Jonathan R.Powell a ,Brian J.Merry ba Unilever R&D Colworth,Colworth Science Park,Sharnbrook,Bedfordshire MK441LQ,United Kingdom bSchool of Biological Sciences,University of Liverpool,Liverpool L697ZB,United Kingdom1.IntroductionFor over 70years,dietary restriction (DR)has been recognised to slow/delay the ageing process and to extend maximum lifespan achieved [recently reviewed in (Merry,2005)].In fact,DR remains the only intervention repeatedly demonstrated to increase lifespan and delay age-associated diseases in mammalian species (Masoro,1988,2000).Since this discovery,a number of studies have sought to identify the mechanisms by which DR retards ageing in laboratory models.These proposed mechanisms include decreased oxidative stress (Sohal and Weindruch,1996),decreased damage to subcellular components (Kristal and Yu,1992),decreased body temperature and hypometabolic state (Walford and Spindler,1997),neuroendocrine changes (Nelson et al.,1995)and altera-tions in gene expression and protein degradation (Van Remmen et al.,1996).DR-induced alterations in gene expression undoubtedly play a significant role in its anti-ageing actions.To date,many studieshave reported the effects of DR on gene expression profiling in a number of tissue-types and laboratory animals.All of these studies were performed using Affymetrix TM partial-genome (i.e.6000transcripts)or cDNA arrays.However,since the sequencing was completed on the rat genome,whole-genome arrays have become commercially available providing a powerful tool to measure genome-wide expression.Recently,Fu et al.(2006)used Affyme-trix TM GeneChips with approximately 12,000genes to describe global gene expression changes in heart,liver,and hypothalamus of young and old ad libitum and DR-fed mice.Whilst this study uncovered a plethora of genes affected by ageing across different tissues in mouse,it remains possible that more genes and ESTs whose function have not previously been described in the context of ageing or DR –or whose function is completely unknown –may be discovered using gene arrays that cover the entire rodent genome.In the current study,we used Agilent TM whole-genome rat arrays with more than 40,000probes to investigate the effects of DR on gene expression in rat skeletal muscle of old (28months)rats fed the ad libitum or DR-diet (45%restricted from controls)from 1.5months of age.In addition to known alterations in stress response,protein metabolism and energy metabolism,we identified a novel class of genes,Nr4a nuclear receptors,thatMechanisms of Ageing and Development 130(2009)240–247A R T I C L E I N F O Article history:Received 27June 2008Received in revised form 13November 2008Accepted 12December 2008Available online 27December 2008Keywords:Dietary restriction Longevity AgeingNuclear orphan receptor NR4A Nur77A B S T R A C TOne of the most conserved methods to significantly increase lifespan in animals is through dietary restriction (DR).The mechanisms by which DR increases survival are controversial but are thought to include improvements in mitochondrial function concomitant with reductions in reactive oxygen species production and alterations in the insulin signalling pathway,resulting in global metabolic adaptation.In order to identify novel genes that may be important for lifespan extension of Brown Norway rats,we compared gene expression profiles from skeletal muscle of 28-month-old animals fed ad libitum or DR diets using whole-genome arrays.Following DR,426transcripts were significantly down-regulated whilst only 52were up-regulated.Included in the up-regulated transcripts were three functionally related previously unidentified DR-regulated genes:Nr4a1,Nr4a2,and Nr4a3.Up-regulation of all three Nr4a receptors was also observed in liver –but not brain –of DR-fed animals.Furthermore,RT-PCR revealed up-regulation of several NR4A transcriptional targets (Ucp-3,Ampk-g 3,Pgc-1a and Pgc-1b )in skeletal muscle of DR animals.Due to the proposed roles of the NR4A nuclear receptors in sensing and responding to changes in the nutritional environment and in regulating glucose and lipid metabolism and insulin sensitivity,we hypothesise that these proteins may contribute to DR-induced metabolic adaptation.ß2009Elsevier Ireland Ltd.All rights reserved.*Corresponding author.Tel.:+44234222372;fax:+441234222161.E-mail address:Dawn.Mazzatti@ (D.J.Mazzatti).1These authors contributed equally to the work.Contents lists available at ScienceDirectMechanisms of Ageing and Developmentj o u r n a l h o m e p a g e :w w w.e l s e v i e r.c o m /l o c a t e /m e c h a g e d e v0047-6374/$–see front matter ß2009Elsevier Ireland Ltd.All rights reserved.doi:10.1016/j.mad.2008.12.004were differentially regulated not only in skeletal muscle,but also in liver but not brain of animals fed the DR diet compared to ad libitum-fed age-matched animals.Due to the proposed roles of the NR4A subfamily of nuclear receptors in sensing and responding to environmental changes and in regulating glucose and lipid metabolism and insulin sensitivity,we hypothesise that these proteins may play a novel role in DR-induced metabolic adaptation.2.Materials and methods2.1.AnimalsMale Brown Norway rats(Substrain BN/SsNOlaHSD)were obtained from Harlan UK at21–28days of age and maintained on a CRM diet supplied by Dietex International,Witham,UK as previously described(Merry et al.,2008)Rats were maintained under barrier conditions in which sentinel animals were routinely screened for microbiological states to ensure a consistent health status throughout the duration of the study.Rats were maintained on a12:12-h light/dark cycle (08:00–20:00)at22Æ18C and caged in groups of four and fed ad libitum until1.5 months of age.After this time they were transferred to single housing and assigned randomly to either control or DR feeding regimes.DR-fed animals were fed the CRM diet at55%the daily food intake of age-matched control rats in order to maintain their body weight at approximately55%that of control,ad libitum-fed animals.The diet of animals maintained on a DR regime was supplied daily as pre-weighed rations between10:30and11:00h.Survival trajectories were determined(data not shown)to ensure that the DR feeding regime induced a significant effect on survival.The survival data,analysed by the log-rank(Peto)test,showed that the DR feeding regime induced a significant extension in survival(p<0.0001).All animal husbandry procedures were carried out in accordance with the provisions of the United Kingdom Animals (Scientific Procedures)Act1986.Six animals were randomly selected from both diet groups to provide tissues for the microarray analysis.The initial group sizes from which the animals were selected were control(102)and DR(75).Hind-limb gastrocnemius muscles were sampled from each animal.Tissues were taken immediately at death and snap-frozen in liquid N2.2.2.MicroarraysMicroarray experimentation was performed as previously described(Mazzatti et al.,2008)with the exception of600ng input RNA for labelling and the use of Agilent rat oligonucleotide arrays(Wokingham,Berkshire,UK).The slides were scanned with the Agilent G2565BA Microarray Scanner System.For data extraction and quality control,the Agilent G2567AA Feature Extraction Software(v.9.1)was used.2.3.Bioinformatics analysisExtracted data were analysed using GeneSpring GX7.3.1(Agilent Technologies, CA,USA).Agilent standard scenario normalisations for FE1-colour arrays were applied to all data sets.A subset of genes(from an initial41,105probes)for data interrogation was generated that excluded controls,spots of poor quality(absent calls),and gene probes that were present or marginal in less than6out of12of experimental samples.This yielded20,023probes for analysis.From these20,023 probes,relative expression in animals fed the ad libitum diet was compared to animals on the dietary restriction(DR)diet.Genes differentially regulated by greater than 2.0-fold were selected.One-way,parametric,ANOVA tests were performed followed by Benjamini and Hochberg multiple test correction with a false discovery rate of0.05,in order to decrease the number of false positives (Pawitan et al.,2005).Microsoft Excel templates were prepared containing genes that were over-and under-expressed following DR.2.4.Ingenuity TM Pathway Analysis(IPA)Ingenuity TM Pathway Analysis(IPA)3.0(Ingenuity TM Systems,CA,USA)was utilised to assemble functional networks altered by DR.Ingenuity entry tool systematically encodesfindings presented in peer-reviewed scientific publications into ontologies,or groups of genes/proteins related by common function.Molecular networks of direct physical,transcriptional,and enzymatic interactions were computed from this knowledge base using the genes differentially regulated by DR. The resulting networks contain molecular relationships with a high degree of connectivity and each gene in the network is supported by published literature.2.5.Real-time quantitative reverse-transcription PCR(Q-PCR)RNA was prepared from cells as described and cDNA synthesis was performed using1m g total RNA and oligo dT primers(Invitrogen,Paisley,UK).Taqman (Applied Biosystems,UK)probes used for RT-PCR validation of microarrays are listed in Table2.Probes not listed in Table2but used for RT-PCR analysis include nuclear receptor subfamily4,group A,member1:Rn00666995_m1;nuclear receptor subfamily4,group A,member3:Rn00581189_m1;nuclear receptor subfamily4,group A,member2:Rn00570936_m1;peroxisome proliferator activator receptor delta:Rn00565707_m1;peroxisome proliferator activated receptor gamma:Rn00440945_m1;peroxisome proliferator activated receptor alpha:Rn00566193_m1;uncoupling protein3:Rn00565874_m1;fatty acid binding protein4:Rn00670361_m1;protein kinase,AMP-activated,gamma3 non-catalytic subunit:Rn01400861_g1;peroxisome proliferative activated recep-tor,gamma,coactivator1beta:Rn00598552_m1;peroxisome proliferative activated receptor,gamma,coactivator1alpha:Rn00580241_m1;glyceralde-hyde-3-phosphate dehydrogenase:Rn99999916_s1;actin,beta:Rn00667869_m1. The Bio-rad I-Cycler(Bio-rad,Hercules,CA)with FAM-490system detection was used for real-time RT-PCR.PCR thermocycler conditions were508C for2min,908C for2min followed by45cycles of958C for15s and608C for60s.All samples were run in triplicate with both primer sets and the control genes Gapdh and b-actin to control for differences in amount of starting material.Fold changes were calculated using the2ÀDD Ct method.Statistical analyses were performed using Student’s t-test.A p-value of less than0.05was considered significant.3.Results3.1.DR-responsive genes and ontologiesThe primary aim of this study was to identify novel genes that are differentially regulated by DR in rats using whole-genome arrays.In order to examine the effect of long-term DR on gene expression profiles,RNA samples from skeletal muscle of six ad libitum-fed and six DR-fed animals were subjected to whole-genome microarray analysis.Stringent data analysis was per-formed in order to ensure that the genes identified through microarray analysis were truly differentially expressed.After exclusion of absent calls and probes that were expressed (flags=present or marginal)in less than half of experimental samples,20,023out of an initial41,105probes(50%)were considered for analysis.Only probes with a differential expression of at least2.0-fold and which passed ANOVA testing at p<0.05 were considered to be truly differentially expressed by DR.Gene expression profiling of muscle from ad libitum-and DR-fed animals demonstrated that a total of478probes were differentially expressed.These are listed in Supplementary Table1.Of these probes,52were up-regulated and426were down-regulated by DR.The478significantly regulated probes were subjected to gene cluster analysis using a Pearson correlation.A heatmap was generated where each row represents one of478probes and each column represents one skeletal muscle sample from one animal. Expression of the478probes in skeletal muscle of each animal is shown in Fig.1.The intensity of colour in a cell represents the normalised expression of the probe,whilst green and red colouring depicts low and high expression,respectively.Expression of each probe in samples from the six animals fed the DR diet and six animals fed ad libitum are shown from left to right.The observed inter-animal variation in gene expression is likely due to differences in the relative proportion of fast and slow muscle fibre-types in individual animals.Biological processes affected by DR were investigated initially using Gene Ontology(GO)analysis of the genes significantly regulated in DR-compared to ad libitum-fed animals.Table1 shows the20most significantly regulated GO biological processes in dietary restricted muscle with associated p-value.Although functions known to be affected by DR(including glucose and lipid metabolism)are not among the top20most-regulated ontologies, several metabolic ontologies were found to be significantly regulated(p<0.05):glycogen metabolism,aspartate metabolism, protein metabolism,nucleoside metabolism,fat cell differentia-tion,and mitochondrial biogenesis.Additionally,we observed DR-dependent significant regulation of cell-cycle,growth and apoptosis-related ontologies.In an expanded list of genes with less stringent selection criteria(differentially regulated at least 1.5-fold and p<0.05)consisting of greater than3000probes,weR.C.Oita et al./Mechanisms of Ageing and Development130(2009)240–247241observed significant differences in multiple ontologies related to glucose,lipid,and glycogen metabolism,synthesis,and usage (data not shown).These data confirm results observed in previously investigated diet-and/or calorie-restriction models.3.2.Validation of arrays using real-time RT-PCRIn order to validate results obtained using the microarrays we arbitrarily selected 14genes and assessed mRNA expression by real-time RT-PCR.Table 2compares DR-regulated gene expression in skeletal muscle by gene array and RT-PCR.GenBank gene identifier,Taqman probe reference (Applied Biosystems,UK),common gene name,and fold-change in gene expression in muscle of DR-compared to ad libitum -fed animals,as assessed by gene array and RT-PCR,are shown.All 14genes selected for validation demonstrated similar expression patterns for the microarray and real-time RT-PCR measurements,yet with different magnitudes,thus validating the array results.3.3.Expression of Nr4a1,Nr4a2and Nr4a3in skeletal muscle,liver and brain of ad libitum and DR animalsIncluded in the transcripts found to be differentially regulated in skeletal muscle by DR were three functionally related previously unidentified DR-regulated genes:Nr4a1,Nr4a2,and Nr4a3.These three genes were up-regulated by 2.2-fold,3.0-fold,and 3.7-fold,respectively,in skeletal muscle from DR animals compared to control.The NR4A subfamily of nuclear receptors was first identified as early responsive genes for growth factors (Milbrandt,1988;Law et al.,1992)and have since been implicated in regulating the response to insulin (Fu et al.,2007).These proteins include NR4A1(Nur77/TR3/NGFI-B/NAK-1),NR4A2(Nur1/NOT)and NR4A3(NOR1/MINOR).In order to determine if these receptors were differentially expressed in a tissue-specific manner following DR,we further assessed the gene expression of these receptors in skeletal muscle,liver and whole brain of DR-and ad libitum -fed animals.Fig.2shows mRNA expression of Nr4a1,Nr4a2,and Nr4a3by real-time RT-PCR.Tissue-specific differential expression of Nr4a receptors was observed.In muscle and liver,up-regulation of all three Nr4a receptors (Nr4a1,Nr4a2and NR4a3)was observed in dietary restricted animals compared to control.In contrast,in brain,dietary restriction did not significantlyalterFig.1.Hierarchical clustering of DR-sensitive gene probes.The 478gene probes significantly differentially regulated in skeletal muscle samples from DR compared to ad libitum -fed animals were subjected to gene cluster analysis using a Pearson correlation.A heatmap was generated where each row represents one of 478probe sets and each column represents one skeletal muscle sample from an individual animal.The intensity of colour in a cell represents the normalised expression of the probe,where green and red colouring depicts low and high expression,respectively,compared to the average expression of each probe across all samples.n =6animals in each group.Table 1Top 20significantly DR-regulated ontologies and associated p -values.Ontologyp -value GO:48589:developmental growth 3.11E À06GO:6952:defence response9.57E À06GO:9607:response to biotic stimulus 2.56E À05GO:6955:immune response2.95E À05GO:6878:copper ion homeostasis3.05E À05GO:7517:muscle development 8.58E À05GO:6936:muscle contraction 0.000104GO:19882:antigen presentation0.000131GO:42535:positive regulation of tumour necrosis factor-alpha biosynthesis0.000142GO:42534:regulation of tumour necrosis factor-alpha biosynthesis0.000142GO:42533:tumour necrosis factor-alpha biosynthesis 0.000142GO:48668:collateral sprouting0.000264GO:48669:collateral sprouting in the absence of injury 0.000264GO:48738:cardiac muscle development0.000264GO:48739:cardiac muscle fibre development0.000264GO:45736:negative regulation of cyclin-dependent protein kinase activity0.000333GO:30333:antigen processing 0.000397GO:9611:response to wounding0.00044GO:16198:axon choice point recognition0.000784GO:16199:axon midline choice point recognition0.000784R.C.Oita et al./Mechanisms of Ageing and Development 130(2009)240–247242expression of any Nr4a receptor.However,this appeared to result from high intra-animal variation most likely due to the fact that expression was measured in whole-brain and not in specific sub-regions.These data highlight the complex regulation of these receptors and suggest that each NR4A receptor may exert diverse functions in different tissues.This is unsurprising as it has recently been hypothesised that NR4A target genes and function may be both regulated in a cell type-specific manner and be developmen-tally programmed (Fu et al.,2007;Pei et al.,2006).3.4.Expression of NR4A-interacting genesSimilar to other steroid receptors,each NR4A receptor contains a DNA-binding domain,a transactivation domain,and a putative ligand-binding domain.Initially classified as orphan receptors due to lack of known ligand,it now seems probable that they are true orphan receptors and do not require ligand binding for their physiological function.All three NR4A proteins bind to a consensus NBRE (NGF-IB response element)sequence (AAAGGTCA)as monomers or to a palindromic NurRE sequence (TGATATTT-X6AAATGCCA)found naturally in the pro-opiomelanocortin (POMC)promoter,as homo-or heterodimers (Philips et al.,1997a ).Additionally,NR4A1and A2heterodimerise with retinoid X-receptor (RXR)to mediate response to retinoids (Wallen-Mackenzie et al.,2003).RXR plays an important regulatory rolein metabolic signalling pathways (glucose,fatty acid and cholesterol metabolism)and has been implicated in metabolic disorders such as type 2diabetes,hyperlipidaemia and athero-sclerosis (reviewed in Ahuja et al.,2003).Due to the increased expression of all three Nr4a receptors in skeletal muscle and known interaction of the NR4A proteins with RXR,we hypothe-sised that Rxr expression might be up-regulated by DR,thereby allowing the possibility of increased transcriptional activation of target genes.However,microarray analysis identified no signifi-cant effects of DR on any RXR isoform,including Rxr-a ,-b ,and -g .We next investigated whether DR affected expression of an important class of RXR-interacting proteins that have previously been shown to be altered as a consequence of DR,the peroxisome proliferator-activated receptors (PPARs)(Zhu et al.,2004;reviewed in Masternak and Bartke,2007)by real-time RT-PCR analysis.Fig.3shows relative mRNA expression of Ppar-a ,-b /d ,and -g in muscle,liver and brain from animals on the DR diet compared to control.DR resulted in down-regulation of Ppar-a in muscle concomitant with up-regulation in liver compared to control.In contrast,Ppar-b /d was down-regulated in both liver andTable 2Comparison of DR-regulated gene expression by gene array and RT-PCR.GenBank gene identifier,Taqman probe reference (Applied Biosystems,UK),common gene name,and fold-change in gene expression in DR-compared to ad libitum -fed animals,as assessed by gene array and RT-PCR,are shown.p <0.05for all genes shown.GenBank identifier Taqman probe reference Common nameFold-change array Fold-change RT-PCR NM_024362Rn00577590_m1Aryl hydrocarbon receptor nuclear translocator-like À6.58À6.13NM_017325Rn00569082_m1Runt related transcription factor 1À5.35À9.20NM_145775Rn00595671_m1Nuclear receptor subfamily 1,group D,member 1À2.88À3.05NM_198769Rn02133647_s1Toll-like receptor 2À2.86À1.20NM_012861Rn00563462_m1O-6-methylguanine-DNA methyltransferase À2.76À2.42NM_017237Rn00568258_m1ubiquitin carboxy-terminal hydrolase L1À3.70À2.30NM_001024791Rn01456494_g1Epsin 3À3.22À8.83NM_001013247Rn02769377_s1SarcolipinÀ6.54À3.03NM_017131Rn00567508_m1Calsequestrin 2À3.13À1.50NM_031612Rn00581093_m1Apelin,AGTRL1ligandÀ2.54À3.15NM_080767Rn00589926_m1Proteosome (prosome,macropain)subunit,beta type 8À2.25À3.00NM_012708Rn00562296_m1Proteosome (prosome,macropain)subunit,beta type 9À2.15À3.25NM_012922Rn00563902_m1Caspase 3,apoptosis related cysteine protease À2.42À3.80NM_001007713Rn01400508_g1Transmembrane BAX inhibitor motif containing 1À3.90À1.33Fig.3.mRNA expression of Ppar-a ,-b /d ,and -g in muscle,liver and brain from animals on the DR diet compared to control.RNA was prepared and in vitro transcription was performed using 1m g total RNA and random hexamer primers (Invitrogen,Paisley,UK).The Bio-rad I-Cycler (Bio-rad,Hercules,CA)with FAM-490system detection was used for real-time RT-PCR.Taqman (Applied Biosystems,Applera,UK)probes were used as detailed in Section 2.Animals were grouped into DR and ad libitum conditions and relative mRNA expression in each group was determined.All samples were run in triplicate with test probes and the control rat genes B-actin and Gapdh to control for differences in amount of starting material.Fold-change in expression was calculated by normalising the test gene crossing threshold (Ct)with the averaged amplified control and then comparing to gene expression in ad libitum-fed animals.Fold-change in mRNA expression of PPAR a ,g ,b /d in muscle (black),liver (light grey)and whole brain (white)in DR animals compared to ad libitum -fed animals is shown.n =6animals per group;asterisk (*)denotes p <0.05.Fig.2.Expression of Nr4a1,Nr4a2and Nr4a3in skeletal muscle,liver and brain of ad libitum and DR animals.RNA was prepared and in vitro transcription was performed using 1m g total RNA and random hexamer primers (Invitrogen,Paisley,UK).The Bio-rad I-Cycler (Bio-rad,Hercules,CA)with FAM-490system detection was used for real-time RT-PCR.Taqman (Applied Biosystems,Applera,UK)probes were used as detailed in Section 2.Animals were grouped into DR and ad libitum conditions and relative mRNA expression in each group was determined.All samples were run in triplicate with test probes and the control rat genes B-actin and Gapdh to control for differences in amount of starting material.Fold-change in expression was calculated by normalising the test gene crossing threshold (Ct)with the averaged amplified control and then comparing to gene expression in ad libitum-fed animals.Fold-change in mRNA expression of Nr4a1,Nr4a2,and Nr4a3in skeletal muscle (black),liver (light grey)and whole brain (white)in DR animals compared to ad libitum -fed animals is shown.n =6animals in each group;asterisk (*)denotes p <0.05.R.C.Oita et al./Mechanisms of Ageing and Development 130(2009)240–247243brain,but not in muscle.No significant change in Ppar-g expression was observed in any of the three tissues investigated.Whilst we observed decreased expression of only Ppar-a in muscle,Masternak et al.(2005a,b)have previously demonstrated DR-induced down-regulation of Ppar-a ,b /d ,and g expression in mouse muscle.In the same studies,they identified no effect on the expression of Rxr isoforms following DR,which we have recapitulated.Additionally,in liver and heart,Ppar expression was found to be both up-and down-regulated,depending on the isoform and tissue investigated (Masternak et al.,2005a ,2004)suggesting that regulation of these nuclear hormone receptors by DR is complex and occurs in a tissue-specific and isoform-specific manner.In order to better understand the significance of altered Nr4a expression in muscle of DR rats,we further investigated known transcriptional targets of NR4A receptors.To date,very few known transcriptional targets of any of the NR4A family in myocytes exist.Attenuation of NR4A1expression in muscle results in decreased expression of genes including uncoupling protein-3(Ucp-3),glucose transporter 4(Glut4),CD36,caveolin 3(Cav3)and AMP-activated protein kinase g 3subunit (Ampk g 3)(Maxwell et al.,2005).Two recent reports have described NR4A3transcriptional targets in muscle.These include fatty acid binding protein-4(Fabp-4),Ucp-2and Ucp-3,PPAR gamma-coactivators alpha and beta (PGC-1a and b ),lipin1a ,and pyruvate dehydrogenase phospha-tase 1(PDHP1)(Pearen et al.,2006,2008).Since microarray analysis did not demonstrate altered expression of any of these genes,we next investigated muscle-specific expression of these targets by RT-PCR.Fig.4shows relative mRNA expression of two NR4A1targets (Ucp-3,and Ampk-g 3)and three NR4A3targets (Pgc-1a and Pgc -1b and Fabp-4)in muscle from animals fed ad libitum orthe DR diet.We observed significant up-regulation of Ucp-3,Ampk-g 3Pgc-1a and Pgc -1b with no change in expression of Fabp-4following DR.These data are consistent with increased transcrip-tional activity of NR4A1and NR4A3.We next used Ingenuity Pathway Analysis TM (IPA)to investigate whether additional NR4A-interacting proteins were regulated by DR.IPA identified one network in which all three NR4A receptors are depicted together with interacting proteins (Fig.5).Common names of these genes,network score (probability of network being assembled by chance alone)and main cellular functions of the network are shown in Table 3.Coloured genes were identified by microarray analysis as differentially up-regulated or down-regulated by DR (red and green colouring,respectively).IPA analysis of the genes affected by DR identified one homodimeric protein,platelet-derived growth factor-B (PDGFBB)that directly stimulates expression of all three NR4A receptors.PDGFBB is a potent mitogen for vascular smooth muscle cells.PDGFBB was found to inhibit the induction of nitric oxide synthase activity in vascular smooth muscle cells (Schini et al.,1992).Interestingly,the NR4A orphan nuclear receptor NOR1is induced by platelet-derived growth factor and mediates vascular smooth muscle cell proliferation (Nomiyama et al.,2006).Furthermore,a role for NR4A proteins in protecting against vascular disease has recently been hypothesised (Pols et al.,2007).However,neither investigations of PDGFBB in dietary restriction nor in ageing have been reported.Microarray analysis revealed a trend towards decreased expression of Pdgfbb in the DR condition (À1.2-fold compared to ad libitum ),but this was not statistically significant (p =0.20).These data suggest that up-regulation of NR4A receptors following long-term DR is independent of Pdgfbb expression,but it remains possible that expression or activity of the protein may be affected by DR.Additionally IPA identified the direct effects of tumour necrosis factor (TNF)on expression of all three NR4As,and both direct and indirect effects of leucine and RXRG on NR4A1and NR4A3or NR4A1and NR4A2,respectively.Again,we observed no change in the expression of these molecules but their protein expression and/or activity could be altered as a consequence of DR.Thus these factors could potentially be regulators of NR4A receptors in the DR condition.Taken together,pathway analysis identified multiple potential mechanisms of regulation of NR4A expression which may contribute to the effects of DR.4.DiscussionHere,we demonstrate for the first time increased mRNA expression of all three NR4A receptors (Nr4a1,Nr4a2,and Nr4a3)in rat skeletal muscle and liver following DR.No significant changes were observed in brain,demonstrating tissue-specificity in expression patterns following DR.We further observed up-regulation of several NR4A transcriptional targets -Ucp-3,Ampk-g 3,Pgc-1a and Pgc-1b -indicating increased NR4A activity in muscle following DR.To date,very few studies have investigated the role of NR4A receptors in disease.Initially,the subfamily of receptors (before they were classed as NR4A receptors)was investigated only in brain and immune system;all three NR4A receptors are widely expressed in the central nervoussystemFig.4.mRNA expression of NR4A targets Ucp-3,Ampk-g 3,Pgc-1a and Pgc -1b and Fabp-4in muscle from animals on the DR diet compared to control.RNA was prepared and in vitro transcription was performed using 1m g total RNA and oligo dT primers (Invitrogen,Paisley,UK).The Bio-rad I-Cycler (Bio-rad,Hercules,CA)with FAM-490system detection was used for real-time RT-PCR.Taqman (Applied Biosystems,Applera,UK)probes were used as detailed in Section 2.Animals were grouped into DR and ad libitum conditions and relative mRNA expression in each group was determined.All samples were run in triplicate with test probes and the control rat genes B-actin and Gapdh to control for differences in amount of starting material.Fold-change in expression was calculated by normalising the test gene crossing threshold (Ct)with the averaged amplified control and then comparing to gene expression in ad libitum-fed animals.Fold-change in mRNA expression of Ucp-3,Ampk-g 3,Pgc-1a and Pgc -1b and Fabp-4in muscle isolated from DR animals compared to ad libitum -fed animals is shown.n =6animals per group;asterisk (*)denotes p <0.05.Table 3Genetic network differentially affected by DR.Genes up-regulated and down-regulated following DR compared to ad libitum -fed animals are depicted with upward pointing and downward pointing arrows,respectively.Other genes listed were not significantly regulated.A score of >3was associated with p <0.001.The network is depicted visually in Fig.5.GenesNetwork score Associated functionsACHE,Akt,APLN(#),ARNTL(#),BHLHB2,Calcineurin A,CCND3,CHI3L1,CSF1R,CYP17A1,DBP,FSTL1,HDAC9,HSD3B2(includes EG:3284),inosine,ITGAL,leucine,MGMT(#),MVP,NR1D1(#),NR4A1("),NR4A2("),NR4A3("),PDGF BB,Pkc(s),RUNX1(#),RUNX3,RXRG,S100A9,SLC6A3,TBX21,TGFB1,TLR2(#),TLR6,TNF25Immune and lymphatic system development and function,tissue morphology,cell cycleR.C.Oita et al./Mechanisms of Ageing and Development 130(2009)240–247244。