2839a001
- 格式:pdf
- 大小:4.05 MB
- 文档页数:8
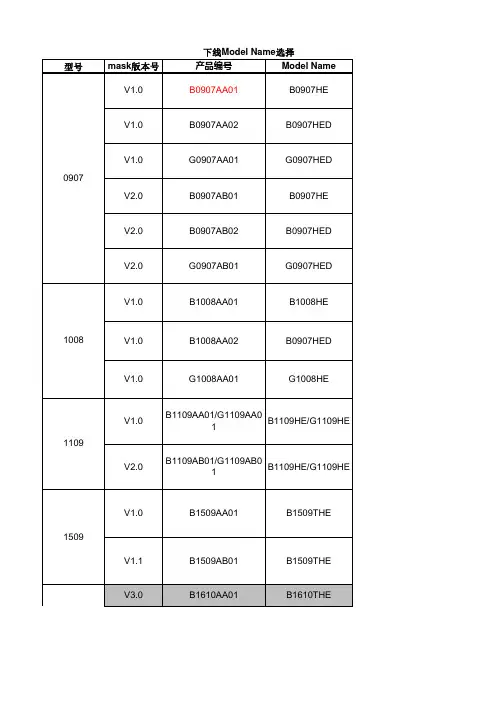
型号mask 版本号产品编号Model Name V1.0B0907AA01B0907HE V1.0B0907AA02B0907HED V1.0G0907AA01G0907HED V2.0B0907AB01B0907HEV2.0B0907AB02B0907HEDV2.0G0907AB01G0907HEDV1.0B1008AA01B1008HEV1.0B1008AA02B0907HEDV1.0G1008AA01G1008HEV1.0B1109AA01/G1109AA01B1109HE/G1109HE V2.0B1109AB01/G1109AB01B1109HE/G1109HEV1.0B1509AA01B1509THE V1.1B1509AB01B1509THEV3.0B1610AA01B1610THE1109下线Model Name 选择100809071509V4.1B1610AB02B1610THE V4.1B1610AB03B1610THE V4.1B1610AB04B1610THE V4.2B1610AC04B1610THE V1.0B2109AA01B2109THE V2.0B2109AB01B2109THEV1.0B2020AA01B2020THMV1.1B2020AA01B2020THMV1.2B2020AB01B2020THM无标注B2410AA01B2410SLV3.0B2410AB02B2410THEV3.0B2410AB03B2410THE210920201610V3.0B2410AB04B2410THE 2410V3.0B2410AB05B2410THEV3.1B2410AC04B2410THEV3.2B2410AD04B2410THEV4.0B2410AE05B2410THEV3.0B2812AA01B2812THEV3.0B2812AA02B2812THEV3.0B2812AA03B2812THEV3.0B2812AA02B2812THE 2812V4.0B2812AB01B2812THEV4.1B2812AC02B2812THERDV1.0B2812AD04B2812THEV5.0B2812AD01B2812THEV2.0B2626AA01B2626THMV2.1B2626AB02B2626THMV2.1B2626AB03B2626THM 2626V2.2B2626AC01B2626THM V2.2G2626AC01G2626THM V1.0B3030AA01B3030THM V1.0B3030AA02B3030THMV2.0B3030AB01B3030THMV2.1B3030AC01B3030THMV2.2B3030AD01B3030THMV1.0B3434AA01B3434THM26263030V1.0B3434AA02B3434THM 3434V2.0B3434AB01B3434THMV2.1B3434AC01B3434THMV1.0B4222AA01B4222THEV2.0B4222AB01B4222THE 4222V2.1B4222AC01B4222THEV1.0B4040AA01B4040THMV1.1B4040AA01B4040THMV2.0B4040AA01B4040THM 4040V2.1B4040AB01B4040THMV1.0B4545AA01B4545THMV1.1B4545AA01B4545THMV2.0B4545AB01B4545THM 4545V2.1B4545AC01B4545THMV1.0B5050AA01B5050THM 5050V2.0B5050AB01B5050THMV1.0B6060AA01B6060THMV2.0B6060AB01B6060THM 6060V2.1B6060AC01B6060THM状态图形备注量产在用普通蓝光非量产在用RGB蓝光非量产在用RGB绿光非量产在用普通蓝光非量产在用RGB蓝光非量产在用RGB绿光非量产在用普通蓝光非量产在用RGB蓝光非量产在用RGB绿光非量产TR在用非量产PIE在用非量产在用非量产在用非量产不在用量产停用Lapping:150um+/-5um量产停用Lapping:130um+/-5um量产在用在ITO和Metal酸洗前增加Wait站别量产在用非量产不在用非量产在用非量产不在用非量产在用非量产在用不在用量产ER、1BH停用Lapping:150um+/-5um量产ER、1BH停用Lapping:130um+/-5um量产ER、1BH在用在ITO和Metal酸洗前增加Wait站别量产Aixron 使用PV recipe改为:PV-test-S200非量产在用非量产在用非量产在用PV:P5000量产ER、1BH停用Lapping:150um+/-5um量产ER、1BH停用Lapping:130um+/-5um量产ER、1BH在用在ITO和Metal酸洗前增加Wait站别非量产在用非量产在用非量产在用非量产在用PV:P5000非量产在用非量产不在用量产停用量产在用在ITO和Metal酸洗前增加Wait站别非量产在用非量产在用绿光量产在用量产在用测试电流由120mA改为350mA 非量产在用非量产在用非量产在用量产停用量产在用在ITO和Metal酸洗前增加Wait站别非量产在用非量产在用非量产不在用非量产在用非量产在用非量产不在用非量产不在用非量产在用非量产在用非量产不在用非量产不在用非量产在用非量产在用非量产不在用非量产在用非量产不在用非量产在用非量产在用。

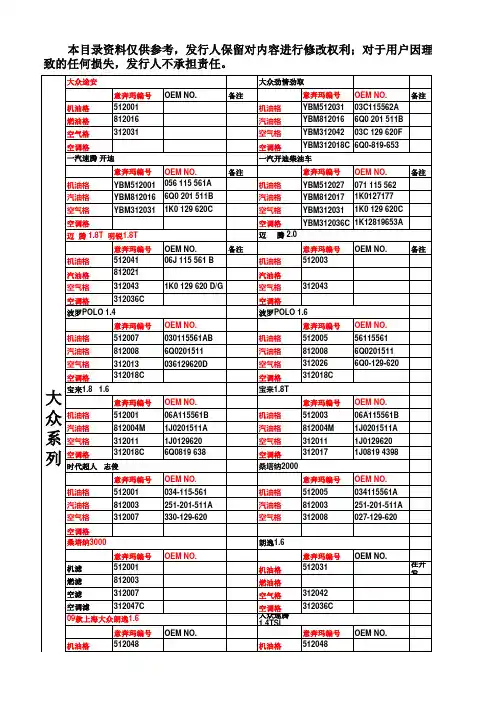
备件代码备件名称Q33210六角锁紧螺母Q332082型全金属六角锁紧螺母Q32916螺栓Q32910螺栓Q32810T13F2螺母Q32806螺栓Q32606自锁螺母Q2724895螺钉Q2724819螺栓Q2724816螺钉Q2724813螺栓Q2715519螺钉Q2714832螺钉Q2714825螺栓Q2714822螺栓Q2714819螺钉Q2714816螺钉Q2714295螺钉Q2714219F6螺栓Q2714216F6螺栓Q2714213螺栓Q2714212十字槽平圆头自攻螺钉Q2713513螺钉Q2360410M4螺栓-固定时钟弹簧Q218B1035螺栓Q218B0820内六角螺栓Q218B0816内六角螺栓Q218B0650内六角头螺栓Q218B0610内六角螺栓(M6*9)Q2140508螺钉Q1800816螺栓Q151C1290螺栓(Q151C1290TF2)Q151C1285螺栓Q151C1260螺栓Q151C1228T螺栓Q151C1225TF2螺栓Q151C1220螺栓Q150B0838六角头螺栓Q150B0835TF2差速器侧盖螺栓Q150B0832六角头螺栓N 90427901拉芯铆钉 A4*6(N 904 279 01) N 90417301螺钉N 90415404螺栓N 90412901组合螺栓N 90339901螺栓N 90302301螺栓N 90274202螺栓N 90251001铆钉(N 902 510 01)N 90241201十字槽扁圆头凸缘螺钉N 901833010型密封圈(3806044-JA)-传感器与燃油箱N 90174001螺栓-固定前制动器(N 901 740 03全球采购件KD)N 90097202圆头内梅花螺栓N 90070303锁紧垫片N 90070301锁紧垫片N 90052702锁紧垫片N 10254901夹子N 10199201管夹N 100576JA卡箍N 0901866螺钉N 0380182锁紧垫片N 0245092卡箍N 0211761螺母N 0209091线束扎带N 0209022电线夹带N 0199123螺栓-固定后制动器N 017762JA雾灯灯泡N 017760JA大灯灯泡N 017750JA牌照灯灯泡N 017740JA转向灯灯泡(黄色)N 017738JA灯泡N 017732JA转向灯灯泡(白色)N 017730JA前位灯灯炮N 0171319JA电阻丝(30A)N 0171318JA电阻丝(25A)N 0171316JA熔断丝(15A)N 0171315JA熔断丝(10A)N 0171313JA熔断丝(5A)N 0171313熔断丝(5A)N 0154671簧片螺母N 0154581快速螺母N 0154452簧片螺母N 0154222快速螺母N 0147506螺栓N 0147151后壳螺栓N 0139681自攻螺丝N 0133361弹性圆柱销N 0133351弹性圆柱销N 0133191弹性圆柱销N 0132832弹性圆柱销N 0128582夹紧垫圈N 0123274开口挡圈N 0116735垫圈N 0116672垫圈N 0116123垫圈N 0115227垫圈N 0111864螺母KP710-00150密封胶KEDD00000JA1R134A制冷液KEDD00000JA R134A制冷液(13.61KG/罐)GY PS46 025压缩机润滑油(牡丹江250ML、R134A)GY PAG46 25压缩机润滑油(专用于8103010-KK压缩机,250ML)GX 7590GL4016变速器齿轮油(1升/桶,12桶一包装)G 100800B4发动机润滑油(10W/30 SJ)4.3升/桶G 100800B1发动机润滑油(10W/30 SJ)4.3升/桶G 052154JA1压缩机润滑油(牡丹江250ML、R134A)G 052154JA压缩机润滑油(500ML)G 012A8DA1A红旗轿车专用F0防冻液G 012A8CJA防冻液(红色,级别:D0)G 011V8BJA防冻液(绿色,B0)G 005000012变速器齿轮油G 002000动力转向油F3743030-JC后座垫电机(加长豪华)F1701360-JA换挡轴及拨叉总成-3、4挡(1701360-JA)CQ67616夹箍CQ67550夹箍CQ67545夹箍CQ67527夹箍CQ67516卡箍CQ39606组合螺栓CQ35116右旋螺母(M16*1.5)CQ34010六角螺母CQ34008螺母CQ34006螺母CQ32606六角法兰面螺母CQ31204100螺母CQ1601085螺栓CQ1601075螺栓CQ1601070螺栓CQ1601060螺栓CQ1601030螺栓CQ1601025螺栓CQ16010100螺栓CQ1600855螺栓CQ1600850螺栓CQ1600845螺栓CQ16008140螺栓(压缩机调节)CQ1500830螺栓CQ1500825螺栓CQ1500820螺栓CQ1500816螺栓CQ1500812导径螺栓CQ1500620导颈螺栓CQ1500616螺栓CQ1500614螺栓CQ1500612螺栓CQ1500610螺栓CQ1500416螺栓B3724850TKN空调转接线总成B 000600JA制动液B 000100分泵附件润滑剂AMV51800JA050518厌氧型平面密封剂(50ML)-变速器壳体8A0501641A后轮油封8899075AXWFY导向块修理包8803072-KNFY护罩-副司机安全带锁扣(浅色)8803071-KNFY前保护板-电动副司机(浅色)8803070-KNFY护罩-电动副司机调角器(浅色)8803062-KNFY护罩-主司机安全带锁扣(浅色)8803061-KNFY前保护板-电动主司机(浅色)8803060-KNFY护罩-电动主司机调角器(浅色)8404612AKNFY右后挡泥板8404612-KNFY右后挡泥板8404611AKNFY左后挡泥板8404611-KNFY左后挡泥板8404609-JA胀环-油箱加油口8404606-JA密封圈-油箱加油口盖8404577-JA铰链轴-油箱加油口8404550-JC油箱加油口盖总成8404527-JA左护板总成-后翼子板8404526-JA右护板总成-后翼子板8404501-JA防护板-挡泥板8404488-JZ下装饰条-右后翼子板(CA7242E6L,加长316)8404487-JZ下装饰条-左后翼子板(CA7242E6L,加长316)8404460-JC右流水槽总成8404455-JC左流水槽总成8404410-LZ右后翼子板保护条8404405-LZ左后翼子板保护条8404402-JC右加强板-后翼子板8404401-JC左加强板-后翼子板8404352-JC右后翼子板8404351TKN左后翼子板8404351-JC左后翼子板8403612AKNFY右前挡泥板8403612-KNFY右前挡泥板8403611AKNFY左前挡泥板8403611-KNFY左前挡泥板。
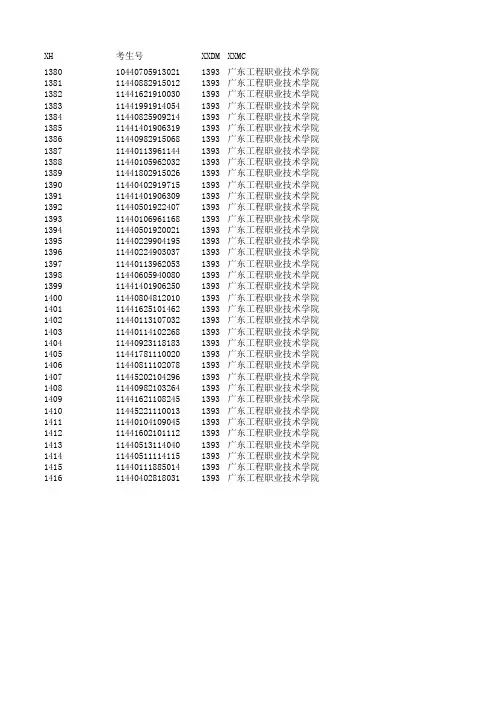
XH考生号XXDM XXMC 13801044070591302113930广东工程职业技术学院13811144088291501213930广东工程职业技术学院13821144162191003013930广东工程职业技术学院13831144199191405413930广东工程职业技术学院13841144082590921413930广东工程职业技术学院13851144140190631913930广东工程职业技术学院13861144098291506813930广东工程职业技术学院13871144011396114413930广东工程职业技术学院13881144010596203213930广东工程职业技术学院13891144180291502613930广东工程职业技术学院13901144040291971513930广东工程职业技术学院13911144140190630913930广东工程职业技术学院13921144050192240713930广东工程职业技术学院13931144010696116813930广东工程职业技术学院13941144050192002113930广东工程职业技术学院13951144022990419513930广东工程职业技术学院13961144022490303713930广东工程职业技术学院13971144011396205313930广东工程职业技术学院13981144060594008013930广东工程职业技术学院13991144140190625013930广东工程职业技术学院14001144080481201013930广东工程职业技术学院14011144162510146213930广东工程职业技术学院14021144011310703213930广东工程职业技术学院14031144011410226813930广东工程职业技术学院14041144092311818313930广东工程职业技术学院14051144178111002013930广东工程职业技术学院14061144081110207813930广东工程职业技术学院14071144520210429613930广东工程职业技术学院14081144098210326413930广东工程职业技术学院14091144162110824513930广东工程职业技术学院14101144522111001313930广东工程职业技术学院14111144010410904513930广东工程职业技术学院14121144160210111213930广东工程职业技术学院14131144051311404013930广东工程职业技术学院14141144051111411513930广东工程职业技术学院14151144011188501413930广东工程职业技术学院14161144040281803113930广东工程职业技术学院XXSZD。
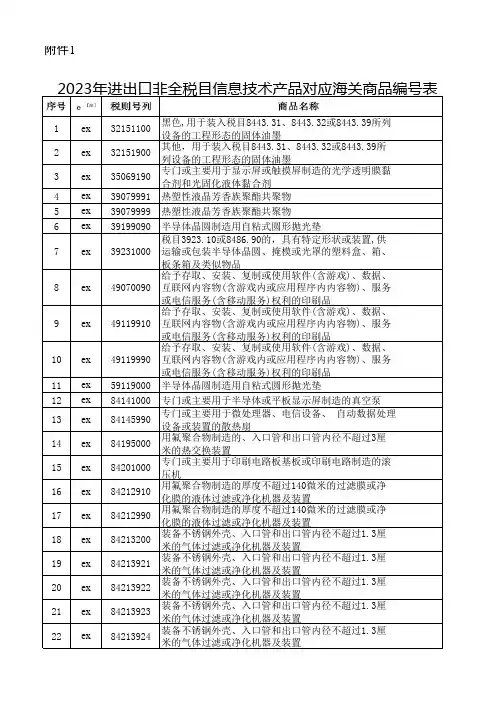
1ex32151100黑色,用于装入税目8443.31、8443.32或8443.39所列设备的工程形态的固体油墨2ex32151900其他,用于装入税目8443.31、8443.32或8443.39所列设备的工程形态的固体油墨3ex35069190专门或主要用于显示屏或触摸屏制造的光学透明膜黏合剂和光固化液体黏合剂4ex39079991热塑性液晶芳香族聚酯共聚物5ex39079999热塑性液晶芳香族聚酯共聚物6ex39199090半导体晶圆制造用自粘式圆形抛光垫7ex39231000税目3923.10或8486.90的,具有特定形状或装置,供运输或包装半导体晶圆、掩模或光罩的塑料盒、箱、板条箱及类似物品8ex49070090给予存取、安装、复制或使用软件(含游戏)、数据、互联网内容物(含游戏内或应用程序内内容物)、服务或电信服务(含移动服务)权利的印刷品9ex49119910给予存取、安装、复制或使用软件(含游戏)、数据、互联网内容物(含游戏内或应用程序内内容物)、服务或电信服务(含移动服务)权利的印刷品10ex49119990给予存取、安装、复制或使用软件(含游戏)、数据、互联网内容物(含游戏内或应用程序内内容物)、服务或电信服务(含移动服务)权利的印刷品11ex59119000半导体晶圆制造用自粘式圆形抛光垫12ex84141000专门或主要用于半导体或平板显示屏制造的真空泵13ex84145990专门或主要用于微处理器、电信设备、 自动数据处理设备或装置的散热扇14ex84195000用氟聚合物制造的、入口管和出口管内径不超过3厘米的热交换装置15ex84201000专门或主要用于印刷电路板基板或印刷电路制造的滚压机16ex84212910用氟聚合物制造的厚度不超过140微米的过滤膜或净化膜的液体过滤或净化机器及装置17ex84212990用氟聚合物制造的厚度不超过140微米的过滤膜或净化膜的液体过滤或净化机器及装置18ex84213200装备不锈钢外壳、入口管和出口管内径不超过1.3厘米的气体过滤或净化机器及装置19ex84213921装备不锈钢外壳、入口管和出口管内径不超过1.3厘米的气体过滤或净化机器及装置20ex84213922装备不锈钢外壳、入口管和出口管内径不超过1.3厘米的气体过滤或净化机器及装置21ex84213923装备不锈钢外壳、入口管和出口管内径不超过1.3厘米的气体过滤或净化机器及装置22ex84213924装备不锈钢外壳、入口管和出口管内径不超过1.3厘米的气体过滤或净化机器及装置附件12023年进出口非全税目信息技术产品对应海关商品编号表第 3 页 , 共 3 页编号表3215110010321519001035069190203907999110390799991039199090103923100010490700901049119910104911999010591190001084141000608414599060841950006084201000208421291010842129901084213200208421392110842139221084213923108421392410。
五十铃发动机件正厂编号查询9-83151432-0 水温感应器ZX330 6HK19-82513928-6 预热塞EX200 6BD19-82513928-1 预热塞EX100 4BD19-82513928-0 预热塞SH100 4BD19-81351205-0 供油泵顶杯EX400-5 6RB19-19161017-0 打汽泵活塞STD LS5800 6RB1 9-19161011-0 打气泵活塞STD EX 6BD1T9-18370128-0 节温器EX200 6BD1T9-15339051-0 喷油嘴密封垫EX300 6SD1T 9-13716056-1 节温器座EX400-5 6RB19-13716056-0 节温器座EX400-5 6RB19-13660067-0 风扇叶LS280 6BD1T9-13642078-0 风扇皮带轮座NHR 4JA19-13620016-0 水泵水封EX200 6BD1T9-13262009-0 机油压力开关EX300-3 6SD1T 9-13212804-0 柴油格底座EX200 6BD1T9-12628105-0 气门摇臂轴座(中) EX200 6BD1 9-12620031-0 气门摇臂(B) EX400-5 6RB19-12616053-0 气门调整螺丝EX400-5 6RB1 9-12616048-0 气门调整螺丝EX400-5 6RB1 9-12616042-1 气门调整螺丝ZX120 4BG19-12616042-0 气门调整螺丝EX200 6BD1 9-12613620-0 气门摇臂EX200 6BD1T9-12611448-2 气门摇臂(B) EX400-5 6RB1 9-12611448-0 气门摇臂(B) EX400-5 6RB1 9-12611446-2 气门摇臂(A) EX400-5 6RB1 9-12611446-0 气门摇臂(A) EX400-5 6RB1 9-12571113-0 气门挺杆EX200 6BD1T9-12569055-0 气门油封EX300 6SD1T9-12569037-0 气门油封EX300 6SD1T9-12563231-0 气门座EX300 6SD1T9-12561141-0 气门弹簧(大) EX400-5 6RB1 9-12531030-1 过桥齿座EX100 4BD19-12531030-0 过桥齿座EX200-5 6BG19-12531024-1 过桥齿套SK60 4JB19-12524805-0 高压泵齿SK60 4JB19-12523080-0 过桥齿SK60 4JB19-12521045-2 曲轴齿EX400-5 6RB19-12521043-0 曲轴齿EX100 4BD19-12514803-1 偏心轴EX200 6BD1T9-12514803-0 偏心轴EX200 6BD1T9-12379061-0 曲轴皮带轮套EX400-5 6RB1 9-12379045-0 曲轴皮带轮套EX200 6BD19-12378039-0 曲轴螺帽EX400-5 6RB19-12361024-2 曲轴前座圈EX400-5 6RB1 9-12361024-0 曲轴前座圈EX400-5 6RB1 9-12333607-0 飞轮齿环EX200 6BD1T9-12275608-0 连杆瓦+0.75 EX200 6BD19-12274608-0 连杆瓦+0.50 EX200 6BD19-12273608-4 连杆瓦+0.75 EX200 6BD1T 9-12273608-2 连杆瓦+0.25 EX200 6BD1T 9-12273608-0 连杆瓦+0.25 EX200 6BD19-12271608-1 连杆瓦STD EX200 6BD1T 9-12271608-0 连杆瓦STD EX200 6BD19-12211604-1 活塞肖EX200 6BD19-12211604-0 活塞肖EX200 6BD19-11751038-1 加机油口盖EX200-5 6BG1T 9-11693048-0 偏心轴瓦EX200 6BD1T9-11693035-0 偏心轴瓦EX200 6BD19-11691048-0 偏心轴瓦EX200 6BD19-11681015-0 偏心轴止推片ZX120 4BG1 9-11613035-0 偏心轴瓦SH220 6BG1T9-11611048-0 偏心轴瓦EX200 6BD19-11530606-0 曲轴瓦+0.25 EX200 6BD1T 9-11224602-1 机油泵齿芯EX200-3 6BG19-11224602-0 机油泵齿芯EX200-3 6BG1 9-09924512-0 曲轴后油封EX200-5 6BG1T 9-09924469-0 曲轴后油封EX200-5 6BG1T 9-09844190-0 偏心轴座螺母EX300 6SD1T 9-09840316-0 连杆螺帽EX400-5 6RB19-09840309-0 气门调整螺帽EX400-5 6RB1 9-09840107-1 曲轴螺母EX200 6BD19-09840107-0 曲轴螺母EX200 6BD1T9-09802629-0 曲轴座SK60 4JB19-09802606-0 曲轴螺丝SK60 4JB1。
100北京关区0100.北京关区.0101.机场货管.0102.京监管处.0103.京关展览.0104.京关保税.0105.京涉外处.0106.京关关税.0107.机场库区.200天津关区0200.天津关区.0201.天津海关.0202.新港海关.0203.津开发区.0204.东港海关.0205.津塘沽办.0206.津驻邮办.0207.津400石家庄区0400.石家庄区.0401.石家庄关0402.秦皇岛关.0403.唐山海关.0404.秦关廊办500太原海关0500.太原海关600满洲里关0600.满洲里关.0601.海拉尔关.0602.额尔古纳.0603.满十八里.0604.满赤峰办.0605.满通辽办.0606.满哈沙特.0607.满700呼特关区0700.呼特关区.0701.呼和浩特.0702.二连海关.0703.包头海关800沈阳关区0800.沈阳关区.0801.沈阳海关0802.锦州海关.0803.沈驻邮办.0804.沈驻抚顺.0805.沈开发区.0806.沈驻辽阳.0807.沈900大连海关0900.大连海关.0901.大连码头.0902.大连机场.0903.连开发区.0904.连香炉礁.0906.连保税区.0907.大连新港.0908.连1500长春关区1500.长春关区.1501.长春海关.1502.长开发区.1503.长白海关.1504.临江海关.1505.图们海关.1506.集安海关.1507.珲1900哈尔滨区1900.哈尔滨区.1901.哈尔滨关.1902.绥关铁路.1903.黑河海关.1904.同江海关.1905.佳木斯关.1906.牡丹江关.1907.东2200上海海关2200.上海海关.2201.浦江海关.2202.吴淞海关.2203.沪机场关.2204.闵开发区.2205.沪车站办.2206.沪邮局办.2207.沪2300南京海关2300.南京海关.2301.连云港关.2302.南通海关.2303.苏州海关.2304.无锡海关.2305.张家港关.2306.常州海关.2307.镇2900杭州关区2900.杭州关区.2901.杭州海关.2903.温州海关.2904.舟山海关.2905.海门海关.2906.绍兴海关.2907.湖州海关.2908.嘉3100宁波关区3100.宁波关区.3101.宁波海关.3102.镇海海关.3103.甬开发区.3104.北仑海关.3105.甬保税区.3106.大榭海关.3107.甬3300合肥海关3300.合肥海关.3301.芜湖海关.3302.安庆海关.3303.马鞍山关.3304.黄山海关.3305.蚌埠海关.3306.铜陵海关.3307.阜3500福州海关3500.福州关区.3501.马尾海关.3502.福清海关.3503.宁德海关.3504.三明海关.3505.福保税区.3506.莆田海关.3507.福3700厦门关区3700.厦门关区.3701.厦门海关.3702.泉州海关.3703.漳州海关.3704.东山海关.3705.石狮海关.3706.龙岩海关.3710.厦4000南昌关区4000.南昌关区.4001.南昌海关.4002.九江海关.4003.赣州海关.4004.景德镇关.4005.吉安海关4200青岛海关4200.青岛海关.4201.烟台海关.4202.日照海关.4203.龙口海关.4204.威海海关.4205.济南海关.4206.维坊海关.4207.淄4600郑州关区4600.郑州关区.4601.郑州海关.4602.洛阳海关.4603.南阳海关.4604.郑州机办.4605.郑州邮办4700武汉海关4700.武汉海关.4701.宜昌海关.4702.荆州海关.4703.襄樊海关.4704.黄石海关.4705.武汉沌口.4706.宜三峡办.4710.武4900长沙关口 4900.长沙关区.4901.衡阳海关.4902.岳阳海关.4903.衡关郴办.4904.常德海关.4905.长沙海关5100广州海关5100.广州海关.5101.广州新风.5102.新风罗冲.5103.清远海关.5104.清远英德.5105.新风白云.5107.肇庆封开.5108.肇5200黄埔关区5200.黄埔关区.5201.埔老港办.5202.埔新港办.5203.新塘海关.5204.东莞海关.5205.太平海关.5206.惠州海关.5207.凤5300深圳海关5300.深圳海关.5301.皇岗海关.5302.罗湖海关.5303.沙头角关.5304.蛇口海关.5305.上步业务.5306.笋岗海关.5307.南5700拱北关区5700.拱北关区.5710.拱关闸办.5720.中山海关.5721.中山港. 5724.中石岐办.5725.坦洲货场.5727.中小揽办.5730.拱6000汕关海关6000.汕头海关.6001.汕关货一.6002.汕关货二.6003.汕关行邮.6004.汕关机场.6005.汕关征统.6006.汕关保税.6007.汕6400海口关区6400.海口关区.6401.海口海关.6402.三亚海关.6403.八所海关.6404.洋浦海关.6405.海保税区.6406.清澜海关6700湛江关区6700.湛江关区.6701.湛江海关.6702.茂名海关.6703.徐闻海关.6704.湛江南油.6705.湛江水东.6706.湛江吴川.6707.湛6800江门关区6800.江门关区.6810.江门海关.6811.江门高沙.6812.江门外海.6813.江门旅检.6817.江门保税.6820.新会海关.6821.新7200南宁海关7200.南宁关区.7201.南宁海关.7202.北海海关.7203.梧州海关.7204.桂林海关.7205.柳州海关.7206.防城海关.7207.东7900成都关区7900.成都关区.7901.成都海关.7902.成关机办.7903.乐山海关.7904.攀枝花关.7905.绵阳海关.7906.成关邮办.7907.成8000重庆关区8000.重庆海关.8010.重庆东站.8020.重庆机办.8030.重庆邮办.8050.南坪开发.8060.万县海关8300贵阳海关 8300.贵阳海关.8301.贵阳总关.8600昆明关区8600.昆明关区.8601.昆明海关.8602.畹町海关.8603.瑞丽海关.8604.章凤海关.8605.盈江海关.8606.孟连海关.8607.南8800拉萨海关8800.拉萨海关.8801.聂拉木关.8802.日喀则关.8803.狮泉河关9000西安关区 9000.西安关区.9001.西安海关.9002.咸阳机场.9003.宝鸡海关9400乌关区9400.乌关区. 9401.乌鲁木齐.9402.霍尔果斯.9403.吐尔朵特.9404.阿拉山口.9405.塔城海关.9406.伊宁海关.9407.吉木9500兰州关区9500.兰州关区.9501.兰州海关.9502.青监管组.9600.银川海关.9700.西宁关区京关关税.0107.机场库区.0109.机场旅检.0110.平谷海关.0111.京五里店.0112.京邮办处.0113.京中关村.0114.京国际局.0115.京东郊站.011沽办.0206.津驻邮办.0207.津机场办.0208.津保税区.0209.蓟县海关.0210.武清海关.辽办.0606.满哈沙特.0607.满室韦.0608.满互贸区.0609.满铁路区.0806.沈驻辽阳.0807.沈机场办.0808.沈集装箱.0809.沈阳东站税区.0907.大连新港.0908.连大窑湾.0930.丹东海关.0940.营口海关.0950.鲅鱼圈关.0960.大东港关.0980.鞍山海关.海关.1506.集安海关.1507.珲春海关.1508.吉林海关.1509.延吉海关.斯关.1906.牡丹江关.1907.东宁海关.1908.逊克海关.1909.齐齐哈尔.1910.哈大庆办.1911.密山海关.1912.虎林海关.1913.富锦海关.1914.抚远站办.2206.沪邮局办.2207.沪稽查处.2208.宝山海关.2209.龙吴海关.2210.浦东海关.2211.卢湾监管.2212.奉贤海关.2213.莘庄海关.2214.漕河港关.2306.常州海关.2307.镇江海关.2308.新生圩关.2309.盐城海关.2310.扬州海关.2311.徐州海关.2312.江阴海关.2313.张保税区.2314.苏工海关.2907.湖州海关.2908.嘉兴海关.2909.杭经开关.2910.杭关机办.2911.杭关邮办.2912.杭关萧办.2920.金华海关.2931.温关邮办.2932.温经税区.3106.大榭海关.3107.甬驻余办.3108.甬驻慈办.3109.甬机场办海关.3306.铜陵海关.3307.阜阳海关 税区.3506.莆田海关.3507.福关机办.3508.福榕通办.3509.福关邮办.3510.南平海关.3511.武夷山关.3513.福保税处.3518.福监管处.3519.福关海关.3706.龙岩海关.3710.厦特区处.3711.厦东渡办.3712.厦杏林办.3713.厦行邮处.3714.象屿保税.3715.厦机场办.3716.厦同安办.3720.泉州海关.4206.维坊海关.4207.淄博海关.4208.青开发区.4209.石岛海关.4210.青保税区.4211.济宁海关.4212.泰安海关.4213.临沂海关.4214.青前沌口.4706.宜三峡办.4710.武关货管.4711.武关江岸.4712.武关机场.4713.武关邮办 白云.5107.肇庆封开.5108.肇庆德庆.5109.新风窖心.5110.南海海关.5111.南海官窑.5112.南海九江.5113.南海北村.5114.南海平洲.5115.南海海关.5206.惠州海关.5207.凤岗海关.5208.埔开发区.5209.埔保税区.5210.埔红海办.5211.河源海关.5212.新沙海关.5213.埔长安办.5214.常平业务.5306.笋岗海关.5307.南头海关.5308.沙湾海关.5309.布吉海关.5310.惠州港关.5311.深关车站.5312.深监管处.5313.深调查局.5314.深关货场.5727.中小揽办.5730.拱香洲办.5740.湾仔海关.5750.九洲海关.5760.拱白石办.5770.斗门海关.5771.斗井岸办.5772.斗平沙办.5780.高栏征统.6006.汕关保税.6007.汕关业务.6008.汕保税区.6009.汕关邮包.6011.榕城海关.6012.汕关普宁.6013.外砂海关.6014.广澳海关.6015.南澳税区.6406.清澜海关水东.6706.湛江吴川.6707.湛江廉江.6708.湛江高州.6709.湛江信宜.6710.东海岛组保税.6820.新会海关.6821.新今古洲.6822.新西河口.6823.新会车场.6824.新会旅检.6827.新会稽查.6830.台山海关.6831.台公益港.6832.台烽海关.7206.防城海关.7207.东兴海关.7208.凭祥海关.7209.贵港海关.7210.水口海关.7211.南靖西办.7212.钦州海关.7213.桂林机办海关.7906.成关邮办.7907.成都自贡海关.8606.孟连海关.8607.南伞海关.8608.孟定海关.8609.打洛海关.8610.腾冲海关.8611.沧源海关.8612.勐腊海关.8613.河口海关.8614.金水关.9406.伊宁海关.9407.吉木乃办.9408.喀什海关.9409.红其拉甫.9411.塔克什肯.9412.乌拉斯太.9413.老爷庙. 9414.红山嘴国际局.0115.京东郊站.0116.机场货二.0117.京开发区.0118.十八里店.0119.旅检征税..1913.富锦海关.1914.抚远海关.1915.漠河海关.1916.萝北海关.1917.嘉荫海关.1918.饶河海关.1919.哈内陆港.1922.哈关邮办.1923.哈关车办.2213.莘庄海关.2214.漕河泾发.2215.虹桥开发.2216.沪金山办.2217.嘉定海关.2218.外高桥关.2219.杨浦监管.2220.金山海关.2221.松江海关.2313.张保税区.2314.苏工业区.2315.淮阴海关.2321.常溧阳办.2322.镇丹阳办.2324.苏常熟办.2325.苏昆山办.2326.苏吴江办.2327.苏太仓办.2931.温关邮办.2932.温经开关.2933.温关机办.2934.温关鳌办.2981.嘉关乍办 .3518.福监管处.3519.福关马港.3716.厦同安办.3720.泉州货征.3721.泉紫帽山.3730.漳州货征.3731.漳州角美.3732.漳州石码.3740.东山货征.3741.漳浦办. 3742.诏安监管.4213.临沂海关.4214.青前湾港.4215.青菏泽办.4216.东营海关.4217.青枣庄办.4218.青岛大港.4219.蓬莱海关.4220.青机场关.4221.烟机场办.5114.南海平洲.5115.南海盐步.5116.南海业务.5117.南海车场.5118.平洲旅检.5119.南海三山.5120.广州内港.5121.内港芳村.5122.内港洲嘴.5213.埔长安办.5214.常平办事处.5313.深调查局.5314.深关邮办.5315.惠东办. 5316.大鹏海关.5317.深关机场.5318.梅林海关.5319.同乐海关.5320.文锦渡关.5321.福保税关.5772.斗平沙办.5780.高栏海关.5790.拱监管处.5792.拱保税区.5793.万山海关.6014.广澳海关.6015.南澳海关.6021.潮州海关.6022.饶平海关.6028.潮阳海关.6031.汕尾海关.6032.汕关海城.6033.汕关陆丰.6041.梅州海关.6831.台公益港.6832.台烽火角.6833.台山旅检.6837.台山稽查.6840.三埠海关.6841.三埠码头.6842.三埠水口.6843.三埠旅检.6847.三埠稽查.7213.桂林机办.8613.河口海关.8614.金水河关.8615.天保海关.8616.田蓬海关.8617.大理海关.8618.芒市监管.8619.保山监管.8620.昆明机场.8621.昆明邮办22.哈关邮办.1923.哈关车办.1925.绥关公路.20.金山海关.2221.松江海关.2222.青浦海关.2223.南汇海关.2224.崇明海关.2225.外港海关.2226.贸易网点.2227.普陀区站.2228.长宁区站.2 26.苏吴江办.2327.苏太仓办.2328.苏吴县办.2329.通启东办.2330.扬泰兴办.2331.锡宜兴办.2332.锡锡山办 41.漳浦办. 3742.诏安监管.3750.石狮货征.3760.龙岩业务20.青机场关.4221.烟机场办.4222.莱州海关.4223.青邮局办.4224.龙长岛办.4225.威开发区.4231.烟开发区.4232.日岚山办.4233.济机场办.421.内港芳村.5122.内港洲嘴.5123.内港四仓.5124.内石榴岗.5125.从化海关.5126.内港赤航.5127.内大干围.5130.广州石牌.5131.花都海关.5 20.文锦渡关.5321.福保税关.5322.沙保税关.5323.深审单处.5324.深审价办.5325.深综合处.5326.深数统处.5327.深监控处.5328.深规范处.5 33.汕关陆丰.6041.梅州海关.6042.梅州兴宁43.三埠旅检.6847.三埠稽查.6850.恩平海关.6851.恩平车场.6852.恩平港. 6857.恩平稽查.6860.鹤山海关.6861.鹤山车场.6862.鹤山码头.6 20.昆明机场.8621.昆明邮办普陀区站.2228.长宁区站.2229.航交办.2230.徐汇区站.2232.船监管处 日岚山办.4233.济机场办.4234.济洛口办.4235.济邮局办.4240.青保税处.广州石牌.5131.花都海关.5132.花都码头.5134.穗保税处.5135.穗稽查处.5136.穗统计处.5137.穗价格处.5138.穗调查局.5139.穗监管处.514深监控处.5328.深规范处.5329.深保税处.5330.盐保税关.5331.三门岛办鹤山车场.6862.鹤山码头.6863.鹤山旅检.6867.鹤山稽查.6870.阳江海关.6871.阳江码头.6872.阳江车场.6873.阳江港.6874.阳江东平.6875.阳调查局.5139.穗监管处.5140.穗关税处.5141.广州机场.5142.民航快件.5143.广州车站.5144.穗州头咀.5145.广州邮办.5146.穗交易会.5147.穗江港.6874.阳江东平.6875.阳江闸坡.6876.阳江溪头.6877.阳江稽查.6878.阳江沙扒办.5146.穗交易会.5147.穗邮办监.5148.穗大郎站.5149.大铲海关.5150.顺德海关.5151.顺德码头.5152.顺德食出.5153.顺德车场.5154.北窖5153.顺德车场.5154.北窖车场.5155.顺德旅检.5156.顺德乐从.5157.顺德陈村.5158.顺德勒流.5159.北窖码头.5160.番禺海关.5161.沙湾车场60.番禺海关.5161.沙湾车场.5162.番禺旅检.5163.番禺货柜.5164.番禺船舶.5165.南沙旅检.5166.南沙货柜.5167.南沙货港.5170.肇庆海关.5南沙货港.5170.肇庆海关.5171.肇庆高要.5172.肇庆车场.5173.肇庆保税.5174.肇庆旅检.5175.肇庆码头.5176.肇庆四会.5177.肇庆三榕.5178庆四会.5177.肇庆三榕.5178.云浮海关.5179.罗定海关.5180.佛山海关.5181.高明海关.5182.佛山澜石.5183.三水码头.5184.佛山窖口.5185.佛头.5184.佛山窖口.5185.佛山石湾.5186.佛山保税.5187.佛山车场.5188.佛山火车.5189.佛山新港.5190.韶关海关.5191.韶关乐昌.5192.三水海5191.韶关乐昌.5192.三水海关.5193.三水车场.5195.审单中心.5199.穗技术处。
HOGgles:Visualizing Object Detection Features∗Carl V ondrick,Aditya Khosla,Tomasz Malisiewicz,Antonio Torralba Massachusetts Institute of Technology {vondrick,khosla,tomasz,torralba}@AbstractWe introduce algorithms to visualize feature spaces used by object detectors.The tools in this paper allow a human to put on‘HOG goggles’and perceive the visual world as a HOG based object detector sees it.We found that these visualizations allow us to analyze object detection systems in new ways and gain new insight into the detector’s fail-ures.For example,when we visualize the features for high scoring false alarms,we discovered that,although they are clearly wrong in image space,they do look deceptively sim-ilar to true positives in feature space.This result suggests that many of these false alarms are caused by our choice of feature space,and indicates that creating a better learning algorithm or building bigger datasets is unlikely to correct these errors.By visualizing feature spaces,we can gain a more intuitive understanding of our detection systems. 1.IntroductionFigure1shows a high scoring detection from an ob-ject detector with HOG features and a linear SVM classifier trained on PASCAL.Despite ourfield’s incredible progress in object recognition over the last decade,why do our de-tectors still think that sea water looks like a car?Unfortunately,computer vision researchers are often un-able to explain the failures of object detection systems. Some researchers blame the features,others the training set, and even more the learning algorithm.Yet,if we wish to build the next generation of object detectors,it seems cru-cial to understand the failures of our current detectors.In this paper,we introduce a tool to explain some of the failures of object detection systems.1We present algorithms to visualize the feature spaces of object detectors.Since features are too high dimensional for humans to directly in-spect,our visualization algorithms work by inverting fea-tures back to natural images.We found that these inversions provide an intuitive and accurate visualization of the feature spaces used by object detectors.∗Previously:Inverting and Visualizing Features for Object Detection 1Code is available online at/vondrick/ihog Figure1:An image from PASCAL and a high scoring car detection from DPM[8].Why did the detectorfail? Figure2:We show the crop for the false car detection from Figure1.On the right,we show our visualization of the HOG features for the same patch.Our visualization reveals that this false alarm actually looks like a car in HOG space.Figure2shows the output from our visualization on the features for the false car detection.This visualization re-veals that,while there are clearly no cars in the original image,there is a car hiding in the HOG descriptor.HOG features see a slightly different visual world than what we see,and by visualizing this space,we can gain a more intu-itive understanding of our object detectors.Figure3inverts more top detections on PASCAL for a few categories.Can you guess which are false alarms? Take a minute to study thefigure since the next sentence might ruin the surprise.Although every visualization looks like a true positive,all of these detections are actually false alarms.Consequently,even with a better learning algorithm or more data,these false alarms will likely persist.In other words,the features are to blame.The principle contribution of this paper is the presenta-tion of algorithms for visualizing features used in object de-tection.To this end,we present four algorithms to invert2013 IEEE International Conference on Computer VisionFigure 3:We visualize some high scoring detections from the deformable parts model [8]for person,chair,and car.Can you guess which are false alarms?Take a minute to study this figure,then see Figure 16for the corresponding RGBpatches.Figure 4:In this paper,we present algorithms to visualize HOG features.Our visualizations are perceptually intuitive for humans to understand.object detection features to natural images.Although we fo-cus on HOG features in this paper,our approach is general and can be applied to other features as well.We evaluate our inversions with both automatic benchmarks and a large human study,and we found our visualizations are percep-tually more accurate at representing the content of a HOG feature than existing methods;see Figure 4for a compar-ison between our visualization and HOG glyphs.We then use our visualizations to inspect the behaviors of object de-tection systems and analyze their features.Since we hope our visualizations will be useful to other researchers,our final contribution is a public feature visualization toolbox.2.Related WorkOur visualization algorithms extend an actively growing body of work in feature inversion.Torralba and Oliva,in early work,described a simple iterative procedure to re-cover images only given gist descriptors [17].Weinzaepfel et al.[22]were the first to reconstruct an image given its keypoint SIFT descriptors [13].Their approach obtains compelling reconstructions using a nearest neighbor based approach on a massive database.d’Angelo et al.[4]then de-veloped an algorithm to reconstruct images given only LBP features [2,1].Their method analytically solves for the in-verse image and does not require a dataset.While [22,4,17]do a good job at reconstructing im-ages from SIFT,LBP,and gist features,our visualization algorithms have several advantages.Firstly,while existing methods are tailored for specific features,our visualization algorithms we propose are feature independent.Since we cast feature inversion as a machine learning problem,our algorithms can be used to visualize any feature.In this pa-per,we focus on features for object detection,the most pop-ular of which is HOG.Secondly,our algorithms are fast:our best algorithm can invert features in under a second on a desktop computer,enabling interactive visualization.Fi-nally,to our knowledge,this paper is the first to invert HOG.Our visualizations enable analysis that complement a re-cent line of papers that provide tools to diagnose object recognition systems,which we briefly review here.Parikh and Zitnick [18,19]introduced a new paradigm for human debugging of object detectors,an idea that we adopt in our experiments.Hoiem et al.[10]performed a large study an-alyzing the errors that object detectors make.Divvala et al.[5]analyze part-based detectors to determine which com-ponents of object detection systems have the most impact on performance.Tatu et al.[20]explored the set of images that generate identical HOG descriptors.Liu and Wang [12]designed algorithms to highlight which image regions con-tribute the most to a classifier’s confidence.Zhu et al.[24]try to determine whether we have reached Bayes risk for HOG.The tools in this paper enable an alternative mode to analyze object detectors through visualizations.By putting on ‘HOG glasses’and visualizing the world according to the features,we are able to gain a better understanding of the failures and behaviors of our object detection systems.3.Feature Visualization AlgorithmsWe pose the feature visualization problem as one of fea-ture inversion,i.e.recovering the natural image that gen-erated a feature vector.Let x ∈R D be an image and y =φ(x )be the corresponding HOG feature descriptor.Since φ(·)is a many-to-one function,no analytic inverse exists.Hence,we seek an image x that,when we computeFigure5:We found that averaging the images of top detec-tions from an exemplar LDA detector provide one method to invert HOG features.HOG on it,closely matches the original descriptor y:φ−1(y)=argminx∈R D||φ(x)−y||22(1)Optimizing Eqn.1is challenging.Although Eqn.1is not convex,we tried gradient-descent strategies by numerically evaluating the derivative in image space with Newton’s method.Unfortunately,we observed poor results,likely be-cause HOG is both highly sensitive to noise and Eqn.1has frequent local minima.In the rest of this section,we present four algorithms for inverting HOG features.Since,to our knowledge,no al-gorithms to invert HOG have yet been developed,wefirst describe three simple baselines for HOG inversion.We then present our main inversion algorithm.3.1.Baseline A:Exemplar LDA(ELDA)Consider the top detections for the exemplar object de-tector[9,15]for a few images shown in Figure5.Although all top detections are false positives,notice that each detec-tion captures some statistics about the query.Even though the detections are wrong,if we squint,we can see parts of the original object appear in each detection.We use this simple observation to produce ourfirst in-version baseline.Suppose we wish to invert HOG feature y. Wefirst train an exemplar LDA detector[9]for this query, w=Σ−1(y−μ).We score w against every sliding window on a large database.The HOG inverse is then the average ofthe top K detections in RGB space:φ−1A (y)=1KKi=1z iwhere z i is an image of a top detection.This method,although simple,produces surprisingly ac-curate reconstructions,even when the database does not contain the category of the HOG template.However,it is computationally expensive since it requires running an ob-ject detector across a large database.We also point out that a similar nearest neighbor method is used in brain research to visualize what a person might be seeing[16].3.2.Baseline B:Ridge RegressionWe present a fast,parametric inversion baseline based off ridge regression.Let X∈R D be a random variable representing a gray scale image and Y∈R d be a random variable of its corresponding HOG point.We define these random variables to be normally distributed on a D+d-variate Gaussian P(X,Y)∼N(μ,Σ)with parameters μ=[μXμY]andΣ=ΣXXΣXYΣT XYΣY Y.In order to invert a HOG feature y,we calculate the most likely image from the conditional Gaussian distribution P(X|Y=y):φ−1B(y)=argmaxx∈R DP(X=x|Y=y)(2)It is well known that Gaussians have a closed form condi-tional mode:φ−1B(y)=ΣXYΣ−1Y Y(y−μY)+μX(3)Under this inversion algorithm,any HOG point can be in-verted by a single matrix multiplication,allowing for inver-sion in under a second.We estimateμandΣon a large database.In practice,Σis not positive definite;we add a small uniform prior(i.e.,ˆΣ=Σ+λI)soΣcan be inverted.Since we wish to in-vert any HOG point,we assume that P(X,Y)is stationary [9],allowing us to efficiently learn the covariance across massive datasets.We invert an arbitrary dimensional HOG point by marginalizing out unused dimensions.We found that ridge regression yields blurred inversions. Intuitively,since HOG is invariant to shifts up to its bin size, there are many images that map to the same HOG point. Ridge regression is reporting the statistically most likely image,which is the average over all shifts.This causes ridge regression to only recover the low frequencies of the original image.3.3.Baseline C:Direct OptimizationWe now provide a baseline that attempts tofind im-ages that,when we compute HOG on it,sufficiently match the original descriptor.In order to do this efficiently,we only consider images that span a natural image basis.Let U∈R D×K be the natural image basis.We found using the first K eigenvectors ofΣXX∈R D×D worked well for this basis.Any image x∈R D can be encoded by coefficients ρ∈R K in this basis:x=Uρ.We wish to minimize:φ−1C(y)=Uρ∗whereρ∗=argminρ∈R K||φ(Uρ)−y||22(4)Empirically we found success optimizing Eqn.4using coor-dinate descent onρwith random restarts.We use an over-complete basis corresponding to sparse Gabor-likefilters for U.We compute the eigenvectors ofΣXX across dif-ferent scales and translate smaller eigenvectors to form U.3.4.Algorithm D:Paired Dictionary LearningIn this section,we present our main inversion algorithm. Let x∈R D be an image and y∈R d be its HOG descriptor.Figure 6:Inverting HOG using paired dictionary learning.We first project the HOG vector on to a HOG basis.By jointly learning a coupled basis of HOG features and natural images,we then transfer the coefficients to the image basis to recover the naturalimage.Figure 7:Some pairs of dictionaries for U and V .The left of every pair is the gray scale dictionary element and the right is the positive components elements in the HOG dic-tionary.Notice the correlation between dictionaries.Suppose we write x and y in terms of bases U ∈R D ×K and V ∈R d ×K respectively,but with shared coefficients α∈R K :x =Uαand y =V α(5)The key observation is that inversion can be obtained by first projecting the HOG features y onto the HOG basis V ,then projecting αinto the natural image basis U :φ−1D (y )=Uα∗where α∗=argmin α∈R K||V α−y ||22s.t.||α||1≤λ(6)See Figure 6for a graphical representation of the paired dic-tionaries.Since efficient solvers for Eqn.6exist [14,11],we can invert features in under two seconds on a 4core CPU.Paired dictionaries require finding appropriate bases U and V such that Eqn.5holds.To do this,we solve a paired dictionary learning problem,inspired by recent super reso-lution sparse coding work [23,21]:argmin U,V,αN i =1||x i −Uαi ||22+||φ(x i )−V αi ||22 s.t.||αi ||1≤λ∀i,||U ||22≤γ1,||V ||22≤γ2(7)After a few algebraic manipulations,the above objective simplifies to a standard sparse coding and dictionarylearn-OriginalELDARidgeDirect PairDictFigure 8:We show results for all four of our inversion al-gorithms on held out image patches on similar dimensionscommon for object detection.See supplemental for more.ing problem with concatenated dictionaries,which we op-timize using SPAMS [14].Optimization typically took a few hours on medium sized problems.We estimate U and V with a dictionary size K ≈103and training samples N ≈106from a large database.See Figure 7for a visual-ization of the learned dictionary pairs.4.Evaluation of VisualizationsWe evaluate our inversion algorithms using both quali-tative and quantitative measures.We use PASCAL VOC2011[6]as our dataset and we invert patches corresponding to objects.Any algorithm that required training could only access the training set.During evaluation,only images from the validation set are examined.The database for exemplar LDA excluded the category of the patch we were inverting to reduce the potential effect of dataset biases.We show our inversions in Figure 8for a few object cat-egories.Exemplar LDA and ridge regression tend to pro-Figure 9:We show results where our paired dictionary al-gorithm is trained to recover RGB images instead of only grayscale images.The right shows the original image and the left shows theinverse.PairDict(seconds)Greedy(days)OriginalFigure 10:Although our algorithms are good at inverting HOG,they are not perfect,and struggle to reconstruct high frequency detail.See text fordetails.Originalxx =φ−1(φ(x))x =φ−1(φ(x ))Figure 11:We recursively compute HOG and invert it with a paired dictionary.While there is some information loss,our visualizations still do a good job at accurately representing HOG features.φ(·)is HOG,and φ−1(·)is the inverse.duce blurred visualizations.Direct optimization recovers high frequency details at the expense of extra noise.Paired dictionary learning tends to produce the best visualization for HOG descriptors.By learning a dictionary over the vi-sual world and the correlation between HOG and natural images,paired dictionary learning recovered high frequen-cies without introducing significant noise.We discovered that the paired dictionary is able to re-cover color from HOG descriptors.Figure 9shows the re-sult of training a paired dictionary to estimate RGB images instead of grayscale images.While the paired dictionary assigns arbitrary colors to man-made objects and in-door scenes,it frequently colors natural objects correctly,such as grass or the sky,likely because those categories are strongly correlated to HOG descriptors.We focus on grayscale visu-alizations in this paper because we found those to be more intuitive for humans to understand.While our visualizations do a good job at representing HOG features,they have some limitations.Figure 10com-pares our best visualization (paired dictionary)against a greedy algorithm that draws triangles of randomrotation,40×4020×2010×105×5Figure 12:Our inversion algorithms are sensitive to the HOG template size.We show how performance degrades as the template becomes smaller.scale,position,and intensity,and only accepts the triangle if it improves the reconstruction.If we allow the greedy al-gorithm to execute for an extremely long time (a few days),the visualization better shows higher frequency detail.This reveals that there exists a visualization better than paired dictionary learning,although it may not be tractable.In a related experiment,Figure 11recursively computes HOG on the inverse and inverts it again.This recursion shows that there is some loss between iterations,although it is mi-nor and appears to discard high frequency details.More-over,Figure 12indicates that our inversions are sensitive to the dimensionality of the HOG template.Despite these lim-itations,our visualizations are,as we will now show,still perceptually intuitive for humans to understand.We quantitatively evaluate our algorithms under two benchmarks.Firstly,we use an automatic inversion metric that measures how well our inversions reconstruct original images.Secondly,we conducted a large visualization chal-lenge with human subjects on Amazon Mechanical Turk (MTurk),which is designed to determine how well people can infer high level semantics from our visualizations.4.1.Inversion BenchmarkWe consider the inversion performance of our algorithm:given a HOG feature y ,how well does our inverse φ−1(y )reconstruct the original pixels x for each algorithm?Since HOG is invariant up to a constant shift and scale,we score each inversion against the original image with normalized cross correlation.Our results are shown in Table 1.Overall,exemplar LDA does the best at pixel level reconstruction.4.2.Visualization BenchmarkWhile the inversion benchmark evaluates how well the inversions reconstruct the original image,it does not cap-ture the high level content of the inverse:is the inverse of a sheep still a sheep?To evaluate this,we conducted a study on MTurk.We sampled 2,000windows corresponding to objects in PASCAL VOC 2011.We then showed partic-ipants an inversion from one of our algorithms and asked users to classify it into one of the 20categories.Each win-dow was shown to three different ers were required to pass a training course and qualification exam before par-ticipating in order to guarantee users understood the ers could optionally select that they were not confident inCategory ELDA Ridge Direct PairDictbicycle0.4520.5770.5130.561bottle0.6970.6830.6600.671car0.6680.6770.6520.639cat0.7490.7120.6870.705chair0.6600.6210.6040.617table0.6560.6170.5820.614motorbike0.5730.6170.5490.592person0.6960.6670.6460.646Mean0.6710.6560.6200.637 Table1:We evaluate the performance of our inversion al-gorithm by comparing the inverse to the ground truth image using the mean normalized cross correlation.Higher is bet-ter;a score of1is perfect.See supplemental for full table. Category ELDA Ridge Direct PairDict Glyph Expert bicycle0.3270.1270.3620.3070.4050.438 bottle0.2690.2820.2830.4460.3120.222 car0.3970.4570.6170.5850.3590.389 cat0.2190.1780.3810.1990.1390.286 chair0.0990.2390.2230.3860.1190.167 table0.1520.0640.1620.2370.0710.125 motorbike0.2210.2320.3960.2240.2980.350 person0.4580.5460.5020.6760.3010.375 Mean0.2820.2580.3550.3830.1910.233 Table2:We evaluate visualization performance across twenty PASCAL VOC categories by asking MTurk work-ers to classify our inversions.Numbers are percent classi-fied correctly;higher is better.Chance is0.05.Glyph refers to the standard black-and-white HOG diagram popularized by[3].Paired dictionary learning provides the best visu-alizations for humans.Expert refers to MIT PhD students in computer vision performing the same visualization chal-lenge with HOG glyphs.See supplemental for full table. their answer.We also compared our algorithms against the standard black-and-white HOG glyph popularized by[3].Our results in Table2show that paired dictionary learn-ing and direct optimization provide the best visualization of HOG descriptors for humans.Ridge regression and ex-emplar LDA performs better than the glyph,but they suf-fer from blurred inversions.Human performance on the HOG glyph isgenerally poor,and participantswere eventhe slowest at completing that study.Interestingly,the glyph does the best job at visualizing bicycles,likely due to their unique circular gradients.Our results overall suggest that visualizing HOG with the glyph is misleading,and richer visualizations from our paired dictionary are useful for in-terpreting HOG vectors.Our experiments suggest that humans can predict the performance of object detectors by only looking at HOG visualizations.Human accuracy on inversions and state-of-the-art object detection AP scores from[7]are correlated(a)Human Vision(b)HOG VisionFigure13:HOG inversion reveals the world that object de-tectors see.The left shows a man standing in a dark room. If we compute HOG on this image and invert it,the previ-ously dark scene behind the man emerges.Notice the wall structure,the lamp post,and the chair in the bottom right hand corner.with a Spearman’s rank correlation coefficient of0.77.We also asked computer vision PhD students at MIT to classify HOG glyphs in order to compare MTurk workers with experts in HOG.Our results are summarized in the last column of Table2.HOG experts performed slightly better than non-experts on the glyph challenge,but experts on glyphs did not beat non-experts on other visualizations. This result suggests that our algorithms produce more intu-itive visualizations even for object detection researchers. 5.Understanding Object DetectorsWe have so far presented four algorithms to visualize ob-ject detection features.We evaluated the visualizations with a large human study,and we found that paired dictionary learning provides the most intuitive visualization of HOG features.In this section,we will use this visualization to inspect the behavior of object detection systems.5.1.HOG GogglesOur visualizations reveal that the world that features see is slightly different from the world that the human eye per-ceives.Figure13a shows a normal photograph of a man standing in a dark room,but Figure13b shows how HOG features see the same man.Since HOG is invariant to illu-mination changes and amplifies gradients,the background of the scene,normally invisible to the human eye,material-izes in our visualization.In order to understand how this clutter affects object de-tection,we visualized the features of some of the top false alarms from the Felzenszwalb et al.object detection sys-tem[8]when applied to the PASCAL VOC2007test set.Figure3shows our visualizations of the features of the top false alarms.Notice how the false alarms look very simi-lar to true positives.While there are many different types of detector errors,this result suggests that these particular failures are due to limitations of HOG,and consequently, even if we develop better learning algorithms or use larger datasets,these will false alarms will likely persist.Figure16shows the corresponding RGB image patches for the false positives discussed above.Notice how when we view these detections in image space,all of the false alarms are difficult to explain.Why do chair detectorsfire on buses,or people detectors on cherries?By visualizing the detections in feature space,we discovered that the learn-ing algorithm made reasonable failures since the features are deceptively similar to true positives.5.2.Human+HOG DetectorsAlthough HOG features are designed for machines,how well do humans see in HOG space?If we could quantify hu-man vision on the HOG feature space,we could get insights into the performance of HOG with a perfect learning algo-rithm(people).Inspired by Parikh and Zitnick’s methodol-ogy[18,19],we conducted a large human study where we had Amazon Mechanical Turk workers act as sliding win-dow HOG based object detectors.We built an online interface for humans to look at HOG visualizations of window patches at the same resolution as DPM.We instructed workers to either classify a HOG vi-sualization as a positive example or a negative example for a category.By averaging over multiple people(we used25 people per window),we obtain a real value score for a HOG patch.To build our dataset,we sampled top detections from DPM on the PASCAL VOC2007dataset for a few cate-gories.Our dataset consisted of around5,000windows per category and around20%were true positives.Figure14shows precision recall curves for the Hu-man+HOG based object detector.In most cases,human subjects classifying HOG visualizations were able to rank sliding windows with either the same accuracy or better than DPM.Humans tied DPM for recognizing cars,sug-gesting that performance may be saturated for car detection on HOG.Humans were slightly superior to DPM for chairs, although performance might be nearing saturation soon. There appears to be the most potential for improvement for detecting cats with HOG.Subjects performed slightly worst than DPM for detecting people,but we believe this is the case because humans tend to be good at fabricating people in abstract drawings.We then repeated the same experiment as above on chairs except we instructed users to classify the original RGB patch instead of the HOG visualization.As expected,hu-mans achieved near perfect accuracy at detecting chairs with RGB sliding windows.The performance gap be-RecallPrecisionRecallPrecisionRecallPrecisionRecallPrecisionFigure14:By instructing multiple human subjects to clas-sify the visualizations,we show performance results with an ideal learning algorithm(i.e.,humans)on the HOG feature space.Please see text for details.tween the Human+HOG detector and Human+RGB detec-tor demonstrates the amount of information that HOG fea-tures discard.Our experiments suggest that there is still some perfor-mance left to be squeezed out of HOG.However,DPM is likely operating very close to the performance limit of HOG.Since humans are the ideal learning agent and they still had trouble detecting objects in HOG space,HOG may be too lossy of a descriptor for high performance object de-tection.If we wish to significantly advance the state-of-the-art in recognition,we suspect focusing effort on building better features that capturefiner details as well as higher level information will lead to substantial performance im-provements in object detection.5.3.Model VisualizationWe found our algorithms are also useful for visualizing the learned models of an object detector.Figure15visu-alizes the root templates and the parts from[8]by invert-ing the positive components of the learned weights.These visualizations provide hints on which gradients the learn-ing found discriminative.Notice the detailed structure that emerges from our visualization that is not apparent in the HOG glyph.In most cases,one can recognize the category of the detector by only looking at the visualizations.6.ConclusionWe believe visualizations can be a powerful tool for understanding object detection systems and advancing re-search in computer vision.To this end,this paper presented and evaluated four algorithms to visualize object detection features.Since object detection researchers analyze HOG glyphs everyday and nearly every recent object detection。