Distribution of Net Operating Cash-Flow-at-Risk The Dynamic Panel Data Model
- 格式:pdf
- 大小:275.88 KB
- 文档页数:5
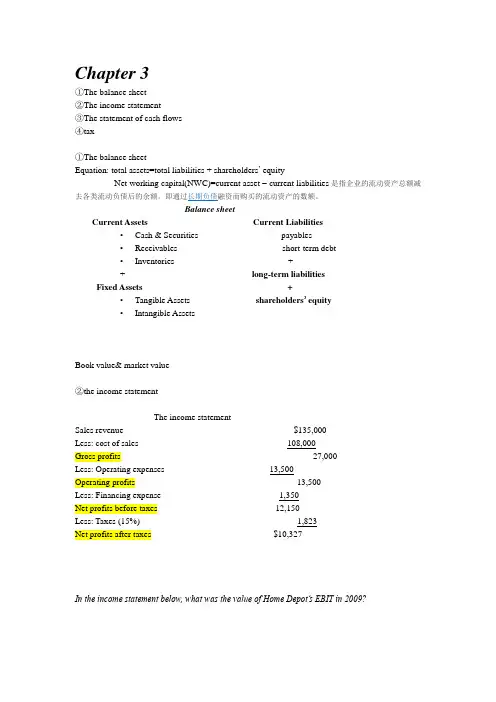
Chapter 3①The balance sheet②The income statement③The statement of cash flows④tax①The balance sheetEquation: total assets=total liabilities + shareholders’ equityNet working capital(NWC)=current asset – current liabilities是指企业的流动资产总额减Balance sheetCurrent Assets Current Liabilities•Cash & Securities payables•Receivables short-term debt•Inventories ++ long-term liabilitiesFixed Assets +•Tangible Assets shareholders’ equity•Intangible AssetsBook value& market value②the income statementThe income statementSales revenue $135,000Less: cost of sales 108,000Gross profits 27,000Less: Operating expenses 13,500Operating profits 13,500Less: Financing expense 1,350Net profits before taxes 12,150Less: Taxes (15%) 1,823Net profits after taxes $10,327In the income statement below, what was the value of Home Depot’s EBIT in 2009?EBIT = total Revenues -costs -deprecation③the statement of cash flowsExample:Net income for your firm was $10,000 last year. The depreciation expense was $2,500; accounts receivable increased $1,250; accounts payable increased $800; and inventories increased by $2,000.What was the total cash flow from operations for the period?Net income: 10,000Depreciation: 2,500Accounts Receivable: (1,250)Accounts Payable: 800Inventories: (2,000)Cash flow from operations: 10,050Free Cash FlowFree Cash Flow is cash available for distribution to investors after the firm pays for new investments or additions to working capital.Free cash flow = (EBIT – taxes + dep.) - change in net working capital- cap. expenditures④tax: 1.corporate tax2.personal tax一,marginal tax rate二,average tax rateChapter4MuaEvaBook rate of ruturnFinancial ratio (财务比率) and shareholders ’ valueThe Dupont systemprice x shares outstanding)Market value added: Market capitalization minus book value of equty.Market-to-book ratio=equityof value book equity of value market ...................Economic Value Added(EV A)Total capitalization: long-term debt + equityAfter tax operating income = after-tax interest + net incomeEVA :Show the firm’s truly created valueincome earned – income requiredBook Rates of Returnreturn on capital(ROC)资本收益率ROC=after-tax operating income/total capitalizationROC=after-tax operating income/average total capitalizationReturn on asset(ROA)资产收益率ROA=after-tax operating income/total assetsROA=after-tax operating income/average total assetsReturn on equity(ROE)股本回报率,产权回报率ROE=net income/equity因为是operating income 在上章可知operating income 是financial expenses 之前的,故还未减去interest ,故要加after-taxinterset)PPT 中关于ROA ,ROC ,ROE 的练习Financial ratios and shareholders ’ valueEconomic Value Added Operating Income* - [Cost of Capital Total Capitalization]=⨯Shareholder value depends on good investment and financing decisions.Financial Ratios help measure the success and soundness of these decisionsEfficiency RatiosAsset turnover ratio=sales/total assets at start of yearOr=sales/average total assetsReceivables turnover=sales/receivables at start of yearAverage collection period=receivables at start of year/average daily sales=365/receivable turnoverInventory turnover ratio=cost of goods sold/inventory at start of yearAverage days in inventory=inventory at start of year/daily cost of goods sold=365/inventory turnoverProfitability RatiosProfit margin(利润率)=net income/sales(IOPM)Operating profit margin=net income +after-tax interest/sales=after-tax operating income/salesLeverage Ratios杠杆率(debt and equity)Long-term debt ratio=long-term debt/long-term debt+equityLong-term debt equity ratio=long-term debt/equityMeasuring LeverageTotal debt ratio=total liability/total assetsTimes interest earned(利息保障率,利息保障倍数)=EBIT/interest payments用于衡量偿付贷款利息的能力Cash coverage ratio(现金涵盖比率)=EBIT+depreciation/interest paymentsLiquidity Ratios(短期还债能力指标/流动性指标)NWC to total assets ratio(经营运资金比)=net working capital/total assets(Net working capital=current asset – current liabilities) Current ratio(流动比率)=current assets/current liabilities(短期还债能力的一个指标)Quick ratio(速动比率)=cash + marketable securities(有价证券) + receivables/current liabilitiesCash ratio(现金比率)=cash + marketable securities/current liabilitiesThe Dupont systemROA= after-tax operating income/asset=assets sales x sales....income operating tax after -=assets turnover x operating profit margin=leverage ratio x asset turnover x operating profit margin x debt burden股息支付率 再投资率Or call sustainable growth rateChapter 5Future valuePresent valuePv of multiple cash flowsPerpetuitiesAnnutitiesFuture value of annutitiesAnnuities and annuities due EAR & APRAssets Sales Net Income Interest Net Income ROE=x x x Equity Assets Sales Net Income Interest++Dividends Payout Ratio=Earnings Earnings-Dividends Plowback Ratio=Earnings Growth in equity from plowback = Plowback Ratio ROE Earnings - Dividends Earnings Earnings Equity ⨯=⨯Earnings-Dividends = EquityInflationValuing real cash paymentsFuture valueSimple interest: FV simple =initial investment*(1+r*t)Compound interest: FV compound =initial investment*(1+r)tPresent valueDiscount rate: rDiscount factor: DF=t r )1(1+ Present value: PV=FV*t r )1(1+ PV of multiple cash flowsCt=the cash flows in year tExample: Your auto dealer gives you the choice to pay $15,500 cash now or make threepayments: $8,000 now and $4,000 at the end of the following two years. If your cost of money (discount rate) is 8%, which do you prefer?PerpetuitiesPV of perpetuity: PV=C/rExample: In order to create an endowment, which pays $185,000 per year forever, how much money must be set aside today if the rate of interest is 8%?What if the first payment won’t be received until 3 years from today?PV = 2312,500 / (1 + 0.08)3= 1,835,662.5annuities124,0001(1.08)4,0002(1.08)Initial Payment* 8,000.003,703.703,429.36Total PV $15,133.06PV of C PV of C ++=====185,000.08$2,312,500PV ==Present value of an annuity: PV=C*[r 1-t r r )1(1+] The terms within the brackets are collectively called the “annuity factor ”PV of multiple cash flowsFuture value of annuitiesExample: You plan to save $4,000 every year for 20 years and then retire. Given a 10% rate ofAnnuities due(即付年金)(与普通年金(即后付年金)的区别仅在于付款时间的不同,一个n 期的即付年金相当于一个n-1期的普通年金)(期不等于年)PV annuitydue =PV annuity (1+r) FV annuity due =FV annuity(1+r) Example: Suppose you invest $429.59 annually at the beginning of each year at 10% interest. After 50 years, how much would your investment be worth?EAR & APREffective annual interest rate: The period interest rate that is annualized using compound interest.EAR = (1 + monthly rate)12 - 1Annual Percentage Rate: The period interest rate that is annualized using simple interest APR = monthly rate × 12Example : Given a monthly rate of 1%, what is the Effective Annual Rate(EAR)? What is the Annual Percentage Rate (APR)?Inflation000,550$)10.1()000,500($)1(=⨯=+⨯=AD AD Annuity AD FV FV r FV FV %00.12)12()01.0(%68.121)01.1(12=⨯==-=APR EAR 1+nominal interest rate1+inflation rate 1real interest rate=+Valuing real cash payments♦ Example: You make a loan of $5,000 to Jane who will pay it back in 1 year. The interestrate is 8%, and the inflation rate is 5% now. What is the present value of Jane’s IOU? Show that you get the same answer when (a) discounting the nominal payment at the nominal rate and (b) discounting the real payment at the real rate.♦ (a) 5,000 / (1 + 8%) = $4630(b) 5,000 / (1.05) = $4762 (real dollar)4762 / (1.028) = $4630(2.8% is real interest rate)不能用实际利率去贴现名义现金流Chapter 6bond pricing:example: For a $1000 face value bond with a bid price of 103:05 and an asked price of 103:06, how much would an investor pay for the bond?PV=1)1(r coupon ++2)1(r coupon ++…+t r par coupon )1(++ PV bond =PV coupon +PV parvalue=coupon*(annuity factor)+ par value * (discout factor)Example: What is the value of a 3-year annuity that pays $90 each year and an additional$1,000 at the date of the final repayment? Assume a discount rate of 4%.Warning: bond rate inflation -rate interest nominal rate interest Real ≈()()6103% 103.1875% 321.031875$1,000 $1,031.875of face value ⎛⎫+= ⎪⎝⎭⨯=331(1.04)1$90$1,000.04(1.04)$1,138.75Bond PV --+=⨯+⨯+=()()1(1)where 1and (1)Bond Coupons ParValue Bond t tPV PV PV PV coupon Annuity Factor par value Discount Factor r Annuity Factor rDiscount Factor r -=+=⨯+⨯-+==+The coupon rate IS NOT the discount rate used in the Present Value calculations Example: What is the present value of a 4% coupon bond with face value $1,000 that matures in 3 years? Assume a discount rate of 5%. Bond yields Current yield : annual coupon payments divided by bond priceExample:Suppose you spend $1,150 for a $1,000 face value bond that pays a $60 annual coupon payment for 3 years. What is the bond’s current yield?Yield to maturity:PV=1)1(r coupon ++2)1(r coupon ++…+t r par coupon )1(++ Bond rates of returnRate of return 只算一年的couponYTM vs rate of returnYTM ↑ (↓)(unchange) → the price of bond ↓ (↑) (unchange) → the rate of return for that period less (greater)(equal to) than the yield to maturity.Ytm 通过改变price 去改变p1-p0 从而改变rate of return ,由rate of return 公式得,p1-p0和其成正比,ytm 与change in price 成反比,故ytm 与其成反比Chapter 7Stock marketP/E ratio(本益比): price per share divided by earnings per shareAsk price & bid priceAsk price: the price at which current shareholders are willing to sell their sharesBid price: the price at which investors are willing to buy sharesTerminologyinvestment change price +income Coupon =return of Rate investmentincome total =return of Rate1,market cap. 2.P/E ratio 3.dividend yieldExample: You are considering investing in a firm whose shares are currently selling for $50 per share with 1,000,000 shares outstanding. Expected dividends are $2/share and earnings are $6/share.What is the firm’s Market Cap? P/E Ratio? Dividend Yield?Measure of value1. book value2. liquidation value3.market valueBV= Assets - liabilitiesLV = Assets selling price – LiabilitiesMV = Tangible & intangible assets + Inv. OpportunitiesPrice and intrinsic valueVo 内在价值Example: What is the intrinsic value of a share of stock if expected dividends are $2/shareand the expected price in 1 year is $35/share? Assume a discount rate of 10%.Expected return(ER)Valuing common stocksdividend discount modelconsider three simplying cases1. no growth2. constant growth3. noconstant growth Market Capitalization $501,000,000$50,000,000$50P/E Ratio 8.33$6$2Dividend Yield .044%$50=⨯======HH H r P Div r Div r Div P )1(...)1()1(22110+++++++=1.2.Example: What should the price of a share of stock be if the firm will pay a $4 dividend in 1year that is expected to grow at a constant rate of 5%? Assume a discount rate of 10%.3.Example:A firm is expected to pay $2/share in dividends next year. Those dividends are expected to grow by 8% for the next three years and 6% thereafter. If the discount rate is 10%, what is the current price of this security?Required rates of returnExample: What rate of return should an investor expect on a share of stock with a $2 expected dividend and 8% growth rate that sells today for $60?Sustainable growth rateExample: Suppose a firm that pays out 35% of earnings as dividends and expects its return on equity to be 10%. What is the expected growth rate?Valuing growth stocksWhere: EPS= Earnings per share PVGO = Present Value of Growth OpportunitiesSuppose a stock is selling today for $55/share and there are 10,000,000 shares outstanding. If earnings are projected to be $20,000,000, how much value are investors assigning to growth per share? Assume a discount rate of 10%.Return on Equity Plowback Rate = :g ROE bearnings dividends where b earnings=⨯⨯-=.10(1.35).065 6.5%g =⨯-==Chapter 8(NPV ,EAA,IRR) 第8章( 重点复习单元):净现值及其他投资准则,会算NPV ,计算EAA (P191页),认识其他投评估指标(PP 回流期和 IRR 内含报酬率)及其判断准则(取大或取小),重点关注NPV 与IRR ,注意使用IRR 指标的前提是IRR<r (P199页)有关投资组合,要知道其大前提是资金是有约束的;单个项目的特征(可分/不可分),可分的单个项目之间的比较与排序用PI (收益指数)值来衡量,不可分的用各自的NPV 值来比较衡量,比较的前提是它们的寿命期是一样的,如果不一样的话就用最小共同寿命期法或等价年金法来比较 。
现金流量表中英文版现金流量表(非金融类)CASH FLOW STATEMENT(Travel enterprise)会外年通03表编制单位:Name of enterprise: 单位:元项目ITEMS 行次金额一、经营活动产生的现金流量:CASH FLOWS FROM OPERATING ACTIVITIES 1销售商品、提供劳务收到的现金Cash received from sale of goods or rendering of services 2收到的税费返还Refund of tax and levies 3收到的其他与经营活动有关的现金Other cash received relating to operating activities 4现金流入小计Sub-total of cash inflows 5购买商品、接受劳务支付的现金Cash paid for goods and services 6支付给职工以及为职工支付的现金Cash paid to and on behalf of employees 7支付的各项税费Payments of all types of taxes 8支付的其他与经营活动有关的现金Other cash paid relating to operating activities 9现金流出小计Sub-total of cash outflows 10经营活动产生的现金流量净额Net cash flows from operating activities 11二、投资活动产生的现金流量:CASH FLOWS FROM INVESTING ACTIVITIES 12收回投资所收到的现金Cash received from disposal of investments 13取得投资收益所收到的现金Cash received from returns on investments 14处置固定资产、无形资产和其他长期资产所收回的现金净额NetCashReceivedFromDisposalOfFixedAssets,IntangibleAssets&OtherLong-termAssets 15收到的其他与投资活动有关的现金Other cash received relating to investing activities 16现金流入小计Sub-total of cash inflows 17购建固定资产、无形资产和其他长期资产所支付的现金Cash paid to acquire fixed assets,intangible assets & other long-term assets 18投资所支付的现金Cash paid to acquire investments 19支付的其他与投资活动有关的现金Other cash payments relating to investing activities 20现金流出小计Sub-total of cash outflows 21投资活动产生的现金流量净额Net cash flows from investing activities 22三、筹资活动产生的现金流量:CASH FLOWS FROM FINANCING ACTIVITIES 23吸收投资所收到的现金Cash received from capital contribution 24借款所收到的现金Cash received from borrowings 25收到的其他与筹资活动有关的现金Other cash received relating to financing activities 26现金流入小计Sub-total of cash inflows 27偿还债务所支付的现金Cash repayments of amounts borrowed 28分配股利、利润和偿付利息所支付的现金Cash payments for interest expenses and distribution of dividends or profit 29支付的其他与筹资活动有关的现金Other cash payments relating to financing activites 30现金流出小计Sub-total of cash outflows 31筹资活动产生的现金流量净额Net cash flows from financing activities 32四、汇率变动对现金的影响EFFECT OF FOREIGN EXCHANGE RATE CHANGES ON CASH 33五、现金及现金等价物净增加额NET INCREASE/(DECREASE) IN CASH AND CASH EQUIVALENTS 34(续表)现金流量表(非金融类)CASH FLOW STATEMENT(Travel enterprise)会外年通03表编制单位:Name of enterprise: 单位:元补充资料351.将净利润调节为经营活动现金流量:Reconciliation of net profit/(loss)to cash flows from oprating activities 36净利润Net profit 37加:*少数股东权益Add:Minority interest 38减:未确认的投资损失Less:Uncertained investment loss 39加:计提的资产损失准备Add:Provision for asset impairment 40固定资产折旧Depreciation of fixed assets 41无形资产摊销Amortisation of intangible assets 42长期待摊费用摊销Amortisation of long-term prepaid expenses 43待摊费用减少(减:增加) Decrease in prepaid expenses(deduct:increase) 44预提费用增加(减:减少) Increase in prepaid expenses(deduct:decrease) 45处置固定资产、无形资产和其他长期资产的损失(减:收益) LossesOnDisposalOfFixedAssetsIntangibleAssetsAndOtherLong-termAssets'DeductGains 46固定资产报废损失Losses on disposal of fixed assets 47财务费用Financial expenses 48投资损失(减:收益) Losses arising from investments(deduct:gains) 49递延税款贷项(减:借项) Deferred tax credit(deduct: debit) 50存货的减少(减:增加) Decrease in inventories(deduct:increase) 51经营性应收项目的减少(减:增加) Decrease in operating receivables(deduct:increase) 52经营性应付项目的增加(减:减少) Increare in operating payables(deduct:decrease) 53其他Others 54经营活动产生的现金流量净额Net cash flows from operating activities 552.不涉及现金收支的投资和筹资活动:Investing and financing activities that do not involve cash receipts and payment 56债务转为资本Conversion of debt into captical 57一年内到期的可转换公司债券ReclassificationOfConvertibleBondsExpiringWithinOneYearAsCurrentLiability 58融资租入固定资产Fixed assets acquired under finance leases 59其他Other 6061623.现金及现金等价物净增加情况:Net increase/(decrease) in cash and cash equivalents 63现金的期末余额Cash at end of year 64减:现金的期初余额Less: Cash at beginning of year 65加:现金等价物的期末余额Plus:Cash equivalents at end of year 66减:现金等价物的期初余额Less:Cash equivalents at beginning of year 67现金及现金等价物净增加额Net increase/(decrease) incash and cash equivalents 68。
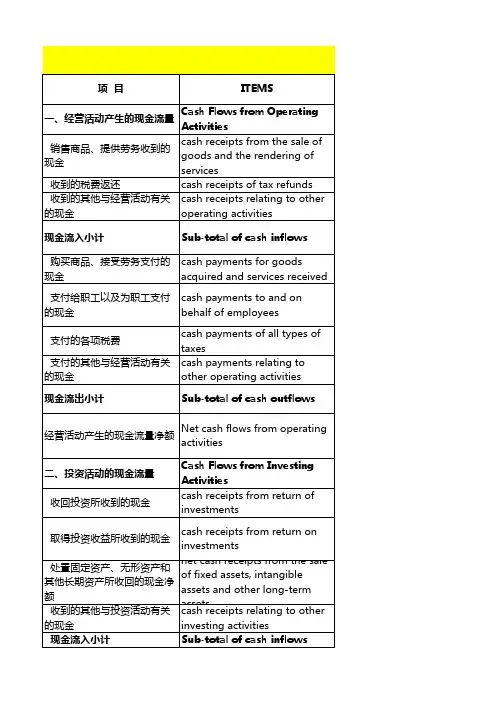
一.经营活动产生的现金流量cash flows from operating activities 销售商品,提供劳务收到的现金现金流量表cash flows statement项目items金额amountcash received from sales of goods or rendering of services收到的税费返还refund of taxes收到的其他与经营活动有关的现金other cash received relating to operating activities现金流入小计sub-total of cash inflows购买商品接受劳务支付的现金cash paid for goods and services支付给职工以及为职工支付的现金cash paid to and on behalf of employees支付的各项税费taxes paid支付的其他与经营活动有关的现金other cash paid relating to operating activities现金流出小计sub-total of cash outflows经营活动产生的现金流量净额net cash flows from operating activities二.投资活动产生的现金流量cash flows from investing activities收回投资所收到的现金cash received from return of investments取得投资收益所得到的现金cash received from income of investments处置固定资产,无形资产和其他长期资产而收到的现金净额net cash received from disposal of fixed assets,intangible assets and other long-term assets 收到的其他与投资活动有关的现金other cash received relating to investing activities现金流入小计sub-total of cash inflows购建固定资产,无形资产和其他长期资产所支付的现金cash paid to acquire fixed assets,intangible assets and other long-term assets 投资所支付的现金cash paid to acquire investments支付的其他与投资活动有关的现金other cash paid relating to investing activities现金流出小计sub-total of cash outflows投资活动产生的现金净额net cash flows from investing activities三.筹资活动产生的现金流量cash flows from finacing activities吸收投资所收到的现金proceeds from invested assets借款所收到的现金proceeds from borrowings收到的其他与筹资活动有关的现金other proceeds relating to financing activities现金流入小计sub-total of cash inflows偿还债务所支付的现金cash repayments of amounts borrowed分配股利,利润或偿付利息所支付的现金cash payments for distribution of dividends,profit or interest expenses支付的其他与筹资活动有关的现金other cash payments relating to finacing activities现金流出小计sub-total of cash outflows筹资活动产生的现金流量净额net cash flows from finacing activities四.汇率变动对现金的影响effect of foreign exchange rate changes on cash五.现金及现金等价物净增加额net increase in cash and cash equivalents补充资料supplemental information1.将净利润调节为经营活动的现金流量reconciliation of net profit to cash flows from operating activities净利润net profit加:计提的资产减值准备add:assets shrink provision固定资产折旧depreciation of fixed assets无形资产摊销amortization of intangible assets长期待摊费用摊销amortization of long term deferred expenses待摊费用的减少(减:增加)decrease in prepaid and deferred expenses(less:increase)预提费用的增加(减:减少)increase in accrued expenses(less:decrease)处置固定资产,无形资产和其他长期资产的损失(减:收益)losses on disposal of fixed assets,intanglble assets and other long-term assets(less:gains)固定资产报废损失losses on scrapping of fixed assets财务费用financial expenses投资损失(减:收益)income on investment(less:losses)递延税款贷项(减:借项)deferred tax credit(less:debit)存货的减少(减:增加)decrease in inventories(less:increase)经营性应收项目的减少(减:增加)decrease in operating receivables (less:increase)经营性应付项目的增加(减:减少)increase in operating payables(less:decrease)其他others经营活动产生的现金流量净额net cash flows from operating activities2.不涉及现金收支的投资和筹资活动investing and financing activities that do not involve in cash receipts and payments:债务转为资本liabilities to be transfer captial一年内到期的可转换公司债券matured convertible bonds within a year融资租入固定资产fixed assets under finacing leasing3.现金及现金等价物净增加情况net increase in cash and cash equivalents现金的期末余额cash at the end of the period减:现金的期初余额less:cash at the beginning of the period加:现金等价物的期末余额plus:cash equivalents at the beginning of the period 减:现金的期初余额less:cash equivalents at the beginning of the period 现金及现金等价物净增加额net increase in cash and cash equivalents。
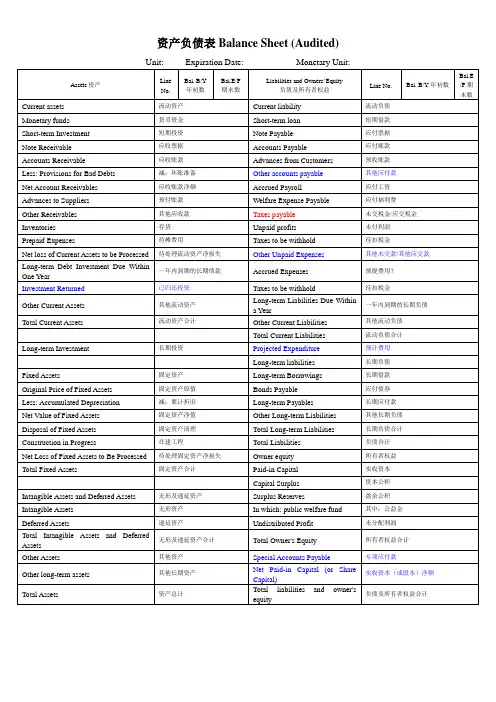
会计报表工程中英文对照(三张主表)1、Balance sheet(audited) 资产负债表Assets 资产Current assets 流动资产、Cash 货币资金Short-term investment 短期投资Notes receivable 应收票据Dividends receivable 应收股利Interest receivable 应收利息Account receivable 应收帐款Other receivable 其他应收款Advanced to suppliers 预付帐款Subsidies receivable 应收补贴款Inventories 存货Prepaid expenses 待摊费用Long-term investments maturing within one year 一年内到期的长期投资Other current assents 其他流动资产Total current assets 流动资产合计Long-term investments 长期投资Long-term equity investment 长期股权投资Long-term debt investment 长期债权投资Total long-term investment 长期投资合计Fixed assets 固定资产Fixed assets-cost 固定资产原价Less: accumulated depreciation 减:累计折旧Fixed assets net value 固定资产净值Less: impairment of fixed assets 减:固定资产减值准备Fixed asset-book value 固定资产净值Materials for projects 工程物资Construction in progress 在建工程Disposal of fixed assets 固定资产清理Total fixed assets 固定资产合计Intangible assets and other assets 无形资产及其他资产Intangible assets 无形资产Long-term deferred expenses 长期待摊费用Other long-term assets 其他长期资产Total intangible assets and other assets 无形资产及其他资产合计Deferred tax:递延税项Deferred tax debit 递延税款借项Total assets 资产总计Liabilities and owners’ equity负债及所有者权益Current liabilities : 流动负债Short-term loans 短期借款Notes payable 应付票据Account payable 应付帐款Advance from customers 预收帐款Accrued payroll 应付工资Accrued employee’s welfare expenses应付福利费Dividends payable 应付股利Taxes payable 应交税金Other taxes and expense payable 其他应交款Other payable 其他应付款Accrued expenses 预提费用Provisions 预计负债Long-term liabilities due within one year 一年内到期的长期负债Other current liabilities 其他流动负债Total current liabilities 流动负债合计Long-term liabilities:长期负债Long-term loans 长期借款Bonds payable 应付债券Long-term accounts payable 长期应付款Specific account payable 专项应付款Other long-term liabilities 其他长期负债Total long-term liabilities 长期负债合计Deferred tax: 递延税项Deferred tax credits 递延税款贷项Total other liabilities : 负债合计Owner’s equity:所有者权益〔股东权益〕Paid-in capital 实收资本Less :investment returned 减:已归还投资Pain-in capital-net 实收资本净额Capital surplus 资本公积Surplus from profits 盈余公积Including: statutory public welfare fund 其中:法定公益金Undistributed profit 未分配利润Total owner’s equity所有者权益〔股东权益〕Total liabilities and owner’s equities负债及所有者权益Total liabilities and owner’s equiti es 负债及所有者权益2、Income statement (audited) 利润表Item 工程Sales 产品销售收入Including :export sales 其中:出口产品销售收入Less: sales discounts and allowances 减:销售折扣与折让Net sales 产品销售净额Less: sales tax 减:产品销售税金Cost of sales 产品销售本钱Including :cost of export sales 出口产品销售本钱Gross profit 产品销售毛利Less : selling expense 减:销售费用General and administrative expense 管理费用Financial expense 财务费用Including :interest expense(less interest income) 其中:利息支出〔减利息收入〕Exchange loss (less exchange gain) 汇兑损失〔减汇兑收益〕Income from main operation 产品销售利润Add :income from other operations 加:其他业务利润Operating income 营业利润Add : investment income 加:投资收益Non-operating expense 营业外收入Less: non-operating expense 减:营业外支出Add: adjustment to pripr year’s income and expense加:以前年度损益调整Income before tax 利润总额Less: income tax 减:所得税Net income 净利润Statement of profit apropriation and distribution (audited) 利润分配表Item 工程Net income 净利润Add: undistributed profit at beginning of year 加:年初未分配利润Other transferred in 其他转入Profit available for distribution 可供分配的利润Less: statutory surplus from profits 减:提取法定盈余公积Statutory public welfare fund 提取法定公益金Staff and workers’ bonus and welfare fund职工奖励及福利基金Reserve fund 提取储藏基金Enterprise expansion fund 提取企业开展基金Profit capitalized on return of investments 利润归还投资Profit available for distribution to owners 可供投资者分配的利润Less: dividends payable for preferred stock 应付优先股股利V oluntary surplus from profits 提取任意盈余公积Dividends payable for common stock 应付普通股股利Dividends transferred to capital 转作股本的普通股股利Undistributed profit 未分配利润3、Cash flows statement 现金流量表工程 Item NO。
财务管理精要术语翻译对照目标现金分配水平 target cash distribution level执行期权 exercise options投入权益数 book equity税前利润 pre-tax income应用的税率 applicable tax权益回报率 ROE息税前利润 EBIT财务杠杆 financial leverage)财务风险 financial risk)经营盈亏平衡 (operating breakeven)经营杠杆 operating leverage投入成本的波动性(input cost variability)销售价格的波动性(sales price variability)需求的波动性(demand variability)投入资本的回报率(ROIC)税后的营业净利润 NOPAT市场风险(market risk)个体风险(stand-alone risk)经营风险(bussiness risk)财务风险(financial risk)1加权平均概率 probability-weighted average预期回报率 expected rate of return标准差 standard deviation方差系数 coefficient deviation自由市场 Open market实证研究 empirical test加权平均资本成本 WACC资本利得 Capital gains优先股 Preferred stock股票的要求回报率 required rate of return on stock 权益融资 equity financing权衡理论 trade-off theory税收保护 Tax shield期望成本 expected cost税盾利益 tax benefits of debt研发实验室 R&D lab机构投资组合管理者 portfolio manager步进次序 pecking order股票发行成本 Flotation cost没用的项目 pet project股利 dividend股票回购 stock repurchase杠杆收购(LBO) leverage buyout减少过剩现金流 bond the cash flow储备借款能力 reserve borrowing capacity 净现值 net present value难逢良机 windows of opportunity预测报表 pro forma statement流通比率 current ratio资产负债率 percent financed with debt无负债时的beta系数 unlevered beta coefficient基本经营风险 basic business risk资本资产定价模型(CAPM) CAPM无风险利率 risk-free rate市场风险溢价 market risk premium负债beta (leveraged beta)负债权益比率 D/S税后净经营性利润(NOPAT)最初假设权益市场价值 initial estimated marketvalue of equity资本结构调整均衡价格 equilibrium recapitalization price 最终价值resulting value债务总额 value of all debts债务数额 the amount of debt权益价值 An equity position重购入股份 repurchased stock资金预算决策 value-based management图表 table树图 figure税前扣除 tax deductible流通股数 shares of stock outstanding永久债券 perpetual bonds全部由权益融资 all equity financed变动成本 variable cost可向后递延的税收损失 Tax loss carryforwards 盈亏平衡点 break-even point边际成本 incremental cost边际收益 incremental profit标准差 standard deviation已获利息倍数比率 times-interest-earned ratio 联邦税加州税的税率federal-plus-state tax rate 店头市场 over-the-counter market赢利利息倍数(TIE)财务管理协会的会议 FMA panel session 其利息可减税 the tax deductibility of interest抵消 offset发行成本 flotation cost 步进式 pecking order 等风险类 homogeneous risk class相同预期 (homogeneous expectations) .完美资本市场 (perfect capital markets)交易成本\佣金成本 brokerage cost贴现 capitalize永续年金 perpetuity现值 present value卖空 short sale多头”投资组合“long”portfolio空头”投资组合“short” portfolio实物和金融期权 real and financial options贴现率 discount rate实际成本 effective cost有效税率 effective tax rate“自制”“homemade”扣除?贴现? Discount免收利息所得税的债券 tax-exempt bonds. High-tax-bracket individual杠杆收购 leverage buyout LBOs垃圾债券 junk bonds被收购公司 underleveraged firms经纪费用 brokerage税盾 tax shield营亏损转回 operating loss carryforwards 税款储蓄 tax savings默认价值 implied value债务权重 debt weight看涨期权 (call option)金融期权 (financial option)执行价值 (exercise value)期权定价模型 (OPM)Black-Scholes按现值计算的现金流量/已贴现现金流 discounted cash flow 票面价值, 表面价值 face value 不稳定性 volatility息票债务 coupon debt期权补偿 option-based compensation[美]预购股票价格 exercise price权衡模型 trade-off model抵税的 tax deductible概率 probability函数 function总账面 total book散点图 plot营业资产 operating assets<英>免税代码(指雇员收入免税部分的数字代码,由税务机关编定)tax code适销证券 marketable securities资产负债表 balance sheet短期国库券 treasury bill债务本金 debt principal[会计]营运资本, 营运资金 working capital减震器 shock absorber目标分配率(target distribution ratio)目标支付率 (target payout ratio)-盈利能力 earning power经验研究 empirical research边际税率 marginal tax溢价 appreciation实际成本 effective cost 融资抉择 financing choice未分配的利润 retained earnings留存收益 retained earnings再投资的收益 reinvested earnings内部权益 generated equity普通股 common stock 低常规水平加临时股利 (low-regular-dividend-plus-extras)政策常规股利 regular dividend流通股 outstanding shares公布日 (declaration date)登记日 (holder-of-record date)除权日 (Ex-dividend date)国库券 treasury权益回报率 ROE财政困难成本 financial distress cost权势等级 pecking order借款能力储备 (reserve borrowing capacity) 税损移前扣减 tax-loss carryback税损移后扣减 tax-loss carryforward资金的时间价值 time value of the money税收利益税收福利 Tax benefits有价证券 Marketable securities通用目的资产 general-purpose assets自由现金流量(FCF)。

a profit and loss statement accelerated methodsaccounts payableaccounts payable turnover ratio accounts receivableaccounts receivableaccounts receivable turnover ratios accrrual accountingaccrued expenseaccumulated depreciation accumulated retained earnings acquireaffiliateagency costagency problemagency relationshipaging scheduleallocateallocationally efficient markets amortizationannuityannuity dueanomalyappreciatearbitrage pricing theory(APT)Asian currency optionasset management ratiosasset turnover ratioauthorized sharesautonomyaverage age of accounts receivable avreage rate currency optionbad debt loss ratiobalance sheetbalance sheetbank debtbankers'acceptancebankruptcybasic earnings per shareBaumol cash management model behavioral financebeta coefficientbond indenturebonding costbook valuebottom-up approachbreak-even analysiabrokerage feebusinessbusiness riskcapital asset pricing model(CAPM) capital asset pricing model(CAPM) capital budgetcapital budgetingcapital expenditurecapital leasecapital marketcapital rationingcapital structurecapital surpluscash conversion cyclecash dividendcash dividendscash Flow Coverage Ratiocash flow from financingcash flow from investingcash flow from operationscash offercash ratiocentralize payableschairpersoncheckchief executive officer(CEO)chief financial officer(CFO) chronologicalclaimclearing time floatclosely held corporation coefficientcollateralcommercial papercommon stockcommon stockcommon stockholder or shareholder company-specific factor compensating balancecomplex capital structure compound interestcompoundingconcentration bankingconstant dividend payout ratioconstant growth model consumer creditcontingent value rights controllerconversion premiumconversion ratioconvertible bondconvertible debtconvertible debtconvertible preferred stock convertible securities corporate annual reports correlation coefficientcost of capitalcost of capitalcovariancecreative accountingcredit and collectiong policy credit cardcredit periodcredit salecredit termcreditorcross-currency pooling system cross-currency quote cumulative votingcurrency forward contract currency futures contract currency optioncurrency riskcurrency swapcurrent assetcurrent liabilitycurrent liabilitycurrent market valuecurrent ratiocurrent yielddebt holderdebt instrumentdebt management ratiosdebt ratiodebt-to-equity ratiodebt-to-total-capital decision-makingdeclaration datedefault riskdeferred annuitydeferred taxdepreciatedepreciationdesired or target capital structure diluted earnings per sharedilution of controldilution of ownershipdilutivedirect methoddirect quotationdisbursementdiscount perioddiscount ratediscount ratediscounted cash flow(DCF)discounted payback perioddiscountingdiversifiable riskdiversifydividend discount modeldividend irrelevane theorydividend payoutdividend payout ratiodividend policydividend yielddividend-payout ratiodo-it-yourself dividenddufault riskDuPont Analysis of ROEearnings before interest and taxes (EBI earnings before interest and taxes(EBIT earnings per shareearnings per shareeconomic order quantity(EOQ)efficient market hypothesis(EMH) employee stock option program(ESOP) equity multiplierEuropean Economic AreaEuropean Economic CommunityEuropean unionexchange rateexchange-rate riskex-dividend dateexecutive directorexotic optionexpansion projectexpected returnexpected utility theoryexternal financingface valueFinancial Accounting Standards Board(FA financial analystfinancial distressfinancial distressfinancial economistfinancial flexibilityfinancial leveragefinancial managementfinancial marketfinancial ratiofinancial riskfinancial riskfinancial standardsfinancial statementfinancing cash flowsfinancing mixfinancing mixfinancing mixfirst-in ,first out (FIFO)Fitch Investor Servicesfixed exchange rate systemfloatfloatationfloatation costfloating exchange rate systemFortune 500forward discountforward marketforward premiumforward rateforward tradefree cash flow hypothesisfree tradefree-riding problemfuture contractfuture value(FV)general partnerGenerally Accepted Accounting Principle general-purpose assetsgo publicgoing concernGoldman Sachsgross profit margingrowth perpetuityhedginghistorical costhoard of directorshomemade dividendshurdle ratehurdle ratehybird securityhybridincentive stock optionincome statementincremental cash flows independent auditorindependent projectindirect methodindirect quotationinformation asymmetry informationally efficient markets initial public offering(IPO)initial public offering(IPO)initial public offerings institutional investorinstitutional investorintangible fixed assetsinterest coverage ratiointerest deductioninterest rate parityinterest rate riskinternal financinginternal rate of return(IRR) Internal Revenue Service(IRS) international corporation international financial management international Monetary Fund intrinsic valueinventoryinventoryinventory processing period inventory turnover ratioinvesting cash flowsinvestment bankinvestment bankerinvestor rationlityJanuary effectjeopardizejoint venturejust-in-time(JIT)systemlast-in ,first-out (LIFO)law of one pricelearning curveleaseleaselesseelessorleverage ratioslevered firmliabilitylimited partnerlimited partnershipline of creditliquidating dividendliquidationliquidity ratiolock box systemlong-term debt to total capital ratios long-term liabilitylong-term ratiolookback currency optionlow regular plus specially designated d mail floatmanagenment buyoutmanipulatemarket conversion valuemarket imperfectionmarket riskmarket shareMarketabilitymarketable securitiesmarketable securitiesmarketable securitymarketable securitymarket-to-book value ratioMaster of AccountingMaster of Business Administration(MBA) Master of Financial Managementmaterial requirement planning (MRP)syst maturitymean-variance frontiermean-variance worldMerrill LynchMiller-orr cash management modelmix of debt and equitymoderate approachModigliani and Miller(M&M)theorem Monday effectmoney marketmoney ordermonitoring costsMoody’s and Standard & Poor’sMoody's Investors Service,Inc.(Moody's) Morgan Stanley Dean Wittermortgagemultinational corporationmutual fundmutually exclusive projectnegotiable certificates of deposit(CDs) negotiate offernet incomenet present value(NPV)net present value(NPV)net profit marginnet working capticalNew York Stock Exchange(NYSE)New York Stork Exchangenewly listed companynon-executive directornormal distributionnormality assumptionnote payableoffering priceopen marketoperating cash flowsoperating incomeoperating income(loss)operating leaseoperating leverageoperating profit marginoperating profit marginoperationally efficient markets opportunity costopportunity costoptimal capital structureoption contractoption exchangeoption-like securityordinary annuityoutstandingoutstanding sharesoverheadover-the-counter marketowner’s equityP/E ratiopartnerpartnershippatentpayback period(PP)payment datepecking order theoryperfect capital marketperpetual inventory systemperpetuitypivotalportfolio theorypost-auditpost-earnings announcement drift precautionary motivepreemptive rightpreemptive rightpreferred stockpreferred stockpreferred stockholder or shareholder present value(PV)price takerprimary marketprincipalprincipal-agent or agency relationship private corporationprivate placementprivately held corporationprivileged subscriptionpro rataprobabilityprobability distributionprobability distribution function processing floatprocrastinationprofitprofitabilityprofitability index(PI)profitability ratioproperty dividendproperty,plant,and equipment(PPE)pros and consprospect theoryprotfoliopublic offerpublicly held companypublicly traded corporations publicly traded firmpurchasing power parityput optionput pricequick ratiorandom variablerate of returnrational behaviorreal assetsreal estaterecord dateregular dividendrelaxed or conservative approach replacement projectrepurchaserepurchaserepurchase agreementrequired rate of returnreserve borrowing capacityresidual claimresidual dividend policyresidual valuerestricted or aggressive approach restrictive covenanatsretail incestorretail investorreturnreturn on asset (ROA)return on common equity (ROCE) return on total equity (ROTE) return on total equity ratio (ROE) revenueright to proxyright to transfer ownershipright to voterights offerrisk aversionSalomon Smith Barneysaturation pointscenario analysisseasoned issuesecondary marketSecurities and Exchange Commission(SEC) semi-strong formsensitivity analysissensitivity analysisseparation of ownership and control share repurchaseshareholderside effectsimple capital structuresimple interstsimulationslowing disbursementsocial goodsole proprietorshipsolvencysource of cashspecial-purpose assetsspeculative motivespin-offsspot ratespot tradestable dollar dividend policy stakeholder theorystand-alone riskStandard & Poor's Corporation(S&P) standard deviationstatement of cash flowstatement of change in shareholders' eq statement of retained earningsstock buybackstock dividendsstock offeringstock offeringstock optionstock price appreciationstock repurchasestock splitstockholderstockholders'equitystraight or majority votingstraight-line depreciationstrong formsunk costswapsyndicate of underwritertakeovertangible fixed assetstarget capital structuretax exempt instrumenttax shieldteminal valuetender offertender offer(=takeover bid)term loantime value of moneytotal asset turnover ratiotrade credittrademarktradeofftradeoff theorytransaction costtransaction motivetreasurertreasury notestreasury sharetreasury stockunbiased forward rateunderlying common stockunderpricingunderpricingunderwriterunderwritingunlevered firmunseasoned issueUS Treasury Billuse of cashvalue effectvalue(wealth)maximizationvariable-rate debtvarianceventure capitalventure capitalistviabilityvice president of financevolatilityvolatilityvoting rightwarrantwarrantweak formweighted average cost of capital(WACC) well-beingwindow dressingwithdrawalworking capital management working captical management world Trade Organization yield to maturity (YTM) zero balance account(ZBA)加速折旧法应付账款应付账款周转率应收账款应收账款应收账款周转率应计制会计应计费用累计折旧累计留存收益获得,取得(在财务中有时指购买;名词形式是acquisition,意为收购)分支机构代理成本代理问题代理关系账龄表(资源,权利等)配置(名词形式是allocation,如capital allocation,意为资本配置)配置有效市场摊销年金先付年金异常(人或事物)升值套利定价理论亚式期权资产管理比率资产周转比率授权股自主权,自治应收账款平均账龄均价期权坏账损失率资产负债表资产负债表银行借款银行承兑汇票破产基本每股收益鲍莫尔现金管理模型行为财务贝塔系数债券契约契约成本账面价值盈亏平衡点分析经纪费企业,商务,业务经营风险资本资产定价模型资本资产定价模型资本预算资本预算资本支出融资性租赁资本市场资本限额资本结构资本盈余现金周转期现金股利现金股利现金流量保障比率筹资活动现金流投资活动现金流经营活动现金流现金收购现金比率集中支付主席(chairmanor chairwoman)支票首席执行官首席财务官按时间顺序排列的(根据权力提出)要求,要求权,主张,要求而得到的东西清算浮游量控股公司系数抵押商业票据普通股普通股普通股股东(也可以是ordinary stockholder or shareholder公司特有风险补偿性余额复杂资本结构复利复利计算集中银行法固定股利支付率政策固定增长率模型消费者信用或有价值权会计长转换溢价转换比率可转换债券可转债可转债可转换优先股可转换证券公司年报相关系数资本成本资本成本协方差创造性会计,寻机性会计信用与收款政策信用卡信用期限赊销信用条件债权人外汇交叉组合系统交叉标价累积投票制远期外汇合约货币期货合约货币期权外汇风险货币互换流动资产流动负债流动负债现行市场价值流动比率现行收益债权人(也可以是debtor,creditor)债务工具债务管理比率债务比率债务与权益比率债务与全部资本比率决策,决策的股利宣布日违约风险递延年金递延税款贬值折旧目标资本结构稀释的每股收益控制权稀释所有权稀释(公司股票)冲减每股收益的直接法直接标价支出、支付折扣期限折扣率折现率折现现金流折现回收期折现计算可分散风险多样化股利折现模型股利无关论股利支付率股利支付比率股利政策股利收益率股利支付比率自制股利违约风险权益报酬率的杜邦分析体系息税前盈余息税前盈余每股收益(盈余)每股盈余经济订货量有效市场假设员工股票期权计划权益乘数欧洲经济区协定欧洲经济共同体欧盟汇率汇率风险除息日执行董事特种期权扩充项目期望收益期望效用理论外部融资面值(美国)会计准则委员会财务分析师财务困境财务困境财务经济学家财务灵活性财务杠杆财务管理金融市场财务比率财务风险财务风险(有时也指金融风险)财务准则财务报表筹资现金流融资比率融资结构融资组合(指负债与所有者权益的比例关系)先进先出惠誉国际公司固定汇率制度浮游量、浮差发行证券;挂牌上市上市成本浮动汇率制度财富500指数远期贴水远期市场远期升水远期汇率远期交易自由现金流假说自由贸易搭便车问题期货合约未来值,终值一般合伙人公认会计原则一般目的资产公开上市持续的高盛公司毛利增长年金避险 套期保值历史成本董事会自制股利门坎利率,最低报酬率门槛利率,最低报酬率混合证券混合金融工具激励性股票期权利润表增量现金流量独立审计师独立项目间接法间接标价信息不对称信息有效市场首次公开发行股票首发股票首发股票机构投资者机构投资者无形固定资产利率保障比率利息抵减利率平价利息率风险内部融资内部收益率,内含报酬率美国国内税务署跨国公司国际财务管理国际货币基金组织内在价值存货存货存活周转期存货周转率投资现金流投资银行投资银行家投资者的理性一月效应危害合资企业即时制后进先出单一价格法则学习曲线租赁租赁承租人出租人杠杠比率杠杆企业负债有限责任合伙人有限合伙制企业贷款额度股利清算清算流动性比率锁箱系统长期债务与全部资本比率长期负债长期比率回顾试货币期权低正常股利加额外股利政策邮寄浮游量管理层收购操纵市场转换价值市场不完备性市场风险市场份额可销售性短期证券有价证券短期有价证券流动性证券,有价证券市场价值与账面价值的比率会计学硕士工商管理硕士财务管理专业硕士物料需求计划系统(债券、票据等)到期均值-方差有效边界均值-方差世界美林公司米勒-欧尔现金管理模型负债与股票的组合适中策略MM定理星期一效应拨款单,汇款单,汇票监督成本穆迪和标准普尔穆迪公司摩根士丹利-添惠公司抵押跨国公司共同基金互不相容项目大额可转让存单议价收购净利润净现值净现值净利润净营运资本纽约证券交易市场纽约股票交易所新上市公司非执行董事正态分布正态假设应付票据发行价格公开市场经营现金流经营收益经营收益(损失)经营性租赁经营杠杆经营利润市场价值比率运营有效市场机会成本机会成本最优资本结构期权合约期权交易类期权证券普通年金(证券等)发行在外的发行股制造费用场外交易市场所有者权益市盈率合伙制企业专利回收期股利支付日排序理论完美资本市场(存货)永续盘存制永续年金关键的,枢纽的组合理论期后审计期后盈余披露预防动机优先权优先认购权优先股优先股优先股股东(英国人用preference stockholder or shareholder)现值价格接受者一级市场本金委托-代理关系(代理关系)私募公司,未上市公司私募私人控股公司有特权的认购按比例,成比例概率概率分布概率分布函数内部处理浮游量延迟利润盈利能力现值指数盈利比率财产股利土地、厂房与设备正反两方面期望理论组合公开发行公众控股公司公开上市公司,公众公司,上市公司(其他的表达法如,listed corporation,public corporation,etc)公开上市公司购买力平价卖出期权卖出价格速动比率随机变量收益率理性行为实务资产房地产(有时也用real property,或者就用property表示)股权登记日正常股利稳健策略更新项目回购回购回购协议要求的报酬率保留借款能力剩余索取权剩余股利政策残余价值激进策略限制性条款散户投资者(为自己买卖证券而不是为任何公司或机构进行投资的个人投资者)个人投资者.散户投资者回报资产收益率普通权益报酬率全部权益报酬率权益报酬率收入代理权所有权转移权投票权认股权发行风险规避所罗门美邦投资公司饱和点情况分析适时发行、增发(seasoned是指新股稳定发行。
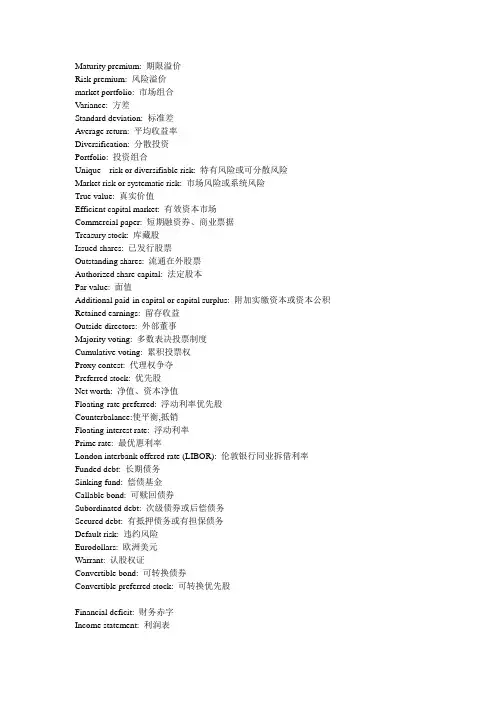
Maturity premium: 期限溢价Risk premium: 风险溢价market portfolio: 市场组合Variance: 方差Standard deviation: 标准差Average return: 平均收益率Diversification: 分散投资Portfolio: 投资组合Unique risk or diversifiable risk: 特有风险或可分散风险Market risk or systematic risk: 市场风险或系统风险True value: 真实价值Efficient capital market: 有效资本市场Commercial paper: 短期融资券、商业票据Treasury stock: 库藏股Issued shares: 已发行股票Outstanding shares: 流通在外股票Authorized share capital: 法定股本Par value: 面值Additional paid-in capital or capital surplus: 附加实缴资本或资本公积Retained earnings: 留存收益Outside directors: 外部董事Majority voting: 多数表决投票制度Cumulative voting: 累积投票权Proxy contest: 代理权争夺Preferred stock: 优先股Net worth: 净值、资本净值Floating-rate preferred: 浮动利率优先股Counterbalance:使平衡,抵销Floating interest rate: 浮动利率Prime rate: 最优惠利率London interbank offered rate (LIBOR): 伦敦银行同业拆借利率Funded debt: 长期债务Sinking fund: 偿债基金Callable bond: 可赎回债券Subordinated debt: 次级债券或后偿债务Secured debt: 有抵押债务或有担保债务Default risk: 违约风险Eurodollars: 欧洲美元Warrant: 认股权证Convertible bond: 可转换债券Convertible preferred stock: 可转换优先股Financial deficit: 财务赤字Income statement: 利润表Common-size income statement: 共同尺度利润表、百分率利润表Balance sheet: 资产负债表Common-size balance sheet: 共同尺度资产负债表Leverage ratios: 负债比率、杠杆比率Financial leverage: 财务杠杆Long-term debt ratio: 长期负债比率Long-term debt-equity ratio: 长期债务权益比Total debt ratio: 资产负债率Times interest earned ratio: 已获利息倍数Cash coverage ratio: 现金流偿债能力比率Liquidity ratio: 变现能力比率Net working capital to total assets ratio: 净营运资本占总资产比Current ratio: 流动比率Quick (or acid-test) ratio: 速动比率或酸性测试比率Cash ratio: 现金比率Marketable securities: 有价证券Asset turnover ratio: 资产周转率Average collection period: 平均收账期Inventory turnover ratio: 存货周转率Profitability ratios: 盈利能力比率Profit margin: 销售净利率、利润边际Operating profit margin: 营业利润率Return on assets (ROA): 总资产收益率Return on equity (ROE): 净资产收益率Payout ratio: 股利支付率Plowback ratio: 留存收益率Long-term debt ratio: 长期负债比率Long-term debt-equity ratio: 长期债务权益比Total debt ratio: 资产负债率Times interest earned ratio: 已获利息倍数Interest cover ration:利息保障倍数Cash coverage ratio: 现金流偿债能力比率Du Pont system: 杜邦财务分析体系ROA: 总资产收益率ROE: 净资产收益率Creditor 债权人Deflation 通货紧缩Expenses 费用Financial statement 财务报表Financial activities 筹资活动Liabilities 负债Negative cash flow 负现金流量Operating activities 经营活动Owners equity 所有者权益Partnership 合伙企业Positive cash flow 正现金流量Retained earning 留存利润Revenue 收入Sole proprietorship 独资企业Solvency 清偿能力财会名词汉英对照表〔1〕会计与会计理论会计accounting决策人Decision Maker投资人Investor股东Shareholder债权人Creditor流动资产Current assets流动负债Current Liabilities长期负债Long-term Liabilities投入资本Contributed Capital留存收益Retained Earning----------------------------------------------------------------------------------------------------------------------应收帐款Account receivable应收票据Note receivable起运点交货价F.O.B shipping point目的地交货价F.O.B destination point商业折扣Trade discount现金折扣Cash discount销售退回及折让Sales return and allowance坏帐费用Bad debt expense备抵法Allowance method备抵坏帐Bad debt allowance出票人Maker受款人Payee本金Principal利息率Interest rate到期日Maturity date本票Promissory note贴现Discount拒付费Protest fee------------------------------------------------------------〔4〕存货存货Inventory商品存货Merchandise inventory产成品存货Finished goods inventory在产品存货Work in process inventory原材料存货Raw materials inventory市价Market value重置本钱Replacement cost可变现净值Net realizable value上限Upper limit下限Lower limit毛利法Gross margin method零售价格法Retail method本钱率Cost ratio------------------------------------------------------------〔5〕长期投资长期投资Long-term investment长期股票投资Investment on stocks长期债券投资Investment on bonds本钱法Cost method权益法Equity method合并法Consolidation method股利宣布日Declaration date股权登记日Date of record除息日Ex-dividend date付息日Payment date债券面值Face value, Par value债券折价Discount on bonds债券溢价Premium on bonds票面利率Contract interest rate, stated rate市场利率Market interest ratio, Effective rate普通股Common Stock优先股Preferred Stock现金股利Cash dividends股票股利Stock dividends清算股利Liquidating dividends到期日Maturity date到期值Maturity value---------------------------------------------------------〔6〕固定资产固定资产Plant assets or Fixed assets原值Original value预计使用年限Expected useful life预计残?nbsp;Estimated residual value折旧费用Depreciation expense累计折旧Accumulated depreciation帐面价值Carrying value应提折旧本钱Depreciation cost净值Net value在建工程Construction-in-process磨损Wear and tear过时Obsolescence直线法Straight-line method 〔SL〕工作量法Units-of-production method 〔UOP〕加速折旧法Accelerated depreciation method双倍余额递减法Double-declining balance method 〔DDB〕年数总和法Sum-of-the-years-digits method 〔SYD〕以旧换新Trade in经营租赁Operating lease融资租赁Capital lease廉价购置权Bargain purchase option 〔BPO〕资产负债表外筹资Off-balance-sheet financing最低租赁付款额Minimum lease payments--------------------------------------------------------〔7〕无形资产无形资产Intangible assets专利权Patents商标权Trademarks, Trade names著作权Copyrights特许权或专营权Franchises商誉Goodwill开办费Organization cost租赁权Leasehold摊销Amortization--------------------------------------------------------〔8〕流动负债负债Liability流动负债Current liability应付帐款Account payable应付票据Notes payable贴现票据Discount notes长期负债一年内到期局部Current maturities of long-term liabilities应付股利Dividends payable预收收益Prepayments by customers存入保证金Refundable deposits应付费用Accrual expense增值税value added tax营业税Business tax应付所得税Income tax payable应付奖金Bonuses payable产品质量担保负债Estimated liabilities under product warranties赠品和兑换券Premiums, coupons and trading stamps或有事项Contingency或有负债Contingent或有损失Loss contingencies或有利得Gain contingencies永久性差异Permanent difference时间性差异Timing difference应付税款法Taxes payable method------------------------------------------------------------〔9〕长期负债长期负债Long-term Liabilities应付公司债券Bonds payable有担保品的公司债券Secured Bonds抵押公司债券Mortgage Bonds保证公司债券Guaranteed Bonds信用公司债券Debenture Bonds一次还本公司债券Term Bonds分期还本公司债券Serial Bonds可转换公司债券Convertible Bonds可赎回公司债券Callable Bonds可要求公司债券Redeemable Bonds记名公司债券Registered Bonds无记名公司债券Coupon Bonds普通公司债券Ordinary Bonds收益公司债券Income Bonds名义利率,票面利率Nominal rate实际利率Actual rate有效利率Effective rate溢价Premium折价Discount面值Par value直线法Straight-line method实际利率法Effective interest method到期直接偿付Repayment at maturity提前偿付Repayment at advance偿债基金Sinking fund长期应付票据Long-term notes payable抵押借款Mortgage loan--------------------------------------------------〔10〕业主权益权益Equity业主权益Owners equity股东权益Stockholders equity投入资本Contributed capital缴入资本Paid-in capital股本Capital stock资本公积Capital surplus留存收益Retained earnings核定股本Authorized capital stock实收资本Issued capital stock发行在外股本Outstanding capital stock库藏股Treasury stock普通股Common stock优先股Preferred stock累积优先股Cumulative preferred stock非累积优先股Noncumulative preferred stock完全参加优先股Fully participating preferred stock局部参加优先股Partially participating preferred stock非局部参加优先股Nonpartially participating preferred stock现金发行Issuance for cash非现金发行Issuance for noncash consideration股票的合并发行Lump-sum sales of stock发行本钱Issuance cost本钱法Cost method面值法Par value method捐赠资本Donated capital盈余分配Distribution of earnings股利Dividend股利政策Dividend policy宣布日Date of declaration股权登记日Date of record除息日Ex-dividend date股利支付日Date of payment现金股利Cash dividend股票股利Stock dividend拨款appropriation-----------------------------------------------------------〔12〕财务状况变动表财务状况变动表中的现金根底SCFP.Cash Basis〔现金流量表〕财务状况变动表中的营运资金根底SCFP.Working Capital Basis〔资金来源与运用表〕营运资金Working Capital全部资源概念All-resources concept直接:)业务Direct exchanges正常营业活动Normal operating activities财务活动Financing activities投资活动Investing activities-----------------------------------------------------------〔13〕财务报表分析财务报表分析Analysis of financial statements比较财务报表Comparative financial statements趋势百分比Trend percentage比率Ratios普通股每股收益Earnings per share of common stock股利收益率Dividend yield ratio价益比Price-earnings ratio普通股每股帐面价值Book value per share of common stock资本报酬率Return on investment总资产报酬率Return on total asset债券收益率Yield rate on bonds已获利息倍数Number of times interest earned债券比率Debt ratio优先股收益率Yield rate on preferred stock营运资本Working Capital周转Turnover存货周转率Inventory turnover应收帐款周转率Accounts receivable turnover流动比率Current ratio速动比率Quick ratio酸性试验比率Acid test ratio〔14〕合并财务报表合并财务报表Consolidated financial statements吸收合并Merger创立合并Consolidation控股公司Parent company附属公司Subsidiary company少数股权Minority interest权益联营合并Pooling of interest 购置合并Combination by purchase 权益法Equity method本钱法Cost method。
CFA考试:财务报表分析——财务⽐率和每股收益(投资⼯具)第⼗章财务报表的分析Chapter ⒑Analysis of Financial Statement(Investment Analysis and Portfolio Management)§⒈解释通⽤规模的资产负债表(Common-size balance sheet)和通⽤规模的损益表,并讨论使⽤通⽤规模财务报表的情形通⽤规模的资产负债表(Common-size balance sheet),是将所有的资产负债账⽬都表⽰为总资产(total)的百分⽐。
通⽤规模的损益表(Common-size income statement),是将所有损益表中的所有项⽬都表⽰为销售额(sales)的百分⽐。
通⽤规模财务报表的作⽤:①便于对规模不同的两个公司进⾏⽐较;②检验单个公司在某段时期内的趋势;③有助于分析师了解公司财务报表的结构,如流动性资产的⽐例、负债为短期义务的⽐例等。
§⒉计算、解释和讨论下列量的适⽤:公司的内部流动性(company's Internal liquidity)、营业业绩(operating performance)、风险组合(risk profile)和增长潜能(growth potential)财务⽐率的五个主要类别:①通⽤规模报表(Common-size statement)。
②内部流动性或清偿能⼒(Internal liquidity / solvency)。
③营业业绩,包括营业效率(operating efficiency)和营业获利能⼒(operating profitability)。
④风险分析(risk analysis),包括商业风险、筹资风险和流动性风险。
⑤增长分析(growth analysis)。
内部流动性或偿债能⼒(Internal liquidity / solvency)内部流动性,表明公司履⾏短期筹资义务的能⼒。

FCFF模型(重定向自公司自由现金流模型)FCFF模型(Free Cash Flow for the Firm,公司自由现金流模型)FCFF的定义和计算方法公司自由现金流(Free cash flow for the firm)是对整个公司进行估价,而不是对股权。
美国学者拉巴波特(Alfred Rappaport)20 世纪80 年代提出了自由现金流概念:企业产生的、在满足了再投资需求之后剩余的、不影响公司持续发展前提下的、可供企业资本供应者/各种利益要求人(股东、债权人)分配的现金。
麦肯锡(McKinsey & Company, Inc.)资深领导人之一的汤姆·科普兰(Tom Copeland)教授于1990年阐述了自由现金流量的概念并给出了具体的计算方法:自由现金流量等于企业的税后净经营利润(Net Operating Profit less Adjusted Tax, NOPAT,)即将公司不包括利息费用的经营利润总额扣除实付所得税税金之后的数额)加上折旧及摊销等非现金支出,再减去营运资本的追加和物业厂房设备及其他资产方面的投资。
其经济意义是:公司自由现金流是可供股东与债权人分配的最大现金额。
具体公式为:公司自由现金流量(FCFF) =(税后净利润+ 利息费用+ 非现金支出)- 营运资本追加- 资本性支出这个只是最原始的公式,继续分解得出:公司自由现金流量(FCFF)=(1-税率t)×息税前利润(EBIT)+折旧-资本性支出(CAPX)-净营运资金(NWC)的变化这个就是最原始的计算FCFF的公式。
其中:息税前利润(EBIT)=扣除利息、税金前的利润,也就是扣除利息开支和应缴税金前的净利润。
具体还可以将公式转变为:公司自由现金流量(FCFF)=(1-税率t)× 息前税前及折旧前的利润(EBITD)+税率t×折旧-资本性支出(CAPX)-净营运资金(NWC)的变化公司自由现金流量(FCFF)=(1-税率t)× 息税前利润(EBITD)-净资产(NA)的变化其中:息前税前及折旧前的利润(EBITD)= 息税前利润+折旧净营运资金的变化有时称为净营运资金中的投资[编辑]FCFF模型概述FCFF模型认为公司价值等于公司预期现金流量按公司资本成本进行折现。
资产负债表Bal ance She et项目ITEM货币资金Ca sh短期投资Shortterm inv estments应收票据Notes re ceivable应收股利Dividend receiva ble应收利息Inter est rece ivable应收帐款Ac counts r eceivabl e其他应收款Other r eceivabl es预付帐款Account s prepai d期货保证金Futureguarante e应收补贴款Allowan ce recei vable应收出口退税Ex port dra wback re ceivable存货In ventorie s其中:原材料Includ ing:Rawmaterial s产成品(库存商品) Fin ished go ods待摊费用Prepa id and d eferredexpenses待处理流动资产净损失Un settledG/L on c urrent a ssets一年内到期的长期债权投资Long-term de bentureinvestme nt falli ng due i n a yaea r 其他流动资产Other current assets流动资产合计Total c urrent a ssets长期投资:Lon g-term i nvestmen t:其中:长期股权投资In cludinglong ter m equity investm ent长期债权投资Long term se curities investm ent*合并价差Incor porating price d ifferenc e长期投资合计Total long-te rm inves tment固定资产原价Fi xed asse ts-cost减:累计折旧Less:Acc umulated Dprecia tion固定资产净值Fix ed asset s-net va lue减:固定资产减值准备Less:Im pairment of fixe d assets固定资产净额Net va lue of f ixed ass ets固定资产清理Dis posal of fixed a ssets工程物资Pro ject mat erial在建工程Con structio n in Pro gress待处理固定资产净损失Unset tled G/L on fixe d assets固定资产合计Total t angibleassets无形资产In tangible assets其中:土地使用权Inclu ding and use rig hts递延资产(长期待摊费用)Deferre d assets其中:固定资产修理Inc luding:F ixed ass ets repa ir固定资产改良支出Imp rovement expendi ture offixed as sets其他长期资产Oth er longterm ass ets其中:特准储备物资Among it:Spec ially ap proved r eserving materia ls无形及其他资产合计T otal int angibleassets a nd other assets递延税款借项Deferred assetsdebits资产总计Total A ssets资产负债表(续表) Balanc e Sheet项目I TEM短期借款Short-term lo ans应付票款Notes payable应付帐款Accounts payab1e预收帐款Advances from cu stomers应付工资A ccrued p ayro1l应付福利费We lfare pa yable应付利润(股利)Profit s payab1e应交税金Taxes p ayable其他应交款Ot her paya ble to g overnmen t其他应付款Other c reditors预提费用Provisio n for ex penses预计负债Ac crued li abilitie s一年内到期的长期负债L ong term liabili ties due withinone year其他流动负债Othercurrentliabilit ies流动负债合计Tota l curren t liabil ities长期借款Lon g-term l oans pay able应付债券Bond s payabl e长期应付款long-te rm accou nts paya ble专项应付款Speci al accou nts paya ble其他长期负债Oth er long-term lia bilities其中:特准储备资金Incl uding:Sp ecial re serve fu nd长期负债合计Tota l long t erm liab ilities递延税款贷项Deferre d taxati on credi t负债合计Tota l liabil ities*少数股东权益Minorit y intere sts实收资本(股本) S ubscribe d Capita l国家资本Nationa l capita l集体资本Collect ive capi tal法人资本Legal person"s capita l其中:国有法人资本In cluding:State-ow ned lega l person"s capit al 集体法人资本Coll ective l egal per son"s ca pital个人资本Per sonal ca pital外商资本For eign bus inessmen"s capit al资本公积Capita l surplu s盈余公积surplus reserve其中:法定盈余公积Inc luding:s tatutory surplus reserve公益金publicwelfarefund补充流动资本Su pplermen tary cur rent cap ital*未确认的投资损失(以“-”号填列)Una ffirmedinvestme nt loss未分配利润R etainedearnings外币报表折算差额Conve rted dif ferencein Forei gn Curre ncy Stat ements所有者权益合计Totalsharehol der"s eq uity负债及所有者权益总计Tota l Liabil ities &Equity利润表INC OME STAT EMENT项目ITEMS产品销售收入Sales o f produc ts其中:出口产品销售收入Inclu ding:Exp ort sale s减:销售折扣与折让Le ss:Sales discoun t and al lowances产品销售净额Net sal es of pr oducts减:产品销售税金Less:Sa les tax产品销售成本Cost of sales其中:出口产品销售成本Incl uding:Co st of ex port sal es产品销售毛利Gros s profit on sale s减:销售费用Less:Sellingexpenses管理费用G eneral a nd admin istrativ e expens es财务费用Financi al expen ses其中:利息支出(减利息收入) Incl uding:In terest e xpenses(minusin terest i hcome) 汇兑损失(减汇兑收益)Exch ange los ses(minu s exchan ge gains)产品销售利润Profit on sale s加:其他业务利润Add:profit f rom othe r operat ions营业利润Opera ting pro fit加:投资收益Add:Income o n invest ment加:营业外收入Ad d:Non-op eratingincome减:营业外支出Less:Non-operati ng expen ses加:以前年度损益调整Add:adju stment o f loss a nd gainfor prev ious yea rs利润总额Totalprofit减:所得税L ess:Inco me tax净利润Net profit现金流量表C ash Flow s Statem entPrep ared by:Period: Unit:Items1.Cash Fl ows from Operati ng Activ ities:01)Ca sh recei ved from sales o f goodsor rende ring ofservices02)RentalreceivedValue added t ax on sa les rece ived and refunds of valu e03)ad ded taxpaid04)Refund of othe r taxesand levy other t han valu e addedtax07)Other c ash rece ived rel ating to operati ng activ ities08)Sub-t otal ofcash inf lows09)Cash p aid forgoods an d servic es10)Cash pai d for op eratingleases11)Cash paid to and onbehalf o f employ ees12)Value a dded tax on purc hases pa id13)Income t ax paid14)Tax es paidother th an value added t ax and i ncome ta x17)O ther cas h paid r elatingto opera ting act ivities18)Sub-total o f cash o utflows19)Netcash flo ws fromoperatin g activi ties2.Cash Flo ws fromInvestin g Activi ties:20)Cashreceived from re turn ofinvestme nts21)Cash re ceived f rom dist ribution of divi dends or profits22)Ca sh recei ved from bond in terest i ncomeNet cash receive d from d isposalof fixed assets,intangib le 23)a ssets an d otherlong-ter m assets26)Ot her cash receive d relati ng to in vestingactiviti es27)Sub-tota l of cas h inflow sCash paid to acquire fixed a ssets,in tangible assets28)andother lo ng-termassets29)Cash paid to acquire equityinvestme nts30)Cash pa id to ac quire de bt inves tments33)Othe r cash p aid rela ting toinvestin g activi ties 34)Sub-to tal of c ash outf lows35)Net cas h flowsfrom inv esting a ctivitie s3.Cas h Flowsfrom Fin ancing A ctivitie s:36)Proceeds from is suing sh ares37)Procee ds fromissuingbonds38)Proce eds from borrowi ngs41)Other p roceedsrelating to fina ncing ac tivities42)Su b-totalof cashinflows43)Cas h repaym ents ofamountsborrowed44)Ca sh payme nts of e xpenseson any f inancing activit ies45)Cash pa yments f or distr ibutionof divid ends orprofits46)Cas h paymen ts of in terest e xpenses47)Cas h paymen ts for f inance l eases48)Cashpayments for red uction o f regist ered cap ital51)Othercash pay ments re lating t o financ ing acti vities52)Sub-total of cash ou tflows53)Netcash flo ws fromfinancin g activi ties4.Effect o f Foreig n Exchan ge RateChangeson Cash I ncreasein Cashand Cash Equival entsSuppleme ntal Inf ormation1.Inves ting and Financi ng Activ ities th at do no t Involv e inCa sh Recei pts andPayments56)Re paymentof debts by thetransfer of fixe d assets57)Re paymentof debts by thetransfer of inve stments58)Inv estments in theform offixed as sets59)Repaym ents ofdebts by the tra nsfer of investo ries2.Reconcil iation o f Net Pr ofit toCash Flo ws fromOperatin g Activ ities62)Net p rofit63)Add p rovision for bad debt or bad deb t writte n off64)Deprec iation o f fixedassets65)Amor tization of inta ngible a ssetsLosses o n dispos al of fi xed asse ts,intan gible as sets66)and oth er long-term ass ets (ordeduct:g ains)67)Losse s on scr apping o f fixedassets68)Fina ncial ex penses69)Loss es arisi ng frominvestme nts (ordeduct:g ains)70)Defer ed tax c redit (o r deduct:debit)71)Dec rease in invento ries (or deduct:increase)72)D ecreasein opera ting rec eivables (or ded uct:incr ease) 73)Incre ase in o perating payable s (or de duct:dec rease)74)Netpaymenton value added t ax (or d educt:ne t receip ts 75)Net cash flows f rom oper ating ac tivitiesIncrease in Cash and Cas h Equiva lents76)cashat the e nd of th e period77)Le ss:cashat the b eginning of theperiod78)Plus:cash eq uivalent s at the end ofthe peri od 79)Less:cas h equiva lents at the beg inning o f the pe riod80)Net inc rease in cash an d cash e quivalen ts现金流量表的现金流量声明拟制人:时间:单位:项目1.cash流量从经营活动:01)所收到的现金从销售货物或提供劳务02 )收到的租金增值税销售额收到退款的价值03 )增值税缴纳04)退回的其他税收和征费以外的增值税07 )其他现金收到有关经营活动08 )分,总现金流入量09 )用现金支付的商品和服务10 )用现金支付经营租赁11)用现金支付,并代表员工12)增值税购货支付13 )所得税的缴纳14)支付的税款以外的增值税和所得税17 )其他现金支付有关的经营活动18 )分,总的现金流出19 )净经营活动的现金流量2.cash流向与投资活动:20)所收到的现金收回投资21)所收到的现金从分配股利,利润22 )所收到的现金从国债利息收入现金净额收到的处置固定资产,无形资产23)资产和其他长期资产26 )其他收到的现金与投资活动27 )小计的现金流入量用现金支付购建固定资产,无形资产28 )和其他长期资产29)用现金支付,以获取股权投资30 )用现金支付收购债权投资33 )其他现金支付的有关投资活动34 )分,总的现金流出35 )的净现金流量,投资活动产生3.cash流量筹资活动:36 )的收益,从发行股票37)的收益,由发行债券38 )的收益,由借款41 )其他收益有关的融资活动42 ),小计的现金流入量43)的现金偿还债务所支付的44)现金支付的费用,对任何融资活动45 )支付现金,分配股利或利润46 )以现金支付的利息费用47 )以现金支付,融资租赁48 )以现金支付,减少注册资本51 )其他现金收支有关的融资活动52 )分,总的现金流出53 )的净现金流量从融资活动4.effec t的外汇汇率变动对现金5.ne t增加现金和现金等价物补充资料1.in vesting活动和筹资活动,不参与现金收款和付款56 )偿还债务的转让固定资产57 )偿还债务的转移投资58 )投资在形成固定资产59 )偿还债务的转移库存量2.reconcil iation净利润现金流量从经营活动62 )净利润63 )补充规定的坏帐或不良债务注销64 )固定资产折旧65 )无形资产摊销损失处置固定资产,无形资产66 )和其他长期资产(或减:收益)67)损失固定资产报废68 )财务费用69 )引起的损失由投资管理(或减:收益)70 )d efered税收抵免(或减:借记卡)71 )减少存货(或减:增加)72 )减少经营性应收(或减:增加)73)增加的经营应付账款(或减:减少)74 )净支付的增值税(或减:收益净额75 )净经营活动的现金流量3.net增加现金和现金等价物76)的现金,在此期限结束77)减:现金期开始78 )加:现金等价物在此期限结束79 )减:现金等价物期开始80 )净增加现金和现金等价物。
CHAPTER 4THE MECHANICS OF FINANCIAL ACCOUNTINGBRIEF EXERCISESBE4–1Transaction Assets = Liabilities + Stockholders’ Equity Paid $3,656 to purchase + 3,656property, plant and equip. - 3,656Issued common stock + 967 = + 967for $967Recorded depreciation -4,651 = -4,651of $4,651Net effect -3,684 = -3,684b. The transaction to purchase property, plant and equipment does not appear to affect theaccounting equation. This is because both sides of the transaction affect the asset side of the balance sheet. Intel pays cash for p,p,&e; this reduces cash and increases fixed assets. All of the other transactions affect both sides of the balance sheet.BE4–2Transaction Assets = Liabilities + Stockholders’ Equity Borrowed $350 from banks, + 350 = +350issuing long-term debtPaid cash dividends of $208 - 208 = - 208Issued common stock for $28 + 28 = +28Paid $250 to reducelong-term debt -250 = -250 ___Net effect - 80 = +100 -180b. The net effect on the company’s long-term debt balance is to increase it by $100. Two sourcesthat could have provided the cash to finance the net effect of these four transactions are funds from operations and funds from investing activities. All of the transactions shown here are financing activities, which show a use of $80 for financing activities.1BE4–3Transaction Assets = Liabilities + Stockholders’ Equity Recognized revenues +953 = +953of $953, in exchange foraccounts receivable.Paid $431 for sales and -431 = -431marketing.Issued common stock for $78 +78 = +78Purchased marketable -1,166securities for $1,166 +1,166 = _____Net effect +600 = +600b. The first and second transactions would be reflected on the income statement. Yahoo wouldshow $953 of revenue on the income statement. Yahoo would also show sales and marketing expense of $431.All of these transactions would directly or indirectly be reflected on the statement of cash flows.The first two transactions would be netted in the cash from operations section, the third transaction would be in the financing section and the fourth transaction would be in the operations section.EXERCISESE4–1Assets = Liabilities + Stockholders' Equity(1) + 30,000 + 30,000(2) – 20,000+ 20,000(3) + 9,000 +9,000(4) + 8,000 + 8,000(5) – 5,500 – 5,500(6) – 500 – 500Total 41,000 9,000 32,000Note:Transactions (4), (5), and (6) are initially recorded in temporary accounts and are closed into the Retained Earnings account, which is part of stockholders' equity.E4–2Assets = Liabilities +Stockholders' EquityAccounts Notes Contributed RetainedCash + Receivable + Land = Payable + Capital + Earnings(1) + 30,000 +30,000(2) – 20,000 +20,000(3) + 9,000 +9,000(4) +8,000 + 8,000(5) – 5,500 – 5,500(6) – 500 – 500 Total 13,000 8,000 20,000 9,000 30,000 2,000Note:Transactions (4), (5), and (6) are initially recorded in temporary accounts and are closed into the Retained Earnings account, which is part of stockholders' equity.E4–3X CompanyIncome StatementFor the Year EndedRevenues..................................................................................................$ 8,000Operating expenses..................................................................................5,500Net income................................................................................................$ 2,500X CompanyStatement of Stockholders’ EquityFor the Year EndedContributed RetainedCapital EarningsBeginning balance $ 0 $ 0Net income 2,500Dividends (500)Owner contribution 30,000 _______Ending balance $ 30,000 $ 2,000X CompanyBalance SheetAs ofAssets Liabilities and Stockholders' EquityCash ....................................$ 13,000 Notes payable........................$ 9,000Accounts receivable.............8,000 Contributed capital.................30,000Land ....................................20,000 Retained earnings..................2,000Total liabilities andTotal assets..........................$41,000 stockholders' equity...........$ 41,000E4–3 ConcludedX CompanyStatement of Cash FlowsFor the Year EndedCash flows from operating activities:Cash payments for expenses..................................... $ (5,500) Cash flows from investing activities:Purchase of land......................................................... (20,000) Cash flows from financing activities:Cash contributions from owners................................ $ 30,000Proceeds from bank loan........................................... 9,000Payments of cash dividend (500)Net cash flow from financing activities.................. 38,500 Net increase in cash........................................................ $ 13,000 Beginning cash balance.. 0Ending cash balance....................................................... $ 13,000 E4–4Assets = Liabilities + Stockholders' Equity(1) +10,000 + 10,000(2) + 8,000 + 8,000(3) – 3,000 + 3,000 – 6,000(4) +12,000 + 10,000– 2,000(5) – 400 – 400(6) + 7,000 + 1,000– 6,000Total 25,600 13,000 12,600Cathedral EnterprisesIncome StatementFor the Year EndedFees earned.................................................................................................$ 8,000 Expenses......................................................................................................(6,000) Gain on sale of land.....................................................................................1,000 Net income...................................................................................................$ 3,000 E4–4 ConcludedCathedral EnterprisesStatement of Stockholders’ EquityFor the Year EndedContributed RetainedCapital EarningsBeginning balance $ 0 $ 0Net income 3,000Dividends (400)Stockholder contribution 10,000 ______Ending balance $ 10,000 $ 2,600Cathedral EnterprisesBalance SheetAs ofAssets Liabilities and Stockholders' EquityCash ....................................$ 17,600 Misc. payable.........................$ 3,000Receivables..........................2,000 Long-term note......................10,000Land ....................................6,000 Contributed capital.................10,000Retained earnings..................2,600Total liabilities andTotal assets..........................$25,600 stockholders' equity...........$25,600Cathedral EnterprisesStatement of Cash FlowsFor the Year EndedCash flows from operating activities:Cash collected from customers.................................. $ 6,000Cash paid for expenses.............................................. (3,000)Net cash increase from operating activities.......... $ 3,000 Cash flows from investing activities:Proceeds from sale of land........................................ $ 7,000Cash paid for land...................................................... (2,000)Net cash increase from investing activities........... 5,000 Cash flows from financing activities:Contributions from stockholders................................ $ 10,000Dividends paid to stockholders (400)Net cash increase from financing activities........... 9,600 Increase in cash.............................................................. $ 17,600Beginning cash balance 0Ending cash balance....................................................... $ 17,600Note: Even though $12,000 worth of land was purchased only $2,000 is shown on this statement because the balance ($10,000) was paid for with a promise to pay cash in the future (loan). So only $2,000 of cash was used this year.E4–5(1) This financial event does not have accounting significance. Entries are made to record financialevents that affect the company's current financial condition. In this case, the new contract will affect the company's future financial condition by affecting the dollar value of future events as the new contract is implemented. Simply signing the contract does not affect the company's current financial position.(2) This financial event does have accounting significance. The receipt of cash in exchange forissuing debt affects the company's current financial position by increasing both the amount of cash the company has and the obligations the company has to other entities. Thus, an entry is necessary, and the entry would be:Cash (+A)................................................................................. 200,000Bonds Payable (+L)............................................................ 200,000 Issued bonds.(3) This event does not have accounting significance. The retirement of an official does notinfluence the company's current financial position.(4) This financial event does have accounting significance. Receiving cash from a customer wouldchange the company's current financial position. The entry would be:Cash (+A)................................................................................. 10,000Accounts Receivable (–A).................................................. 10,000 Collected cash from customers.(5) This financial event does have accounting significance. Payment of a liability will change acompany's current financial position by decreasing both the amount of cash the company has and the company's obligations to other entities. The entry would be:Accrued Interest Payable (–L).................................................. 1,000Cash (–A)........................................................................... 1,000 Paid interest previously incurred.(6) This financial event does not have accounting significance. Long-lived assets are reported atoriginal cost less accumulated depreciation. Increases in market value above the reported amounts are not reported because market values on long-lived assets are not objective (i.e., are not reliable).(7) This financial event does have accounting significance. The purchase of an insurance policyrepresents a change in the company's financial position because the company has less cash and because the company has acquired the benefit of insurance coverage. However, the value of the policy has no influence on the company. The appropriate entry would be:Prepaid Insurance (+A)............................................................ 1,500Cash (–A)........................................................................... 1,500 Purchased insurance coverage.(8) This financial event does not have accounting significance. Simply placing an order does notaffect a company's financial position. That is, the company has not experienced a change in the amount of cash it has, the amount it owes other entities, and so forth. The company's position does not change until it legally owns the goods.E4–6Account Financial Statement Accounting EquationFlight Equipment Balance Sheet AssetsPassenger Revenue Income Statement Owners’ EquityRetained Earnings Balance Sheet Owners’ EquityNotes Payable Balance Sheet LiabilitiesInterest Expense Income Statement Owners’ EquityAccounts Receivable Balance Sheet AssetsDividends Balance Sheet Owners’ EquityPrepaid Expenses Balance Sheet AssetsAccounts Payable Balance Sheet LiabilitiesCommon Stock Balance Sheet Owners’ EquityFuel Expense Income Statement Owners’ EquityOther Revenues Income Statement Owners’ EquityShort-Term Investments Balance Sheet AssetsDepreciation Expense Income Statement Owners’ EquityGain - Sale of Investment Income Statement Owners’ EquityE4–7Bristol-Myers SquibbIncome StatementFor the Year Ended December 31, 2002Revenue:Sales........................................................................... $18,106Loss on sales of business (30)Total revenue......................................................... $ 18,076 Expenses:Cost of goods sold...................................................... $ 6,532Selling and adm. Expense.......................................... 4,124Advertising and product expense............................... 1,143Research and dev. expense....................................... 2,206Other expenses.......................................................... 1,934Total expenses....................................................... 15,939 Net income...................................................................... $ 2,137 E4–7 ConcludedBristol-Myers SquibbBalance SheetAs of December 31, 2002Assets Liabilities and Stockholders' EquityCash and equivalents...........$ 2,367 Accounts payable...................$ 1,551 Marketable securities...........1,622Accounts receivable.............2,968 Accrued payables..................5,087 Other current assets.............3,103 Short-term borrowings...........1,379Other current liabilities (470)Property, plant and equipment 5,334 Long-term liabilities................7,779Other noncurrent assets.......9,628 Stockholders’ equity...............8,756Total liabilities andTotal assets..........................$ 25,022 stockholders’ equity $ 25,022Bristol-Myers SquibbStatement of Cash FlowsFor the Year Ended December 31, 2002Cash flows from operating activities:Net income................................................... $ 2,137Adjustments:Total adjustments.................................... (1,192)Net cash increase (decrease)due to operating activities................... $ 945 Cash flows from investing activities:Net cash increase (decrease) due toinvesting activities............................... (2,030) Cash flows from financing activities:Net cash increase (decrease) due tofinancing activities............................... (1,117) Increase in cash balance.................................. $ (2,202)Beginning cash balance.................................... 4,569Ending cash balance......................................... $ 2,367The company appears to be in very good financial condition. The company is very profitable with a 12% net income margin ($2,137/$18,106). The company has an extremely strong balance sheet with very good liquidity; working capital is $1,573 ($10,060 - $8,487).E4–8a. Ending cash = Beginning cash + Cash inflows – Cash outflows= $9,000 + $133,500 – $99,500= $43,000Note: Since Cash is an asset, cash inflows are recorded on the debit, or left-hand side of the T account, and cash outflows are recorded on the credit, or right-hand side of the Taccount.b.Miller ManufacturingStatement of Cash FlowsFor the Year Ended December 31, 2006Cash flows from operating activities:Cash collections from customers............................... $ 95,000Payment of salaries.................................................... (26,500)Payment of miscellaneous expenses......................... (13,000)Payment of rent.......................................................... (7,000)Payment of interest..................................................... (3,000)Net cash increase from operating activities.......... $ 45,500 Cash flows from investing activities:Proceeds from sale of land........................................ $ 7,500Purchase of long-term investments........................... (10,000)Purchase of equipment.............................................. (24,000)Net cash decrease from investing activities.......... (26,500) Cash flows from financing activities:Proceeds from issuance of common stock................ $ 15,000Proceeds from borrowing........................................... 16,000Payment of bank loan................................................. (12,000)Payment of dividends................................................. (4,000)Net cash increase from financing activities........... 15,000 Increase (decrease) in cash balance.............................. $ 34,000 Beginning cash balance.................................................. 9,000 Ending cash balance....................................................... $ 43,000E4–9a.(1) Cash (+A)........................................................................... 15,000Common Stock (+SE)................................................... 15,000 Issued common stock.(2) Cash (+A)........................................................................... 4,000Fees Earned (R, +SE)................................................... 4,000 Sold services for cash.(3) Wage Expense (E, –SE).................................................... 1,600Cash (–A)...................................................................... 1,600 Incurred and paid wages.(4) Investment in Land (+A)..................................................... 9,000Cash (–A)...................................................................... 9,000Purchased land as an investment.(5) Dividends (–SE)................................................................. 2,000Cash (–A)...................................................................... 2,000 Declared and paid dividend.(6) Cash (+A)........................................................................... 3,500Land (–A)....................................................................... 3,000Gain on Sale of Land (Ga, +SE) (500)Sold land.(7) Interest Expense (E, –SE) (600)Note Payable (+L) (900)Cash (–A)...................................................................... 1,500 Made principal and interest payment.(8) Miscellaneous Expenses (E, –SE)..................................... 1,800Cash (–A)...................................................................... 1,800 Incurred and paid miscellaneous expenses.b.E4–9 Concludedc.Small and AssociatesStatement of Cash FlowsFor the Month Ended January 31, 2006Cash flows from operating activities:Collections from customers........................................ $ 4,000Payment of wages...................................................... (1,600)Payment of interest (600)Payment of miscellaneous expenses......................... (1,800)Net cash decrease from investing activities.......... $ 0 Cash flows from investing activities:Proceeds from sale of land........................................ $ 3,500Purchase of land......................................................... (9,000)Net cash decrease from investing activities.......... (5,500)Cash flows from financing activities:Proceeds from issuance of stock............................... $15,000Repayment of note (900)Dividend payment....................................................... (2,000)Net cash increase from financing activities........... 12,100 Increase in cash balance................................................ $ 6,600 Beginning cash balance.................................................. 5,000 Ending cash balance....................................................... $ 11,600E4–10a. Assets = Liabilities + Stockholders' EquityAccounts Notes Contributed Retained Cash + Receivable + Land = Payable + Capital + Earnings(1) + 12,000 +12,000(2) + 5,000 + 5,000(3) – 10,000 + 10,000(4) – 5,000 – 5,000(5) + 10,000 +4,000 + 14,000(6) – 4,000 – 4,000(7) + 2,800 – 3,000 – 200(8) – 2,200 – 2,200 Total 8,600 4,000 7,000 5,000 12,000 2,600Ed's Lawn ServiceIncome StatementFor the Year Ended December 31, 2006Revenue.......................................................................... $14,000 Rent expense.................................................................. (5,000) Miscellaneous expense................................................... (4,000) Loss on sale of land.. (200)Net income...................................................................... $ 4,800Ed's Lawn ServiceStatement of Stockholders’ EquityFor the Year Ended December 31, 2006Contributed RetainedCapital EarningsBeginning balance, January 1, 2006 $ 0 $ 0Net income 4,800Dividends (2,200)Stockholder contribution 12,000 ______Ending balance, December 31, 2006 $ 12,000 $ 2,600Ed's Lawn ServiceBalance SheetAs of December 31, 2006Assets Liabilities and Stockholders' EquityCash ....................................$ 8,600 Notes payable........................$ 5,000 Accounts receivable.............4,000 Contributed capital.................12,000 Land ....................................7,000 Retained earnings..................2,600Total liabilities andTotal assets..........................$19,600 stockholders' equity...........$ 19,600E4–10 ContinuedEd's Lawn ServiceStatement of Cash FlowsFor the Year Ended December 31, 2006Cash flows from operating activities:Cash collected from customers.................................. $ 10,000Rent payments on lawn equipment............................ (5,000)Payment of miscellaneous expenses......................... (4,000)Net cash increase from operating activities.......... $ 1,000 Cash flows from investing activities:Proceeds from sale of land........................................ $ 2,800Cash paid for land...................................................... (10,000)Net cash decrease from investing activities.......... (7,200) Cash flows from financing activities:Stockholder contributions........................................... $ 12,000Proceeds from bank loan........................................... 5,000Dividend payments..................................................... (2,200)Net cash increase from financing activities........... 14,800 Increase in cash.............................................................. $ 8,600 Beginning cash balance.. 0Ending cash balance....................................................... $ 8,600b.(1) Cash (+A)........................................................................... 12,000Contributed Capital (+SE)............................................. 12,000 Collected cash from stockholders.(2) Cash (+A)........................................................................... 5,000Notes Payable (+L)........................................................ 5,000 Borrowed cash from bank.(3) Land (+A)........................................................................... 10,000Cash (–A)...................................................................... 10,000 Purchased land.(4) Rent Expense (E, –SE)...................................................... 5,000Cash (–A)...................................................................... 5,000 Incurred and paid rent expense.(5) Cash (+A)........................................................................... 10,000Accounts Receivable (+A)................................................. 4,000Fees Earned (R, +SE)................................................... 14,000 Rendered services.(6) Miscellaneous Expenses (E, –SE)..................................... 4,000Cash (–A)...................................................................... 4,000 Incurred and paid miscellaneous expenses.E4–10 Continued(7) Cash (+A)........................................................................... 2,800Loss on Sale of Land (Lo, –SE) (200)Land (–A)....................................................................... 3,000 Sold land.(8) Dividends (–SE)................................................................. 2,200Cash (–A)...................................................................... 2,200 Declared and paid cash dividend.*The Ending Balance in the Retained Earnings account is derived by the following formula: Beginning Balance + Revenues – Expenses – Dividends.For a check, refer to the statement of retained earnings.E4–10 ConcludedEd's Lawn ServiceIncome StatementFor the Year Ended December 31, 2006Revenue................................................................................................. $ 14,000 Rent expense......................................................................................... (5,000) Miscellaneous expense.......................................................................... (4,000) Loss on sale of land. (200)Net income............................................................................................. $ 4,800Ed's Lawn ServiceStatement of Stockholders’ EquityFor the Year Ended December 31, 2006Contributed RetainedCapital EarningsBeginning balance, January 1, 2006 $ 0 $ 0Net income 4,800Dividends (2,200)Stockholder contribution 12,000 _____Ending balance, December 31, 2006 $ 12,000 $ 2,600Ed's Lawn ServiceBalance SheetAs of December 31, 2006Assets Liabilities and Stockholders' EquityCash .................................... $ 8,600 Notes payable........................ $ 5,000 Accounts receivable.............4,000 Contributed capital................. 12,000 Land ....................................7,000 Retained earnings.................. 2,600Total liabilities andTotal assets..........................$19,600 stockholders' equity........... $19,600Ed's Lawn ServiceStatement of Cash FlowsFor the Year Ended December 31, 2006Cash flows from operating activities:Cash collected from customers.................................. $ 10,000Rent payments on lawn equipment............................ (5,000)Payment of miscellaneous expenses......................... (4,000)Net cash increase from operating activities.......... $ 1,000 Cash flows from investing activities:Proceeds from sale of land........................................ $ 2,800Cash paid for land...................................................... (10,000)Net cash decrease from investing activities.......... (7,200) Cash flows from financing activities:Stockholder contributions........................................... $ 12,000Proceeds from bank loan........................................... 5,000Dividend payments..................................................... (2,200)Net cash increase from financing activities........... 14,800 Increase in cash.............................................................. $ 8,600 Beginning cash balance.. 0Ending cash balance....................................................... $ 8,600E4–11a. Ending cash balance = $8,000 + $109,500 – $90,000 = $27,500b.Holcomb ManufacturingStatement of Cash FlowsFor the Year Ended December 31, 2006Cash flows from operating activities:Cash collections from customers............................... $ 74,000Payments for inventory............................................... (34,000)Payment of wages...................................................... (16,000)Payment of administrative expenses......................... (12,000)Payment of interest..................................................... (3,000)Net cash increase due to operating activities........ $ 9,000 Cash flows from investing activities:Proceeds from long-term investments....................... $ 12,500Purchase of equipment.............................................. (11,000)Net cash increase due to investing activities........ $ 1,500 Cash flows from financing activities:Proceeds from issuance of common stock................ $ 14,000Proceeds from borrowing........................................... 9,000Repayment of bank loan............................................ (10,000)Payment of dividends................................................. (4,000)Net cash increase due to financing activities........ 9,000 Increase in cash balance................................................ $ 19,500 Beginning cash balance.................................................. 8,000 Ending cash balance....................................................... $ 27,500 E4–12a. (1) The entry is to record rent incurred but not yet paid.(2) The entry is to record the expiration of a previously purchased insurance policy.(3) The entry is to record the expiration of a portion of a fixed asset cost.(4) The entry is to record interest revenue earned but not yet collected.(5) The entry is to record the expiration of a deferred revenue.b. (1) Accrual adjusting entry(2) Cost expiration adjusting entry(3) Cost expiration adjusting entry(4) Accrual adjusting entry(5) Cost expiration adjusting entryE4–13(1) Accrual adjusting entry (7) Investing cash flow(2) Operating cash flow (8) Cost expiration adjusting entry(3) Financing cash flow (9) Operating cash flow(4) Cost expiration adjusting entry (10) Cost expiration adjusting entry(5) Cost expiration adjusting entry (11) Operating cash flow(6) Operating cash flow (12) Cost expiration adjusting entry。
资产负债表(一)一、资产ASSETS流动资产:CURRENT ASSETS货币资金Cash and cash equivalents结算备付金Provision of settlement fund拆出资金Funds lent交易性金融资产Financial assets held for trading应收票据Notes receivable应收账款Accounts receivable预付款项Advances to suppliers应收保费Insurance premiums receivable应收分保账款Cession premiums receivable应收分保合同准备金Provision of cession receivable应收利息Interests receivable其他应收款Other receivables买入返售金融资产Recoursable financial assets acquired存货Inventories其中:原材料Raw materials库存商品(产成品)Finished goods一年内到期的非流动资产Non-current assets maturing within one year其他流动资产Other current assets其中:内部银行Including:In-house bank流动资产合计TOTAL CURRENT ASSETS非流动资产:NON-CURRENT ASSETS发放贷款及垫款Loans and payments可供出售金融资产Available-for-sale financial assets持有至到期投资Held-to-maturity investments长期应收款Long-term receivables长期股权投资Long-term equity investments投资性房地产Investment real estates固定资产(固定资产原价)Fixed assets(Original value of fixed assets)减:累计折旧Less:Accumulated depreciation固定资产净值Fixed assets-net value减:固定资产减值准备Reserve for fixed assets impairment 固定资产净额Net fixed assets在建工程Construction in progress工程物资Project materials固定资产清理Disposal of fixed assets生产性生物资产Productive biological assets油气资产Oil and natural gas assets无形资产Intangible assets开发支出Development costs商誉Goodwill长期待摊费用Long-term deferred expenses递延所得税资产Deferred income tax assets其他非流动资产Other non-current assets其中:特准储备物资Including:Physical assets reserve specifically authorized非流动资产合计TOTAL NON-CURRENT ASSETS资产总计TOTAL ASSETS二、负债LIABILITIES流动负债:CURRENT LIABILITIES短期借款Short-term borrowings向中央银行借款Borrowings from central bank吸收存款及同业存放Deposits from customers and interbank拆入资金Deposit funds交易性金融负债Financial assets held for liabilities应付票据Notes payable应付账款Accounts payable预收款项Payments received in advance卖出回购金融资产款Funds from sales of financial assets with repurchasement agreement 应付手续费及佣金Handling charges and commissions payable应付职工薪酬Employee benefits payable其中:应付工资Including:Wages payable应付福利费Welfare payable其中:职工奖励及福利基Including:Bonus and welfare fund for staff and workers应交税费Taxes and surcharges payable其中:应交税金Including:Taxes payable应付利息Interests payable应付股利Dividends payable其他应付款Other payables应付分保账款Cession insurance premiums payable保险合同准备金Provision for insurance contracts代理买卖证券款Funds received as agent of stock exchange代理承销证券款Funds received as stock underwrite一年内到期的非流动负债Non-current liabilities maturing within one year其他流动负债Other current liabilities其中:内部银行Including:In-house bank流动负债合计TOTAL CURRENT LIABILITIES非流动负债:NON-CURRENT LIABILITIES长期借款Long-term borrowings应付债券Debt securities issued长期应付款Long-term payables专项应付款Specific item payable预计负债Estimated Liabilities递延所得税负债Deferred tax liabilities其他非流动负债Other non-current liabilities其中:特准储备基金Including:Authorized reserve fund非流动负债合计TOTAL NON-CURRENT LIABILITIES负债合计TOTAL LIABILITIES三、所有者权益(或股东权益):OWNERS' EQUITY(or shareholders' equity)实收资本(或股本)Paid-up capital(or share capital)国家资本National capital集体资本Collective capital法人资本Legal person’s capital其中:国有法人资本State-owned legal person's capital集体法人资本Collective legal person's capital个人资本Personal capital外商资本Foreign capital减:已归还投资Less:Investment returned实收资本净额Net paid-up capital资本公积Capital reserves减:库存股Treasury stock专项储备Special reserves盈余公积Surplus reserves其中:法定公积金Statutory surplus reserve任意公积金Other surplus reserve储备基金Reserve fund企业发展基金Enterprise expansion fund利润归还投资Profits capitalized on return of investment一般风险准备Provision for normal risks未分配利润Retained earnings/Undistributed profits外币报表折算差额Exchange differences on translating foreign operations归属于母公司所有者权益合计Total equity attributable to the shareholders of parent companyTotal equity attributable to the shareholders of parent company少数股东权益Minority shareholders' equity (B/S)所有者权益合计TOTAL OWNERS' EQUITY负债和所有者权益总计TOTAL LIABILITIES AND OWNERS' EQUITY资产负债表(二)一、资产ASSETS流动资产: CURRENT ASSETS货币资金Cash and cash equivalents交易性金融资产Financial assets held for trading应收票据Notes receivable应收账款Accounts receivable减:坏帐准备Less:Provision for bad debts预付款项Advances to suppliers应收股利Dividends receivable其他应收款Other receivables存货Inventories其中:原材料Including:Raw materials库存成品及商品Inventory of finished goods低值易耗品Consumbles一年内到期的非流动资产Non-current assets maturing/due within one year 其他流动资产Other current assets流动资产合计TOTAL CURRENT ASSETS非流动资产:NON-CURRENT ASSETS可供出售金融资产Available-for-sale financial assets持有至到期投资Held-to-maturity investments长期应收款Long-term receivables长期股权投资long-term equity investments投资性房地产Investment real estate固定资产(固定资产原价)Fixed assets(Original value of fixed assets)减:累计折旧Less:Accumulated depreciation固定资产净值Fixed assets-net value减:固定资产减值准备Reserve for fixed assets impairment 固定资产净额Net fixed assets在建工程Construction in progress工程物资Project materials固定资产清理Disposal of fixed assets生产性生物资产Productive biological assets油气资产Oil and natural gas assets无形资产Intangible assets开发支出Development costs商誉Goodwill长期待摊费用Long-term deferred expenses递延所得税资产Deferred income tax assets其他非流动资产Other non-current assets非流动资产合计TOTAL NON-CURRENT ASSETS资产总计TOTAL ASSETS二、负债LIABILITIES流动负债:CURRENT LIABILITIES短期借款Short-term borrowings交易性金融负债Financial assets held for liabilities应付票据Notes payable应付账款Accounts payable预收款项Payments received in advance应付职工薪酬Employee benefits payable/Staff remuneration payables应交税费Taxes and surcharges payable应付股利Dividends payable其他应付款Other payables一年内到期的非流动负债Non-current liabilities maturing within one year其他流动负债Other current liabilities流动负债合计TOTAL CURRENT LIABILITIES非流动负债:NON-CURRENT LIABILITIES长期借款Long-term borrowings应付债券Debt securities issued长期应付款Long-term payables专项应付款Specific item payable预计负债Provisions for liabilities递延所得税负债Deferred income tax liabilities其他非流动负债Other non-current liabilities非流动负债合计TOTAL NON-CURRENT LIABILITIES负债合计TOTAL LIABILITIES三、所有者权益(或股东权益):OWNERS' EQUITY (or shareholders' equity)实收资本(或股本)Paid-up capital (or share capital)其中:国家资本National capital集体资本Collateral capital法人资本Legal person's capital个人资本Personal capital外商资本Foreign capital资本公积Capital reserves减:库存股Treasury stock盈余公积Surplus reserves未分配利润Retained earnings/Undistributed profit所有者权益(或股东权益)合计TOTAL OWNERS' EQUITY (OR SHAREHOLDERS' EQUITY)负债和所有者权益(或股东权益)总计TOTAL LIABILITIES AND OWNERS' EQUITY利润表一、营业总收入Overall sales/Overall income其中:营业收入Including: Sales/Income from operations/Income from operations 其中:主营业务收入Sales/Income from main business/Income from main business 其他业务收入Sales/Income from other business/Income from other business 利息收入Interests income已赚保费Insurance premiums earned手续费及佣金收入Handling charges and commissions income二、营业总成本Overall costs其中:营业成本Including: Costs of operations其中:主营业务成本Costs of main business其他业务成本Costs of other business利息支出Interests expenses手续费及佣金支出Handling charges and commissions expenses退保金Refund of insurance premiums赔付支出净额Net payments for insurance claims提取保险合同准备金净额Net provision for insurance contracts保单红利支出Commissions on insurance policies分保费用Cession charges营业税金及附加Taxes and surcharges on operations销售费用Selling and distribution expenses管理费用General and administrative expenses其中:业务招待费Entertainment expenses/Business entertainment研究与开发费Research and development costs财务费用Financial expenses其中:利息支出Interests expenses利息收入Interests income汇兑净损失Foreign exchange net loss资产减值损失Impairment loss on assets加:公允价值变动收益(损失以“-”号填列)Plus: Gain or loss from changes in fair values 投资收益(损失以“-”号填列)Investment income其中:对联营企业和合营企业的投资收益Including: Investment income from joint ventures and affiliates汇兑收益(损失以“-”号填列)Gain or loss on foreign exchange transactions三、营业利润(亏损以“-”号填列)Profit from operations加:营业外收入Plus: Non-operating profit其中:非流动资产处置利得Gain from disposal of non-current assets非货币性资产交换利得Gain from exchange of non-monetary assets政府补助Governmental subsidy债务重组利得Gain of debt restructuring减:营业外支出Less: Non-operating expenses其中:非流动资产处置损失Loss from disposal of non-current assets非货币性资产交换损失Loss from exchange of non-monetary assets债务重组损失Loss of debt restructuring四、利润总额(亏损总额以“-”号填列)Profit before tax加:应弥补亏损Loss to cover减:所得税费用Less: Income tax expenses五、净利润(净亏损以“-”号填列)Net profit其中:被合并方在合并前实现的净利润Among which: Net profit recognized before the merger归属于母公司所有者的净利润Net profit attributable to shareholders of parent company 少数股东损益Minority interest income六、每股收益:Earnings per share (EPS)基本每股收益Basic EPS稀释每股收益Diluted EPS七、其他综合收益Other comprehensive income八、综合收益总额Total comprehensive income归属于母公司所有者的综合收益总额Total comprehensive income attributable to shareholders of parent company归属于少数股东的综合收益总额Total comprehensive income attributable to minority shareholders现金流量表(都要校对一下)一、经营活动产生的现金流量Cash flows from operating activities销售商品、提供劳务收到的现金Cash received from the sales of goods and the rendering of services客户存款和同业存放款项净增加额Net increase in deposits from customers and placements from corporations in the same industry向中央银行借款净增加额Net increase in loan from central bank向其他金融机构拆入资金净增加额Net increase in funds borrowed from other financial institutions收到原保险合同保费取得的现金Cash premiums received on original insurance contracts收到再保险业务现金净额Cash received from re-insurance business保户储金及投资款净增加额Net increase in deposits and investments from insurers处置交易性金融资产净增加额Net increase in disposal of trading financial assets收取利息、手续费及佣金的现金Interest, handling charges and commissions received拆入资金净增加额Net increase in funds deposit回购业务资金净增加额Net increase in repurchasement business funds收到的税费返还Receipts of tax refunds收到其他与经营活动有关的现金Other cash received relating to operating activities 其中:企业内部银行收到的现金Including: Cash received by in-house bank经营活动现金流入小计Sub-total of cash inflows from operating activities购买商品、接受劳务支付的现金Cash payments for goods purchased and services received客户贷款及垫款净增加额Net increase in loans and payments on behalf存放中央银行和同业款项净增加额Net increase in deposits with centre bank and interbank支付原保险合同赔付款项的现金Payments of claims for original insurance contracts支付利息、手续费及佣金的现金Interests, handling charges and commissions paid支付保单红利的现金Commissions on insurance policies paid支付给职工以及为职工支付的现金Cash payments to and on behalf of employees支付的各项税费Payments of all types of taxes支付其他与经营活动有关的现金Other cash payments relating to operating activities经营活动现金流出小计Sub-total of cash outflows from operating activities经营活动产生的现金流量净额Net cash flows from operating activities二、投资活动产生的现金流量:Cash flows from investing activities收回投资收到的现金Cash received from disposals and withdraw on investment取得投资收益收到的现金Cash received from returns on investments处置固定资产、无形资产和其他长期资产收回的现金净额Net cash received from disposals of fixed assets, intangible assets and other long-term assets处置子公司及其他营业单位收到的现金净额Net cash received from disposals of subsidiariesand other business units收到其他与投资活动有关的现金Other cash received relating to investing activities投资活动现金流入小计Sub-total of cash inflows from investing activities购建固定资产、无形资产和其他长期资产支付的现金Cash payments to acquire and construct fixed assets, intangible assets and other long-term assets投资支付的现金Cash payments to acquire investments质押贷款净增加额Net increase in secured loans取得子公司及其他营业单位支付的现金净额Net cash payments for acquisitions of subsidiaries and other business units支付的其他与投资活动有关的现金Other cash payments relating to investing activities投资活动现金流出小计Sub-total of cash outflows from investing activities投资活动产生的现金流量净额Net cash flows from investing activities三、筹资活动产生的现金流量Cash flows from financing activities吸收投资所收到的现金Cash received from investors in making investment in the enterprise其中:子公司吸收少数股东投资收到的现金Including:Cash received from issuing shares of minority shareholders取得借款所收到的现金Cash received from borrowings发行债券收到的现金Proceeds from issuance of bonds收到的其他与筹资活动有关的现金Other cash received relating to financing activities筹资活动现金流入小计Sub-total of cash outflows from financing activities偿还债务所支付的现金Cash repayments of amounts borrowed分配股利、利润或偿付利息所支付的现金Cash payments for distribution of dividends or profits, or cash payments for interest expenses其中:子公司支付给少数股东的股利、利润Including: Subsidiary companies pay cash to minority shareholders for interest expenses and distribution of dividends or profit支付的其他与筹资活动有关的现金Other cash payments relating to financing activities筹资活动现金流出小计Sub-total of cash outflows from financing activities筹资活动产生的现金流量净额Net cash flows from financing activities四、汇率变动对现金及现金等价物的影响Effect of foreign exchange rate changes on cash and cash equivalents五、现金及现金等价物净增加额Net increase in cash and cash equivalents加:期初现金及现金等价物余额Plus:Cash and cash equivalents at beginning of period六、期末现金及现金等价物余额Cash and cash equivalents at end of period本月实际Actual for this month去年同期The corresponding period of last year本年累计Accumulative total for this year行次Line金额Amount项目Item。
operating cash flow公式1.引言在财务分析中,经营现金流(Op er at in gC a sh Fl ow)是衡量企业经营活动现金流入和流出的一个重要指标,它能反映企业经营活动的盈利能力和现金流动性。
本文将介绍op er at in gc ash f lo w的概念以及其计算公式。
2.什么是o perating c ash flow?经营现金流是指企业在经营活动中产生的现金流入和流出的总额。
它反映了企业主要业务活动所引起的现金流量情况,包括销售产品的现金流入、支付供应商的现金流出、支付员工工资的现金流出等。
经营现金流是衡量企业经营活动的真实情况,对经营活动的稳定性和健康发展至关重要。
3. op erating cash fl ow的计算公式o p er at in gc as hf low可以通过以下计算公式来求得:```o p er at in gc as hf low=净利润+非现金项目-营运资本变动```其中,-净利润是企业在经营活动中所获得的净利润,可以从财务报表中获取。
净利润可以反映企业盈利能力的强弱。
-非现金项目包括折旧、摊销、资产减值准备等,它们是虽然没有直接产生现金流动,但会影响企业的税前利润。
-营运资本变动指的是企业经营活动中,应收账款、存货、预付款等资产和应付账款、预收账款等负债的变动。
4.经营现金流计算示例假设某公司在某财年的财务报表中,净利润为100万元,折旧为20万元,应收账款增加了30万元,存货减少了10万元,预付款减少了5万元,应付账款增加了15万元,预收账款增加了8万元。
那么,该公司的经营现金流可以通过以下计算得到:```o p er at in gc as hf low=100万元+20万元-(30万元-10万元-5万元+15万元+8万元)=102万元```5. op erating cash fl ow的意义经营现金流是评估企业经营活动好坏的重要指标,它具有以下几个意义:-经营现金流能够反映企业的经营能力和盈利能力。
Distribution of Net Operating Cash-Flow-at-Risk: the Dynamic Panel Data ModelJing Lou, Liyan Han, Jinxia LiuSchool of Economics & ManagementBeihang UniversityBeijing, P.R.Chinamelonshoot@Abstract—Adopting the basic principles of the comparables approach to measuring Cash-Flow-at-Risk, this paper examines the operating CFaR of Chinese non-financial listed firms with a Dynamic Panel Data estimation based on the comparable industry clusters and the economic determinants of the operating cash flow. The empirical structural functions of the net operating cash flow and the empirical distributions of CFaR are achieved, which provide a solid basis for cash flow risk management. The results show that the representative firm in the comparable industry cluster of construction and real estate industries is exposed to higher operating CFaR than that in the largely monopoly-dominated industry cluster of mining, transport and storage, and utilities industries, while the traditional manufacturing industry shows moderate operating CFaR exposure as compared with the above two industry clusters.Keywords-non-financial firms; Cash-Flow-at-Risk (CFaR); dynamic panel data; industry analysisI.I NTRODUCTIONOperating cash flow is crucial to the survival of a non-financial firm; it is the link between the operating activities and the financing and investing decisions, and the sufficiency of cash flow decides not only the liquidity, but also the appropriate capital structure and risk management policies. In this sense, the identification and measurement of the volatility risk of operating cash flow are of great importance to the corporate strategic investments and risk management decisions.The focus of this paper is a measure of the volatility risk of non-financial firm's operating cash flow known as Cash-Flow-at-Risk (CFaR). It is the cash flow equivalent of Value-at-Risk (VaR) for non-financial firms [1]. CFaR is the maximum cash flow shortfall corresponding to the probability level chosen by the firm. The concept of CFaR is initially originated by [2], which measures the market risk exposure by the sensitivity analysis, estimates the probability of the cash flow realization falling short of the expectation, and proposes hedging strategies for market risks. There have been developed two approaches of measuring CFaR: one is the bottom-up approach which is based on the VaR methodology [3] [4] [5]; the other is the top-down approach put forward by [6], which focuses directly on the total cash flow volatility.The bottom-up measurement of CFaR is an analytical modeling based mainly on tradable market risks. This approach is useful when non-financial firms have confidence in their estimates of risks and in the understanding of the effects of the market prices changing on corporate cash flows. But in reality, the corporate risk exposures are so complex and multifaceted that it is impossible to model all of them, and then the bottom-up approach will capture only a small part of the firm's overall exposures and thus lead to inaccurate estimates of the overall CFaR.By contrast, the top-down approach focuses on the total cash flow volatility, which reflects the combined effect of all the relevant risks facing a non-financial firm. Such volatility can be estimated from a firm's historical cash flows. When there are insufficient cash flow observations, Stein et al. [6] propose a comparables method to estimate a pooled cash flow distribution of a large number of comparable companies in order to gain a statistically significant estimate of volatility. The advantage of such an approach is its ability to provide systematically unbiased estimate of CFaR, and it can be easily and at relatively low cost applied to any number of non-financial firms, though it has the drawback that it does not provide an estimate of CFaR conditional on market risks.There are few studies on the subject of the risk management of non-financial firms' operating cash flows in China currently. In this paper, adopting the basic principles of the top-down, comparables-based approach to estimating Cash-Flow-at-Risk, we examine the operating CFaR of Chinese non-financial listed firms with a Dynamic Panel Data estimation based on the comparable industry clusters and the economic determinants of the operating cash flow. We believe our study contributes to the understanding of the volatility risk properties of Chinese non-financial listed firms' operating cash flows, which will provide a solid basis for the corporate risk management decisions.The rest of the paper is organized as follows: Section Ⅱpresents the measurement of CFaR and the data set; Section Ⅲprovides the industry cluster comparables method; Section Ⅳpresents the estimation results of our work; Section Ⅴconcludes.Project supported by the Specialized Research Fund for the DoctoralProgram of Higher Education of China (No. 20050006025) and NationalNatural Science Foundation of China (No. 70521001).978-1-4244-4639-1/09/$25.00 ©2009 IEEEII. M EASUREMENT OF CF A RA. Modeling CFaRCFaR is defined as the maximum cash flow shortfall corresponding to the probability level chosen by the firm. Formally, if cash flow is C and expected cash flow is E(C), CFaR is defined as follows:()().Prob C -E C <-CFaR =p% (1) Different from the time series model in [6], we propose aDynamic Panel Data (DPD) model combing the information from both the cross section dimension and time series dimensions, with the significant determinants of operating cash flow identified by our previous study [7]. Based on firm-level data, CFaR is measured by AR(1) defined as follows:it i,t-1it i t it CF =rCF +b X +f +d +e ′ (2)where CF is the firm's net operating cash flow, scaled bythe firm size; X, the control variables including inventory leveland capital intensity. The subscript i indexes firms, and t , time.i f denotes the firm-specific fixed effect variable, t d representsthe time-specific fixed effect variable, and it e is the residual set apart from the system risk, the distribution of which is the empirical distribution of CFaR. We estimate the above DPD model by GMM, using lagged regressors as instruments. B. Data and Variables The study relies on a primary sample of non-financial firmsin the China Stock Market Accounting Research (CSMAR) database. For the consistency of the data without the interruption of the changing in the accounting standards in China, the time period is selected from 1998 to 2005.The variable of interest is the annual net operating cash flow (NETLEVEL), and the control variables are defined as follows: firm size (SIZE) is measured by the total assets; inventory level (INVRATIO) is measured by the ratio of inventory to total assets; capital intensity (CAPIRATIO) is measured by the ratio of depreciation to sales. Due to the firm size effects [7], all the net operating cash flows (NETLEVEL) are scaled by the firm assets (SIZE): NETRATIO = NETLEVEL/SIZE.Firms are excluded from the sample if they are in either of the two cases: firms are tagged as Special Treatment (ST) or Particular Transfer (PT) by China Securities Regulatory Commission; firms have missing values of any of the aforementioned variables during the period 2003–2005 in order that there are at least three latest observations available for each firm.After the data preprocessing, the sample includes companies from all the 11 non-financial industry categories in accordance with China's Guidelines on Industry Classification of Listed Companies except the communication and cultural industry category due to the lack of sufficient observations:agriculture, forestry, livestock farming, fishery; mining; manufacturing; electric power, gas and water production and supply; construction; transport and storage; information technology; wholesale and retail trade; real estate; social service; comprehensive industry.Due to the fact that there are even less available operating cash flow data for Chinese non-financial listed firms, we build the estimation of CFaR on the comparable industry clusters. The comparable industry clusters method is detailed in the nextsection.III. T HE INDUSTRY CLUSTER COMPARABLES METHODIn our previous study on the determinants of the operating cash flow of non-financial firms in China [7], we observe the significant differences in the operating cash flows between industries; at the same time, we also notice that there are linkages between industries' operating cash flows. A country's economy is after all an organic whole, in which any industry is connected with the others through raw materials purchases, transportation and product sales. Operating cash flows and goods flows are the very links between industries. Due to suchlinkages, it is expected that there is comparability in thedistribution patterns of the industries' operating cash flows.We investigate the distribution patterns of the net operating cash flows of the 11 sample industries by hierarchical clusteranalysis based on the distributing characteristics of the netoperating cash flows, i.e. the 5th, 10th, 25th, 50th, 75th, 90th and 95th percentiles of the industry net operating cash flows (squared Euclidean distance and Ward's method used).Grounded on the cluster analysis results (see Fig. 1) andChina's economy properties, we group the 11 sample industriesinto four clusters: the mining, transport and storage, electric power, gas and water production and supply industries as the basic industry cluster; real estate, construction industries as the real estate & construction industry cluster; the manufacturingindustry as a cluster by itself due to its wide sub-category range and enormous numbers of firms; the other industries as anotherindustry cluster.Figure 1. The cluster analysis result of the net operating cash flows ofsample industries.In the following parts of this paper, we treat the industry cluster as a studying unit; the firms in the same industry cluster are considered as comparables. With this method, we can investigate the distribution patterns and risk characteristics of the net operating cash flows of the representative firm of theindustry cluster, and solve the problem in the estimation owing to the lack of existing operating cash flow observations.IV.E STIMATION RESULTSWe estimate the coefficients given in (2) by GMM. In the following part we will mainly focus on the comparisons of the basic industry cluster, the real estate & construction industry cluster and the manufacturing industry cluster. In Table Ⅰ we report the results of the model after the fixed effects have been removed by orthogonal deviations [8]; yr1999–yr2004 are the time dummies, other variables definition see Section Ⅱ for details.TABLE I. R ESULTS OF THE DPD AR(1)Industry ClusterBasicIndustryReal estate &ConstructionManufacturingN firms 64 32 405 N obs 288 173 2111NETRATIO(–1) 0.1565***(11.09)–0.1010**(–2.14)–0.2325***(–3.69)INVRATIO –0.3555***(–16.79)–0.2239***(–4.51)–0.2258**(–2.51)CAPIRATIO 0.1014***(12.69)–0.0834(–0.7)0.1702**(2.22)yr1999 –0.0351***(–9.05)–0.0467***(–3.6)–0.0211***(–3.32)yr2000 –0.0126***(–2.94)–0.0298***(–3.7)–0.0077(–1.48)yr2001 –0.0063**(–2.22)–0.0325***(–2.99)–0.0129***(–2.74)yr2002 0.0031(0.93)–0.0149(–1.52)–0.0076(–1.53)yr2003 –0.0110***(–5.13)–0.0148*(–1.97)–0.0082**(–1.97)yr2004 0.0021(0.94)–0.0000(0)–0.0121***(–3.26)The instruments are the 2–5 lags of the regressors. Due to collinearity, the sample period is adjusted to 1999–2004. Heteroskedasticity adjusted t-statistics are in parentheses. *Indicates significance at the 10% level. **Indicates significance at the 5% level. ***Indicates significance at the 1% level. The Sargan testconfirms the validity of the instruments.The results show that the inventory level (INVRATIO) has negative effects on the net operating cash flows of all the three industry clusters. The basic industry cluster shows a coefficient of –0.3555, whose absolute value is about 58% higher than those of the real estate & construction industry cluster and the manufacturing industry cluster, the coefficients of which are –0.2239 and –0.2258 respectively. This result shows that in the low inventory-leveled basic industry cluster, the firm's net operating cash flow has higher sensitivity to the inventory factor than that in the real estate & construction industry cluster, of which the average inventory level is 0.3849 compared to 0.0406 of the basic industry cluster (see Table Ⅱ).The capital intensity (CAPIRATIO) has positive effects on the net operating cash flows of the basic industry cluster and the manufacturing industry cluster. The manufacturing industry cluster shows a coefficient of 0.1702, much higher than that of the basic industry cluster. This result suggests that in the traditional manufacturing industries, the firm's net operating cash flow has higher sensitivity to the capital intensity factor, which means an appropriate increase of the operating leverage will lead to a higher increase in net operating cash flows. In contrast, the coefficient of the basic industry cluster is only 0.1014, suggesting that in the typical fixed-asset intensified industries such as the mining, transport and storage, electric power, gas and water production and supply industries, the firm's net operating cash flow becomes much insensitive to the capital intensity factor. The coefficient of the real estate & construction industry cluster is –0.0834, negative but insignificant.TABLE II. S UMMARY STATISTICS FOR MAIN VARIABLES 1998–2005 IndustryClusterVariable MeanStandardDeviation Basic IndustryNETRATIO 0.0882 0.0720INVRATIO 0.0406 0.0769CAPIRATIO 0.1161 0.1339Real estate &ConstructionNETRATIO 0.0130 0.0919INVRATIO 0.3849 0.2303CAPIRATIO 0.0095 0.0921 ManufacturingNETRATIO 0.0490 0.0751INVRATIO 0.1482 0.0939CAPIRATIO 0.0389 0.0965 The distribution of the residuals of (2) is the empirical distribution of the operating CFaR. The empirical distributions of the operating CFaR of the three industry clusters are shown in Fig. 2, and the percentiles of the empirical distributions are presented in Table Ⅲ. The Jarque-Bera test rejects that the empirical distributions of the operating CFaR are normal distributed; the measure of skewness shows that the distribution of the real estate & construction industry cluster is negative skewed, while the other two industry clusters are positive skewed; the measure of kurtosis shows that the distributions of all the three industry clusters are leptokurtic.TABLE III. CF A R EMPIRICAL PERCENTILES OF THE INDUSTRY CLUSTERSBasicIndustryReal estate &ConstructionManufacturing P1 –0.1493–0.3133 –0.2288 P5 –0.0994–0.1683 –0.1245 P10 –0.0760–0.1150 –0.0882 P25 –0.0430–0.0520 –0.0433 P50 –0.01060.0048 –0.0035P75 0.04110.0585 0.0433P90 0.09170.1018 0.0963P95 0.12690.1588 0.1273P99 0.18450.2732 0.2176Skewness 0.1006 –0.2716 0.5347Kurtosis 5.5594 5.1934 11.8982Jarque-BeraP value0 0 0P1–P99 are the 1st to the 99th percentiles.Before analyzing the distributions of the operating CFaR, we will first have a look at the operating characteristics of the industry clusters, particularly the real estate & construction industry cluster and the basic industry cluster.Regarding the industry operating characteristics of the aforementioned two clusters, there are fundamental differences. The industries in the real estate & construction industry cluster are well-known for the long investment recovery term, large investment budgets, and high capital intensification. The product market for the two industries are strongly sensitive tothe macroeconomic circumstances and demands are subject togreat fluctuations, while in Chinese capital market these two highly-leveraged industries are confronted with stricter financing constraints.In contrast, the three industries in the basic industry cluster have the features of being large asset-scaled, highly policy-oriented, and largely monopoly-dominated. These three industries play an essential role in the functioning of China's society and economy, being the critical industrial infrastructures of China's economic operation and development. The demands in the product markets for these industries areless fluctuant, and the prices are under strict governmentregulation. In this sense, the volatilities of the operating cash flows of these industries are relatively low. Besides, these industries have less strict financing constraints in that they haveeasier access to the government funds support. Therefore, the basic industry cluster is expected to have lower sensitivity to the operating cash flow risk exposure than the real estate & construction industry cluster.The empirical distributions of the net operating CFaR areconsistent with the prior expectations. In Fig. 2 it is shown thatthe real estate & construction industry cluster has higher net operating cash flow risk exposure than the basic industry cluster. This result suggests that the representative firm in the real estate & construction industry cluster is exposed to higher operating CFaR than that in the largely monopoly-dominated basic industry cluster, while the traditional manufacturing industry cluster shows moderate operating CFaR exposure ascompared with the other two industry clusters.Figure 2. Empirical distributions of CFaRs of the industry clusters.At the 5th percentile of the empirical distributions (see Table Ⅲ), the operating CFaR of the real estate & construction industry cluster is –0.1683 (as noted in Section Ⅱ, all operatingCFaRs have been scaled by firm assets), while the corresponding figure for the basic industry cluster is only –0.0994. In other words, for the representative firm in the real estate & construction industry cluster, a five-percent worst-case scenario involves operating cash flow falling short ofexpectations by $16.83 per $100 of assets; for the basic industry cluster the corresponding figure is $9.94, reaching only 59.06% of the former figure. Moreover, at high levels of risk (low CFaR values at the left tail in Fig. 2), the operating CFaR of the real estate & construction industry cluster is decreasing more sharply: at the 1st percentile (see Table Ⅲ), itsCFaR reaches –0.3133, while the corresponding figure for the basic industry cluster is –0.1493, only 47.65% of the formerfigure. By contrast, at low levels of risk (high CFaR values at the right tail in Fig. 2), it is shown obviously that the CFaR ofthe real estate & construction industry cluster is accelerating much more quickly than the other two industry clusters', whichsuggests that when faced with positive shocks the firms in the real estate & construction industry cluster respond more effectively and flexibly, and thus produce more excess operating cash flows. On the whole, the real estate & construction industry cluster exhibits higher operating cash flow risk leverage. In contrast, the industries in the basic industry cluster are under muchstricter government regulation and the ability to adjust prices to their advantage is bounded; therefore, when faced with positive shocks, the ability of the basic industry cluster to produce excess cash flows, by seizing the operating and investingopportunities, is lessened. As for the manufacturing industry cluster, as presented in Fig. 2 its CFaR empirical distribution lies between the other two clusters: for example, at the 1st percentile of the empirical distributions (see Table Ⅲ), the operating CFaR of the manufacturing industry cluster is –0.2288; of which the absolute value is 73.03% of the corresponding figures of the real estate & construction industry cluster, and 153.25% of the basic industry cluster; while at the 99th percentile the CFaR of the manufacturing industry cluster is 0.2176, slightly largerthan 0.1845 of the basic industry cluster, but only 79.65% of 0.2732 of the real estate & construction industry cluster. Considering the overall distribution of the operating CFaR, the traditional manufacturing industry cluster exhibits moderate operating CFaR exposure as compared with the basic industry cluster and the real estate & construction industry cluster, which is consistent with our expectations.V.C ONCLUSIONSIn this paper we examine the operating CFaR of Chinese non-financial listed firms with a Dynamic Panel Data (DPD) estimation based on the comparable industry clusters and the economic determinants of the operating cash flow. The comparable industry clusters analysis shows that the mining, transport and storage, electric power, gas and water production and supply industries are grouped as the basic industry cluster; real estate, construction industries as the real estate & construction industry cluster; the manufacturing industry as a cluster by itself due to its wide sub-category range and enormous numbers of firms.Based on the comparable industry clusters, we propose a Dynamic Panel Data estimation model with the economic determinants of the operating cash flow (asset, inventory and capital intensity). The empirical results suggest that the representative firm in the real estate & construction industry cluster is exposed to higher operating CFaR than that in the largely monopoly-dominated basic industry cluster, while the traditional manufacturing industry shows moderate operating CFaR exposure as compared with the other two industry clusters.We believe our paper contributes to the understanding of the properties of the operating cash flow volatility risk of Chinese non-financial listed firms. The results of this paper can be considered as a base to make corporate risk management decisions and to decide the appropriate financial structure for operating and investing projects. A side product of this paper is the comparable industry-cluster based approach could be extended to explore the dynamics of the transmission and diffusion of the cash flow risks between industries. We intend to pursue these results in another paper.R EFERENCES[1]G. Alesii, “VaR in real options analysis,” Review of FinancialEconomics, vol. 14, 2005, pp. 189–208.[2]G. Hayt and S. Song, “Handle with sensitivity,” RISK Magazine, vol. 8No. 9, 1995, pp. 94–99.[3] C. Turner, “Var as an industrial tool,” RISK Magazine, vol. 9 No. 3,1996, pp. 38–40.[4] D. Shimko, “Cash before Value,” RISK Magazine, vol. 11 No. 7, 1998,pp. 45.[5] A. Y. Lee, J. Kim, A. M. Malz and J. Mina, “CorporateMetrics: thebenchmark for the corporate risk management,” Technical document, Riskmetrics Group, formerly Risk Management Products and Research Group at J. P. Morgan, New York, London, 1999.[6]J. Stein, S. E. Usher, D. La Gattuta and J. Youngen, “A comparablesapproach to measuring Cashflow-at-Risk for non-financial firms,”Journal of Applied Corporate Finance, vol. 4 No. 13, 2001, pp. 8–17. [7]L. Y. Han, J. Lou and J. X. Liu, “Influential factors analysis foroperating cash flow: evidence from Chinese listed firm,” unpublished. [8]M. Arellano and O. Bover, “Another look at the instrumental variablesestimation of error-component models,” Journal of Econometrics, vol.68, 1995, pp. 29–51.。