5.1. Fire design in Europe
M. Heinisuo & M. Laasonen
Tampere University f Technology, Finland
J. Outinen
Rautaruukki Oyj, Finland
5.1.1 INTRODUCTION
European countries have started applying Eurocodes to fire design. In the past they used to have separate structural and fire codes, which are now integrated into a single standard system. Earli-er, let’s say, fire loads and mechanical loads were defined in different sources, but now both are in given in the EN 1991 series.
Performance based fire design was created long ago but is still a new concept in many coun-tries. In Sweden and UK, the countries that have most experience from it, local authorities still have a great influence on which solutions are approved locally especially as concerns fire de-sign.
Performance based design is frequently used to design the evacuation and exit routes of buildings and to estimate smoke and toxin propagation. Due to the huge improvements in me-thods, computing facilities and know-how of engineers, performance based design can now be used to estimate temperatures in fire compartments and load bearing structures. That allows cal-culating the resistance of structures in fire.
The developments in fire design have led to close co-operation between authorities, clients, architects and fire safety, mechanical and structural engineers in actual projects. Co-operation is always important, and performance based design intensifies it in projects. It results in better fire safety of buildings, because the fire scenarios and related risks have to be analysed carefully when using performance based fire design.
This study shows the situation with respect to fire Eurocodes and performance based design in 10 European countries presently. A case study that promotes the design of load bearing struc-tures ex-posed to fire is also included. The fire scenarios and corresponding design fire pack-ages for a large sports centre built in Helsinki, Finland are presented as well as the results of the fire simulations.
5.1.2 EUROPEAN RULES
5.1.2.1Scope of the study
European countries are starting to apply the EN standards for buildings. They include principles and application rules for fire resistance design of buildings which also allow performance based fire design. What is the situation with respect to applying the EN standards for fire resistance de-sign and, especially, performance based design? What kinds of applications of performance based fire design do we have experiences from? These were the main questions to which we sought an-swers from members of the COST C26 during spring 2008. A short summary of the results fol-lows. The questions and further details can be found in Heinisuo (2009). Answers were received from ten countries (three from UK). Table 5.1.1 shows the introduction of EN standards and the countries which answered the questions.
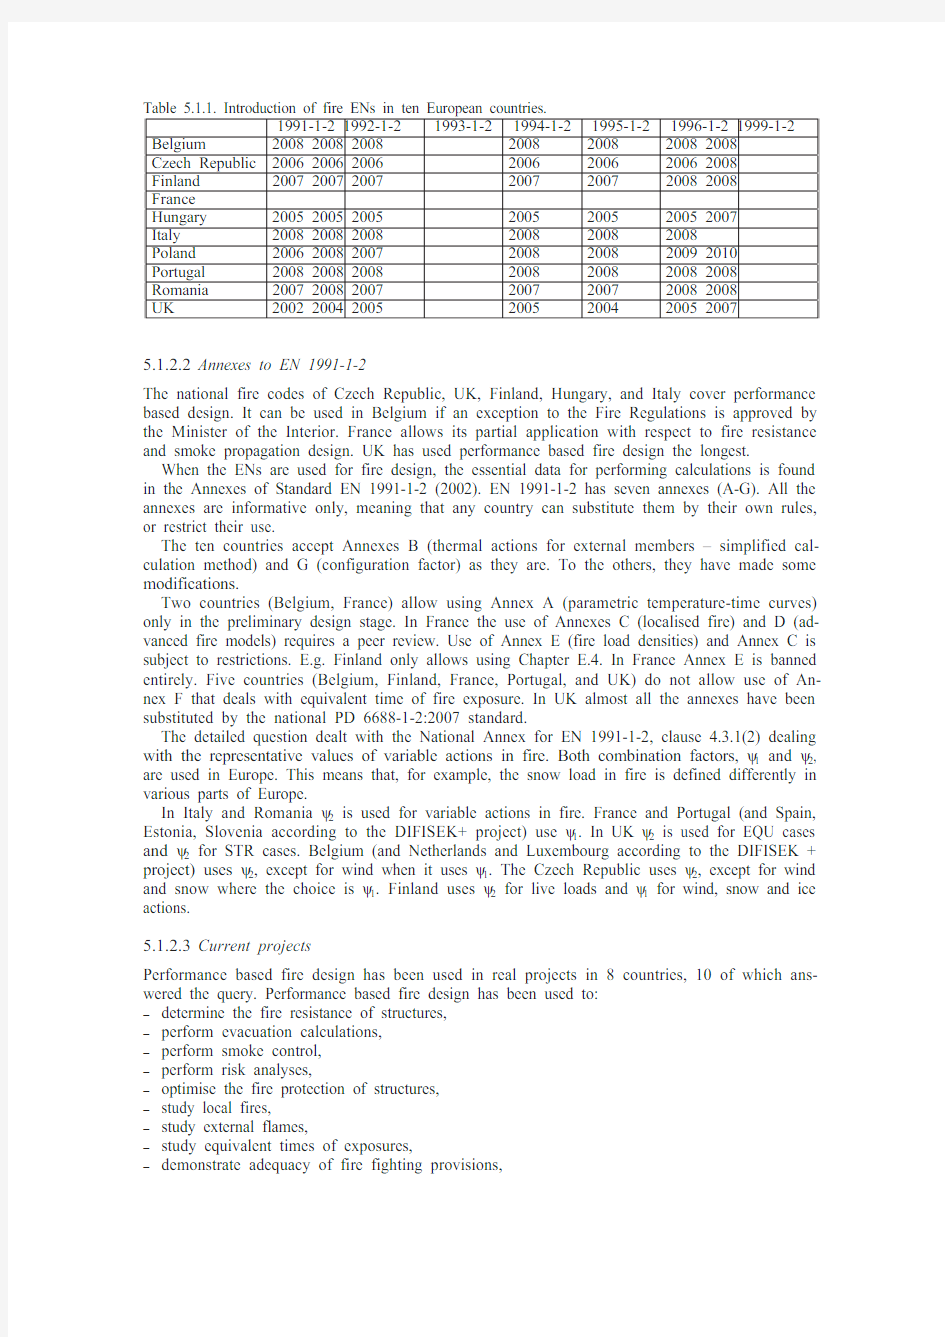
Table 5.1.1. Introduction of fire ENs in ten European countries.
1991-1-2 1992-1-21993-1-21994-1-21995-1-21996-1-2 1999-1-2 Belgium 2008 2008 2008200820082008 2008 2006 2006 2006200620062006 2008 Czech Republic
Finland 2007 2007 2007200720072008 2008 France
Hungary 2005 2005 2005200520052005 2007 Italy 2008 2008 2008200820082008 Poland 2006 2008 2007200820082009 2010 Portugal 2008 2008 2008200820082008 2008 Romania 2007 2008 2007200720072008 2008 UK 2002 2004 2005200520042005 2007
5.1.2.2Annexes to EN 1991-1-2
The national fire codes of Czech Republic, UK, Finland, Hungary, and Italy cover performance based design. It can be used in Belgium if an exception to the Fire Regulations is approved by the Minister of the Interior. France allows its partial application with respect to fire resistance and smoke propagation design. UK has used performance based fire design the longest.
When the ENs are used for fire design, the essential data for performing calculations is found in the Annexes of Standard EN 1991-1-2 (2002). EN 1991-1-2 has seven annexes (A-G). All the annexes are informative only, meaning that any country can substitute them by their own rules, or restrict their use.
The ten countries accept Annexes B (thermal actions for external members – simplified cal-culation method) and G (configuration factor) as they are. To the others, they have made some modifications.
Two countries (Belgium, France) allow using Annex A (parametric temperature-time curves) only in the preliminary design stage. In France the use of Annexes C (localised fire) and D (ad-vanced fire models) requires a peer review. Use of Annex E (fire load densities) and Annex C is subject to restrictions. E.g. Finland only allows using Chapter E.4. In France Annex E is banned entirely. Five countries (Belgium, Finland, France, Portugal, and UK) do not allow use of An-nex F that deals with equivalent time of fire exposure. In UK almost all the annexes have been substituted by the national PD 6688-1-2:2007 standard.
The detailed question dealt with the National Annex for EN 1991-1-2, clause 4.3.1(2) dealing with the representative values of variable actions in fire. Both combination factors, ?1 and ?2, are used in Europe. This means that, for example, the snow load in fire is defined differently in various parts of Europe.
In Italy and Romania ?2 is used for variable actions in fire. France and Portugal (and Spain, Estonia, Slovenia according to the DIFISEK+ project) use ?1. In UK ?2 is used for EQU cases and ?2 for STR cases. Belgium (and Netherlands and Luxembourg according to the DIFISEK + project) uses ?2, except for wind when it uses ?1. The Czech Republic uses ?2, except for wind and snow where the choice is ?1. Finland uses ?2 for live loads and ?1 for wind, snow and ice actions.
5.1.2.3Current projects
Performance based fire design has been used in real projects in 8 countries, 10 of which ans-wered the query. Performance based fire design has been used to:
determine the fire resistance of structures,
perform evacuation calculations,
perform smoke control,
perform risk analyses,
optimise the fire protection of structures,
study local fires,
study external flames,
study equivalent times of exposures,
demonstrate adequacy of fire fighting provisions,
demonstrate functioning of escape routes,
demonstrate the existence of an acceptable standard of safety for complex buildings with large numbers of people and/or large open spaces.
There are many examples of different kinds of applications of performance based fire design in Europe. Typically performance based fire design has been used in large projects, but it is now gaining ground also in smaller ones. Typical projects using it include:
shopping centres,
office buildings,
airports,
hospitals,
residential buildings,
stadiums,
music halls,
underground facilities,
industrial buildings,
historical buildings,
high rise buildings,
car parks,
libraries,
churches,
monumental buildings,
warehouses.
One interesting project involved a cruiser.
When performance based fire design is used, approval of the design by the third party may or may not be required. Typically no specific qualification is required of the fire designer, but many countries may require some proof of competence in the future. E.g. Finland grants certifi-cates to skilled fire safety and structural engineers, and authorities frequently require their par-ticipation in projects where performance based fire design is used. Requirements for the docu-mentation of fire design are set by 50 % of the countries.
The main problems related to performance based fire design are: lack of experience and con-fidence of authorities, definition of design fires and parameters in some cases, and lack of de-sign tools. Heinisuo (2009) lists the software used in fire design of:
fire simulations,
evacuation simulations and
resistance checks of members.
Some ideas about the level of education of fire design engineers were gleaned from the an-swers. Generally the education of fire engineers seems to be of a very low level in the 10 coun-tries involved. In Czech Republic, France and Poland some improvements are planned. Sweden is a country where sector education is first rate.
5.1.3C ASE STUDY
5.1.3.1Salmisaari Sports Centre
Salmisaari Sports Centre is located in the middle of Helsinki, Finland. The building will be ready for use in April 2010. The floor area of the building is 22,200 m2 and its volume 167,700 m3. The main contractor is YIT Rakennus Oy. The architects and consulting structural and fire engineers are A rkkitehtitoimisto Pekka Lukkaroinen Oy and Finnmap Consulting Oy and L2 Paloturvallisuus Oy, respectively. The load bearing structures were delivered by Ruukki Con-struction Oy.
The length, width and height of the building are about 136, 35 and 36 metres. There are four stories, each 8-10 metres high. Each storey has a space about 30 m wide supported by 30 m span trusses located at every 5 metres. These trusses are innovative structures used in some Finnish projects: the top chord is made of a welded slim floor box beam that supports pre-stressed hol-low core concrete slabs, the braces are of tubular steel and the bottom chord is a flat steel bar.
The trusses are about 3 m high. That leaves a lot of space for installations below the floors. The columns supporting the trusses are reinforced concrete filled steel tubes. A general view and the space examined in this study are shown in Figure 5.1.1.
Figure 5.1.1. General view and the examined space.
Performance based fire design was applied in this project only to trusses. Fire actions were determined for the parts of the building topped by trusses. The intended uses of the spaces be-low the trusses are:
First floor: two ice hockey rinks (total area 4200 m2).
Second floor: Bowling, martial arts and restaurants (2000 m2).
Third floor: Adventure place for children (2000 m2), beach volley (780 m2) and badminton (570 m2).
Fourth floor: dancing (900 m2).
Climbing wall, area 170 m2, and max. height 30 m.
Fire actions were determined for the intended uses of the spaces, and for the following special cases:
Ice resurfacing machine fire,
Storage fire with flashover,
Coat-rack fire,
Plastic slide fire,
Stage fire (abnormal use),
Stand fire (abnormal use),
Climbing equipment fire.
The fire safety plan was prepared by the fire engineers of the project. Fire compartments were partitioned using EI60 structures. The fire compartments consist of stairwells, exit areas, storage spaces, offices, saunas, dressing rooms and special facilities. According to the safety plan, the building should have the following fire safety equipment:
Initial extinguishing equipment, consisting of: one portable extinguisher per 300 m2 or hose reels.
Automatic alarm system covering the whole building.
Smoke extraction, mainly by the fire brigade.
Automatic sprinkler system.
According to CEA (1998) requirements, the sprinkler system should be able to detect and put out a fire in its early stage, or to restrict the spread of fire until the fire brigade arrives.
Fire actions are determined based on fires which may occur in different spaces (during in-tended use, special use and abnormal use). The effects of the sprinkler system are taken into ac-count when defining design fires. Traditionally the effects of the actions of the fire brigade and other fire fighting measures are not taken into account in defining design fires. Fire brigade ac-tions are taken into account in the following references: Tillander et al. (2009), Karhula & Hie-taniemi (2008), NFPA (1996), Barry (2002) and Hietaniemi (2008).
A summary of the definitions of design fires used in the performance based fire design of this project is given below. More details are given in a report by Hietaniemi (2009). In Finland it is not possible to use Annex E.1 of EN 1991-1-2 (not applicable) to define the fire activation risk
due to the size of the compartment and the type of occupancy, which is why probability analysis was used in this study. Fire load densities were determined based on national fire load classifi-cations of occupancies and by conducting a fire load survey using both analysis and synthesis of experimental data as well as modelling and fire simulation.
The fire scenarios and all details of the fire load calculations were approved by the local au-thorities, the client and the fire safety and structural engineers of the project before fire simula-tions and structural calculations were done.
5.1.3.2Fire actions based on intended uses of spaces
The following properties are supposed to be valid for the sprinklers:
RTI = 110 m1/2 s1/2
Activation temperature is 67 q C
Protection area A r of one sprinkler is 12 m2.
The defect frequency of sprinklers is 3 % according to International Fire Engineering Guide-lines (2005). Assuming a floor area of 5000 m2, and a 12 m2 protection area, about 500 sprin-klers are required on that floor. Then the probability is that one of those sprinkler heads is de-fective. Let us then suppose that this defective sprinkler head is just above the starting point of the fire. The resulting fire scenario would be a so-called local fire in the sprinklered building where:
The other sprinklers restrict the fire to the protection area of one sprinkler.
Fire intensity is defined by the use of the space under consideration, as shown later.
Let us then consider the failure of the entire sprinkler system. That can be estimated by the defect flow of Figure 5.1.2. The sources of the initial data are the following:
Pump defect, Isaksson et al. (1998),
Duct defect and water source defect, Isaksson et al. (1998),
Installation defect, Korpela (2002).
The probability for failure of the entire sprinkler system is about 0.00197 § 0.2 % according to the estimate. On that basis a second fire scenario is created involving a so-called global fire in the sprinklered building:
After sprinkler activation the fire intensity is doubled from the value defined based on the use of the space at sprinkler activation time and it remains constant. The doubling pro-vides the extra safety required by authorities in this case.
So we end up with two fire scenarios, the first one based on local sprinkler defects and the second one on the failure of the entire sprinkler system. They are graphically demonstrated in Figure 5.1.3. In the first case the fire decays either due to a lack of oxygen or combustible ma-terial in the space. The fire is local within an area of 12 m2 and should be applied to the most severe locations in the building. The second fire is not dying down and engulfs the whole floor under consideration.
Figure 5.1.3. Schematic fire loads (heat release rates, HRR in MW), local (left) and global (right) fires.
The local and global fires in a sprinklered building defined above were assumed to occur at
the most severe locations in the building.
The special uses, including abnormal uses, and corresponding fires were also assumed to oc-
cur in the building. The probabilities of these fire activations resulting from the size of the com-
partments and the occupancies are given in Table 5.1.2. The probabilities were calculated based
on Tillander et al. (2009) for a 50 year period. Probabilities for abnormal uses were calculated
assuming their occurrence once a month.
The probabilities for local and global fires are given in Hietaniemi (2009).
Table 5.1.2. Probability of fire activations and sprinkler defects during 50 years of special uses of spaces.
First floor Second floor
Third floor Fourth floor Ice machine Storage Coat-rack Plastic slide Stand
(abnormal) Stage (abnormal)A r (m
2) 4200 45122000260 900
A r /A tot 0.221 0.0020.00060.100.013 0.047
Fire activation 6.8 E-01 1.2 E-02 3.2E-03 4.2E-01 5.8E-03 2.0 E-02
Sprinkler defect 3.3 E-02 3.6 E-049.7E-05 1.6E-02 1.7E-04 6.0 E-04
Next we shall consider the fire load intensities q’’ [MJ/m 2] for local and global fires. These
can be estimated based on local regulations and experimental data.
Finnish regulations (Ymp?rist?ministeri? (2002)) state that the value for stores should be
more than 1200 MJ/m 2. For shops, exhibitions halls and libraries its proper range is 600-1200
MJ/m 2. For restaurants, smaller than 300 m 2 shops, offices, schools, sports halls, theatres,
churches, and similar buildings the value is below 600 MJ/m 2. Based on the above, the maxi-
mum value for sporting areas is 600 MJ/m 2.
Measured data (International Fire Engineering Guidelines (2005)) yielded 421 fire load inten-
sities for production spaces, which are clearly higher than in our cases. The mean of the sample
was 530 MJ/m 2 and the deviation 540 MJ/m 2. The 3-parameter gamma distribution was used
with the following results: 80 % fractile = 600 MJ/m 2 and 95 % fractile = 1100 MJ/m 2, see Fig-
ure 5.1.4.
Figure 5.1.4. Fire load intensity distribution for production space.
min min
HRR HRR
Based on these estimations, the following fire load intensities were used in this study: 600 MJ/m 2 for the spaces meant for sporting (80 % fractile for generic fire intensity distribu-
tion). 1100 MJ/m 2 for other spaces excluding stores (95 % fractile for generic fire load intensity
distribution).
Next we shall consider the corresponding fire release rates (HRRPUA , Heat Release Rate Per
Unit Area). Table 5.1.3 draws on data from Hietaniemi (2007). It presents the fire load intensi-
ties and corresponding fire release rates. The origin of each data line is given in Hietaniemi
(2007).
Table 5.1.3. Sample of HRRPUA and q’’
values.
Item
t g [s] HRRPU A [kW/m 2] q’’ [MJ/m 2] Wood pile (4 pieces) 209-409469-2156703-1561
Stack of pallets (2 pieces) 600-9003062-41051500-2250
One plastic chair 900600160
Stack of plastic chairs 11076001140
Two stacks of plastic chairs 11043001450
Sports bags 42013241829
Fair stand 150********
Litter basket (2 pieces)140-14501200-1400400-422
Carton 150********
Work point in office (8 pieces) 115-225820-1799376-914
Television 930500
Washing machine 2731422639
Washing machine in cabinet 56314831054
Refrigerator 66019211031
Polyester coat 72025040
Coat-rack (2 pieces) 150-210188-19090-125
Shoe store 80 25001760
Speciality shop 71 29002900Armchair 1205480980
Sofa (2 pieces) 110-1103120-3375727-940
Unprotected mattress 145527126
Protected mattress 360343
The close correlation between fire load intensity and heat release rate per unit area is shown
by Figure 5.1.5.
Figure 5.1.5. HRRPUA versus fire load intensity.
Thus, fire release rates can be estimated based on fire load intensities: For sporting areas the mean fire release rate is 1000 kW/m 2 and its 5 % and 95 % fractiles are
800 kW/m 2 and 1100 kW/m 2 (see Figure 5.1.6 a)). For other spaces (excluding stores) it is 1900 kW/m 2 and its 5 % and 95 % fractiles are 1600
kW/m 2 and 2100 kW/m 2 (see Figure 5.1.6 b)).
Figure 5.1.6. HRRPUA for two types of spaces, shading indicates values between 5 % and 95 % fractiles.
Next, we fit the local fire (A r = 12 m 2) curve of Figure 5.1.3 to the data above. In the growing
phase we use the t 2 curve including the time t g needed to reach a heat release rate of 1 MW. In
the decay phase we use an exponential curve including a creeping factor of 30 % of total heat
release based on experimental values. Fire intensity is:
The height H f of the fire source can be estimated using the equation 1.
°°°°ˉ
°°°°?-! d d d ??1·¨¨?§ )()exp()(022max 21max 120phase decay t t when t t Q t t t when Q phase growing t t when t t Q t Q g (1)
where Q 0 = 1 MW, t g = 150 s, W is the creeping factor and t 1 and t 2 are the limit times for uni-
form fire intensity.
The result for the sports area is shown in Figure 5.1.7 a) and for other areas in Figure 5.1.7 b).
The maximum HRR for the sports area is little below 15 MW and for other spaces little over 25
MW.
Figure 5.1.7. Local design fires and their parameters.
The HRR for the corresponding global fire is shown in Figure 5.1.8.
Figure 5.1.8. Global design fire.
In studying structures above the fire, the simplified geometrical model for modelling the local
fire uses a square (3 x 4 = 12 m 2) at a specific height from the floor, and the fire burns only on
the top surface. Special cases where the fire source was supposed to be 5 m above the floor were
considered too.
The height H f of the fire source can be estimated using the equation 5.1.2.
fuel
c f H q H U K ' '
' (5.1.2) where q ’’ is the fire load intensity, c H 'is the calorific value of the material (supposed to be
within 25-44 MJ/kg), ? is the factor that accounts for the solidity of the material (one for a solid
material, zero for a loose material) and fuel U is the density of the material (supposed to be within 900-1200 kg/m 3).
IF we suppose for simplicity uniform distribution of all the quantities within the ranges
shown above and a 10-90 % range for the factor ?. Then, based on 1000 Monte-Carlo simula-
tions we find that for 600 MJ/m 2 the value H f is smaller than about 20 cm (Figure 5.1.9 a) and
for 1100 MJ/m 2 the value H f is smaller than about 50 cm (Figure 5.1.9 b).
Figure 5.1.9. Distributions for the burning item.
Traditionally the value H f = 0.5 m is used for both cases. The fire source area used in the
simulations is shown in Figure 5.1.10.
Figure 5.1.10. Geometrical model for burning item (local fire).
Next, we shall consider the design fires for special uses.
5.1.3.3Ice resurfacing machine fire
Two kinds of approaches were used to define the design fire for this case: simulation with the FDS 5 program and estimation with a general fire model for vehicles (Hietaniemi 2007). The goal was to define the design fire for the ICECAT (2008) machine shown in Figure 5.1.11.
Figure 5.1.11. Ice resurfacing machine.
The machine contains the following combustible materials: plastics (ABS), glass-reinforced plastic (GRP) and rubber. The properties of ABS were derived from Lyon & Walters (2001) and Scudamore et al. (1991), those of GRP from Mouritz & Mathys (2006) and those of rubber from Iqbal et al. (2004), Chapter 7.
The machine was modelled with FDS 5 using cubes fit to the grid size and amount, distances, total size and mass of the cubes fit to the machine data. The FDS 5 model is shown in Figure 5.1.12.
Figure 5.1.12. FDS 5 model for predicting the fire load of ice resurfacing machine.
The thermal properties used in the simulation were typical for plastics: density 1100 kg/m3, thermal conductivity 0.2 WK-1m-1 and specific heat 1500 JK-1kg-1. Combustion time is estimated at 30 s and combustion temperature at 320 q C. The fire is supposed to reach its maximum inten-sity in 60 s.
The simulation is based on normal distributed fire load [Q, MJ], effective net caloric value [EHC, MJ/kg] and heat release rate per unit area [HRRPUA, kW/m2]. Their distributions are shown in Figure 5.1.13.
Figure 5.1.13. Distributions of fire load, effective net caloric value and HRRPUA.
In the simulations the following 95 % fractiles were used as input. Their standard deviations are shown in parentheses:
Q: 16700 (750) MJ,
EHC: 35 (1) MJ/kg,
HRRPUA: 700 (70) kW/m2.
In some cases other fractiles were used to determine the effect of the input on the result. The result of the simulation is shown in Figure 5.1.14.
Figure. 14. FDS 5 prediction and general vehicle model prediction for the ice resurfacing machine fire.
Figure 5.1.14 also shows the result based on Hietaniemi (2007) using the 95 % fractiles 2225 MJ/m2 for the fire load and 1725 kW/m2 for the heat release rate.
The final design fires for the ice resurfacing machine were determined based on these analy-ses. They are presented in Figure 5.1.15. Figure 5.1.15 a) presents the local fire and Figure 5.1.15 b) the global fire where after the total collapse of the sprinkler system the heat release rate doubles and then remains constant.
a)b)
Figure. 15. Local and global ice machine design fires. Vertical axis shows time in minutes.
5.1.3.4Storage fire with flashover
The large compartment comprises storage spaces which should be divided into individual com-partments using EI60 structures. However, the doors of the spaces open into the large compart-ment which is why the scenario where the door is open during the fire was chosen.
The storage space was modelled as a single sprinklered floor area because that represents the most severe situation as flames come out of the storage door. The fire load was modelled using 64 burning units each equalling a cell of the FDS grid. The heat release rate from each surface of each unit was 500 kW/m2. The net caloric value was 35 MJ/kg and the total fire load 30,000 MJ. The FDS 5 model and an example of the flaming through the door are presented in Figure 5.1.16.
Figure 5.1.16. FDS 5 model for predicting the storage fire load and an example of flaming through the
door.
Figure 5.1.17. Design fire for storage with flashover. Time in minutes.
5.1.3.5 Coat-rack fire with local flashover
The definition of the design fire for this case started by modifying the FDS 5 model to simulate
closely the experiments of Hadjisophocleous & Zalok (2004). The HRRPUA was 160 kW/m2
and the EHC was 30 MJ/kg. The geometrical model, the FDS 5 model and examples of the fire
are presented in Figure 5.1.18.
Figure 5.1.18. Geometrical model, FDS 5 model and examples of fires to predict the coat-rack fire.
The fire loads for the basic case and two variations are presented in Figure 5.1.19. The first variation is calculated using double the HRRPUA [kW/m 2] value of the basic case. The second
variation is calculated using double the fire load intensity [MJ/m 2] of the basic case.
Fire load based on tests
Figure 5.1.19. The basic case (a) and two variations: doubled heat release rate (b), and doubled fire load intensity (c).
The fire of Figure 5.1.19 c) was used in the final simulations of the building fires.
5.1.3.6Plastic slide fire
The most hazardous object in the adventure space for children in case of fire is the plastic slide which is high and contains a lot of combustible materials. The slide and its simplified model are presented in Figure 5.1.20.
Figure 5.1.20. Plastic slide and its simplified geometrical model.
More refined models of parts of the slide are presented in Figure 5.1.21.
Figure 5.1.21. Description of slide and related quantity data.
Two possible ignition locations were considered as shown in Figure 5.1.22 a). The corre-sponding fires are presented in Figure 5.1.22 b).
Figure 5.1.22. Two ignition locations (a) and corresponding fires (b) for predicting the slide fire.
The corresponding design fires are presented in Figure 5.1.23 a) and b).
Figure 5.1.23. Local design fires for plastic slide with two ignition locations.
The design fire presented in Figure 5.1.24 was used for global fire.
Figure 5.1.24. Global design fire for plastic slide, time in min.
The design fire used in this case was much larger than the doubled fire load after sprinkler ac-tivation (about 5 minutes in Figure 5.1.24.).
5.1.3.7Stage fire
The stage is not a permanent structure and is not normally in use. However, it may be needed in the dance, which is why this scenario was also considered. Stage load was defined for the area of one sprinkler (12 m2). The geometrical representation of the stage and the quantity data for calculating the fire load are given in Figure 5.1.25.
Figure 5.1.25. Stage model.
The quantity data and the corresponding fire are shown in Table. 4. Table 5.1.4. Quantity data of stage fire.
Density
[kg/m 3]
Heating value [MJ/kg] HRR [kW/m 2] V [m 3] A [m 2] Weight [kg] Fire load
[MJ] Speaker 200 3010000.968.24192 5780
A mplifiers 200 3010000.868.40173 5184
Cables 1200 404500.7260.84144 5760
Platform 700 1510000.3012.3560 900
Back wall 700 1510000.4016.4080 1200
Curtain 1200 4010000.0112.01 2 96
Total 18900
The attributes of the single homogeneously burning stage material for the whole area are: HRRPUA = 1000.0 kW/m 2 THICKNESS = 0.05 m DENSITY = 1200.0 kg/m 3 HEAT_OF_COMBUSTION = 30.0 MJ/kg
The fire load of the stage is presented in Figure 5.1.25 with the fire load of a global fire (red
line).
Figure 5.1.25. Stage design fire loads, local and global (red).
5.1.3.8 Stand fire
The stand is not a permanent structure. Temporary stands are needed for spectators of beach
volley and badminton matches. The stand is made of plywood and plastics. Its geometrical
model is given in Figure 5.1.26.
Figure 5.1.26. Geometrical fire model of the stand.
The quantity data and corresponding fire load calculations are shown in Table 5.1.5.
Table 5.1.5. Quantity data of one seat in the stand.
Density [kg/m 3]
Heat value [MJ/kg] HRR [kW/m 2]V [m 3] A
[m 2] Weight [kg] Fire load
[MJ] Plywood 70015 1500.00720.72 5.0475.6
PP 120040 12000.00240.72 2.88115.2
PU 10025 4000.00960.720.9624.0
Total 214.8
The size of the burning area is 12 m2. The attributes of the single homogeneously burning
stand material are: HRRPUA = 583.0 kW/m 2 THICKNESS = 0.2 m DENSITY = 52.0 kg/m 3 HEAT_OF_COMBUSTION = 24.2 MJ/kg
Local and global design fires for this case are given in Figure 5.1.27.
Figure 5.1.27. Local and global design fires for the. Time in minutes.
An example of a fire in the stand is given in Figure 5.1.28.
Figure 5.1.28. Stand fire.
5.1.4 E stimation of errors
Some error estimations concerning the proposed de-sign fires should be done before any fire
simulations on the building. The selected fire scenarios meet the requirements of Finnish regula-
tions (Ymp?rist?ministeri? (2002), Chapter 1.3.2) and, thus, cover all fires that probably could
take place in the building. They do not represent the average situation, but a rare situation which
can be considered to represent 99 % of the cases. This means that one fire out of 100 can be
worse than expected. That is a very small number, which means that in this study the possible
uncertainty of the fire scenarios will be attributed to the uncertainty of the design fires.
The uncertainty of design fires consists of the uncertainty of our knowledge and our igno-
rance (epistemic and aleatoric uncertainty) such as: The values used in calculations, e.g. HRRPUA values, always include noise originating from non-ideal tests arrangements, measurements and analysis models. Possible systematic errors in the values used in calculations originating e.g. from the hy-potheses made to simulate the real situation.
The uncertainty of fire technical measurements is of the order of 20 % as are model uncer-
tainties. Assuming that systematic uncertainties are of the same order (20 %), the uncertainty .Q ' of the fire load can be calculated by the equation 3.
%17%34%20%20%20222.r | |'Q (3) According to fire plume models, gas temperature g T rises in proportion to ambient tempera-
ture to the power 2/3 as shown by Heskestad (1984) and Hostikka (1997).
3
/2.Q T g v (4)
so the uncertainty g T 'of the temperature rise is
.3
2Q T g v ' (5) This means that the relative uncertainty of the estimations of temperatures can be described as a normal distribution with a mean of 1 and a standard deviation of 10 %:
%)10;1(N T T g g
v ' (6)
5.1.5 FIRE SIMULATIONS
5.1.5.1 The simulation environment
The aim of the simulation was to estimate endurance of structures to natural fire. The structural
product model was used as the basis of simulation. Beams, columns, roof and floor slabs, and
concrete stairwells were incorporated in the model. The data content of the structures of that
model was more complete than that of the architectural model. The building parts were not as-sumed to be involved the fire since all the burning material was assumed to be included in the fire packages. The material properties of structures were not needed in fire simulation.
The structural model was complemented based on drawings. The airspace where the fire burned was bounded by slabs or wall panels. All doors were modelled as openings in the walls assuming that evacuated persons had left them open. Other vents were for the most part not modelled. If there were any openings, the airspace where the fire burned could also be modelled by the properties of the edge of the calculation grid. The used modelling program was Tekla Structures version 15.0.
The NIST Fire Dynamics Simulator (FDS) version 5.2.5 was used for simulation. The calcu-lation method is based on CFD (computational fluid dynamics) which uses a three- dimensional, rectilinear computation grid. A ll the modelled objects must be modified into cubes in some phase of the data transformation process.
A special data transformation program was used to transfer the structural model data to the FDS input file. At the same time, all needed material data were stored to the same input file. The process is described more accurately by Laasonen (2010).
5.1.5.2Selection of the grid cell size
The size of a single cell of the calculation grid affects the following three important factors given in order of importance: 1) the reliability of simulation, 2) the minimum size of the objects that can be incorporate in the fire model, and 3) the computer time needed for calculations.
Heinisuo et al. (2008a) have discussed the required cell size. Heskestads’s correlation is used to estimate the reliability of calculation. It uses the density of fire [kW/m2] and the burning area to calculate the so-called Resolution factor (R) for defining the sizes of cells. Heinisuo et al. (2008a) recommended that the sizes of cells should be selected so that the value of R is at least 10 (or inverse value r not more than 0.07).
As presented in the previous chapters, the used special fires are not planar but involve three- dimensional objects which may burn on many faces. Then, the acceptable limit for the Resolu-tion factor is not known. Two Resolution factors have been calculated based on simulated fires: a lower value when only the fire on the top face is included in the burning area, and the higher value when all the burning faces are included in the area.
To limit calculation time, the model was divided into the several grids. A calculation envi-ronment where every grid can be calculated by a different processor was used. However, the hottest area was not divided between several grids because that could cause problems to the sta-bility of calculation. Also, if a larger number of processors are needed, the starting of calcula-tions could be severely delayed.
Coarser grids were used for the colder parts. Alpert’s correlation was used to approximate the width of the hot area. A distance from the plume centreline where the temperature should be less than 100 ?C was calculated. This distance is always smaller than the distance to the edge of the coarse grid.
In the simulation environment the co-ordinates of modelled objects were not changed in the transformation to the fire simulation program. The simulation program was allowed to locate every co-ordinate to the nearest cell corner using normal mathematical rounding rules. If all the corners of an object are rounded to the same cell corner, it will vanish from the fire simulation. Because of rounding, the thickness of some objects may be zero. As long as the rounding cause any unwanted holes in the simulation model, it should not affect the calculation. The simulation program reads the real thickness of objects from their attributes.
The effect of rounding was observed by two methods. In the simulation environment the cal-culation grids were also added to the structural model. At least one edge of the grid could be lo-cated according to modelled structures. All the added geometry could also be located to the grid cells. For example, holes less than two cells in size were not used.
The other method involved visual checking of the fire simulation model. The checking was carefully done before calculation when most of the problems could been noticed. After calcula-tion, smoke animation could indicate unwanted air flows.
To minimise calculation time, the biggest possible cell size was usually selected. Then the rounding of co-ordinates may cause structures to be lost in the fire simulation model. Profiles
whose both dimensions are less than the cell size will probably be lost if not successfully lo-cated between cell corners. Profiles exactly the size of a cell can be lost if the cell corner is lo-cated exactly in the middle of the profile. That is highly improbable.
Heinisuo et al. (2008a) have tested the effect of different sizes of obstacles in a fire model. They noticed that if the obstacle height versus corridor height is below 0.1 in a ceilinged space, and the obstacles are not located close to each other (less than three times their height), it is not essential to model them in a fire simulation. Consequently, slender profiles do not change sub-stantially the flow of air. The height of the modelled spaces was typically between 4 and 10 me-tres. Then it can be assumed that ignoring of obstacles smaller than 400 mm has little effect on simulation.
In the hot area the upper limit of cell size was 200 mm. Outside the hot area, the flow of air is even slower and bigger obstacles can be ignored in the fire model. There the upper limit of the cell size was 400 mm. The end result of the investigation of the effects of rounding was that profiles smaller than the cell size could be freely rounded off. The pictures of the fires in Chap-ter 5.5 show that, for example, all diagonal members of trusses have vanished from the fire models.
5.1.5.3Modelling of fires and grids
The previously presented fire packages were used in simulations. The properties and behaviour of burning materials were converted to FDS language. The HRRPUA, CONDUCTIVITY, SPECIFIC_HEA T, HEA T_OF_COMBUSTION and DENSITY values were given. The slope depicting the development of the fire as a function of time was given. The material data of the fire were linked to the model so that the name of the FDS fire was included in the name of the geometrical object describing the fire.
The fire was modelled in the form of cubic geometry which follows the cells of the calcula-tion grid. The location of the fire was selected for maximal temperatures of structures. Then the flames should reach the structure or just underneath. The other rule was that there should be enough air for the fire since the area around the opening is the severest.
The finest grid was located around the fire. One edge of the grid was aligned with the bearing structures. The exact location of the fire was fine-tuned accordingly. Then the other fine grids where located around the first one. Finally, the rest of the model was filled by coarser grids.
5.1.5.4Output of temperatures
Air temperatures were output at certain points during fire simulation. The location of the points must be entered by co-ordinates to the input file of fire simulation. The middle point of every steel member was selected as a control point. That allowed reading the co-ordinates automati-cally from the structural model. Temperatures at different locations of long and vertical rods varied sometimes. The safe solution in such instances is to assign critical members the highest calculated temperature of the surroundings. In some cases extra control points above the fire were also included in the calculation.
The air flow near the flames and plumes is turbulent. The programs can simulate this when output temperatures vary a lot between successive calculation steps. In an intense fire the differ-ence could be about 100 q C. If we wish to know the temperature at one point at a certain time, it is not advisable to take a single value from the time-temperature curve because of the turbu-lence. It is better to use the so-called ‘sliding window’ with the mean of several successive cal-culation steps.
One simulated second may involve several steps of calculations. That would make the amount of output data huge. The temperature of structures corresponds closely to the tempera-ture of air. For these reasons, all the calculated steps are not used in post processing. Hostikka et al (2001) have presented an equation to calculate the width of the sliding window. In the output diagrams of simulations they reduced air temperatures to 10 seconds wide time steps. That value was considered suitable in all cases.
The temperature of a steel part can be calculated by integration from the time-temperature curve of air. Heinisuo et al. (2008b), among others, have presented examples of such calcula-tions.
In the following, only the air temperature curves are given. These temperatures were used by
the structural engineers of the project to check the resistance of the structures in fire.
5.1.5.5 Simulated cases
The calculations of the fire cases presented in Chapter 3 were done to determine the worst-case
scenarios. The cases involving the highest temperatures are presented in the following. Results
are presented mainly for those control points where air temperatures were over 400 q C. That is a
critical limit because the yield stress of steel decreases at temperatures above it.
Table 5.1.6 lists the documented cases. The Resolution factor (R) is output as told in Chapter
5.2. An exception is the coat-rack fire where the relative area of the top faces was very small
and the top of the coat-rack was closed as shown in Figure 5.1.32. The R value of the top faces
in the coat-rack fire has not been output. All calculated values are at least near the minimum
target value 10. The worst R value was calculated for the storage fire, but there only the top
faces of the fire elements were burning.
The number of grids of both used cell sizes is given. The total number of grids of the fire
models was between 7 and 16.
Table 5.1.6. Documented simulations.
Resolution factor R Number of grids
Burning faces Size of cells [mm] 6
top all 200400
Ice hall, ice machine 9.613.9369
Ice hall, storages 9.2-4610
Restaurant, coat?rack -11.4459
Fun park, slide 13.930.661016
Dance hall, stage 1323.8628
Volleyball hall, stand 10.412.8707
Climbing hall, climbing wall 13.425.6808
away, the simulation was stopped earlier. The output temperatures should have settled down be-
fore the stopping.
Table 5.1.7 shows the calculation times of simulations. The maximum numbers of cells in
one grid and simulation time were output to compare different cases. As stated earlier, it is ad-
visable to avoid dividing the grids around the fire to keep calculation times short. A long, in-
tense fire also lengthens the calculation time in addition to the wideness of the grids.
Table 5.1.7. The simulation and the calculation times.
Maximum number of cells of grids Simulation time [min] Calculation time of
simulation [hh:mm]
Ice hall, ice machine 1098243333:47 Ice hall, storages 1098246041:02 Restaurant, coat?rack 1000006033:51
Fun park, slide 832006041:01 Dance hall, stage 720005086:13 Volleyball hall, stand 520002516:33 Climbing hall, climbing wall 1902562355:28
The ice hall was modelled in actual size bounded by the designed walls. The space was so
large that the fire qualities of the walls did not matter in the simulation. The fire was situated
near a door so as to provide enough air. The burning part of the machine was at the actual level.
Figure 5.1.29 is an example of the visualisation of simulation. The door openings are white
and the green points indicate where temperatures were output. Only a few bottom flanges of the
trusses were included in the fire model while all other parts were rounded off.
ADOBE INDESIGN园林设计方案排版入门 (1) 一、做好准备工作 (1) (1)准备好所有的排版素材文件。 (1) (2)建立清晰简明的文档及素材目录。 (1) 二、启动I N D ESIGN并创建排版文档 (2) 三、规划和设计主页 (5) (1)设计封面、扉页和目录的主页 (6) (2)设计说明和总图类页面的主页 (14) (3)表现图类页面的主页 (19) (4)意向图类页面的主页 (20) 四、设定文本的字符和段落样式 (21) 五、实际页面的排版 (24) (1)先完成封面设计 (24) (2)接下来做扉页和目录页 (26) (3)编排设计说明 (27) (4)给页面添加自动页码 (31) (5)总图类编排 (31) (6)表现图类编排 (34) (7)设计意向图类编排 (38) (8)生成目录 (40) (9)成果输出 (46)
Adobe InDesign园林设计方案排版入门 ·杨学成· Adobe InDesign是一个功能强大的排版软件,为报纸、杂志、书籍等出版物的排版提供了平台,也可应用于图册、展板等的编排,也可用于名片设计、海报设计等工作,甚至可以用来制作个性化的pdf格式的电子书。若干年前,在设计成果排版设计领域,几乎都是使用CorelDraw,但近年来使用Adobe InDesign的人越来越多,因为该软件和Photoshop同属Adobe公司,在软件界面、操作方式等方面均有很高的一致性,而且文件之间的兼容性也更好。可以说,只要熟悉Photoshop的使用,学习使用InDesign是比较简单的。 因为Photoshop的普及面非常广,几乎所有的设计人员都会使用它,所以有很多人喜欢用Photoshop做设计成果的排版工作。虽然从最后结果看,似乎Photoshop也能把“排版”工作做好,但实际上用Photoshop“排版”存在很多问题,例如效率低下、修改麻烦、容易出错、不利于素材的重复利用、风格难以有效统一等等。所以推广使用InDesign进行设计成果编排是很有必要的。 下面举例说明在设计成果编排方面应用InDesign的一般方法和注意事项。我使用的是CS3版本。 一、做好准备工作 与CorelDraw不同,InDesign在排版时,版面内的素材图像元素都是采用链接方式引入排版文档内,以减小文档的尺寸,这种情况下排版文档和素材图像文件之间必须有稳定的目录关系,否则一旦发生文件移动、拷贝等情况,会导致链接失效,使排版文档出错。其实,工作中养成良好的整理各种文件的习惯,不论什么时候都是很重要的。 所以在开始进入排版工作之前,应先做好必要的准备工作。这些工作包括: (1)准备好所有的排版素材文件。 例如已经制作好的各种总平面图、表现图、剖面图、立面图、设计意向参考图,以及各种文字文本材料、装饰版面的图形图像元素,等等。 (2)建立清晰简明的文档及素材目录。 实际工作中,往往一个项目由多人分工协作,常常出现的情况是,负责排版的人已经开始编排,但某些素材文件可能还没有完全制作好,或者某些素材文件需要修改等等,这时负责排版的人应该养成良好习惯,在计算机中建立清晰的工作目录。一般情况下建
Indesign排版应用教学大纲(2014年4月修订) 兰州商学院陇桥学院 二○一四年四月
一、课程基本信息 课程名称:indesign排版应用 课程编码:0511146 课程类别:专业基础课,必修 课程计划总学时:32学时,其中实验(实训、实习)8学时 课程学分:2个学分 适用专业:产品设计专业 课程归属系(部):艺术设计系 本课程是否为独立设置的实验(实训、实习)课程:是 二、课程性质、目的和任务 InDesign 软件是专业的排版软件,它的易操作性、可靠性、跨平台的兼容性给设计师们提供了极大的设计自由空间。 设计师在出版物的版式设计过程中需要解决页面设置与管理、图文编排、输出以及电子出版物的设计等工作。InDesign 软件可以轻松的和Photoshop、Illustrator、GoLive 等软件进行设计配合,既可以满足类似于普通书籍的教学需要,也可以满足类似与杂志、电子出版物等高端设计要求,使制作变为简单。设计师轻松掌握InDesign 软件的基本应用功能后,可以将大量的时间用于设计创作当中。 本课程的目的是从设计的角度向学生介绍了出版物理论知识、InDesign 软件使用、宣传画册设计制作和书籍设计制作的方法和过程。通过学习将会系统地了解和掌握版式设计的理论知识和操作技能,为从事设计工作打下良好的基础。 三、本课程与相关课程的关系 先修课:《平面构成》、《Photoshop》《版式设计》等。 后续课:《广告设计》、《招贴设计》《书籍装帧》《VI设计》等。 四、课程考核方式 课程考核方式为平时考勤、学习态度和设计成果质量的评定方法评定,最终按平时成绩占20%、实验成绩占30%、期末考试成绩占50%。凡成绩不及格者,必须重修。平时考查主要检查学生的出勤情况、学习态度、是否独立完成设计等几方面。设计成果的检查,着重检查对InDesign软件熟练程度和解决工程实际问题的能力和创新性的评定。 五、学时分配一览表
49. 直接复制选区 按住选择工具、直接选 择工具或编组选择工具 + Alt 键并进行拖动* 50. 直接复制并偏移选区 Alt + 向左箭头键、向右箭头键、向上箭头键或向下箭头键 51. 直接复制选区并将其偏移 10 倍** Alt + Shift + 向左箭头键、向右箭头键、向上箭头键、向下箭头键 52. 移动选区** 向左箭头键、向右箭头键、向上箭头键、向下箭头键 53. 将选区移动 1/10** Ctrl + Shift + 向左箭头键、向右箭头键、向上箭头键、向下箭头键 54. 将选区移动 10 倍** Shift + 向左箭头键、向右箭头键、向上箭头键、向下箭头键 55. 从文档页面中选择主页项目 按住选择工具或直接选择工具 + Ctrl + Shift 键单击 56. 选择后一个或前一个对象 按住选择工具 + Ctrl 键单击,或者按住选择工具 + Alt + Ctrl 键单击 57. 在文章中选择下一个或上一个框架 Alt + Ctrl + Page Down/Page Up 58. 在文章中选择第一个或最后一个框架 Shift + Alt + Ctrl + Page Down/Page Up 59. *按 Shift 键可以在 45° 角方向上移动。60. ** 调整量在“编辑”>“首选项”>“单位和增量”(Windows) 61. 变换对象的快捷键 62. 直接复制并变换选 区 按住变换工具 + Alt 键并进行拖动* 63. 显示变换工具对话框 选择对象并双击工具箱中的缩放工具、旋转工具或切变工具 64. 将比例减少 1% Ctrl + , 65. 将比例减少 5% Ctrl + Alt + , 66. 将比例增加 1% Ctrl + . 67. 将比例增加 5% Ctrl + Alt + . 68. 调整框架和内容的大 小 按住选择工具 + Ctrl 键并进行拖动 69. 按比例调整框架和内容的大小 按住选择工具+Shift+Ctrl 键并进行拖动 70. 约束比例 按住椭圆工具、多边形工具或矩形工具 + Shift 键并进行拖动 71. 将图像从“高品质显示”切换为“快速显示” Ctrl+Alt+Shift+Z 72. *选择变换工具以后,按住鼠标按钮,然后按住 Alt 键 (Windows) 73. 用于编辑路径和框架的快捷键 74. 临时选择转换方向点工具 直接选择工具 + Alt + Ctrl,或钢笔工具 + Alt 75. 在“添加锚点工具”和“删除锚点工具”之间临时切换 Alt 76. 临时选择添加锚点工具 剪刀工具 + Alt 77. 当指针停留在路径或锚点上时,使钢笔工具保持选中状态 钢笔工具 + Shift 78. 绘制过程中移动锚点和手柄 钢笔工具 + 空格键 79. 显示描边面板 F10 80. 用于表的快捷键 81. 拖动时插入或删除行或列 首先拖动行或列的边框,然后在拖动时按住 Alt 键 82. 在不更改表大小的情况下调整行或列的 1. 首页 / 使用 InDesign CS5 / 键盘快捷键 2. 选择“窗口”>“实用程序”>“工具提示”,然后选择一个工具来查看该工具的快捷键和修改键。 3. 工具 Windows 4. 选择工具 V, Esc 5. 直接选择工具 A 6. 切换选择工具和直接选择工具 Ctrl + Tab 7. 页面工具 Shift+P 8. 间隙工具 U 9. 钢笔工具 P 10. 添加锚点工具 = 11. 删除锚点工具 - 12. 转换方向点工具 Shift + C 13. 文字工具 T 14. 路径文字工具 Shift + T 15. 钢笔工具(附注工具) N 16. 直线工具 \ 17. 矩形框架工具 F 18. 矩形工具 M 19. 椭圆工具 L 20. 旋转工具 R 21. 缩放工具 S 22. 切变工具 O 23. 自由变换工具 E 24. 吸管工具 I 25. 度量工具 K 26. 渐变工具 G 27. 剪刀工具 C 28. “抓手”工具 H 29. 临时选择“抓手”工具 空格键(“版面”模式)、Alt 键(“文本”模式)或 Alt + 空格键(两种模式) 30. 缩 31. 工具 Z 32. 临时选择放大工具 C trl + 空格键 33. 切换填色和描边 X 34. 互换填色和描边 Shift + X 35. 在“格式针对容器”和“格式针对文本”之间切换 J 36. 应用颜色 , [逗号] 37. 应用渐变 . [句点] 38. 不应用任何颜色 / 39. 在“正常视图”和“预览模式”之间切换 W 40. 框架网格工具(水平) Y 41. 框架网格工具(垂直) Q 42. 渐变羽化工具 Shift + G 43. 用于选择和移动对象的快捷键 44. 临时选择“选择工具”或“直接选择工具”(上次 所用工具) 任何工具(选择工具除外)+ Ctrl 45. 临时选择编组选择工具 直接选择工具 + Alt;或者钢笔工具、添加锚点工具或删除锚点工具 + Alt + Ctrl 46. 选择所选内容的容器 Esc 或双击 47. 选择所选容器的内容 Shift+Esc 或双击 48. 向多对象选区中添加对象或从中删除对象 按住选择工具、直接选择工具或编组选择工具 + Shift 键单击(要取消选择,请单击中心点)
[分享]Indesign 排版技巧及插件汇总 Indesign 复合字体中的比例设定 客户要求在排版时正文用复合字体,但是中文要水平缩放到原来的80%,英文要水平所放到原来的110%。 复合字体做为一种用户自己创造的特殊的字体,在创立后,它也是一款字体。而在文字控制板中只能对某一款字的全部进行缩放,只对一款字体的某些字符进行自动缩放是做不到的。用手工一个个进行缩放,是非常麻烦的事情。 这时,我们想到了复合字体设定中的一些功能。 在苹果电脑的InDesign的复合字体中,作为字体主体的中文,定位在所有字体项目的第一项,是不能被调整的。乍一看,这样做似乎不是很灵活,但是仔细分析起来,这样的方式是很有道理的。一种字体在创立的时候,字体开发者就已经仔细的考虑到它的形状了。即使我们在某些场合需要改变它的胖瘦高矮,那也是“字符样式”和“段落样式”的事情,而不应该是“复合字体”应具备的功能。 但是考虑到复合字体的特殊性,即它是由多个字体复合而成的一种特殊字体,所以,软件开发者也允许在其它的字体项目中,如日文,英文,数字,符号等的设定时,可以改变相关的长宽比例。而这种改变,不是改变它们的绝对数值,而是相对于字体主体即中文字体的相对数值。以此来满足使用者的需要,同时也避免了各种功能交叉带来的混乱。 下面接着务实。 虽然在此例中,设定复合字体时不能改变中文字体的长宽比例,但其它复合字体项目相对于中文字体的比例是可以调整的。所以我们可以调整其他的字体项目来达到目的。 如上例,可以把英文的水平缩放调整到130%。(此时,中文字体未进行水平缩放,那么它的初始值为100%。)
然后在段落设定中对这款复合字体进行水平缩放设定为80%。由于我们在设定复合字体的英文字符时,将它设定为130%,那么,现在中文字体改为80%后,英文的水平缩放的比例自然即是110%了。用这种方法就可以达到客户的要求了。 [本帖最后由鸿羽于2006-12-12 13:09 编辑] 如何尽快掌握InDesign 如何尽快掌握InDesign? 为了使朋友们尽快掌握InDesign的使用方法,下面,我们通过一个例子来说明它的操作过程。做之前,先要说两句。乍一接触Indesign,许多朋友会觉得很不熟悉,很不适应。尤其是它的操作理念与PageMaker有很大的不同。大家总是要下意识地把Indesign和后者比较,当你对于Indesign还不能熟练掌握的时候,对于Indesign的优势和强大功能也许并没有很深的体会,进而就会认为Indesign还不如以前的PageMaker,笔者在开始使用Indesign的时候同样有这种错觉。 不过,当你踏踏实实的坐在电脑前,右边点一支烟,左边泡一杯茶,面前翻开说明书,用上一两天的时间,忘掉你曾经熟悉的PageMaker,专心致志地研究Indesign的每一项功能,并且仔细想想这些功能会给我的排版工作带来多大的方便,在电脑上反复试试。这样,你就会逐步地熟悉它喜欢它,就会在Indesign的自由王国中遨游。最终,Indesign必将会成为你须臾不可离开的工具。必将会伴随你制作出精美、出众、令旁人赞不绝口的好作品! 好了,废话少说。我们现在先做一个小册子。 通常分为四个步骤:建立版面;排版;调整和修改;输出。 一、建立版面: 1)选文件菜单—新建—文档。 2)在出现的对话框中进行设定:先决定基本页数。选中“主版文本框”以便于以后的
Indesign基础授课人:张磊 首先,在开始学习前需要知道的: 1、indesign主要是用来为图文类的书、杂志等成册的印刷品排版的软件 2、我们一般用indesign来排书的内文而不做封面(封面文件用illustrator做),indesign相当于一本书,里面会显示所有的页面,一般来说,第一页是书正文右边的页面,从第二页开始,就是对页显示) 3、我们在排版过程中,一般来说,做的最多的就是置入图片、置入文字内容、做一定的装饰性的图形或字符、制作页码、页眉。通过你自己的设计、编排来实现协调、有秩序、有美感的版面。(这其中核心的内容就是对图片的大小、位置进行编辑,有时还需要对图片进行裁切或者效果的编辑;对文字的字体、大小、字的间距、行间距等进行设计和编辑;做一些创意性的装饰图纹等) 一、【新建文档】 这里可以设置页面的大小、页数 如果初次设置的页数不够的话,也没关系,在窗口中的“页面”中可以右键“插入页面”or“删除跨页“来修改。 新建文档
二、【设置边距和分栏】 设置边距主要就是要设置好‘版心’(即版面内文主体)所占的面积边距就是版心距离裁切边上、下、左、右的距离 这里可以设置栏数和栏间距,这个不用讲,你设置一下就明白了 设置边距分栏
对页 图中所表示的就是一个对页的样子 最外边的红色线是出血线,我们所有的出血的图都要做到这个边线才可以, 目前我们看到的这个页面是分2栏的栏间距是5毫米。 这些线条都是辅助我们排版对齐用的,如果你想看排好后的效果,可以用control+: 来看到没有辅助线的版面~ 合适的版心是需要耐心去调整的,有时候只是1、2毫米的差别整体的效果就会很不一样。设计版心的时候一要考虑文字量的大小,二要考虑整本书的图片量,在最初就对正本书图文关系有一个统一的规划。 有些书为了版式的新颖和体现书的独特风格于气质,运用比较特殊的版心,例如天(上边距大)特别开的占到1/3页面的,或者版心在一个页面的左侧或右侧,留下一部分空白等等,这些都需要你去设计和不断的尝试,所有的设计都没有完全固定的标准,力求做到方便阅读、适合、美观。
简易indesign教程(1)-认识indesign 1、indesign主要是用来为图文类的书、杂志等成册的印刷品排版的软件 2、我们一般用indesign来排书的内文而不做封面(封面文件用illustrator做),indesign 相当于一本书,里面会显示所有的页面,一般来说,第一页是书正文右边的页面,从第二页开始,就是对页显示) 3、我们在排版过程中,一般来说,做的最多的就是置入图片、置入文字内容、做一定的装饰性的图形或字符、制作页码、页眉。通过你自己的设计、编排来实现协调、有秩序、有美感的版面。(这其中核心的内容就是对图片的大小、位置进行编辑,有时还需要对图片进行裁切或者效果的编辑;对文字的字体、大小、字的间距、行间距等进行设计和编辑;做一些创意性的装饰图纹等) 下面我们开始 【第一步,我们要新建一个文档】 这里可以设置页面的大小、页数 如果初次设置的页数不够的话,也没关系,在窗口中的“页面”中可以右键“插入页 面”or“删除跨页“来修改。 新建文档 【第二步,设置边距和分栏】 设置边距主要就是要设置好…版心?(即版面内文主体)所占的面积 边距就是版心距离裁切边上、下、左、右的距离
这里可以设置栏数和栏间距,这个不用讲,你设置一下就明白了 设置边距分栏 对页 图中所表示的就是一个对页的样子
最外边的红色线是出血线,我们所有的出血的图都要做到这个边线才可以 目前我们看到的这个页面是分2栏的栏间距是5毫米 这些线条都是辅助我们排版对齐用的,如果你想看排好后的效果,可以用control+: 来看到没有辅助线的版面~ 个人的习惯内边距比外边距稍大2-3毫米左右,因为内边是要装订的,这样看起来更方便一些。 合适的版心是需要耐心去调整的,有时候只是1、2毫米的差别整体的效果就会很不一样。设计版心的时候一要考虑文字量的大小,二要考虑整本书的图片量,在最初就对正本书图文关系有一个统一的规划。 有些书为了版式的新颖和体现书的独特风格于气质,运用比较特殊的版心,例如天(上边距大)特别开的占到1/3页面的,或者版心在一个页面的左侧或右侧,留下一部分空白等等,这些都需要你去设计和不断的尝试,所有的设计都没有完全固定的标准,力求做到方便阅读、适合、美观。 【知识点1:页面】 页面窗口是很重要的一个项,我们的鼠标会经常停留在这里
应用技巧类(D) Q: (D001) 使用InDesign 过程中修改了一些偏好设定,如果要回复到安装InDesign 时的原预设设定,该如何操作? A: 退出InDesign ,重新启动InDesign ,同时按下[Ctrl/Commnad] + [Shift] + [Alt]键,会弹出提问窗口:是否要删除InDesign 偏好设定档案?按下“是”则可删除使用过程中储存的偏好设定档案,回复到安装InDesign 时的原预设设定状态。 Q: (D002) 我在排版过程中,经常要用到一些相同的字体、字号、度量单位、笔画粗细等。每次都要做一些重复的操作,非常麻烦。如何预先设定并储存这些共享的设定,提高排版效率? A: 开启InDesign ,在未开启任何文檔(包括新建)之前,在字符面板字体列表中选取相应的字体及其大小,在“偏好设定”中选取相应的度量单位……完成上述操作后,这些设定就可预先储存下来,直至下次修改。(注:如果做上述设定时开启了某个文檔,则这些预设定就只能随该文檔储存,对其他或新建的文檔没有作用。) Q: (D003) 在排版中常用的工具箱、面板等占去了不少屏幕位置,给预视版面效果造成不便,有没有办法隐藏它们,需要时又可以快速地显示出来呢? A: 有,按下[ Tab ] 键即可将屏幕上已开启的面板及工具箱隐藏起来,只显示主要的菜单和已开启的文檔;再次按下[ Tab ] 键则又会重新显示(注意:按下[ Tab ] 键之前确保当前所选工具不是文字工具)。 Q: (D004) 在排版时经常要选用手形工具滚动版面查看或编辑文檔,如何快速将当前所选工具切换成手形工具呢? A: 按下[ 空格键] 当前所选工具图标(文字工具例外)即变为手形工具图标,用户即可用之滚动版面,松开[ 空格键]又回复成原工具图标。(注意:按下空格键之前确保当前所选工具不是文字工具。处于文字工具状态时必须按下Alt键才会切换成手形工具,否则将在文稿框中插入空格。) Q: (D005) 如何利用鼠标中间的滚轮翻阅版面? A: 在翻阅较大的版面时,通常可以利用鼠标中间的滚轮上下滚动屏幕。如果在滚动时按下[ Alt ]键,则可以水平方向滚动屏幕;按下[ Ctrl ]键则可以将整个版面以中心点为原点进行放大或缩小。 Q: (D006) 利用字符、段落样式面板窗口下端的“创建新样式”按钮新增样式时,可以自动调出样式选项窗口吗?
Adobe的In Design是一个定位于专业排版领域的全新软件,虽然出道较晚,但在功能上反而更加完美与成熟。In Desig n博众家之长,从多种桌面排版技术汲取精华,如将QuarkXPress和Corel — Ventura (著名的Corel公司的一款排版软件)等高度结构化程序方式与较自然化的PageMaker方式相结合,为杂志、书籍、广告等灵活多 变、复杂的设计工作提供了一系列更完善的排版功能,尤其该软件是基于一个创新的、 面向对象的开放体系(允许第三方进行二次开发扩充加入功能),大大增加了专业设计人员用排版工具软件表达创意和观点的能力,功能强劲不逊于QuarkXPress,比之PageMaker则更是性能卓越;此外 Adobe与高术集团、启旋科技合作共同开发了中文 In Design,全面扩展了 In Desig n适应中文排版习惯的要求,功能直逼北大方正集团(FOUNDER的集成排版软件飞腾(FIT),可见,In Desig n的确非同一般。 所谓版面编排设计就是把已处理好的文字、图像图形通过赏心悦目的安排,以达到突出主题为目的。因此在编排期间,文字处理是影响创作发挥和工作效率的重要环节,是否能够灵活处理文字显得非常关键,In Desig n在这方面的优越性则表现得淋漓尽致,主要体现在以下几点: 1.文字块具有灵活的分栏功能,一般在报纸、杂志等编排时,文字块的放置非常灵 活,经常要破栏(即不一定非要按版面栏辅助线排文),这时如果此独立文字块不能分栏,就会影响编排思路和效率。而PageMaker却偏偏不具有这一简单实用的功能, 而是要靠一系列非常烦琐步骤去实现:文字块先依据版面栏辅助线分栏,然后再用增效工具中的“均衡栏位”齐平,最后再成组以便更改文字块的大小时不影响等同的各 栏宽等等。而In Design就具有灵活的分栏功能,单这点上就与一直强于PageMaker 的QuarkXPress和FIT站在了同一水平线上。 2.文字块和文字块中的文字具有神奇的填色和勾边功能,In Desig n可给文字块中的文字填充实地色或渐变色,而且可给此文字勾任意粗的实地色或渐变色的边。同时,对此文字块也可给予实地色或渐变色的背景,文字块边框可勾任意粗的实地色或渐变 色的边框,这样烦琐的步骤,In Desig n用其快捷的功能可一气呵成,而 PageMaker 单靠其“文字背景”功能是完不成的,甚至得借助其它软件来实现,就连QuarkX—Press也只能望其项背。特别是文字块和文字块中的文字的渐变色勾边这一功能,也只有FIT可与其抗衡。 3.文字块内的文字大小变化灵活,当我们进行编排时,往往会遇到想对某段文字块 中的某些文字作一些特别强调,如大小、长短变化等等,In Desig n就为您提供了这一方便功能。InDe — sign可让文字块内的文字在 XY轴方向改变大小且可任意倾斜,而PageMaker文字块中的文字却只能在 X轴方向改变,更不能倾斜。更神奇的是 In Desig n中整个文字块可用“缩放键”放大和缩小(其中文字也相应放大和缩小),这项绘图软件特有优秀的功能被In Desig n引进,从而大大减少了由于版面变化而改 变版式的工作量,提高了工作效率。而PageMaker却只能望尘莫及,老老实实的从改变字号大小开始重新安排版面,费时费力。 4.文字块的文字在间距控制上更自由,一般在排文时常常会遇到文字块最后一栏的最后一行不能与前面栏的最后一行平齐等等问题,这时可能就需要调整字距 (Tracki ng )来实现了。In Design的文字字距可简单的通过设定任意的数值来调整,
Indesign教案 第一讲Indesign的概述 一.简介 1.由美国的adobe公司与1999年9月1日推出一个创新的排版设计软件Indesign。 2.Adobe InDesign是一个全新的,宣告针对艺术排版的程序,提供给图像设计师、产品包 装师和印前专家。 3.它能够制作几乎所有出版物,从书籍、手册到传单、广告、书信、外包装以至PDF电子 出版物和HTML网页,几乎无所不能。 4.与其它软件的区别:1)QuarkXPress曾经是全球范围内公认的优秀排版软件。但对于中文 用户来,昂贵的价格、缓慢的版本升级速度、缺少学习途径和参考资料、缺乏技术支持和后期服务(如输出)等因素,限制了Quark的普及,使得Quark的应用基本局限在一些不得不使用Quark的用户中间(如一些跨国企业或需要处理来自国外的Quark文件的用户)。 2)虽然Freehand支持多页面排版,但它甚至没有在排版中最为基本的自动页码;同样,Freehand也只有段落样式,而没有字符样式。因此,在排多页面的文档(如杂志、书籍)时,Freehand并不是一个高效率的工具。 3)PageMaker在相当长一段时间内都是杂志排版最主要的应用软件。不过,它在各方面的缺陷几乎每个人都了如指掌。 二.启动与界面布局: 1.启动:开始—程序—Adobe InDesign 2.界面布局:标题栏、菜单栏、属性栏、工具箱、浮动调板、泊槽(窗口)、绘图区 3.注意: . 按tab键可以隐藏或显示工具箱、属性栏、浮动调板、泊槽;按shift+tab可以隐藏或显示除工具箱和属性栏外的其他浮动调板。 . 按alt键并单击工具,可以在隐藏工具和非隐藏工具间切换。 ●. 常规模式和预览模式可以通过w在他们之间切换。 三.基本操作 1.新建:ctrl+n . 页数:最多为9999页。 . 对页: 选择此选项可以使双页面跨页中的左右页面彼此相对。 ● . 主页文本框架: 选择此选项,将创建一个与边距参考线内的区域大小相同的文本框架,并与所指定的栏设置相匹配。此主页文本框架将被添加到主页A 中。 ? .页面大小:共有23种纸张类型。可以编辑宽度与高度。页面方向与装订方式。 页面最小为4.233毫米*4.233毫米。最大为5486.4毫米*5486.4毫米。 ? .出血:出血区域用于对齐对象扩展到文档裁切线外的部分。出血区域使您可以打印排列在已定义页面大小边缘外部的对象。 ? .辅助信息区:辅助信息区域用于显示打印机说明、签字区域文档的其他相关信息。将文档裁切为最终页面大小时,辅助信息区将被裁掉。 ? .边距与分栏 ? .版面网格:InDesign 的版面网格与传统版式纸页面设计的区别在于,可以根据需要修改基准字体大小、描边宽度、页面数和其他元素,以创建自定版面。 页面设置:文件—页面设置(ctrl+alt+p) 2.打开:ctrl+o 3.置入:ctrl+d (置入图片的格式:AI.PSD.TIFF.JPEG.BMP.PDF.DCS.EPS.PICT.WMF.EMF.PCX.PNG.SCT)
一、InDesign简介 对于国内的MAC和PC普通用户来说,在印前设计专业领域中使用最广泛的排版软件是Adobe公司的PageMaker,但这并非说明PageMaker是最优秀的。Quark公司的QuarkXPress(欧美大部分国家地区使用其)和北大方正集团(FOUNDER)的飞腾(FIT)在专业性能上比PageMaker更胜一筹,只是由于种种因素而使得这两种软件得不到广泛应用。例如,Quark公司一直以来投放的重点不是中国国内,因此简体中文MAC版升级慢,PC版本更是少见;而方正飞腾(FIT)主要是配合北大方正集团开发的另外一些软件专攻报社、出版社等具有连贯性、系统性的大型对象,另外FIT的后端照排输出也有局限性,即FIT的PS文件只能在昂贵的方正RIP上输出等等,所以普通用户才不得不使用升级快、输出方便但功能不能让专业人士满意的PageMaker。 由于PageMaker是Adobe公司原先从Aldus公司继承过来的,其核心技术相对陈旧,存在许多缺点,单凭PageMaker击败QuarkXPress 在印前设计专业领域长期占一席之地,显然是不可能的,于是Adobe 公司另辟蹊径在1999年9月1日发布了一个功能更强大的排版软件,作为其10年来在排版领域受Quark公司压制的反击和完全实现其桌面出版系统龙头老大的位置,这个创新的排版软件就是InDesign。 InDesign博众家之长,从多种桌面排版技术汲取精华,如将
QuarkXPress和Corel-Ventura(著名的Corel 公司的一款排版软件)等高度结构化程序方式与较自然化的PageMaker方式相结合,为杂志、书籍、广告等灵活多变、复杂的设计工作提供了一系列更完善的排版功能,尤其该软件是基于一个创新的、面向对象的开放体系(允许第三方进行二次开发扩充加入功能),大大增加了专业设计人员用排版工具软件表达创意和观点的能力,功能强劲不逊于QuarkXPress,比之PageMaker则更是性能卓越;此外Adobe与高术集团、启旋科技合作共同开发了中文InDesign,全面扩展了InDesign适应中文排版习惯的要求,功能直逼北大方正集团(FOUNDER)的集成排版软件飞腾(FIT),可见,InDesign的确非同一般。 二、InDesign的优点 所谓版面编排设计就是把已处理好的文字、图像图形通过赏心悦目的安排,以达到突出主题为目的。因此在编排期间,文字处理是影响创作发挥和工作效率的重要环节,是否能够灵活处理文字显得非常关键,InDesign在这方面的优越性则表现得淋漓尽致,下面通过在版面编排设计时的一些典型的例子加以说明。 1.文字块具有灵活的分栏功能,一般在报纸、杂志等编排时,文字块的放置非常灵活,经常要破栏(即不一定非要按版面栏辅助线排文),这时如果此独立文字块不能分栏,就会影响编排思路和效率。
第一讲Indesign简介 一、简介: 1、由美国的Adobe公司推出的桌面排版软件。 2、作用:能够制作几乎所有出版物;从书籍、手册到传单、广告、书信、外包装以致PDF电子版出版物和HTML网页几乎无所不能。 3、关于adobe公司的平面设计所需软件: 1)indesign:桌面排版(把素材放到合理的位置上)。 2)Photoshop:处理图像。 3)AI(ILLustrator)矢量图绘制软件(绘制图形)。 二、安装:查看说明书。 三、基本操作: 1、界面组成: 1)工具箱:窗口→工具 2)控制面板。 附加:常用快捷命令 (1)按Tab可以隐藏或显示工具箱、浮动面板。 (2)shift+Tab隐藏或显示除工具箱和属性栏外的其他浮动面板(3)alt:单击工具可以在隐藏和非隐藏工具间切换。 (4)W:在常规模式和预览模式之间切换。 2、新建:“Ctrl+N” 1)页数:0-9999
2)对页:新建的页面左右相对。 3)页面大小: A4:宽210X高297 A3:宽420X高297 B4:宽257X高364 4)页面方向:纵向和横向。 5)装订:从左到右。 6)出血设置:默认为3毫米。 7)版面网格对话框:设置字体、字体的大小、页面的行数和列数。8)边距和分栏: (1)边距:文字距文本框的距离。 (2)分栏:把页面分成几部分。 3、置入:“Ctrl+D”向当前文档中添加文字或图形。 4、存储:“Ctrl+S”保存格式为*.indd 5、导出:“Ctrl+E”把文档的内容导出为jpeg格式或PDF格式的文件。 第二讲基本工具的使用 一、钢笔工具“P” 1、作用:用于绘制线型。 2、操作: 1)直接点击用于绘制直线;按住shift加点击用于绘制成45°角的直线;点击并拖动用于绘制曲线。 2)属性设置:
《Indesign排版设计》课程教学大纲 总学时:64(理论:32 实验:32) 学分:4.0(理论:2 实验:2) 开课单位:信息与电子工程学院 适用专业:信息管理与信息系统 一、课程的性质和目的 (一)本课程是信息管理与信息系统专业的一门专业选修课程。 (二)课程的教学目的 通过本门课程的学习,使学生掌握InDesign软件的基本操作、出版物设计在印刷过程中的输出环节、名片设计、报纸版面设计、宣传单页设计、画册设计、期刊杂志设计及书籍设计与制作等知识点,能够对排版设计工作有比较全面的了解,具备排版设计能力,为学生今后从事平面设计行业打下良好基础。 二、课程内容和要求 (一)InDesign的基本操作 1.软件基础知识:了解并熟悉InDesign的软件界面,掌握菜单、工具箱和面板的使用。 2.设计基础知识:了解版面结构设计的相关知识,掌握色彩基础知识及配色原则。(重点/难点) (二)文字的基本操作 1.名片设计:掌握名片制作过程,掌握文字在名片设计中的应用,掌握名片设计相关知识。(重点) 2.会员卡设计:掌握会员卡制作方法,掌握文字在会员卡设计中的应用,掌握会员卡设计相关知识。 3.宣传单页设计:掌握置入文字的方法,掌握文本框架的使用,掌握字体面板的使用。(重点) 4.报纸广告设计:了解图片效果的简单设计,掌握文字效果的设置。 (三)文字的进阶操作 1.宣传册设计:掌握字体样式的设置,掌握复合字体的设置。(重点/难点)
2.宣传折页设计:掌握串接以及断开文本的方法,段落样式的设置和应用,了解载入样式,掌握样式的应用。(重点) 3.超市DM设计:掌握段落样式的使用,掌握嵌套样式的使用。(重点/难点) (四)图形的绘制及颜色填充 1.宣传页中线路图的制作:掌握路径的绘制,掌握路径中点的操作,掌握直接选择工具的使用,掌握描边样式的设置。(重点) 2.舞台布景设计:掌握图形的绘制,掌握路径查找器的使用,掌握颜色的设置。(重点) 3.灯箱广告设计:掌握路径的操作,掌握角选项的设置。 (五)艺术文字的效果 1.书籍名称的文字设计:掌握文字转曲的方法,掌握文字变形。(重点) 2.广告口号的文字设计:掌握装饰文字的设置,掌握透明度效果的设置。 (六)图片的编辑与管理 1.室内表现公司的画册设计:掌握图片的置入方法,掌握图片的大小设置。(重点) 2.风景画册设计:掌握如何修复图片缺失链接,掌握检查图片分辨率和色彩空间。(重点) 3.菜谱设计:掌握图片的编辑,掌握对齐面板的使用,掌握图像效果的设置。 (七)编辑处理表格 1.销售单的制作:掌握单元格的设置,掌握设置文字内容属性。 2.特殊形状表格的制作:掌握置入表格的方法,掌握续表的制作,掌握表头及表线设置。(重点) 3.其他软件表格的编辑处理:了解如何在InDesign操作环境下编辑Word表格和Excel 表格。 (八)图书版面、内文版式设计 1.人文类图书设计:掌握如何新建页面,掌握主页的设置。(重点) 2.计算机类图书设计:掌握库的使用,掌握排版设计图文。 3.杂志内文版式设计——版面融合:掌握图层分类管理页面元素,掌握查找/替换操作,掌握链接面板的使用,了解书籍的使用。(重点) (九)目录的生成 1.期刊目录的设计:掌握目录样式的设置,掌握前导符的样式设置。(重点/难点) 2.杂志目录的设计:掌握书籍目录的生成方法。
InDesign常用快捷键 F1 显示当前程序或者windows的帮助内容。 F2 当你选中一个文件的话,这意味着“重命名” F3 当你在桌面上的时候是打开“查找:所有文件” 对话框 F10或ALT 激活当前程序的菜单栏 windows键或CTRL+ESC 打开开始菜单 CTRL+ALT+DELETE 在win9x中打开关闭程序对话框 DELETE 删除被选择的选择项目,如果是文件,将被放入回收站SHIFT+DELETE 删除被选择的选择项目,如果是文件,将被直接删除而不是放入回收站
CTRL+N 新建一个新的文件 CTRL+O 打开“打开文件”对话框 CTRL+P 打开“打印”对话框 CTRL+S 保存当前操作的文件 CTRL+X 剪切被选择的项目到剪贴板 CTRL+INSERT 或CTRL+C 复制被选择的项目到剪贴板 HIFT+INSERT 或CTRL+V 粘贴剪贴板中的内容到当前位置 ALT+BACKSPACE 或CTRL+Z 撤销上一步的操作 ALT+SHIFT+BACKSPACE 重做上一步被撤销的操作 Winndows键+M 最小化所有被打开的窗口 Windows键+CTRL+M 重新将恢复上一项操作前窗口的大小和位置Windows键+E 打开资源管理器 Windows键+F 打开“查找:所有文件”对话框 Windows键+R 打开“运行”对话框 Windows键+BREAK 打开“系统属性”对话框 Windows键+CTRL+F 打开“查找:计算机”对话框 SHIFT+F10或鼠标右击打开当前活动项目的快捷菜单 SHIFT 在放入CD的时候按下不放,可以跳过自动播放CD。在打开word的时候按下不放,可以跳过自启动的宏 ALT+F4 关闭当前应用程序 ALT+SPACEBAR 打开程序最左上角的菜单 ALT+TAB 切换当前程序
InDesign排版技巧 1.自动排文 InDesign的自动排文很方便,只要在置入对话框中单击“打开”的同时按住“shift”键即可,这样无论多长的文章,都可以一次性置入。如果开始设置的页面不够,InDesign还会自动添加新的页面分色,而且置入之后各页面上的文本框之间会自动链接在一起。 2.制作异形文本框 在实际工作中,经常会碰到不规则的文本框,这在InDesign里制作是很方便的,有多种方法,本文仅介绍3种。 (1)使用添加节点工具在要改变形状部分添加相应节点数字印刷机,然后用直接选择工具拖动节点来修改形状。此法须借助参考线来定位。 (2)对两个或多个文本框进行路径查找操作,与图形的路径查找操作一样(InDesign 中很多针对图形的操作都可以应用于文本框)。 (3)先用图形工具创建好图形,再将文本工具置于图形之内,此时的图形将自动变为文本框。 方法(3)可以说是最方便的,而且图形的形状可以任意编辑。 3.多主页处理 处理多主页是InDesign的一个强大功能人物,极大地方便了同一本书内多个页眉的排版工作。主页设置好之后,只要选择将主页应用于第几页到第几页(右击主页名称,选择“将主页应用于页面”,设置相应页面)即可。但页码的处理需要注意,因为页码要求是连续的Adobe,所以在每个主页上都应该设置自动页码。 4.暗码和无码的处理 在对杂志或图书进行排版时,经常会碰到暗码和无码的情况。所谓暗码,是指某一页占页数但不显示页码,如某一章的起始页经常要采用暗码。无码是指某一页既不占页数,也不显示页码的情况色彩,如插页。在InDesign中处理暗码的方法如下:选中要设置暗码的页面,执行覆盖主页项目(右击或按快捷键“Alt+Shift+Ctrl+L”),然后选中页码部分“删除”即可。 无码的处理则相对麻烦。要用到页面浮动面板当中的“页码和章节选项”。需先把要设置为无码的页面用前面处理暗码的方法删除页码,然后选择紧接着的页面,在右键菜单中或页面浮动面板的展开菜单中选择“页码和章节选项”秋山国际,在对话框中选择“开始新章节”,选中“起始页码”选项,在后面的输入框中输入要接排的页码即可。 5.不规则图像的文本绕图 数码相机或其他图像输入设备生成的图像大都是矩形的,而实际应用当中有时会遇到非矩形的情况,我们可以把这一类型的图像归为不规则图像。这类图像在InDesign里的文本绕图处理可分2种情况来讨论:若目标图像(即需要保留的图像部分)周围的底色(即需要去除的图像部分)比较单一(如白底)覆膜,这时只须选中图像,执行“对象/剪贴路径/检测边缘”,修改相应参数即可;如果目标图像和周围底色没有清晰分界,即底色本身就是非纯色,或者说灰度值不统一平版印刷,那么就必须进行去底处理。去底的方法有很多,下面主要介绍3种方法以供参考。 (1)如果图像已置入InDesign页面中,可以通过修改容器的形状从而约束图像的形状,此时图像实质上并没有变,变的只是容器的形状。 (2)如果图像暂未置入InDesign中区域报道,可以先在Photoshop去底(具体方法是在Photoshop用钢笔工具勾出目标图像的路径,然后在路径面板中保存路径,再执行剪贴路
Indesign 排版技巧及插件汇总 Indesign 复合字体中的比例设定 客户要求在排版时正文用复合字体,但是中文要水平缩放到原来的80%,英文要水平所放到原来的110%。 复合字体做为一种用户自己创造的特殊的字体,在创立后,它也是一款字体。而在文字控制板中只能对某一款字的全部进行缩放,只对一款字体的某些字符进行自动缩放是做不到的。用手工一个个进行缩放,是非常麻烦的事情。 这时,我们想到了复合字体设定中的一些功能。 在苹果电脑的InDesign的复合字体中,作为字体主体的中文,定位在所有字体项目的第一项,是不能被调整的。乍一看,这样做似乎不是很灵活,但是仔细分析起来,这样的方式是很有道理的。一种字体在创立的时候,字体开发者就已经仔细的考虑到它的形状了。即使我们在某些场合需要改变它的胖瘦高矮,那也是“字符样式”和“段落样式”的事情,而不应该是“复合字体”应具备的功能。 但是考虑到复合字体的特殊性,即它是由多个字体复合而成的一
种特殊字体,所以,软件开发者也允许在其它的字体项目中,如日文,英文,数字,符号等的设定时,可以改变相关的长宽比例。而这种改变,不是改变它们的绝对数值,而是相对于字体主体即中文字体的相对数值。以此来满足使用者的需要,同时也避免了各种功能交叉带来的混乱。 下面接着务实。 虽然在此例中,设定复合字体时不能改变中文字体的长宽比例,但其它复合字体项目相对于中文字体的比例是可以调整的。所以我们可以调整其他的字体项目来达到目的。 如上例,可以把英文的水平缩放调整到130%。(此时,中文字体未进行水平缩放,那么它的初始值为100%。) 然后在段落设定中对这款复合字体进行水平缩放设定为80%。由于我们在设定复合字体的英文字符时,将它设定为130%,那么,现在中文字体改为80%后,英文的水平缩放的比例自然即是110%
比较常用的INDESIGN快捷键 功能栏:工具 按钮工具 --- 默认-b 笔型工具 --- 默认-p 测量工具 --- 默认-k 放大镜工具 --- 默认-z 剪刀工具 --- 默认-c 渐变工具 --- 默认-g 交换填充和笔画的激活状态 --- 默认-x 交换填充和笔画颜色 --- 默认-shift+x 矩形工具 --- 默认-m 矩形框架工具 --- 默认-f 开关文本和对象控制 --- 默认-j 路径文字工具 --- 默认-shift+t 铅笔工具 --- 默认-n 倾斜工具 --- 默认-o 删除锚点工具 --- 默认-- 手形工具 --- 默认-h 缩放工具 --- 默认-s 添加锚点工具 --- 默认-= 椭圆形工具 --- 默认-l 文字工具 --- 默认-t 吸管工具 --- 默认-i 旋转工具 --- 默认-r 选取工具 --- 默认-v 应用渐变 --- 默认-. 应用默认填充和笔画颜色 --- 默认-d 应用无色 --- 默认-num /, 默认-/ 应用颜色 --- 默认-, 在默认和预览之间切换查看设置 --- 默认-w 直接选取工具 --- 默认-a 直线工具 --- 默认-\ 转换锚点工具 --- 默认-shift+c 自由变换工具 --- 默认-e
功能栏:版面菜单 末页 --- 默认-shift+ctrl+page down 上一跨页 --- 默认-alt+page up 上一页 ---默认-shift+page up, 文本-shift+page up 首页 --- 默认-shift+ctrl+page up 下一跨页 --- 默认-alt+page down 下一页---默认-shift+page down, 文本-shift+page down 向后 --- 默认-ctrl+page up 向前 --- 默认-ctrl+page down 功能栏:帮助菜单 indesign帮助... --- 默认-f1 功能栏:编辑菜单 查找/替代... --- 默认-ctrl+f 查找下一个 --- 默认-ctrl+alt+f 撤消 --- 默认-ctrl+z 复制 --- 默认-shift+ctrl+alt+d 剪切 --- 默认-ctrl+x 拷贝 --- 默认-ctrl+c 连晒... --- 默认-shift+ctrl+v 偏好设定: 一般... --- 默认-ctrl+k 拼写检查... --- 默认-ctrl+i 清除---默认-backspace, 默认-ctrl+backspace, 默认-删除, 默认-ctrl+删除取消选取 --- 默认-shift+ctrl+a 全选 --- 默认-ctrl+a 原地粘贴 --- 默认-shift+ctrl+alt+v 在文章编辑器中编辑 --- 默认-ctrl+y 粘贴 --- 默认-ctrl+v 粘贴入 --- 默认-ctrl+alt+v 重做 --- 默认-shift+ctrl+z 功能栏:表格菜单 表格选项: 表格设置... --- 默认-shift+ctrl+alt+b 插入: 列... --- 表格-ctrl+alt+9 插入: 行... --- 表格-ctrl+9 插入表格... --- 文本-shift+ctrl+alt+t