曼昆经济学原理英文版习题答案35章THE SHORT-RUN TRADE-OFF BETWEEN INFLATION AND UNEMPLOYMENT
- 格式:doc
- 大小:845.50 KB
- 文档页数:22
第29 章1.Definition of money: the set of assets in an economy that people regularly use to buy goods and services from other people.2.Definition of medium of exchange: an item that buyers give to sellers when they want to purchase goods and services.3. Definition of unit of account: the yardstick people use to post prices and record debts.4. Definition of store of value: an item that people can use to transfer purchasing power from the present to the future.5.Definition of liquidity: the ease wi th which an asset can be converted into the economy’s medium of exchange.6.Definition of commodity money: money that takes the form of a commodity with intrinsic value.7. Definition of fiat money: money without intrinsic value that is used as money because of government decree.8.Definition of currency: the paper bills and coins in the hands of the public.9.Definition of demand deposits: balances in bank accounts that depositors can access on demand by writing a check.10.Definition of Federal Reserve (Fed): the central bank of the United States.11. Definition of central bank: An institution designed to oversee the banking system and regulate the quantity of money in the economy.12. Definition of money supply: the quantity of money available in the economy.13. Definition of monetary policy: the setting of the money supply by policymakers in the central bank.14. Definition of reserves: deposits that banks have received but have not loaned out.15. Definition of fractional-reserve banking: a banking system in which banks hold only a fraction of deposits as reserves.16. Definition of reserve ratio: the fraction of deposits that banks hold as reserves.17.Definition of money multiplier: the amount of money the banking system generates with each dollar of reserves.18.Definition of bank capital: the resources a bank’s owners have put into the institution.19.Definition of leverage: the use of borrowed money to supplement existing funds for purposes of investment.20.Definition of leverage ratio: the ratio of assets to bank capital.21. Definition of capital requirement: a government regulation specifying a minimum amount of bank capital.22. Definition of open-market operations: the purchase and sale of U.S. government bonds by the Fed.23. Definition of discount rate: the interest rate on the loans that the Fed makes to banks.24.Definition of reserve requirements: regulations on the minimum amount of reserves that banks must hold against deposits.25.Definition of federal funds rate: the short-term interest rate that banks charge one another for loans.第30章1. Definition of quantity theory of money: a theory asserting that the quantity of money available determines the price level and that the growth rate in the quantity of money available determines the inflation rate.2. Definition of nominal variables: variables measured in monetary units3. Definition of real variables: variables measured in physical units.4. Definition of classical dichotomy: the theoretical separation of nominal and real variables.5. Definition of monetary neutrality: the proposition that changes in the money supply do not affect real variables.6. Definition of velocity of money: the rate at which money changes hands.7. Definition of quantity equation: the equation M × V = P × Y which relates the quantity of money the velocity of money and the dollar value of the economy’s output of goods and services.8. Definition of inflation tax: the revenue the government raises by creating money.9. Definition of Fisher effect: the one-for-one adjustment of the nominal interest rate to the inflation rate.10. Definition of shoeleather costs: the resources wasted when inflation encourages people to reduce their money holdings.11. Definition of menu costs: the costs of changing prices.第31章1.Definition of closed economy: an economy that does not interact with other economies in the world.2. Definition of open economy: an economy that interacts freely with other economies around the world.3. Definition of exports: goods and services that are produced domestically and sold abroad.4. Definition of imports: goods and services that are produced abroad and sold domestically.5.Definition of net exports: the value of a nation’s exports minus the value of its imports also calle d the trade balance.6. Definition of trade balance: the value of a nation’s exports minus the value of its imports also called net exports.7. Definition of trade surplus: an excess of exports over imports.8.Definition of trade deficit: an excess of imports over exports.9.Definition of balanced trade: a situation in which exports equal imports.10. Definition of net capital outflow (NCO): the purchase of foreign assets by domestic residents minus the purchase of domestic assets by foreigners.11. Definition of nominal exchange rate: the rate at which a person can trade the currency of one country for the currency of another.12. Definition of appreciation: an increase in the value of a currency as measured by the amount of foreign currency it can buy.13. Definition of depreciation: a decrease in the value of a currency as measured by the amount of foreign currency it can buy.14.Definition of real exchange rate: the rate at which a person can trade the goods and services of one country for the goods and services of another.15.Definition of purchasing-power parity: a theory of exchange rates whereby a unit of any given currency should be able to buy the same quantity of goods in all countries.第32章1.Definition of trade policy: a government policy that directly influences the quantity of goods and services that a country imports or exports.2.2. Definition of capital flight: a large and sudden reduction in the demand for assets located in a country.第33章1. Definition of recession: a period of declining real incomes and rising unemployment.2. Definition of depression: a severe recession.3. Definition of model of aggregate demand and aggregate supply: the model that most economists use to explain short-run fluctuations in economic activity around its long-run trend.4. Definition of aggregate-demand curve: a curve that shows the quantity of goods and services that households firms and the government want to buy at each price level.5. Definition of aggregate-supply curve: a curve that shows the quantity of goods and services that firms choose to produce and sell at each price level6.Dfinition of natural level of output: the production of goods and services that an economy achieves in the long run when unemployment is at its natural rate.7. Definition of stagflation: a period of falling output and rising prices.第三十四章1.Definition of theory of liquidity preference: Keynes’s theory that the interest rate adjusts to bring money supply and money demand into balance.2.Definition of fiscal policy: the setting of the level of government spending and taxation by government policymakers.3.Definition of multiplier effect: the additional shifts in aggregate demand that result when expansionary fiscal policy increases income and thereby increases consumer spending.4. Definition of crowding-out effect: the offset in aggregate demand that results when expansionary fiscal policy raises the interest rate and thereby reduces investment spending.5. Definition of automatic stabilizers: changes in fiscal policy that stimulate aggregate demand when the economy goes into a recession without policymakers having to take any deliberate action.第三十五章1. Definition of Phillips curve: a curve that shows the short-run trade-off between inflation and unemployment.2. Definition of the natural-rate hypothesis: the claim that unemployment eventually returns to its normal or natural rate regardless of the rate of inflation.3.Definition of supply shock: an event that directly alters firms’ costs and prices shif ting the economy’s aggregate-supply curve and thus the Phillips curve.4. Definition of sacrifice ratio: the number of percentage points of annual output lost in the process of reducing inflation by one percentage point.5. Definition of rational expectations: the theory according to which people optimally use all the information they have including information about government policies when forecasting the future.。

曼昆微观经济学课后练习英文答案集团标准化办公室:[VV986T-J682P28-JP266L8-68PNN]the link between buyers’ willingness to pay for a good and the demandcurve.how to define and measure consumer surplus.the link between sellers’ costs of producing a good and the supply curve.how to define and measure producer surplus.that the equilibrium of supply and demand maximizes total surplus in amarket.CONTEXT AND PURPOSE:Chapter 7 is the first chapter in a three-chapter sequence on welfare economics and market efficiency. Chapter 7 employs the supply and demand model to develop consumer surplus and producer surplus as a measure of welfare and market efficiency. These concepts are then utilized in Chapters 8 and 9 to determine the winners and losers from taxation and restrictions on international trade.The purpose of Chapter 7 is to develop welfare economics—the study of how the allocation of resources affects economic well-being. Chapters 4 through 6 employed supply and demand in a positive framework, which focused on the question, “What is the equilibrium price and quantity in a market” This chapter now addresses the normative question, “Is the equilibrium price and quantity in a market the best possible solution to the resource allocation problem, or is it simply the price and quantity that balance supply and demand” Students will discover that under most circumstances the equilibrium price and quantity is also the one that maximizes welfare.KEY POINTS:Consumer surplus equals buyers’ willingness to pay for a good minus the amount they actually pay for it, and it measures the benefit buyers get from participating in a market. Consumer surplus can be computed by finding the area below the demand curve and above the price.Producer surplus equals the amount sellers receive for their goods minus their costs of production, and it measures the benefit sellers get from participating in a market. Producer surplus can be computed by finding the area below the price and above the supply curve.An allocation of resources that maximizes the sum of consumer and producer surplus is said to be efficient. Policymakers are often concerned with the efficiency, as well as the equality, of economic outcomes.The equilibrium of supply and demand maximizes the sum of consumer andproducer surplus. That is, the invisible hand of the marketplace leadsbuyers and sellers to allocate resources efficiently.Markets do not allocate resources efficiently in the presence of market failures such as market power or externalities.CHAPTER OUTLINE:I. Definition of welfare economics: the study of how the allocation of resources affects economic well-being.A. Willingness to Pay1. Definition of willingness to pay: the maximum amount that a buyer will pay for a good.2. Example: You are auctioning a mint-condition recording of Elvis Presley’s first album. Four buyers show up. Their willingness to pay is as follows:If the bidding goes to slightly higher than $80, all buyersdrop out except for John. Because John is willing to paymore than he has to for the album, he derives some benefitfrom participating in the market.3. Definition of consumer surplus: the amount a buyer is willing to payfor a good minus the amount the buyer actually pays for it.4. Note that if you had more than one copy of the album, the price in the auction would end up being lower (a little over $70 in the case of two albums) and both John and Paul would gain consumer surplus.B. Using the Demand Curve to Measure Consumer Surplus1. We can use the information on willingness to pay to derive a demandmarginal buyer . Because the demand curve shows the buyers’ willingness to pay, we can use the demand curve to measure c onsumer surplus.C. How a Lower Price Raises Consumer Surplussurplus because they are paying less for the product than before (area A on the graph).b. Because the price is now lower, some new buyers will enter the market and receive consumer surplus on these additional units of output purchased (area B on the graph).D. What Does Consumer Surplus Measure?1. Remember that consumer surplus is the difference between the amount that buyers are willing to pay for a good and the price that they actually pay.2. Thus, it measures the benefit that consumers receive from the good as the buyers themselves perceive it.III. Producer SurplusA. Cost and the Willingness to Sell1. Definition of cost: the value of everything a seller must give up to produce a good .2. Example: You want to hire someone to paint your house. You accept bidsfor the work from four sellers. Each painter is willing to work if the priceyou will pay exceeds her opportunity cost. (Note that this opportunity costthus represents willingness to sell.) The costs are:sellers will drop out except for Grandma. Because Grandma receives more than she would require to paint the house, she derives some benefit from producing in the market.4. Definition of producer surplus: the amount a seller is paid for a good minus the seller’s cost of providing it.5. Note that if you had more than one house to paint, the price in the auction would end up being higher (a little under $800 in the case of two houses) and both Grandma and Georgia would gain producer surplus.ALTERNATIVE CLASSROOM EXAMPLE:Review the material on price ceilings from Chapter 6. Redraw themarket for two-bedroom apartments in your town. Draw in a priceceiling below the equilibrium price.Then go through:consumer surplus before the price ceiling is put into place. consumer surplus after the price ceiling is put into place. You will need to take some time to explain the relationship between the producers’ willingness to sell and the cost of producing the good. The relationship between cost and the supply curve is not as apparent as the relationship between the It is important to stress that consumer surplus is measured inmonetary terms. Consumer surplus gives us a way to place amonetary cost on inefficient market outcomes (due to governmentB. Using the Supply Curve to Measure Producer Surplus1. We can use the information on cost (willingness to sell) to derive a2.the cost of the marginal seller. Because the supply curve shows the sellers’ cost (willingness to sell), we can use the supply curve to measure producer surplus.C. How a Higher Price Raises Producer Surplussurplus because they are receiving more for the product than before (area C on the graph).b. Because the price is now higher, some new sellers will enter the market and receive producer surplus on these additional units of output sold (area D on the graph).D. Producer surplus is used to measure the economic well-being of producers,ALTERNATIVE CLASSROOM EXAMPLE:Review the material on price floors from Chapter 6. Redraw the marketfor an agricultural product such as corn. Draw in a price supportabove the equilibrium price.Then go through:producer surplus before the price support is put in place.producer surplus after the price support is put in place.Make sure that you discuss the cost of the price support tomuch like consumer surplus is used to measure the economic well-being of consumers.IV. Market EfficiencyA. The Benevolent Social Planner1. The economic well-being of everyone in society can be measured by total surplus, which is the sum of consumer surplus and producer surplus:Total Surplus = Consumer Surplus + Producer SurplusTotal Surplus = (Value to Buyers – Amount Paid byBuyers) +(Amount Received by Sellers – Cost to Sellers)Because the Amount Paid by Buyers = Amount Received bySellers:2. Definition of efficiency: the property of a resource allocation of maximizing the total surplus received by all members of society .3. Definition of equality: the property of distributing economicprosperity uniformly the members of society .a. Buyers who value the product more than the equilibrium price will purchase the product; those who do not, will not purchase the product. Inother words, the free market allocates the supply of a good to the buyers who value it most highly, as measured by their willingness to pay.b. Sellers whose costs are lower than the equilibrium price will produce the product; those whose costs are higher, will not produce the product. Inother words, the free market allocates the demand for goods to the sellers who can produce it at the lowest cost.value of the product to the marginal buyer is greater than the cost to the marginal seller so total surplus would rise if output increases.Pretty Woman, Chapter 6. Vivien (Julia Roberts) and Edward(Richard Gere) negotiate a price. Afterward, Vivien reveals shewould have accepted a lower price, while Edward admits he wouldhave paid more. If you have done a good job of introducingconsumer and producer surplus, you will see the light bulbs gob. At any quantity of output greater than the equilibrium quantity, the value of the product to the marginal buyer is less than the cost to the marginal seller so total surplus would rise if output decreases.3. Note that this is one of the reasons that economists believe Principle #6: Markets are usually a good way to organize economic activity.C. In the News: Ticket Scalping1. Ticket scalping is an example of how markets work to achieve anefficient outcome.2. This article from The Boston Globe describes economist Chip Case’sexperience with ticket scalping.D. Case Study: Should There Be a Market in Organs?1. As a matter of public policy, people are not allowed to sell their organs.a. In essence, this means that there is a price ceiling on organs of $0.b. This has led to a shortage of organs.2. The creation of a market for organs would lead to a more efficientallocation of resources, but critics worry about the equity of a market system for organs.V. Market Efficiency and Market FailureA. To conclude that markets are efficient, we made several assumptions about how markets worked.1. Perfectly competitive markets.2. No externalities.B. When these assumptions do not hold, the market equilibrium may not be efficient.C. When markets fail, public policy can potentially remedy the situation. SOLUTIONS TO TEXT PROBLEMS:Quick Quizzes1. Figure 1 shows the demand curve for turkey. The price of turkey is P 1and the consumer surplus that results from that price is denoted CS. Consumer surplus is the amount a buyer is willing to pay for a good minus the amount the buyer actually pays for it. It measures the benefit to buyers ofparticipating in a market.Figure 1 Figure 22. Figure 2 shows the supply curve for turkey. The price of turkey is P 1and the producer surplus that results from that price is denoted PS. Producer surplus is the amount sellers are paid for a good minus the sellers’ cost of providing it (measured by the supply curve). It measures the benefit to sellers of participating in a market.It would be a good idea to remind students that there are circumstances when the market process does not lead to the most efficient outcome. Examples include situations such as when a firm (or buyer) has market power over price or when there areFigure 33. Figure 3 shows the supply and demand for turkey. The price of turkey is P, consumer surplus is CS, and producer surplus is PS. Producing more turkeys 1than the equilibrium quantity would lower total surplus because the value to the marginal buyer would be lower than the cost to the marginal seller on those additional units.Questions for Review1. The price a buyer is willing to pay, consumer surplus, and the demand curve are all closely related. The height of the demand curve represents the willingness to pay of the buyers. Consumer surplus is the area below the demand curve and above the price, which equals the price that each buyer is willing to pay minus the price actually paid.2. Sellers' costs, producer surplus, and the supply curve are all closely related. The height of the supply curve represents the costs of the sellers. Producer surplus is the area below the price and above the supply curve, which equals the price received minus each seller's costs of producing the good.Figure 43. Figure 4 shows producer and consumer surplus in a supply-and-demand diagram.4. An allocation of resources is efficient if it maximizes total surplus, the sum of consumer surplus and producer surplus. But efficiency may not be the only goal of economic policymakers; they may also be concerned about equitythe fairness of the distribution of well-being.5. The invisible hand of the marketplace guides the self-interest of buyers and sellers into promoting general economic well-being. Despite decentralized decision making and self-interested decision makers, free markets often lead to an efficient outcome.6. Two types of market failure are market power and externalities. Market power may cause market outcomes to be inefficient because firms may cause price and quantity to differ from the levels they would be under perfect competition, which keeps total surplus from being maximized. Externalities are side effects that are not taken into account by buyers and sellers. As a result, the free market does not maximize total surplus.Problems and Applications1. a. Consumer surplus is equal to willingness to pay minus the price paid. Therefore, Melissa’s willingness to pay must be $200 ($120 + $80).b. Her consumer surplus at a price of $90 would be $200 $90 = $110.c. If the price of an iPod was $250, Melissa would not have purchased one because the price is greater than her willingness to pay. Therefore, she would receive no consumer surplus.2. If an early freeze in California sours the lemon crop, the supply curve for lemons shifts to the left, as shown in Figure 5. The result is a rise in the price of lemons and a decline in consumer surplus from A + B + C to just A. So consumer surplus declines by the amount B + C.Figure 5 Figure 6In the market for lemonade, the higher cost of lemons reduces the supply of lemonade, as shown in Figure 6. The result is a rise in the price of lemonade and a decline in consumer surplus from D + E + F to just D, a loss of E + F. Note that an event that affects consumer surplus in one market oftenhas effects on consumer surplus in other markets.3. A rise in the demand for French bread leads to an increase in producer surplus in the market for French bread, as shown in Figure 7. The shift of the demand curve leads to an increased price, which increases producer surplusfrom area A to area A + B + C.Figure 7The increased quantity of French bread being sold increases the demandfor flour, as shown in Figure 8. As a result, the price of flour rises, increasing producer surplus from area D to D + E + F. Note that an event that affects producer surplus in one market leads to effects on producer surplus in related markets.Figure 84. a.Figure 9b. When the price of a bottle of water is $4, Bert buys two bottles of water. His consumer surplus is shown as area A in the figure. He values hisfirst bottle of water at $7, but pays only $4 for it, so has consumer surplus of $3. He values his second bottle of water at $5, but pays only $4 for it, so has consumer surplus of $1. Thus Bert’s total consumer surplus is $3 + $1 = $4, which is the area of A in the figure.c. When the price of a bottle of water falls from $4 to $2, Bert buys three bottles of water, an increase of one. His consumer surplus consists of both areas A and B in the figure, an increase in the amount of area B. He gets consumer surplus of $5 from the first bottle ($7 value minus $2 price), $3from the second bottle ($5 value minus $2 price), and $1 from the third bottle ($3 value minus $2 price), for a total consumer surplus of $9. Thus consumer surplus rises by $5 (which is the size of area B) when the price of a bottle of water falls from $4 to $2.5. a.Figure 10b. When the price of a bottle of water is $4, Ernie sells two bottles of water. His producer surplus is shown as area A in the figure. He receives $4 for his first bottle of water, but it costs only $1 to produce, so Ernie has producer surplus of $3. He also receives $4 for his second bottle of water, which costs $3 to produce, so he has producer surplus of $1. Thus Ernie’s total producer surplus is $3 + $1 = $4, which is the area of A in the figure.c. When the price of a bottle of water rises from $4 to $6, Ernie sells three bottles of water, an increase of one. His producer surplus consists of both areas A and B in the figure, an increase by the amount of area B. He gets producer surplus of $5 from the first bottle ($6 price minus $1 cost), $3 from the second bottle ($6 price minus $3 cost), and $1 from the third bottle ($6 price minus $5 price), for a total producer surplus of $9. Thus producer surplus rises by $5 (which is the size of area B) when the price of a bottle of water rises from $4 to $6.6. a. From Ernie’s supply schedule and Bert’s demand schedule, thean equilibrium quantity of two.b. At a price of $4, consumer surplus is $4 and producer surplus is $4, as shown in Problems 3 and 4 above. Total surplus is $4 + $4 = $8.c. If Ernie produced one less bottle, his producer surplus would decline to $3, as shown in Problem 4 above. If Bert consumed one less bottle, hisconsumer surplus would decline to $3, as shown in Problem 3 above. So total surplus would decline to $3 + $3 = $6.d. If Ernie produced one additional bottle of water, his cost would be $5, but the price is only $4, so his producer surplus would decline by $1. If Bert consumed one additional bottle of water, his value would be $3, but the price is $4, so his consumer surplus would decline by $1. So total surplus declines by $1 + $1 = $2.7. a. The effect of falling production costs in the market for stereos results in a shift to the right in the supply curve, as shown in Figure 11. As a result, the equilibrium price of stereos declines and the equilibriumquantity increases.Figure 11b. The decline in the price of stereos increases consumer surplus from area A to A + B + C + D, an increase in the amount B + C + D. Prior to the shift in supply, producer surplus was areas B + E (the area above the supply curve and below the price). After the shift in supply, producer surplus is areas E + F + G. So producer surplus changes by the amount F + G – B, which may be positive or negative. The increase in quantity increases producer surplus, while the decline in the price reduces producer surplus. Because consumer surplus rises by B + C + D and producer surplus rises by F + G – B, total surplus rises by C + D + F + G.c. If the supply of stereos is very elastic, then the shift of the supply curve benefits consumers most. To take the most dramatic case, suppose the supply curve were horizontal, as shown in Figure 12. Then there is no producer surplus at all. Consumers capture all the benefits of falling production costs, with consumer surplus rising from area A to area A + B.Figure 128. Figure 13 shows supply and demand curves for haircuts. Supply equals demand at a quantity of three haircuts and a price between $4 and $5. Firms A, C, and D should cut the hair of Ellen, Jerry, and Phil. Oprah’s willingnessto pay is too low and firm B’s costs are too high, so they do not participate. The maximum total surplus is the area between the demand and supply curves, which totals $11 ($8 value minus $2 cost for the first haircut, plus $7 value minus $3 cost for the second, plus $5 value minus $4 cost for the third).Figure 139. a. The effect of falling production costs in the market for computers results in a shift to the right in the supply curve, as shown in Figure 14. As a result, the equilibrium price of computers declines and the equilibrium quantity increases. The decline in the price of computers increases consumer surplus from area A to A + B + C + D, an increase in the amount B + C + D.Figure 14 Figure 15Prior to the shift in supply, producer surplus was areas B + E(the area above the supply curve and below the price). After theshift in supply, producer surplus is areas E + F + G. So producersurplus changes by the amount F + G – B, which may be positive ornegative. The increase in quantity increases producer surplus,while the decline in the price reduces producer surplus. Becauseconsumer surplus rises by B + C + D and producer surplus rises byF +G – B, total surplus rises by C + D + F + G.b. Because typewriters are substitutes for computers, the decline in the price of computers means that people substitute computers for typewriters, shifting the demand for typewriters to the left, as shown in Figure 15. The result is a decline in both the equilibrium price and equilibrium quantity of typewriters. Consumer surplus in the typewriter market changes from area A + B to A + C, a net change of C – B. Producer surplus changes from area C + D + E to area E, a net loss of C + D. Typewriter producers are sad about technological advances in computers because their producer surplus declines.c. Because software and computers are complements, the decline in the price and increase in the quantity of computers means that the demand for software increases, shifting the demand for software to the right, as shown in Figure 16. The result is an increase in both the price and quantity of software. Consumer surplus in the software market changes from B + C to A + B, a net change of A – C. Producer surplus changes from E to C + D + E, an increase of C + D, so software producers should be happy about the technological progress in computers.Figure 16d. Yes, this analysis helps explain why Bill Gates is one the world’s richest people, because his company produces a lot of software that is a complement with computers and there has been tremendous technological advance in computers.10. a. With Provider A, the cost of an extra minute is $0. WithProvider B, the cost of an extra minute is $1.b. With Provider A, my friend will purchase 150 minutes [= 150 –(50)(0)]. With Provider B, my friend would purchase 100 minutes [=150 – (50)(1)].c. With Provider A, he would pay $120. The cost would be $100 with Provider B.Figure 17d. Figure 17 shows the friend’s demand. With Provider A, he buys 150minutes and his consumer surplus is equal to (1/2)(3)(150) – 120= 105. With Provider B, his consumer surplus is equal to(1/2)(2)(100) = 100.e. I would recommend Provider A because he receives greater consumer surplus.11. a. Figure 18 illustrates the demand for medical care. If each procedure has a price of $100, quantity demanded will be Q1 procedures.Figure 18b. If consumers pay only $20 per procedure, the quantity demanded will be Qprocedures. Because the cost to society is $100, the number of procedures 2performed is too large to maximize total surplus. The quantity that maximizes total surplus is Q1 procedures, which is less than Q2.c. The use of medical care is excessive in the sense that consumers get procedures whose value is less than the cost of producing them. As a result, the economy’s total surplus is reduced.d. To prevent this excessive use, the consumer must bear the marginal cost of the procedure. But this would require eliminating insurance. Another possibility would be that the insurance company, which pays most of the marginal cost of the procedure ($80, in this case) could decide whether the procedure should be performed. But the insurance company does not get the benefits of the procedure, so its decisions may not reflect the value to the consumer.。
曼昆经济学原理英文第六版答案【篇一:曼昆经济学原理英文版文案加习题答案8章】ation a new in the news box on ―the tax debate‖ has been added.by the end of this chapter, students should understand:? how taxes reduce consumer and producer surplus.? the meaning and causes of the deadweight loss from a tax. ? why some taxes have larger deadweight losses than others. ? how tax revenue and deadweight loss vary with the size of a tax.chapter 8 is the second chapter in a three-chapter sequence dealing with welfare economics. in theprevious section on supply and demand, chapter 6 introduced taxes and demonstrated how a tax affects the price and quantity sold in a market. chapter 6 also described the factors that determine how the burden of the tax is divided between the buyers and sellers in a market. chapter 7 developed welfare economics—the study of how the allocation of resources affects economic well-being. chapter 8 combines the lessons learned in chapters 6 and 7 and addresses the effects of taxation on welfare. chapter 9 will address the effects of trade restrictions on welfare. the purpose of chapter 8 is to apply the lessons learned about welfare economics in chapter 7 to the issue of taxation that was addressed in chapter 6. students will learn that the cost of a tax to buyers and sellers in a market exceeds the revenue collected by the government. students will also learn about the factors that determine the degree by which the cost of a tax exceeds the revenue collected by the government.144? a tax on a good reduces the welfare of buyers and sellers of the good, and the reduction in consumer and producer surplus usually exceeds the revenue raised by the government. the fall in total surplus—the sum of consumer surplus, producer surplus, and tax revenue—is called thedeadweight loss of the tax.taxes have deadweight losses because they cause buyers to consume less and sellers to produce less, and these changesin behavior shrink the size of the market below the level that maximizes total surplus. because the elasticities of supply and demand measure how much market participants respond to market conditions, larger elasticities imply larger deadweight losses.as a tax grows larger, it distorts incentives more, and its deadweight loss grows larger. because a tax reduces the size of a market, however, tax revenue does not continually increase. it first rises with the size of a tax, but if the tax gets large enough, tax revenue starts to fall. ? ?i. the deadweight loss of taxationa. remember that it does not matter who a tax is levied on; buyers and sellers will likely share inthe burden of the tax.b. if there is a tax on a product, the price that a buyer pays will be greater than the price the sellerreceives. thus, there is a tax wedge between the two prices and the quantity sold will be smaller if there was no tax.c. how a tax affects market participants1. we can measure the effects of a tax on consumers by examining the change in consumersurplus. similarly, we can measure the effects of the tax on producers by looking at the change in producer surplus.then the benefit from the tax revenue must not be ignored.3. welfare without a taxa. consumer surplus is equal to: a + b + c.b. producer surplus is equal to: d + e + f.c. total surplus is equal to: a + b + c + d + e + f. 4. welfare with a tax a. consumer surplus is equal to: a.b. producer surplus is equal to: f.5. changes in welfare a. consumer surplus changes by: –(b +c). b. producer surplus changes by: –(d + e). c. tax revenue changes by: +(b + d). d. total surplus changes by: –(c + e). 6. definition of distortion, such as a tax. d. deadweight losses and the gains from tradec. tax revenue is equal to: b +d. d. total surplus is equal to: a +b + d + f.1. taxes cause deadweight losses because they prevent buyers and sellers from benefiting fromtrade.2. this occurs because the quantity of output declines; trades that would be beneficial to both the buyer and seller will nottake place because of the tax.3. the deadweight loss is equal to areas c and e (the drop intotal surplus).4. note that output levels between the equilibrium quantity without the tax and the quantitywith the tax will not be produced, yet the value of these unitsto consumers (represented by the demand curve) is larger than the cost of these units to producers (represented by the supply curve).ii. the determinants of the deadweight lossa. the price elasticities of supply and demand will determinethe size of the deadweight loss that occurs from a tax. 1. givena stable demand curve, the deadweight loss is larger when supply is relatively elastic.2. given a stable supply curve, the deadweight loss is larger when demand is relatively elastic. b. case study: the deadweight loss debate1. social security tax and federal income tax are taxes onlabor earnings. a labor tax places a tax wedge between thewage the firm pays and the wage that workers receive.2. there is considerable debate among economists concerning the size of the deadweight lossfrom this wage tax.3. the size of the deadweight loss depends on the elasticity of labor supply and demand, andthere is disagreement about the magnitude of the elasticity of supply.【篇二:曼昆经济学原理英文版文案加习题答案31章】basic conceptsthere is a new in the news feature on the changing nature of u.s. exports and an updated presentation of the u.s. trade deficit.by the end of this chapter, students should understand:??how net exports measure the international flow of goodsand services.??how net capital outflow measures the international flow of capital.??why net exports must always equal net foreign investment.??how saving, domestic investment, and net capital outflow are related.??the meaning of the nominal exchange rate and the real exchange rate.??purchasing-power parity as a theory of how exchange rates are determined.chapter 18 is the first chapter in a two-chapter sequence dealing with open-economy macroeconomics. chapter 18 develops the basic concepts and vocabulary associated with macroeconomics in an international setting: net exports, net capital outflow, real and nominal exchange rates, and purchasing-power parity. the next chapter, chapter 19, builds an open-economy macroeconomic model that shows how these variables are determined simultaneously.the purpose of chapter 18 is to develop the basic concepts macroeconomists use to study open economies. it addresses why a nation’s net exports must equal its net capital outflow. it also addresses the concepts of the real and nominal exchange rate and develops a theory of exchange ratedetermination known as purchasing-power parity.298??net exports are the value of domestic goods and services sold abroad (exports) minus the value offoreign goods and services sold domestically (imports). net capital outflow is the acquisition of foreign assets by domestic residents (capital outflow) minus the acquisition of domestic assets by foreigners (capital inflow). because every international transaction involves an exchange of an asset for a good or service, an economy’s net capital outflow always equals its net exports.an economy’s saving can be used to finance investment at home or buy assets abroad. thus, national saving equals domestic investment plus net capital outflow.the nominal exchange rate is the relative price of the currency of two countries, and the real exchange rate is the relative price of the goods and services of two countries. when the nominal exchange rate changes so that each dollar buys more foreign currency, the dollar is said to appreciate or strengthen. when the nominal exchange rate changes so that each dollarbuys less foreign currency, the dollar is said to depreciate or weaken.according to the theory of purchasing-power parity, a dollar (or a unit of any other currency) should be able to buy the same quantity of goods in all countries. this theory implies that the nominal exchange rate between the currencies of two countries should reflect the price levels in those countries. as a result, countries with relatively high inflation should have depreciating currencies, and countries with relatively low inflation should have appreciating currencies. ?? ?? ??i. we will no longer be assuming that the economy is a closed economy.a. definition of in the world.b. definition of around the world.ii. the international flows of goods and capitala. the flow of goods: exports, imports, and net exports1. definition of abroad.2. definition of domestically.imports, also called the trade balance.4. definition of : the value of a nation’s exports minus the value of its imports, also called net exports.5. definition of .6. definition of .7. definition of .8. there are several factors that influence a country’s exports, imports, and net exports:a. the tastes of consumers for domestic and foreign goods.b. the prices of goods at home and abroad.c. the exchange rates at which people can use domestic currency to buy foreign currencies.d. the incomes of consumers at home and abroad.e. the cost of transporting goods from country to country.f. government policies toward international trade.9. case study: the increasing openness of the u.s. economy a. figure 1 shows the total value of exports and imports (expressed as a percentage of gdp) for the united states since 1950. b. advances in transportation, telecommunications, and technological progress are some of the reasons why international trade has increased over time. c. policymakers around the world have also become more accepting of freetrade over time. 10. in the news: the changing nature of u.s. exports a. growing u.s. exports include entertainment royalties, tourism, travel, and services. b. this article from the wall street journal describes the growth in new exports. b. the flow of financial resources: net capital outflow1. definition of residents minus the purchase of domestic assets by foreigners.2. the flow of capital abroad takes two forms. a. foreign direct investment occurs when a capital investment is owned and operated by a foreign entity.b. foreign portfolio investment involves an investment that is financed with foreign money but operated by domestic residents.3. net capital outflow can be positive or negative.a. when net capital outflow is positive, domestic residents are buying more foreign assets than foreigners are buying domestic assets. capital is flowing out of the country.b. when net capital outflow is negative, domestic residents are buying fewer foreign assets than foreigners are buying domestic assets. the country is experiencing a capital inflow. 4. there are several factors that influence a country’s net capital outflow:a. the real interest rates being paid on foreign assets.b. the real interest rates being paid on domestic assets.c. the perceived economic and political risks of holding assets abroad.d. the government policies that affect foreign ownership of domestic assets.c. the equality of net exports and net capital outflow1. net exports and net capital outflow each measure a type of imbalance in a world market.a. net exports measure the imbalance between a country’s exports and imports in world markets for goods and services.b. net capital outflow measures the imbalance between the amount of foreign assets bought by domestic residents andthe amount of domestic assets bought by foreigners inworld financial markets.2. for an economy, net exports must be equal to net capital outflow.3. example: you are a computer programmer who sells some software to a japanese consumer for 10,000 yen. a. thesale is an export of the united states so u.s. net exports increase.b. there are several things you could do with the 10,000 yenc. you could hold the yen (which is a japanese asset) or use it to purchase another japanese asset. either way, u.s. net capital outflow rises.d. alternatively, you could use the yen to purchase a japanese good. thus, u.s. imports will rise so the net effect on net exports will be zero.e. one final possibility is that you could exchange the yen for dollars at a bank. this doesnot change the situation though, because the bank then must use the yen for something.alternative classroom example: assume that u.s. residents do not want to buy any foreign assets, but foreign residents want to purchase some stock in a u.s. firm (such as microsoft). how are the foreigners going to get the dollars to purchase the stock? they would do it the same way u.s. residents would purchase the stock—they would have to earn more than they spend. in other words, foreigners must sell the united states more goods and services than they purchase from the united states. this leads to negative net exports for the united states. the extra dollars spent by u.s. residents on foreign-produced goods and services would be used to purchase the stock in microsoft. 4. this example can be generalized to the economy as a whole.a. when a nation is running a trade surplus (nx 0), it must be using the foreign currencyto purchase foreign assets. thus, capital is flowing out of the country (nco 0).b. when a nation is running a trade deficit (nx 0), it must be financing the net purchase of these goods by selling assets abroad. thus, capital is flowing into the country (nco0).5. every international transaction involves exchange. when a seller country transfers a good orservice to a buyer country, the buyer country gives up some asset to pay for the good or service.6. thus, the net value of the goods and services sold by a country (net exports) must equal thenet value of the assets acquired (net capital outflow).d. saving, investment, and their relationship to the international flows1. recall that gdp (y ) is the sum of four components: consumption (c ), investment (i ),government purchases (g ) and net exports (nx ).【篇三:曼昆宏观经济学课后答案(英文版)】quizzes:1. gross domestic product measures two things at once: (1) the total income of everyonein the economy; and (2) the total expenditure on the economy’s output of goods and services. it can measure both of these things at once because income must equal expenditure for the economy as a whole.2. the production of a pound of caviar contributes more to gdp than the production of apound of hamburger because the contribution to gdp is measured by market value and the price of a pound of caviar is much higher than the price of a pound of hamburger.3. the four components of expenditure are: (1) consumption;(2) investment; (3)government purchases; and (4) net exports. the largest component is consumption, which accounts for more thantwo-thirds of total expenditure.4. nominal gdp is the production of goods and services valued at current prices. realgdp is the production of goods and services valued at constant prices. real gdp is a better measure of economicwell-being because it reflects the eco nomy’s ability to satisfy people’s needs and desires. thus a rise in real gdp means people have produced more goods and services, but a rise in nominal gdp could occur either because of increased production or because of higher prices.5. although gdp is not a perfect measure of well-being, policymakers should care about itbecause a larger gdp means that a nation can afford better health care, better educational systems, and more of the material necessities of life.questions for review:1.2.3.4. an economys income must equal its expenditure, since every transaction has a buyer and a seller. thus, expenditure by buyers must equal income by sellers. the production of a luxury car contributes more to gdp than the production of an economy car because the luxury car has a higher market value. the contribution to gdp is $3, the market value of the bread, which is the final good that is sold. the sale of used records does not affect gdp at all because it involves no current production.5. the four components of gdp are consumption, such as the purchase of a music cd;investment, such as the purchase of a computer by a business; government purchases, such as an order for military aircraft; and net exports, such as the sale of american wheat to russia.6. economists use real gdp rather than nominal gdp to gauge economic well-beingbecause real gdp is not affected by changes in prices, so it reflects only changes in the amounts being produced. if nominal gdp rises, you do not know if that is because of increased production or higher prices.7.the percentage change in nominal gdp is (600-200)/200 x 100 = 200%. the percentage change in real gdp is (400-200)/200 x 100 = 100%. the percentage change in the deflator is (150-100)/100 x 100 = 50%.8. it is desirable for a country to have a large gdp because people could enjoy more goodsand services. but gdp is not the only important measure of well-being. for example, laws that restrict pollution cause gdp to be lower. if laws against pollution were eliminated, gdp would be higher but the pollution might make us worse off. or, for example, an earthquake would raise gdp, as expenditures on cleanup, repair, and rebuilding increase. but an earthquake is an undesirable event that lowers our welfare.problems and applications:1. a. consumption increases because a refrigerator is a good purchased by ahousehold.b. investment increases because a house is an investment good.c. consumption increases because a car is a good purchased by a household, butinvestment decreases because the car in ford’s inventory had been counted as aninvestment good until it was sold.d. consumption increases because pizza is a good purchased by a household.e. government purchases increase because the government spent money to providea good to the public.f. consumption increases because the bottle is a good purchased by a household,but net exports decrease because the bottle was imported.g. investment increases because new structures and equipment were built.2.3. with transfer payments, nothing is produced, so there is no contribution to gdp. purchases of new housing are included in the investment portion of gdp because housingprovides services for a long time. for the same reason, purchases of new cars could be thought of as investment, but by convention, they are not. the logic could apply to any durable good, such as household appliances.if gdp included goods that are resold, it would be counting output of that particular year, plus sales of goods produced ina previous year. it would double-count goods that were sold more than once and would count goods in gdp for severalyears if they were produced in one year and resold in another. 4.5. a. 2001: ($1 per qt. of milk ? 100 qts. milk) + ($2 per qt. of honey ? 50 qts. honey)= $2002002: ($1 per qt. of milk ? 200 qts. milk) + ($2 per qt. of honey ? 100 qts.honey) = $4002003: ($2 per qt. of milk ? 200 qts. milk) + ($4 per qt. of honey ? 100 qts.honey) = $8002001: ($1 per qt. of milk ? 100 qts. milk) + ($2 per qt. ofhoney ? 50 qts. honey)= $2002002: ($1 per qt. of milk ? 200 qts. milk) + ($2 per qt. of honey ? 100 qts.honey) = $4002003: ($1 per qt. of milk ? 200 qts. milk) + ($2 per qt. of honey ? 100 qts.honey) = $4002001: ($200/$200) ? 100 = 1002002: ($400/$400) ? 100 = 1002003: ($800/$400) ? 100 = 200b. percentage change in nominal gdp in 2002 = [($400 - $200)/$200] ? 100 =100%.percentage change in nominal gdp in 2003 = [($800 -$400)/$400] ? 100 =100%.percentage change in real gdp in 2002 = [($400 - $200)/$200] ? 100 = 100%.percentage change in real gdp in 2003 = [($400 - $400)/$400] ? 100 = 0%.percentage change in the gdp deflator in 2002 = [(100 -100)/100] ? 100 = 0%.percentage change in the gdp deflator in 2003 = [(200 -100)/100] ? 100 =100%.prices did not change from 2001 to 2002. thus, thepercentage change in thegdp deflator is zero. likewise, output levels did not change from 2002 to 2003.this means that the percentage change in real gdp is zero.c. economic well-being rose more in 2002 than in 2003, since real gdp rose in2002 but not in 2003. in 2002, real gdp rose and prices didn’t. in 2003, realgdp didn’t rise and prices did.6.a.b.c.d.e.f.7. the growth rate of nominal gdp is higher than the growth rate of real gdp because of inflation. the growth rate of real gdp is ($8,367 - $8,203)/$8,203 ? 100% = 2.0%. real gdp in 2000 (in 1996 dollars) is $9,873/(118/100) = $8,367. real gdp in 1999 (in 1996 dollars) is $9,269/(113/100) = $8,203. the growth rate ofthe deflator is (118 - 113)/113 ? 100% = 4.4%. the growth rate of nominal gdp is ($9,873 - $9,269)/$9,269 ? 100% = 6.5%. economists ignore the rise in peoples incomes that is caused by higher prices becausealthough incomes are higher, the prices of the goods and services that people buy are also higher. therefore, they will not necessarily be able to purchase more goods and services. for this reason, economists prefer to look at real gdp instead of nominal gdp.many answers are possible.a. gdp equals the dollar amount barry collects, which is $400.8. 9.c.d.e.10. national income = nnp - sales taxes = $350 - $30 = $320. personal income = national income - retained earnings = $320 - $100 = $220. disposable personal income = personal income - personal income tax = $220 - $70 = $150. in countries like india, people produce and consume a fair amount of food at home that isnot included in gdp. so gdp per person in india and the united states will differ by more than their comparative economicwell-being.if the government cares about the total income of americans,it will emphasize gnp, since that measure includes the income of americans that is earned abroad and excludes the income of foreigners. if the government cares about the total amount ofeconomic activity occurring in the united states, it will emphasize gdp, which measures the level of production in the country, whether produced by domestic citizens or foreigners.a. the increased labor-force participation of women has increased gdp in theunited states, since it means more people are working and production hasincreased.if our measure of well-being included time spent working in the home and takingleisure, it wouldnt rise as much as gdp, since the rise in womens labor-forceparticipation has reduced time spent working in the home and taking leisure.other aspects of well-being that are associated with the rise in womens increasedlabor-force participation include increased self-esteem and prestige for women inthe workforce, especially at managerial levels, but decreased quality time spentwith children, whose parents have less time to spend with them. such aspectswould be quite difficult to measure. 11. 12. b. c.24章quick quizzes1. the consumer price index tries to measure the overall cost of the goods and servicesbought by a typical consumer. it is constructed by surveying consumers to fix a basket of goods and services that the typical consumer buys, finding the prices of the goods and。
第35章通货膨胀与失业之间的短期权衡取舍35.1 复习笔记跨考网独家整理最全经济学考研真题,经济学考研课后习题解析资料库,您可以在这里查阅历年经济学考研真题,经济学考研课后习题,经济学考研参考书等内容,更有跨考考研历年辅导的经济学学哥学姐的经济学考研经验,从前辈中获得的经验对初学者来说是宝贵的财富,这或许能帮你少走弯路,躲开一些陷阱。
以下内容为跨考网独家整理,如您还需更多考研资料,可选择经济学一对一在线咨询进行咨询。
1.菲利普斯曲线(1)短期菲利普斯曲线短期菲利普斯曲线表示通货膨胀和失业之间的短期取舍关系,高通货膨胀率意味着低失业率,高失业率意味着低通货膨胀率。
货币政策和财政政策可以使经济沿着菲利普斯曲线移动。
货币供给增加、政府支出增加或减税都扩大了总需求,并使经济移动到菲利普斯曲线低失业和高通货膨胀的一点上。
货币供给减少,政府支出减少或增税都紧缩了总需求,使经济移动到菲利普斯曲线上低通货膨胀和高失业的一点上。
菲利普斯曲线为决策者提供了一个通货膨胀与失业的选择组合,决策者在菲利普斯曲线上选择一个通货膨胀率和失业率的组合。
(2)长期菲利普斯曲线在长期,经济回到古典学派所预言的充分就业状态,通货膨胀和失业之间不存在取舍关系,因此长期菲利普斯曲线是垂直的。
(3)菲利普斯曲线的移动①长期菲利普斯曲线的移动长期菲利普斯曲线是垂直的,它的位置完全由自然失业率确定。
因而,只有影响自然失业率的因素变化才能引起长期菲利普斯曲线的移动。
②短期菲利普斯曲线的移动预期通货膨胀率的变化以及供给冲击都会引起短期菲利普斯曲线的移动。
预期通货膨胀率升高和不利的供给冲击使得短期菲利普斯曲线上移,决策者面临更不利的通货膨胀和失业的权衡取舍;预期通货膨胀率降低和有利的供给冲击使得短期菲利普斯曲线下移,决策者面临更加有利的通货膨胀和失业的权衡取舍。
2.自然率假说自然率假说是货币主义和理性预期学派的基本观点。
主要内容是:需求的波动仅仅在短期中影响产出与就业。
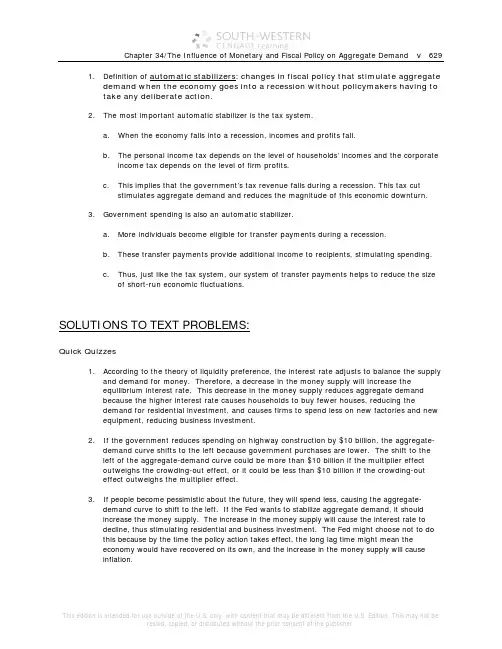
1. Definition of automatic stabilizers: changes in fiscal policy that stimulate aggregatedemand when the economy goes into a recession without policymakers having totake any deliberate action.2. The most important automatic stabilizer is the tax system.a. When the economy falls into a recession, incomes and profits fall.b. The personal income tax depends on the level of households’ incomes and the corporateincome tax depends on the level of firm profits.c. This implies that the government’s tax revenue falls during a recession. This tax cutstimulates aggregate demand and reduces the magnitude of this economic downturn.3. Government spending is also an automatic stabilizer.a. More individuals become eligible for transfer payments during a recession.b. These transfer payments provide additional income to recipients, stimulating spending.c. Thus, just like the tax system, our system of transfer payments helps to reduce the sizeof short-run economic fluctuations.SOLUTIONS TO TEXT PROBLEMS:Quick Quizzes1. According to the theory of liquidity preference, the interest rate adjusts to balance the supplyand demand for money. Therefore, a decrease in the money supply will increase theequilibrium interest rate. This decrease in the money supply reduces aggregate demandbecause the higher interest rate causes households to buy fewer houses, reducing thedemand for residential investment, and causes firms to spend less on new factories and newequipment, reducing business investment.2. If the government reduces spending on highway construction by $10 billion, the aggregate-demand curve shifts to the left because government purchases are lower. The shift to theleft of the aggregate-demand curve could be more than $10 billion if the multiplier effectoutweighs the crowding-out effect, or it could be less than $10 billion if the crowding-outeffect outweighs the multiplier effect.3. If people become pessimistic about the future, they will spend less, causing the aggregate-demand curve to shift to the left. If the Fed wants to stabilize aggregate demand, it shouldincrease the money supply. The increase in the money supply will cause the interest rate todecline, thus stimulating residential and business investment. The Fed might choose not to dothis because by the time the policy action takes effect, the long lag time might mean theeconomy would have recovered on its own, and the increase in the money supply will causeinflation.1. The theory of liquidity preference is Keynes's theory of how the interest rate is determined.According to the theory, the aggregate-demand curve slopes downward because: (1) ahigher price level raises money demand; (2) higher money demand leads to a higher interest rate; and (3) a higher interest rate reduces the quantity of goods and services demanded.Thus, the price level has a negative relationship with the quantity of goods and servicesdemanded.2. A decrease in the money supply shifts the money-supply curve to the left. The equilibriuminterest rate will rise. The higher interest rate reduces consumption and investment, soaggregate demand falls. Thus, the aggregate-demand curve shifts to the left.3. If the government spends $3 billion to buy police cars, aggregate demand might increase bymore than $3 billion because of the multiplier effect on aggregate demand. Aggregatedemand might increase by less than $3 billion because of the crowding-out effect onaggregate demand.4. If pessimism sweeps the country, households reduce consumption spending and firms reduceinvestment, so aggregate demand falls. If the Fed wants to stabilize aggregate demand, it must increase the money supply, reducing the interest rate, which will induce households to save less and spend more and will encourage firms to invest more, both of which willincrease aggregate demand. If the Fed does not increase the money supply, Congress could increase government purchases or reduce taxes to increase aggregate demand.5. Government policies that act as automatic stabilizers include the tax system and governmentspending through the unemployment-benefit system. The tax system acts as an automatic stabilizer because when incomes are high, people pay more in taxes, so they cannot spend as much. When incomes are low, so are taxes; thus, people can spend more. The result is that spending is partly stabilized. Government spending through the unemployment-benefit system acts as an automatic stabilizer because in recessions the government transfers money to the unemployed so their incomes do not fall as much and thus their spending will not fall as much.1. a. When more ATMs are available, money demand is reduced and the money-demand curveshifts to the left from MD1 to MD2, as shown in Figure 6. If the Fed does not change the money supply, which is at MS1, the interest rate will decline from r1 to r2. The decline inthe interest rate shifts the aggregate-demand curve to the right, as consumption andinvestment increase.b. If the Fed wants to stabilize aggregate demand, it should reduce the money supply to MS, so the interest rate will remain at r1 and aggregate demand will not change.22. a. When the Fed’s bond traders buy bonds in open-market operations, the money-supplycurve shifts to the right from MS1 to MS2, as shown in Figure 1. The result is a decline in the interest rate.Figure 1Figure 2b. When an increase in credit card availability reduces the cash people hold, the money-demand curve shifts to the left from MD1 to MD2, as shown in Figure 2. The result is a decline in the interest rate.c. When the Federal Reserve reduces reserve requirements, the money supply increases, sothe money-supply curve shifts to the right from MS1 to MS2, as shown in Figure 1. The result is a decline in the interest rate.d. When households decide to hold more money to use for holiday shopping, the money-demand curve shifts to the right from MD1 to MD2, as shown in Figure 3. The result is a rise in the interest rate.Figure 3e. When a wave of optimism boosts business investment and expands aggregate demand,money demand increases from MD1 to MD2 in Figure 3. The increase in money demand increases the interest rate.Figure 43. a. The increase in the money supply will cause the equilibrium interest rate to decline, asshown in Figure 4. Households will increase spending and will invest in more new housing. Firms too will increase investment spending. This will cause the aggregate demand curve to shift to the right as shown in Figure 5.Price LevelQuantity of Output P 1AD 1AD 2P 2Y 1Y 2Short-run Aggregate SupplyFigure 5b. As shown in Figure 5, the increase in aggregate demand will cause an increase in bothoutput and the price level in the short run.c. When the economy makes the transition from its short-run equilibrium to its long-runequilibrium, short-run aggregate supply will decline, causing the price level to rise even further. d. The increase in the price level will cause an increase in the demand for money, raisingthe equilibrium interest rate.e. Yes. While output initially rises because of the increase in aggregate demand, it will fallonce short-run aggregate supply declines. Thus, there is no long-run effect of the increase in the money supply on real output.Figure 64. A tax cut that is permanent will have a bigger impact on consumer spending and aggregatedemand. If the tax cut is permanent, consumers will view it as adding substantially to their financial resources, and they will increase their spending substantially. If the tax cut istemporary, consumers will view it as adding just a little to their financial resources, so they will not increase spending as much. 5. a. The current situation is shown in Figure 7.Price LevelQuantity of OutputShort-run Aggregate Suppl yAggregate DemandLong-run Aggregate Suppl yFigure 7b. The Fed will want to stimulate aggregate demand. Thus, it will need to lower the interestrate by increasing the money supply. This could be achieved if the Fed purchases government bonds from the public.Figure 8c. As shown in Figure 8, the Fed's purchase of government bonds shifts the supply ofmoney to the right, lowering the interest rate.d. The Fed's purchase of government bonds will increase aggregate demand as consumersand firms respond to lower interest rates. Output and the price level will rise as shown in Figure 9.Figure 96. a. Legislation allowing banks to pay interest on checking deposits increases the return tomoney relative to other financial assets, thus increasing money demand.b. If the money supply remained constant (at MS1), the increase in the demand for moneywould have raised the interest rate, as shown in Figure 10. The rise in the interest ratewould have reduced consumption and investment, thus reducing aggregate demand and output.c. To maintain a constant interest rate, the Fed would need to increase the money supplyfrom MS1 to MS2. Then aggregate demand and output would be unaffected.Figure 107. a. If there is no crowding out, then the multiplier equals 1/(1 – MPC). Because themultiplier is 3, then MPC = 2/3.b. If there is crowding out, then the MPC would be larger than 2/3. An MPC that is largerthan 2/3 would lead to a larger multiplier than 3, which is then reduced down to 3 by the crowding-out effect.8. a. The initial effect of the tax reduction of $20 billion is to increase aggregate demand by$20 billion x 3/4 (the MPC) = $15 billion.b. Additional effects follow this initial effect as the added incomes are spent. The secondround leads to increased consumption spending of $15 billion x 3/4 = $11.25 billion. The third round gives an increase in consumption of $11.25 billion x 3/4 = $8.44 billion. The effects continue indefinitely. Adding them all up gives a total effect that depends on the multiplier. With an MPC of 3/4, the multiplier is 1/(1 – 3/4) = 4. So the total effect is $15 billion x 4 = $60 billion.c. Government purchases have an initial effect of the full $20 billion, because they increaseaggregate demand directly by that amount. The total effect of an increase in government purchases is thus $20 billion x 4 = $80 billion. So government purchases lead to a bigger effect on output than a tax cut does. The difference arises because governmentpurchases affect aggregate demand by the full amount, but a tax cut is partly saved byconsumers, and therefore does not lead to as much of an increase in aggregate demand.d. The government could increase taxes by the same amount it increases its purchases.9. a. If the marginal propensity to consume is 0.8, the spending multiplier will be 1/(1-0.8) =5. Therefore, the government would have to increase spending by $400/5 = $80 billionto close the recessionary gap.b. With an MPC of 0.8, the tax multiplier is (0.8)(1/(1-0.8)) = (0.8)(5) = 4. Therefore, thegovernment would need to cut taxes by $400 billion/4 = $100 billion to close therecessionary gap.c. If the central bank was to hold the money supply constant, my answer would be largerbecause crowding out would occur.d. They would have to raise both government spending and taxes by $400 billion. Theincrease in government purchases would result in a boost of $2,000 billion, while thehigher taxes would reduce spending by $1,600 billion. This leaves a $400 billion rise inaggregate spending.10. If government spending increases, aggregate demand rises, so money demand rises. Theincrease in money demand leads to a rise in the interest rate and thus a decline in aggregate demand if the Fed does not respond. But if the Fed maintains a fixed interest rate, it will increase money supply, so aggregate demand will not decline. Thus, the effect on aggregate demand from an increase in government spending will be larger if the Fed maintains a fixed interest rate.11. a. Expansionary fiscal policy is more likely to lead to a short-run increase in investment ifthe investment accelerator is large. A large investment accelerator means that theincrease in output caused by expansionary fiscal policy will induce a large increase ininvestment. Without a large accelerator, investment might decline because the increase in aggregate demand will raise the interest rate.b. Expansionary fiscal policy is more likely to lead to a short-run increase in investment ifthe interest sensitivity of investment is small. Because fiscal policy increases aggregatedemand, thus increasing money demand and the interest rate, the greater the sensitivity of investment to the interest rate the greater the decline in investment will be, which will offset the positive accelerator effect.12. a. Tax revenue declines when the economy goes into a recession because taxes are closelyrelated to economic activity. In a recession, people's incomes and wages fall, as do firms' profits, so taxes on these things decline.b. Government spending rises when the economy goes into a recession because morepeople get unemployment-insurance benefits, welfare benefits, and other forms ofincome support.c. If the government were to operate under a strict balanced-budget rule, it would have toraise tax rates or cut government spending in a recession. Both would reduce aggregate demand, making the recession more severe.13. a. If there were a contraction in aggregate demand, the Fed would need to increase themoney supply to increase aggregate demand and stabilize the price level, as shown inFigure 11. By increasing the money supply, the Fed is able to shift the aggregate-demand curve back to AD1 from AD2. This policy stabilizes output and the price level.Figure 11b. If there were an adverse shift in short-run aggregate supply, the Fed would need todecrease the money supply to stabilize the price level, shifting the aggregate-demand curve to the left from AD1 to AD2, as shown in Figure 12. This worsens the recession caused by the shift in aggregate supply. To stabilize output, the Fed would need to increase the money supply, shifting the aggregate-demand curve from AD1 to AD3.However, this action would raise the price level.Figure 12。
SOLUTIONS TO TEXT PROBLEMS:Quick Quizzes1. Net exports are the value of a nation’s exports minus the value of its imports, also called thetrade balance. Net capital outflow is the purchase of foreign assets by domestic residentsminus the purchase of domestic assets by foreigners. Net exports equal net capital outflow.2. The nominal exchange rate is the rate at which a person can trade the currency of onecountry for the currency of another. The real exchange rate is the rate at which a person cantrade the goods and services of one country for the goods and services of another. They arerelated through the expression: real exchange rate equals nominal exchange rate timesdomestic price divided by foreign price.If the nominal exchange rate goes from 100 to 120 yen per dollar, the dollar has appreciatedbecause a dollar now buys more yen.3. Because Spain has had high inflation and Japan has had low inflation, the number of Spanishpesetas a person can buy with Japanese yen has increased.Questions for Review1. The net exports of a country are the value of its exports minus the value of its imports. Netcapital outflow refers to the purchase of foreign assets by domestic residents minus thepurchase of domestic assets by foreigners. Net exports are equal to net capital outflow by anaccounting identity, because exports from one country to another are matched by paymentsof some asset from the second country to the first.2. Saving equals domestic investment plus net capital outflow, because any dollar saved can beused to finance accumulation of domestic capital or it can be used to finance the purchase ofcapital abroad.3. If a dollar can buy 100 yen, the nominal exchange rate is 100 yen per dollar. The realexchange rate equals the nominal exchange rate times the domestic price divided by theforeign price, which equals 100 yen per dollar times $10,000 per American car divided by500,000 yen per Japanese car, which equals two Japanese cars per American car.4. The economic logic behind the theory of purchasing-power parity is that a good must sell forthe same price in all locations. Otherwise, people would profit by engaging in arbitrage.5. If the Fed started printing large quantities of U.S. dollars, the U.S. price level would increase,and a dollar would buy fewer Japanese yen.Problems and Applications1. a. When an American buys a Sony Walkman, there is a decrease in net exports.b. When an American buys a share of Sony stock, there is an increase in net capitaloutflow.c. When the Sony pension fund buys a U.S. Treasury bond, there is a decrease in netcapital outflow.d. When a worker at Sony buys some Georgia peaches from an American farmer, there isan increase in net exports.2. a. Wheat is traded more internationally than in the past because shipping costs havedeclined, as have trade restrictions.b. Banking services are traded more internationally than in the past becausecommunications costs have declined, as have trade restrictions.c. Computer software is traded more internationally than in the past because the computerindustry has grown and the software is easier to transport (because it can now bedownloaded electronically).d. Automobiles are traded more internationally than in the past because transportationcosts have declined, as have tariffs and quotas.3. a. When an American art professor spends the summer touring museums in Europe, hespends money buying foreign goods and services, so U.S. exports are unchanged,imports increase, and net exports decrease.b. When students in Paris flock to see the latest movie from Hollywood, foreigners arebuying a U.S. good, so U.S. exports rise, imports are unchanged, and net exportsincrease.c. When your uncle buys a new Volvo, an American is buying a foreign good, so U.S.exports are unchanged, imports rise, and net exports decline.d. When the student bookstore at Oxford University sells a pair of Levi's 501 jeans,foreigners are buying U.S. goods, so U.S. exports increase, imports are unchanged, and net exports increase.e. When a Canadian citizen shops in northern Vermont to avoid Canadian sales taxes, aforeigner is buying U.S. goods, so U.S. exports increase, imports are unchanged, and net exports increase.4. Foreign direct investment requires actively managing an investment, for example, by openinga retail store in a foreign country. Foreign portfolio investment is passive, for example,buying corporate stock in a retail chain in a foreign country. As a result, a corporation is more likely to engage in foreign direct investment, while an individual investor is more likely to engage in foreign portfolio investment.5. a. When an American cellular phone company establishes an office in the Czech Republic,U.S. net capital outflow increases, because the U.S. company makes a direct investment in capital in the foreign country.b. When Harrod's of London sells stock to the General Electric pension fund, U.S. net capitaloutflow increases, because the U.S. company makes a portfolio investment in the foreign country.c. When Honda expands its factory in Marysville, Ohio, U.S. net capital outflow declines,because the foreign company makes a direct investment in capital in the United States.d. When a Fidelity mutual fund sells its Volkswagen stock to a French investor, U.S. netcapital outflow declines (if the French investor pays in U.S. dollars), because the U.S.company is reducing its portfolio investment in a foreign country.6. If national saving is constant and net capital outflow increases, domestic investment mustdecrease, because national saving equals domestic investment plus net capital outflow. If domestic investment declines, the country's accumulation of domestic capital declines.7. a. The newspaper shows nominal exchange rates, because it shows the number of units ofone currency that can be exchanged for another currency.b. Many answers are possible.c. If U.S. inflation exceeds Japanese inflation over the next year, you would expect thedollar to depreciate relative to the Japanese yen because a dollar would decline in value (in terms of the goods and services it can buy) more than the yen would.8. a. Dutch pension funds holding U.S. government bonds would be happy if the U.S. dollarappreciated. They would then get more Dutch guilders for each dollar they earned ontheir U.S. investment. In general, if you have an investment in a foreign country, you are better off if that country's currency appreciates.b. U.S. manufacturing industries would be unhappy if the U.S. dollar appreciated becausetheir prices would be higher in terms of foreign currencies, which will reduce their sales.c. Australian tourists planning a trip to the United States would be unhappy if the U.S.dollar appreciated because they would get fewer U.S. dollars for each Australian dollar,so their vacation will be more expensive.d. An American firm trying to purchase property overseas would be happy if the U.S. dollarappreciated because it would get more units of the foreign currency and could thus buymore property.9. All the parts of this question can be answered by keeping in mind the definition of the realexchange rate. The real exchange rate equals the nominal exchange rate times the domestic price level divided by the foreign price level.a. If the U.S. nominal exchange rate is unchanged, but prices rise faster in the UnitedStates than abroad, the real exchange rate rises.b. If the U.S. nominal exchange rate is unchanged, but prices rise faster abroad than in theUnited States, the real exchange rate declines.c. If the U.S. nominal exchange rate declines and prices are unchanged in the United Statesand abroad, the real exchange rate declines.d. If the U.S. nominal exchange rate declines and prices rise faster abroad than in theUnited States, the real exchange rate declines.10. If purchasing-power parity holds, then 12 pesos per soda divided by $0.75 per soda equalsthe exchange rate of 16 pesos per dollar. If prices in Mexico doubled, the exchange rate will double to 32 pesos per dollar.11. a. To make a profit, you would want to buy rice where it is cheap and sell it where it isexpensive. Because American rice costs 100 dollars per bushel, and the exchange rate is80 yen per dollar, American rice costs 100 x 80 equals 8,000 yen per bushel. SoAmerican rice at 8,000 yen per bushel is cheaper than Japanese rice at 16,000 yen perbushel. So you could take 8,000 yen, exchange them for 100 dollars, buy a bushel ofAmerican rice, then sell it in Japan for 16,000 yen, making a profit of 8,000 yen. Aspeople did this, the demand for American rice would rise, increasing the price in America, and the supply of Japanese rice would rise, reducing the price in Japan. The processwould continue until the prices in the two countries were the same.b. If rice were the only commodity in the world, the real exchange rate between the UnitedStates and Japan would start out too low, then rise as people bought rice in America and sold it in Japan, until the real exchange became one in long-run equilibrium.12. If you take X units of foreign currency per Big Mac divided by 3.41 dollars per Big Mac, youget X/3.06 units of the foreign currency per dollar; that is the predicted exchange rate.a. Indonesia: 15,900/3.41 = 4,663 rupiah/$Hungary: 600/3.41 = 176 forint/$Czech Republic: 52.9/3.41 = 15.5 koruna/$Brazil: 6.9/3.41 = 2.02 real/$Canada: 3.88/3.41 = 1.14C$/$b. Under purchasing-power parity, the exchange rate of the Hungarian forint to theCanadian dollar is 600 forints per Big Mac divided by 3.88 Canadian dollars per Big Macequals 155 forints per Canadian dollar. The actual exchange rate is 180 forints per dollar divided by 1.05 Canadian dollars per dollar equals 171 forints per Canadian dollar.c. The exchange rate predicted by the Big Mac index (155 forints per Canadian dollar) issomewhat close to the actual exchange rate of 171 forints per Canadian dollar.。
✍ how to define and measure consumer surplus.✍ the link between sellers’ costs of producing a good and the supply curve.✍ how to define and measure producer surplus.✍ that the equilibrium of supply and demand maximizes total surplus in a market. CONTEXT AND PURPOSE:Chapter 7 is the first chapter in a three-chapter sequence on welfare economics and market efficiency. Chapter 7 employs the supply and demand model to develop consumer surplus and producer surplus as a measure of welfare and market efficiency. These concepts are then utilized in Chapters 8 and 9 to determine the winners and losers from taxation and restrictions on international trade.The purpose of Chapter 7 is to develop welfare economics—the study of how the allocation of resources affects economic well-being. Chapters 4 through 6 employed supply and demand in a positive framework, which focused on the question, “What is the equilibrium price and quantity in a market?” This chapter now addresses the normative question, “Is the equilibrium price and quantity in a market the best possible solution to the resource allocation problem, or is it simply the price and quantity that balance supply and demand?” Students will discover that under most circumstances the equilibrium price and quantity is also the one that maximizes welfare.KEY POINTS:? Consumer surplus equals buyers’ willingness to pay for a good minus the amount they actually pay for it, and it measures the benefit buyers get from participating in a market.Consumer surplus can be computed by finding the area below the demand curve and above the price.? Producer surplus equals the amount sellers receive for their goods minus their costs of production, and it measures the benefit sellers get from participating in a market. Producer surplus can be computed by finding the area below the price and above the supply curve.? An allocation of resources that maximizes the sum of consumer and producer surplus is said to be efficient. Policymakers are often concerned with the efficiency, as well as the equality, of economic outcomes.? The equilibrium of supply and demand maximizes the sum of consumer and producer surplus.That is, the invisible hand of the marketplace leads buyers and sellers to allocate resources efficiently.? Markets do not allocate resources efficiently in the presence of market failures such as market power or externalities.CHAPTER OUTLINE:I. Definition of welfare economics: the study of how the allocation of resources affects economic well-being.A. Willingness to Pay1. Definition of willingness to pay: the maximum amount that a buyer will pay for a good.2. Example: You are auctioning a mint-condition recording of Elvis Presley’s first album. Four buyers show up. Their willingness to pay is as follows:for John. Because John is willing to pay more than he has to for the album,he derives some benefit from participating in the market.3. Definition of consumer surplus: the amount a buyer is willing to pay for a good minus the amount the buyer actually pays for it.4. Note that if you had more than one copy of the album, the price in the auction would end up being lower (a little over $70 in the case of two albums) and both John and Paul would gain consumer surplus.B. Using the Demand Curve to Measure Consumer Surplus1. We can use the information on willingness to pay to derive a demand curve for the rare2. . Because the demand curve shows the buyers’ willingness to pay, we can use the demand curve to measure consumer surplus.C. How a Lower Price Raises Consumer Surplusare paying less for the product than before (area A on the graph).b. Because the price is now lower, some new buyers will enter the market and receive consumer surplus on these additional units of output purchased (area B on the graph).D. What Does Consumer Surplus Measure?1. Remember that consumer surplus is the difference between the amount that buyers are willing to pay for a good and the price that they actually pay.2. Thus, it measures the benefit that consumers receive from the good as the buyers themselves perceive it.III. Producer SurplusA. Cost and the Willingness to Sell1. Definition of cost: the value of everything a seller must give up to produce a good .2. Example: You want to hire someone to paint your house. You accept bids for the work from four sellers. Each painter is willing to work if the price you will pay exceeds her opportunity cost. (Note that this opportunity cost thus represents willingness to sell.) The costs are: ALTERNATIVE CLASSROOM EXAMPLE:Review the material on price ceilings from Chapter 6. Redraw the market for two-bedroom apartments in your town. Draw in a price ceiling below the equilibriumprice.Then go through:✍ consumer surplus before the price ceiling is put into place.✍ consumer surplus after the price ceiling is put into place.You will need to take some time to explain the relationship between the producers’ willingness to sell and the cost of producing the good. The relationship between cost and the supply curve is not as apparent as the relationship between the demand curve and willingness to pay. It is important to stress that consumer surplus is measured in monetary terms. Consumer surplus gives us a way to place a monetary cost on inefficient market outcomes (due to government involvement or market failure).except for Grandma. Because Grandma receives more than she would require to paint the house, she derives some benefit from producing in the market.4.Definition of producer surplus: the amount a seller is paid for a good minus the seller’s cost of providing it.5. Note that if you had more than one house to paint, the price in the auction would end up being higher (a little under $800 in the case of two houses) and both Grandma and Georgia would gain producer surplus.B. Using the Supply Curve to Measure Producer Surplus1. We can use the information on cost (willingness to sell) to derive a supply curve for2. marginal seller . Because the supply curve shows the sellers’ cost (willingness to sell), we can use the supply curve to measure producer surplus.are receiving more for the product than before (area C on the graph).b. Because the price is now higher, some new sellers will enter the market and receive producer surplus on these additional units of output sold (area D on the graph).D. Producer surplus is used to measure the economic well-being of producers, much like consumer surplus is used to measure the economic well-being of consumers.ALTERNATIVE CLASSROOM EXAMPLE:Review the material on price floors from Chapter 6. Redraw the market for anagricultural product such as corn. Draw in a price support above the equilibriumprice.Then go through:✍ producer surplus before the price support is put in place.✍ producer surplus after the price support is put in place.Make sure that you discuss the cost of the price support to taxpayers.IV.Market EfficiencyA. The Benevolent Social Planner1. The economic well-being of everyone in society can be measured by total surplus, which is the sum of consumer surplus and producer surplus:Total Surplus = Consumer Surplus + Producer SurplusTotal Surplus = (Value to Buyers – Amount Paid by Buyers) +(Amount Received by Sellers – Cost to Sellers)Because the Amount Paid by Buyers = Amount Received bySellers:2. Definition of efficiency: the property of a resource allocation of maximizing the total surplus received by all members of society .3. Definition of equality: the property of distributing economic prosperity uniformly the members of society .a. Buyers who value the product more than the equilibrium price will purchase the product; those who do not, will not purchase the product. In other words, the free market allocates the supply of a good to the buyers who value it most highly, as measured by their willingness to pay.b. Sellers whose costs are lower than the equilibrium price will produce the product; those whose costs are higher, will not produce the product. In other words, the free market allocates the demand for goods to the sellers who can produce it at the lowest cost.to the marginal buyer is greater than the cost to the marginal seller so total surplus would rise if output increases.b. At any quantity of output greater than the equilibrium quantity, the value of the product to the marginal buyer is less than the cost to the marginal seller so total surplus would rise if output decreases.3. Note that this is one of the reasons that economists believe Principle #6: Markets are usually a good way to organize economic activity.It would be a good idea to remind students that there are circumstances whenthe market process does not lead to the most efficient outcome. Examplesinclude situations such as when a firm (or buyer) has market power over priceor when there are externalities present. These situations will be discussed inlater chapters.Pretty Woman, Chapter 6. Vivien (Julia Roberts) and Edward (Richard Gere)negotiate a price. Afterward, Vivien reveals she would have accepted a lowerprice, while Edward admits he would have paid more. If you have done a goodjob of introducing consumer and producer surplus, you will see the light bulbsgo off above your students’ heads as they watch this clip.C. In the News: Ticket Scalping1. Ticket scalping is an example of how markets work to achieve an efficient outcome.2. This article from The Boston Globe de scribes economist Chip Case’s experience with ticket scalping.D. Case Study: Should There Be a Market in Organs?1. As a matter of public policy, people are not allowed to sell their organs.a. In essence, this means that there is a price ceiling on organs of $0.b. This has led to a shortage of organs.2. The creation of a market for organs would lead to a more efficient allocation of resources, but critics worry about the equity of a market system for organs.V. Market Efficiency and Market FailureA. To conclude that markets are efficient, we made several assumptions about how markets worked.1. Perfectly competitive markets.2. No externalities.B. When these assumptions do not hold, the market equilibrium may not be efficient.C. When markets fail, public policy can potentially remedy the situation. SOLUTIONS TO TEXT PROBLEMS:Quick Quizzes1. Figure 1 shows the demand curve for turkey. The price of turkey is P1 and the consumer surplus that results from that price is denoted CS. Consumer surplus is the amount a buyer is willing to pay for a good minus the amount the buyer actually pays for it. It measures the benefit to buyers of participating in a market.Figure 1 Figure 22. Figure 2 shows the supply curve for turkey. The price of turkey is P1 and the producer surplus that results from that price is denoted PS. Producer surplus is the amount sellers are paid for a good minus the sellers’ cost of providing it (measured by the supply curve). It measures the benefit to sellers of participating in a market.Figure 33. Figure 3 shows the supply and demand for turkey. The price of turkey is P1, consumer surplus is CS, and producer surplus is PS. Producing more turkeys than the equilibrium quantity would lower total surplus because the value to the marginal buyer would be lower than the cost to the marginal seller on those additional units.Questions for Review1. The price a buyer is willing to pay, consumer surplus, and the demand curve are all closely related. The height of the demand curve represents the willingness to pay of the buyers. Consumer surplus is the area below the demand curve and above the price, which equals the price that each buyer is willing to pay minus the price actually paid.2. Sellers' costs, producer surplus, and the supply curve are all closely related. The height of the supply curve represents the costs of the sellers. Producer surplus is the area below the price and above the supply curve, which equals the price received minus each seller's costs of producing the good.Figure 43. Figure 4 shows producer and consumer surplus in a supply-and-demand diagram.4. An allocation of resources is efficient if it maximizes total surplus, the sum of consumer surplus and producer surplus. But efficiency may not be the only goal of economic policymakers; they may also be concerned about equity the fairness of the distribution of well-being.5. The invisible hand of the marketplace guides the self-interest of buyers and sellers into promoting general economic well-being. Despite decentralized decision making and self-interested decision makers, free markets often lead to an efficient outcome.6. Two types of market failure are market power and externalities. Market power may cause market outcomes to be inefficient because firms may cause price and quantity to differ from the levels they would be under perfect competition, which keeps total surplus from being maximized. Externalities are side effects that are not taken into account by buyers and sellers. As a result, the free market does not maximize total surplus.Problems and Applications1. a. Consumer surplus is equal to willingness to pay minus the price paid. Therefore, Melissa’s willingness to pay must be $200 ($120 + $80).b. Her consumer surplus at a price of $90 would be $200 ? $90 = $110.c. If the price of an iPod was $250, Melissa would not have purchased one because the price is greater than her willingness to pay. Therefore, she would receive no consumer surplus.2. If an early freeze in California sours the lemon crop, the supply curve for lemons shifts to the left, as shown in Figure 5. The result is a rise in the price of lemons and a decline in consumer surplus from A + B + C to just A. So consumer surplus declines by the amount B + C.Figure 5 Figure 6In the market for lemonade, the higher cost of lemons reduces the supply of lemonade, as shown in Figure 6. The result is a rise in the price of lemonade and a decline in consumer surplus from D + E + F to just D, a loss of E + F. Note that an event that affects consumer surplus in one market often has effects on consumer surplus in other markets.3. A rise in the demand for French bread leads to an increase in producer surplus in the market for French bread, as shown in Figure 7. The shift of the demand curve leads to an increased price, which increases producer surplus from area A to area A + B + C.Figure 7The increased quantity of French bread being sold increases the demand for flour, as shown in Figure 8. As a result, the price of flour rises, increasing producer surplus from area Dto D + E + F. Note that an event that affects producer surplus in one market leads to effects on producer surplus in related markets.Figure 84. a.Figure 9b. When the price of a bottle of water is $4, Bert buys two bottles of water. His consumer surplus is shown as area A in the figure. He values his first bottle of water at $7, but pays only $4 for it, so has consumer surplus of $3. He values his second bottle of water at $5, but pays only $4for it, so has consumer surplus of $1. Thus Bert’s total consumer surplus is $3 + $1 = $4, which is the area of A in the figure.c. When the price of a bottle of water falls from $4 to $2, Bert buys three bottles of water, an increase of one. His consumer surplus consists of both areas A and B in the figure, an increase in the amount of area B. He gets consumer surplus of $5 from the first bottle ($7 value minus $2 price), $3 from the second bottle ($5 value minus $2 price), and $1 from the third bottle ($3 value minus $2 price), for a total consumer surplus of $9. Thus consumer surplus rises by $5 (which is the size of area B) when the price of a bottle of water falls from $4 to $2.5. a.Figure 10b. When the price of a bottle of water is $4, Ernie sells two bottles of water. His producer surplus is shown as area A in the figure. He receives $4 for his first bottle of water, but it costs only $1 to produce, so Ernie has producer surplus of $3. He also receives $4 for his second bottle of water, which costs $3 to produce, so he has producer surplus of $1. Thus Ernie’s total producer surplus is $3 + $1 = $4, which is the area of A in the figure.c. When the price of a bottle of water rises from $4 to $6, Ernie sells three bottles of water, an increase of one. His producer surplus consists of both areas A and B in the figure, an increase by the amount of area B. He gets producer surplus of $5 from the first bottle ($6 price minus $1 cost), $3 from the second bottle ($6 price minus $3 cost), and $1 from the third bottle ($6 price minus $5 price), for a total producer surplus of $9. Thus producer surplus rises by $5 (which is the size of area B) when the price of a bottle of water rises from $4 to $6.6. a. From Ernie’s supply schedule and Bert’s demand schedule, the quantityequilibrium quantity of two.b. At a price of $4, consumer surplus is $4 and producer surplus is $4, as shown in Problems 3 and 4 above. Total surplus is $4 + $4 = $8.c. If Ernie produced one less bottle, his producer surplus would decline to $3, as shown in Problem 4 above. If Bert consumed one less bottle, his consumer surplus would decline to $3, as shown in Problem 3 above. So total surplus would decline to $3 + $3 = $6.d. If Ernie produced one additional bottle of water, his cost would be $5, but the price is only $4, so his producer surplus would decline by $1. If Bert consumed one additional bottle of water, his value would be $3, but the price is $4, so his consumer surplus would decline by $1. So total surplus declines by $1 + $1 = $2.7. a. The effect of falling production costs in the market for stereos results in a shift to the right in the supply curve, as shown in Figure 11. As a result, the equilibrium price of stereos declines and the equilibrium quantity increases.Figure 11b. The decline in the price of stereos increases consumer surplus from area A to A + B + C + D, an increase in the amount B + C + D. Prior to the shift in supply, producer surplus was areas B + E (the area above the supply curve and below the price). After the shift in supply, producer surplus is areas E + F + G. So producer surplus changes by the amount F + G – B, which may be positive or negative. The increase in quantity increases producer surplus, while the decline in the price reduces producer surplus. Because consumer surplus rises by B + C + D and producer surplus rises by F + G – B, total surplus rises by C + D + F + G.c. If the supply of stereos is very elastic, then the shift of the supply curve benefits consumers most. To take the most dramatic case, suppose the supply curve were horizontal, as shown in Figure 12. Then there is no producer surplus at all. Consumers capture all the benefits of falling production costs, with consumer surplus rising from area A to area A + B.Figure 128. Figure 13 shows supply and demand curves for haircuts. Supply equals demand at a quantity of three haircuts and a price between $4 and $5. Firms A, C, and D should cut the hair of Ellen, Jerry, and Phil. Oprah’s willingness to pay is too low and firm B’s costs are too high, so they do not participate. The maximum total surplus is the area between the demand and supply curves, which totals $11 ($8 value minus $2 cost for the first haircut, plus $7 value minus $3 cost for the second, plus $5 value minus $4 cost for the third).Figure 139. a. The effect of falling production costs in the market for computers results in a shift to the right in the supply curve, as shown in Figure 14. As a result, the equilibrium price of computers declines and the equilibrium quantity increases. The decline in the price of computers increases consumer surplus from area A to A + B + C + D, an increase in the amount B + C + D.Figure 14 Figure 15Prior to the shift in supply, producer surplus was areas B + E (the area above thesupply curve and below the price). After the shift in supply, producer surplus isareas E + F + G. So producer surplus changes by the amount F + G – B, whichmay be positive or negative. The increase in quantity increases producer surplus,while the decline in the price reduces producer surplus. Because consumer surplusrises by B + C + D and producer surplus rises by F + G – B, total surplus rises byC +D + F + G.b. Because typewriters are substitutes for computers, the decline in the price of computers means that people substitute computers for typewriters, shifting the demand for typewriters to the left, as shown in Figure 15. The result is a decline in both the equilibrium price and equilibrium quantity of typewriters. Consumer surplus in the typewriter market changes from area A + B to A + C, a net change of C – B. Producer surplus changes from area C + D + E to area E, a net loss of C + D. Typewriter producers are sad about technological advances in computers because their producer surplus declines.c. Because software and computers are complements, the decline in the price and increase in the quantity of computers means that the demand for software increases, shifting the demand for software to the right, as shown in Figure 16. The result is an increase in both the price and quantity of software. Consumer surplus in the software market changes from B + C to A + B, anet change of A – C. Producer surplus changes from E to C + D + E, an increase of C + D, so software producers should be happy about the technological progress in computers.Figure 16d. Yes, this analysis helps explain why Bill Gates is one the world’s richest people, because his company produces a lot of software that is a complement with computers and there has been tremendous technological advance in computers.10. a. With Provider A, the cost of an extra minute is $0. With Provider B, the cost of anextra minute is $1.b. With Provider A, my friend will purchase 150 minutes [= 150 – (50)(0)]. WithProvider B, my friend would purchase 100 minutes [= 150 – (50)(1)].c. With Provider A, he would pay $120. The cost would be $100 with Provider B.Figure 17d. Figure 17 shows the friend’s demand. With Provider A, he buys 150 minutes andhis consumer surplus is equal to (1/2)(3)(150) – 120 = 105. With Provider B, hisconsumer surplus is equal to (1/2)(2)(100) = 100.e. I would recommend Provider A because he receives greater consumer surplus.11. a. Figure 18 illustrates the demand for medical care. If each procedure has a price of $100, quantity demanded will be Q1 procedures.Figure 18b. If consumers pay only $20 per procedure, the quantity demanded will be Q2 procedures. Because the cost to society is $100, the number of procedures performed is too large to maximize total surplus. The quantity that maximizes total surplus is Q1 procedures, which is less than Q2.c. The use of medical care is excessive in the sense that consumers get procedures whose value is less than the cost of producing them. As a result, the economy’s total surplus is reduced.d. To prevent this excessive use, the consumer must bear the marginal cost of the procedure. But this would require eliminating insurance. Another possibility would be that the insurance company, which pays most of the marginal cost of the procedure ($80, in this case) could decide whether the procedure should be performed. But the insurance company does not get the benefits of the procedure, so its decisions may not reflect the value to the consumer.。
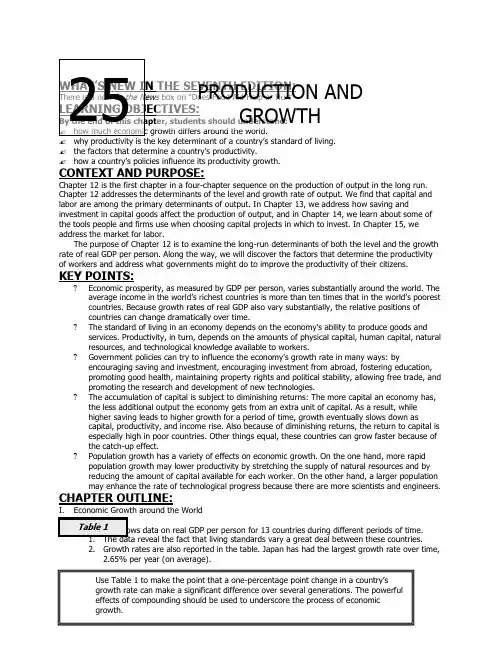
✍ the factors that determine a country’s productivity.✍ how a country’s policies influence its productivity growth. CONTEXT AND PURPOSE:Chapter 12 is the first chapter in a four-chapter sequence on the production of output in the long run. Chapter 12 addresses the determinants of the level and growth rate of output. We find that capital and labor are among the primary determinants of output. In Chapter 13, we address how saving andinvestment in capital goods affect the production of output, and in Chapter 14, we learn about some of the tools people and firms use when choosing capital projects in which to invest. In Chapter 15, we address the market for labor.The purpose of Chapter 12 is to examine the long-run determinants of both the level and the growth rate of real GDP per person. Along the way, we will discover the factors that determine the productivity of workers and address what governments might do to improve the productivity of their citizens. KEY POINTS:?Economic prosperity, as measured by GDP per person, varies substantially around the world. The average income in the world’s richest countries is more than ten times that in the world’s poorest countries. Because growth rates of real GDP also vary substantially, the relative positions of countries can change dramatically over time. ?The standard of living in an economy depends on the economy’s ability to produce goods and services. Productivity, in turn, depends on the amounts of physical capital, human capital, natural resources, and technological knowledge available to workers. ?Government policies can try to influence the economy’s growth rate in many ways: by encouraging saving and investment, encouraging investment from abroad, fostering education, promoting good health, maintaining property rights and political stability, allowing free trade, and promoting the research and development of new technologies. ?The accumulation of capital is subject to diminishing returns: The more capital an economy has, the less additional output the economy gets from an extra unit of capital. As a result, while higher saving leads to higher growth for a period of time, growth eventually slows down as capital, productivity, and income rise. Also because of diminishing returns, the return to capital is especially high in poor countries. Other things equal, these countries can grow faster because of the catch-up effect. ?Population growth has a variety of effects on economic growth. On the one hand, more rapid population growth may lower productivity by stretching the supply of natural resources and by reducing the amount of capital available for each worker. On the other hand, a larger population may enhance the rate of technological progress because there are more scientists and engineers. CHAPTER OUTLINE: I. Economic Growth around the World 2. Growth rates are also reported in the table. Japan has had the largest growth rate over time,2.65% per year (on average).Use Table 1 to make the point that a one-percentage point change in a country’s growth rate can make a significant difference over several generations. The powerfuleffects of compounding should be used to underscore the process of economicgrowth.3. Because of different growth rates, the ranking of countries by income per person changesover time.a. In the late 19th century, the United Kingdom was the richest country in the world.b. Today, income per person is lower in the United Kingdom than in the United States (aformer colony of the United Kingdom).B. FYI: Are You Richer Than the Richest American1. According to the magazine American Heritage, the richest American of all time is John B.Rockefeller, whose wealth today would be the equivalent of approximately $200 billion.2. Yet, because Rockefeller lived from 1839 to 1937, he did not get the chance to enjoy manyof the conveniences we take for granted today such as television, air conditioning, andmodern medicine.3. Thus, because of technological advances, the average American today may enjoy a “richer”life than the richest American who lived a century ago.C. FYI: A Picture Is Worth a Thousand Statistics1. This box presents three photos showing a typical family in three countries – the UnitedKingdom, Mexico, and Mali. Each family was photographed outside their home, together withall of their material possessions.2. These photos demonstrate the vast difference in the standards of living in these countries. II. Productivity: Its Role and DeterminantsA. Why Productivity Is So Important1. Example: Robinson Crusoea. Because he is stranded alone, he must catch his own fish, grow his own vegetables, andmake his own clothes.b. His standard of living depends on his ability to produce goods and services.2. Definition of productivity: the quantity of goods and services produced from eachunit of labor input.3. Review of Principle #8: A Country’s Standard of Living Depends on Its Ability to ProduceGoods and Services.B. How Productivity Is Determined1. Physical Capital per Workera. Definition of physical capital: the stock of equipment and structures used toproduce goods and services.b. Example: Crusoe will catch more fish if he has more fishing poles.2. Human Capital per Workera. Definition of human capital: the knowledge and skills that workers acquirethrough education, training, and experience.b. Example: Crusoe will catch more fish if he has been trained in the best fishing techniquesor as he gains experience fishing.3. Natural Resources per Workera. Definition of natural resources: the inputs into production that are provided bynature, such as land, rivers, and mineral deposits.b. Example: Crusoe will have better luck catching fish if there is a plentiful supply aroundhis island.4. Technological Knowledgea. Definition of technological knowledge: society’s understanding of the best waysto produce goods and services.b. Example: Crusoe will catch more fish if he has invented a better fishing lure.C. FYI: The Production Function1. A production function describes the relationship between the quantity of inputs used inproduction and the quantity of output from production.2. The production function generally is written like this:where Y = output, L = quantity of labor, K = quantity of physical capital, H = quantity of human capital, N = quantity of natural resources, A reflects the available productiontechnology, and F () is a function that shows how inputs are combined to produce output. 3. Many production functions have a property called constant returns to scale.a. This property implies that as all inputs are doubled, output will exactly double.b. This implies that the following must be true: where x = 2 if inputs are doubled.c. This also means that if we want to examine output per worker we could set x = 1/L and we would get the following:This shows that output per worker depends on the amount of physical capital per worker (K /L ), the amount of human capital per worker (H /L ), and the amount of naturalresources per worker (N /L ).4. Case Study: Are Natural Resources a Limit to Growth a. This section points out that as the population has grown over time, we have discoveredways to lower our use of natural resources. Thus, most economists are not worried about shortages of natural resources.1. Because capital is a produced factor of production, a society can change the amount ofcapital that it has. 2. However, there is an opportunity cost of doing so; if resources are used to produce capital goods, fewer goods and services are produced for current consumption.B. Diminishing Returns and the Catch-Up Effect 1. Definition of diminishing returns: the property whereby the benefit from an extraunit of an input declines as the quantity of the input increases .b. This can be seen in Figure 1, which shows how the amount of capital per workerdetermines the amount of output per worker, holding constant all other determinants of output.c. Thus, if workers already have a large amount of capital to work with, giving them an additional unit of capital will not increase their productivity by much.d. In the long run, a higher saving rate leads to a higher level of productivity and income,but not to higher growth rates in these variables. 2. An important implication of diminishing returns is the catch-up effect.a. Definition of catch-up effect: the property whereby countries that start off poor tend to grow more rapidly than countries that start off rich .b. When workers have very little capital to begin with, an additional unit of capital will increase their productivity by a great deal.C. Investment from Abroad1. Saving by domestic residents is not the only way for a country to invest in new capital.2. Investment in the country by foreigners can also occur.a. Foreign direct investment occurs when a capital investment is owned and operated by a foreign entity.b. Foreign portfolio investment occurs when a capital investment is financed with foreignmoney but operated by domestic residents.3. Some of the benefits of foreign investment flow back to foreign owners. But the economy stillexperiences an increase in the capital stock, which leads to higher productivity and higherwages.4. The World Bank is an organization that tries to encourage the flow of investment to poorcountries.a. The World Bank obtains funds from developed countries such as the United States andmakes loans to less-developed countries so that they can invest in roads, sewer systems,schools, and other types of capital.b. The World Bank also offers these countries advice on how best to use these funds.D. Education1. Investment in human capital also has an opportunity cost.a. When students are in class, they cannot be producing goods and services forconsumption.b. In less-developed countries, this opportunity cost is considered to be high; as a result,children often drop out of school at a young age.2. Because there are positive externalities in education, the effect of lower education on theeconomic growth rate of a country can be large.3. Many poor countries also face a “brain drain”—the best educated often leave to go to othercountries where they can enjoy a higher standard of living.E. Health and Nutrition1. Human capital can also be used to describe another type of investment in people:expenditures that lead to a healthier population.2. Other things being equal, healthier workers are more productive.3. Making the right investments in the health of the population is one way for a nation toincrease productivity.F. Property Rights and Political Stability1. Protection of property rights and promotion of political stability are two other important waysthat policymakers can improve economic growth.2. There is little incentive to produce products if there is no guarantee that they cannot betaken. Contracts must also be enforced.3. Countries with questionable enforcement of property rights or an unstable political climatewill also have difficulty in attracting foreign (or even domestic) investment.4. In the News: Does Food Aid Help or Hurta. Economic policies designed to improve productivity sometimes have adverse unintendedeffects.b. This article from The Wall Street Journal, Real Time Economics blog discusses economicresearch on the effects of food aid to poor countries on armed conflict in a recipientcountry.G. Free Trade1. Some countries have tried to achieve faster economic growth by avoiding transacting withthe rest of the world.2. However, trade allows a country to specialize in what it does best and thus consume beyondits production possibilities.3. When a country trades wheat for steel, it is as well off as it would be if it had developed anew technology for turning wheat into steel.4. The amount a nation trades is determined not only by government policy but also bygeography.a. Countries with good, natural seaports find trade easier than countries without thisresource.b. Countries with more than 80 percent of their population living within 100 kilometers of acoast have an average GDP per person that is four times as large as countries with lessthan 20 percent of their population living near a coast.H. Research and Development1. The primary reason why living standards have improved over time has been due to largeincreases in technological knowledge.2. Knowledge can be considered a public good.3. The U.S. government promotes the creation of new technological information by providingresearch grants and providing tax incentives for firms engaged in research.4. The patent system also encourages research by granting an inventor the exclusive right toproduce the product for a specified number of years.I. Population Growth1. Stretching Natural Resourcesa. Thomas Malthus (an English minister and early economic thinker) argued that an ever-increasing population meant that the world was doomed to live in poverty forever.b. However, he failed to understand that new ideas would be developed to increase theproduction of food and other goods, including pesticides, fertilizers, mechanizedequipment, and new crop varieties.2. Diluting the Capital Stocka. High population growth reduces GDP per worker because rapid growth in the number ofworkers forces the capital stock to be spread more thinly.b. Countries with a high population growth have large numbers of school-age children,placing a burden on the education system.3. Some countries have already instituted measures to reduce population growth rates.4. Policies that foster equal treatment for women should raise economic opportunities forwomen leading to lower rates of population.5. Promoting Technological Progressa. Some economists have suggested that population growth has driven technologicalprogress and economic prosperity.b. In a 1993 journal article, economist Michael Kremer provided evidence that increases inSOLUTIONS TO TEXT PROBLEMS:Quick Quizzes1. The approximate growth rate of real GDP per person in the United States is 1.77 percent(based on Table 1) from 1870 to 2010. Countries that have had faster growth include Japan,Brazil, Mexico, China, Germany, and Canada; countries that have had slower growth includeArgentina, India, United Kingdom, Indonesia, Pakistan, and Bangladesh.2. The four determinants of a country’s productivity are: (1) physical capital, which is the stockof equipment and structures that are used to produce goods and services; (2) human capital,which is the knowledge and skills that workers acquire through education, training, andexperience; (3) natural resources, which are inputs into production that are provided bynature, such as land, rivers, and mineral deposits; and (4) technological knowledge, which issociety’s understanding of the best ways to produce goods and services.3. Ways in which a government policymaker can try to raise the growth in living standards in asociety include: (1) investing more current resources in the production of capital, which hasthe drawback of reducing the resources used for producing current consumption; (2)encouraging investment from abroad, which has the drawback that some of the benefits ofinvestment flow to foreigners; (3) increasing education, which has an opportunity cost in thatstudents are not engaged in current production; (4) protecting property rights and promotingpolitical stability, which has the drawback of enforcement costs; (5) pursuing outward-oriented policies to encourage free trade, which may have the drawback of making a countrymore dependent on its trading partners; (6) reducing the rate of population growth, whichmay have the drawbacks of reducing individual freedom and lowering the rate oftechnological progress; and (7) encouraging research and development, which (likeinvestment) may have the drawback of reducing current consumption.Questions for Review1. The level of a nation’s GDP measures both the total income earned in the economy and thetotal expenditure on the economy’s output of goods and services. The level of real GDP is agood gauge of economic prosperity, and the growth rate of real GDP is a good gauge ofeconomic progress. You would rather live in a nation with a high level of GDP, even though ithad a low growth rate, than in a nation with a low level of GDP and a high growth rate,because the level of GDP is a measure of prosperity.2. The four determinants of productivity are: (1) physical capital, which is the stock ofequipment and structures that are used to produce goods and services; (2) human capital,which consists of the knowledge and skills that workers acquire through education, training,and experience; (3) natural resources, which are inputs into production that are provided bynature; and (4) technological knowledge, which is society’s understanding of the best waysto produce goods and services.3. A college degree is a form of human capital. The skills learned in earning a college degreeincrease a worker's productivity.4. Higher saving means fewer resources are devoted to consumption and more to producingcapital goods. The rise in the capital stock leads to rising productivity and more rapid growthin GDP for a while. In the long run, the higher saving rate leads to a higher standard of living.A policymaker might be deterred from trying to raise the rate of saving because doing sorequires that people reduce their consumption today and it can take a long time to get to ahigher standard of living.5. A higher rate of saving leads to a higher growth rate temporarily, not permanently. In theshort run, increased saving leads to a larger capital stock and faster growth. But as growthcontinues, diminishing returns to capital mean growth slows down and eventually settlesdown to its initial rate, though this may take several decades.6. Removing a trade restriction, such as a tariff, would lead to more rapid economic growthbecause the removal of the trade restriction acts like an improvement in technology. Freetrade allows all countries to consume more goods and services.7. The higher the rate of population growth, the lower is the level of GDP per person becausethere's less capital per person, hence lower productivity.8. The U.S. government tries to encourage advances in technological knowledge by providingresearch grants through the National Science Foundation and the National Institute of Health,with tax breaks for firms engaging in research and development, and through the patentsystem.Quick Check Multiple Choice1. b2. c3. d4. c5. c6. aProblems and Applications1. The facts that countries import many goods and services yet must produce a large quantityof goods and services themselves to enjoy a high standard of living are reconciled by notingthat there are substantial gains from trade. To be able to afford to purchase goods fromother countries, an economy must generate income. By producing many goods and services,then trading them for goods and services produced in other countries, a nation maximizes itsstandard of living.2. a. More investment would lead to faster economic growth in the short run.b. The change would benefit many people in society who would have higher incomes as theresult of faster economic growth. However, there might be a transition period in whichworkers and owners in consumption-good industries would get lower incomes, andworkers and owners in investment-good industries would get higher incomes. In addition, some group would have to reduce their spending for some time so that investment could rise.3. a. Private consumption spending includes buying food and buying clothes; privateinvestment spending includes people buying houses and firms buying computers. Manyother examples are possible. Education can be considered as both consumption andinvestment.b. Government consumption spending includes paying workers to administer governmentprograms; government investment spending includes buying military equipment andbuilding roads. Many other examples are possible.4. The opportunity cost of investing in capital is the loss of consumption that results fromredirecting resources toward investment. Over-investment in capital is possible because of diminishing marginal returns. A country can "over-invest" in capital if people would prefer to have higher consumption spending and less future growth. The opportunity cost of investing in human capital is also the loss of consumption that is needed to provide the resources for investment. A country could "over-invest" in human capital if people were too highlyeducated for the jobs they could get for example, if the best job a Ph.D. in philosophy could find is managing a restaurant.5. a. The United States benefited from the Chinese and Japanese investment because it madeour capital stock larger, increasing our economic growth.b. It would have been better for Americans to make the investments because then theywould have received all of the returns on the investments, instead of the returns going to China and Japan.6. Greater educational opportunities for women could lead to faster economic growth in thesedeveloping countries because increased human capital would increase productivity and there would be external effects from greater knowledge in the country. Second, increasededucational opportunities for young women may lower the population growth rate because such opportunities raise the opportunity cost of having a child.7. a. Individuals with higher incomes have better access to clean water, medical care, andgood nutrition.b. Healthier individuals are likely to be more productive.c. Understanding the direction of causation will help policymakers place proper emphasis onthe programs that will achieve both greater health and higher incomes.8. Peace would promote economic growth because it is an indication that property rights will berespected in the future. Armed conflict and the threat of a revolutionary government reduce domestic residents' incentive to save, invest, and start new businesses. Moreover, foreigners have less incentive to invest in the country.Easy taxes would promote economic growth because they result in citizens and businesses retaining a greater share of the income they earn and, thus, being able to save and invest a greater portion of that income.A tolerable administration of justice would promote economic growth because it wouldensure the maintenance of property rights, which encourages domestic saving andinvestment from abroad.。
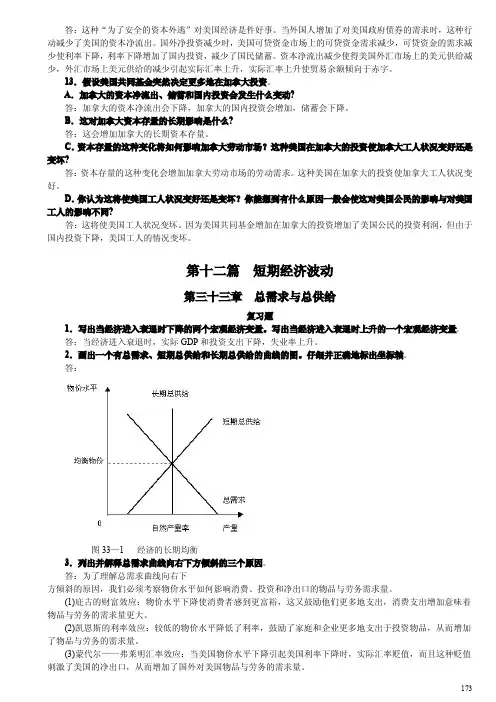
答:这种“为了安全的资本外逃”对美国经济是件好事。
当外国人增加了对美国政府债券的需求时,这种行动减少了美国的资本净流出。
国外净投资减少时,美国可贷资金市场上的可贷资金需求减少,可贷资金的需求减少使利率下降,利率下降增加了国内投资,减少了国民储蓄。
资本净流出减少使得美国外汇市场上的美元供给减少,外汇市场上美元供给的减少引起实际汇率上升,实际汇率上升使贸易余额倾向于赤字。
13.假设美国共同基金突然决定更多地在加拿大投资。
A.加拿大的资本净流出、储蓄和国内投资会发生什么变动?答:加拿大的资本净流出会下降,加拿大的国内投资会增加,储蓄会下降。
B.这对加拿大资本存量的长期影响是什么?答:这会增加加拿大的长期资本存量。
C.资本存量的这种变化将如何影响加拿大劳动市场?这种美国在加拿大的投资使加拿大工人状况变好还是变坏?答:资本存量的这种变化会增加加拿大劳动市场的劳动需求。
这种美国在加拿大的投资使加拿大工人状况变好。
D.你认为这将使美国工人状况变好还是变坏?你能想到有什么原因一般会使这对美国公民的影响与对美国工人的影响不同?答:这将使美国工人状况变坏。
因为美国共同基金增加在加拿大的投资增加了美国公民的投资利润,但由于国内投资下降,美国工人的情况变坏。
第十二篇短期经济波动第三十三章总需求与总供给复习题1.写出当经济进入衰退时下降的两个宏观经济变量。
写出当经济进入衰退时上升的一个宏观经济变量。
答:当经济进入衰退时,实际GDP和投资支出下降,失业率上升。
2.画出一个有总需求、短期总供给和长期总供给的曲线的图。
仔细并正确地标出坐标轴。
答:图33—1经济的长期均衡3.列出并解释总需求曲线向右下方倾斜的三个原因。
答:为了理解总需求曲线向右下方倾斜的原因,我们必须考察物价水平如何影响消费、投资和净出口的物品与劳务需求量。
(1)庇古的财富效应:物价水平下降使消费者感到更富裕,这又鼓励他们更多地支出,消费支出增加意味着物品与劳务的需求量更大。
曼昆宏观经济经济学第九版英文原版答案完整版曼昆宏观经济经济学第九版英文原版答案集团标准化办公室:[VV986T-J682P28-JP266L8-68PNN]A n s w e r s t o T e x t b o o k Q u e s t i o n s a n d P r o b l e m sCHAPTER 7Unemployment and the Labor MarketQuestions for Review1. The rates of job separation and job finding determine the naturalrate of unemployment. The rate of job separation is the fraction of people who lose their job each month. The higher the rate of jobseparation, the higher the natural rate of unemployment. The rate of job finding is the fraction of unemployed people who find a job each month. The higher the rate of job finding, the lower the natural rate of unemployment.2. Frictional unemployment is the unemployment caused by the time ittakes to match workers and jobs. Finding an appropriate job takes time because the flow of information about job candidates and job vacancies is not instantaneous. Because different jobs requiredifferent skills and pay different wages, unemployed workers may not accept the first job offer they receive.In contrast, structural unemployment is the unemployment resulting from wage rigidity and job rationing. These workers are unemployed not because they are actively searching for a job that best suits their skills (as in the case of frictional unemployment), but because at the prevailing real wage thequantity of labor supplied exceeds the quantity of labor demanded. If the wage does not adjust to clear the labor market, then these workers must wait for jobs to become available. Structural unemployment thus arises because firms fail to reduce wages despite an excess supply of labor.3. The real wage may remain above the level that equilibrates laborsupply and labor demand because of minimum wage laws, the monopoly power of unions, and efficiency wages.Minimum-wage laws cause wage rigidity when they prevent wages from falling to equilibrium levels. Although most workers are paid a wage above the minimum level, for some workers, especially the unskilled and inexperienced, the minimum wage raises their wage above theequilibrium level. It therefore reduces the quantity of their labor that firms demand, and creates an excess supply of workers, which increases unemployment.The monopoly power of unions causes wage rigidity because the wages of unionized workers are determined not by the equilibrium of supply and demand but by collective bargaining between union leaders and firm management. The wage agreement often raises the wage abovethe equilibrium level and allows the firm to decide how many workers to employ. These high wages cause firms to hire fewer workers than at the market-clearing wage, so structural unemployment increases.Efficiency-wage theories suggest that high wages make workers more productive. The influence of wages on worker efficiency may explain why firms do not cut wages despite an excess supply of labor. Even though a wage reduction decreasesthe firm’s wage bill, it may also lower worker productivity and therefore the firm’s profits.4. Depending on how one looks at the data, most unemployment can appearto be either short term or long term. Most spells of unemployment are short; that is, most of those who became unemployed find jobs quickly.On the other hand, most weeks of unemployment are attributable to the small number of long-term unemployed. By definition, the long-term unemployed do not find jobs quickly, so they appear on unemployment rolls for many weeks or months.5. Europeans work fewer hours than Americans. One explanation is thatthe higher income tax rates in Europe reduce the incentive to work. A second explanation is a larger underground economy in Europe as aresult of more people attempting to evade the high tax rates.A third explanation is the greater importance of unions in Europe and their ability to bargain for reduced work hours. A final explanation isbased on preferences, whereby Europeans value leisure more thanAmericans do, and therefore elect to work fewer hours.Problems and Applications1. a. In the example that follows, we assume that during the school yearyou look for a part-time job, and that, on average, it takes 2 weeks to find one. We also assume that the typical job lasts 1semester, or 12 weeks.b. If it takes 2 weeks to find a job, then the rate of job finding in weeks isf = (1 job/2 weeks) = 0.5 jobs/week.If the job lasts for 12 weeks, then the rate of job separation in weeks iss = (1 job/12 weeks) = 0.083 jobs/week.c. From the text, we know that the formula for the natural rate of unemployment is(U/L) = [s/(s + f )],where U is the number of people unemployed, and L is the number of people in the labor force.Plugging in the values for f and s that were calculated in part (b), we find(U/L) = [0.083/(0.083 + 0.5)] = 0.14.Thus, if on average it takes 2 weeks to find a job that lasts 12 weeks, the natural rate of unemployment for this population ofcollege students seeking part-time employment is 14 percent.2. Call the number of residents of the dorm who are involved I, thenumber who are uninvolved U, and the total number of students T = I + U. In steady state the total number of involved students is constant.For this to happen we need the number of newly uninvolved students,(0.10)I, to be equal to the number of students who just becameinvolved, (0.05)U. Following a few substitutions:(0.05)U = (0.10)I= (0.10)(T – U),soWe find that two-thirds of the students are uninvolved.3. To show that the unemployment rate evolves over time to thesteady-state rate, let’s begin by defining how the number of people unemployed changes over time. The change in the number of unemployed equals the number of people losing jobs (sE) minus the number finding jobs (fU). In equation form, we can express this as:U–U t= ΔU t + 1 = sE t–fU t.t + 1Recall from the text that L = E t + U t, or E t = L –U t, where L is the total labor force (we will assume that L is constant). Substituting for E t in the above equation, we findΔU t + 1 = s(L –U t) –fU t.Dividing by L, we get an expression for the change in the unemployment rate from t to t + 1:ΔU t + 1/L = (U t + 1/L) –(U t/L) = Δ[U/L]t + 1 = s(1 –U t/L) –fU t/L.Rearranging terms on the right side of the equation above, we end up with line 1 below. Now take line 1 below, multiply the right side by (s + f)/(s + f) and rearrange terms to end up with line 2 below:Δ[U/L]t + 1= s – (s + f)U t/L= (s + f)[s/(s + f) – U/L].tThe first point to note about this equation is that in steady state, when the unemployment rate equals its natural rate, the left-handside of this expression equals zero. This tells us that, as we found in the text, the natural rate of unemployment (U/L)n equals s/(s + f).We can now rewrite the above expression, substituting (U/L)n for s/(s + f), to get an equation that is easier to interpret: Δ[U/L]t + 1 = (s + f)[(U/L)n–U t/L].This expression shows the following:If U t/L > (U/L)n (that is, the unemployment rate is above its natural rate), then Δ[U/L]t + 1 is negative: the unemployment rate falls.If U t/L < (U/L)n (that is, the unemployment rate is below its natural rate), then Δ[U/L]t + 1 is positive: the unemployment raterises.This process continues until the unemployment rate U/L reaches the steady-state rate (U/L)n.4. Consider the formula for the natural rate of unemployment,If the new law lowers the chance of separation s, but has no effect on the rate of job finding f, then the natural rate of unemployment falls.For several reasons, however, the new law might tend to reduce f.First, raising the cost of firing might make firms more careful about hiring workers, since firms have a harder time firing workers who turn out to be a poor match. Second, if job searchers think that the new legislation will lead them to spend a longer period of time on a particular job, then they might weigh morecarefully whether or not to take that job. If the reduction in f is large enough, then the new policy may even increase the natural rate of unemployment.5. a. The demand for labor is determined by the amount of labor that aprofit-maximizing firm wants to hire at a given real wage. The profit-maximizing condition is that the firm hire labor until the marginal product of labor equals the real wage,The marginal product of labor is found by differentiating the production function with respect to labor (see Chapter 3 for more discussion),In order to solve for labor demand, we set the MPL equal to the real wage and solve for L:Notice that this expression has the intuitively desirable feature that increases in the real wage reduce the demand for labor.b. We assume that the 27,000 units of capital and the 1,000 units oflabor are supplied inelastically (i.e., they will work at anyprice). In this case we know that all 1,000 units of labor and 27,000 units of capital will be used in equilibrium, so we can substitute these values into the above labor demand function and.solve for WPIn equilibrium, employment will be 1,000, and multiplying this by10 we find that the workers earn 10,000 units of output. The totaloutput is given by the production function:Y=5Y13Y23Y=5(27,00013)(1,00023)Y=15,000.Notice that workers get two-thirds of output, which is consistent with what we know about the Cobb–Douglas production function from Chapter 3.c. The real wage is now equal to 11 (10% above the equilibrium levelof 10).Firms will use their labor demand function to decide how manyworkers to hire at the given real wage of 11 and capital stock of 27,000:So 751 workers will be hired for a total compensation of 8,261units of output. To find the new level of output, plug the new value for labor and the value for capital into the production function and you will find Y = 12,393.d. The policy redistributes output from the 249 workers who becomeinvoluntarily unemployed to the 751 workers who get paid more than before. The lucky workers benefit less than the losers lose as the total compensation to the working class falls from 10,000 to 8,261 units of output.e. This problem does focus on the analysis of two effects of theminimum-wage laws: they raise the wage for some workers whiledownward-sloping labor demand reduces the total numberof jobs.Note, however, that if labor demand is less elastic than in this example, then the loss of employment may be smaller, and thechange in worker income might be positive.6. a. The labor demand curve is given by the marginal product of laborschedule faced by firms. If a country experiences a reduction inproductivity, then the labor demand curve shifts to the left as in Figure 7-1. If labor becomes less productive, then at any givenreal wage, firms demand less labor.b. If the labor market is always in equilibrium, then, assuming afixed labor supply, an adverse productivity shock causes adecrease in the real wage but has no effect on employment orunemployment, as in Figure 7-2.c. If unions constrain real wages to remain unaltered, then asillustrated in Figure 7-3, employmentfalls to L1 and unemployment equals L –L1.This example shows that the effect of a productivity shock on aneconomy depends on the role of unions and the response of collective bargaining to such a change.7. a. If workers are free to move between sectors, then the wage in each sector will be equal. If thewages were not equal then workers would have an incentive to move to the sector with the higherwage and this would cause the higher wage to fall, and the lower wage to rise until they wereequal.b. Since there are 100 workers in total, L S = 100 – L M. We cansubstitute this expression into the labor demand for services equation, and call the wage w since it is the same in bothsectors:L S = 100 – LM= 100 – 4wLM= 4w.Now set this equal to the labor demand for manufacturing equation and solve for w:4w = 200 – 6ww = $20.Substitute the wage into the two labor demand equations to find L M is 80 and L S is 20.c. If the wage in manufacturing is equal to $25 then L M is equal to 50.d. There are now 50 workers employed in the service sector and the wage w S is equal to $12.50.e. The wage in manufacturing will remain at $25 and employment will remain at 50. If thereservation wage for the service sector is $15 then employment in the service sector will be 40. Therefore, 10 people are unemployed and the unemployment rate is 10 percent.8. Real wages have risen over time in both the United Statesand Europe,increasing the reward for working (the substitution effect) but also making people richer, so they want to “buy” more leisure (theincome effect). If the income effect dominates, then people want to work less as real wages go up. This could explain the Europeanexperience, in which hours worked per employed person have fallen over time. If the income and substitution effects approximatelycancel, then this could explain the U.S. experience, in which hours worked per person have stayed about constant. Economists do not have good theories for why tastes might differ, so they disagree onwhether it is reasonable to think that Europeans have a larger income effect than do Americans.9. The vacant office space problem is similar to the unemploymentproblem; we can apply the same concepts we used in analyzingunemployed labor to analyze why vacant office space exists. There isa rate of office separation: firms that occupy offices leave, eitherto move to different offices or because they go out of business.There is a rate of office finding: firms that need office space (either to start up or expand) find empty offices. It takes time to match firms with available space. Different types of firms require spaces with different attributes depending on what theirspecific needs are. Also, because demand for different goods fluctuates, there are “sectoral shifts”—changes in the composition of demand among industries and regions that affect the profitability and office needs of different firms.。

目 录第1篇 导 言第1章 经济学十大原理第2章 像经济学家一样思考第3章 相互依存性与贸易的好处第2篇 市场如何运行第4章 供给与需求的市场力量第5章 弹性及其应用第6章 供给、需求与政府政策第3篇 市场和福利第7章 消费者、生产者与市场效率第8章 应用:赋税的代价第9章 应用:国际贸易第4篇 公共部门经济学第10章 外部性第11章 公共物品和公共资源第12章 税制的设计第5篇 企业行为与产业组织第13章 生产成本第14章 竞争市场上的企业第15章 垄 断第16章 垄断竞争第17章 寡 头第6篇 劳动市场经济学第18章 生产要素市场第19章 收入与歧视第20章 收入不平等与贫困第7篇 深入研究的论题第21章 消费者选择理论第22章 微观经济学前沿第1篇 导 言第1章 经济学十大原理一、概念题1.稀缺性(scarcity)答:经济学研究的问题和经济物品都是以稀缺性为前提的。
稀缺性指在给定的时间内,相对于人的需求而言,经济资源的供给总是不足的,也就是资源的有用性与有限性。
人类消费各种物品的欲望是无限的,满足这种欲望的物品,有的可以不付出任何代价而随意取得,称之为自由物品,如阳光和空气;但绝大多数物品是不能自由取用的,因为世界上的资源(包括物质资源和人力资源)是有限的,这种有限的、为获取它必须付出某种代价的物品,称为“经济物品”。
正因为稀缺性的客观存在,地球上就存在着资源的有限性和人类的欲望与需求的无限性之间的矛盾。
经济学的一个重要研究任务就是:“研究人们如何进行抉择,以便使用稀缺的或有限的生产性资源(土地、劳动、资本品如机器、技术知识)来生产各种商品,并把它们分配给不同的社会成员进行消费。
”也就是从经济学角度来研究使用有限的资源来生产什么、如何生产和为谁生产的问题。
2.经济学(economics)答:经济学是研究如何将稀缺的资源有效地配置给相互竞争的用途,以使人类的欲望得到最大限度满足的科学。
时下经常见诸国内报刊文献的“现代西方经济学”一词,大多也都在这个意义上使用。
曼昆经济学原理答案英文版一、选择题1、在经济学中,什么是GDP?A.国内生产总值B.国民生产总值C.国内总收入D.国民总收入答案:A.国内生产总值(Gross Domestic Product,GDP)是指一个国家在一定时期内所有常住单位的生产活动的最终成果。
2、GDP的计算方法是什么?A.收入法B.支出法C.生产法D.混合法答案:B.支出法。
GDP可以通过对一国所有常住单位的商品和服务的最终消费支出、资本形成总额和货物与服务净出口进行计算,这种计算方法被称为支出法。
3、在经济学中,什么是通货膨胀?A.货币贬值B.物价上涨C.货币供应增加D.以上都不是答案:A.通货膨胀是指商品和服务的总体价格水平上升,导致货币购买力下降。
4、什么是货币政策?A.政府调节货币供应量的政策B.政府调节利率的政策C.政府调节汇率的政策D.以上都不是答案:A.货币政策是指中央银行通过控制货币供应量来调节利率和影响经济活动的政策。
二、简答题1、请简述GDP的概念及作用。
答案:GDP是指一个国家在一定时期内所有常住单位的生产活动的最终成果。
GDP是国民经济核算的核心指标,也是衡量一个国家经济状况和发展水平的重要指标。
它反映了整个国家经济运行的有效性,以及国民收入分配的公平性。
2、请简述通货膨胀的原因及影响。
答案:通货膨胀的原因有多种,包括货币供应量增加、需求拉动、成本推动等。
其中,货币供应量增加是最主要的原因。
当货币供应量增加时,物价上涨,导致货币购买力下降。
通货膨胀会对经济产生负面影响,包括降低消费者购买力、增加企业成本、扭曲价格信号等。
通货膨胀还会导致社会不稳定和政治风险。
曼昆的经济学原理课件是经济学教育中的重要资源,它以深入浅出的方式解释了经济学的基本原理和概念。
本文将对这些原理进行概述,并解释它们在现实生活中的应用。
曼昆的经济学原理主要包括微观经济学和宏观经济学两个部分。
微观经济学主要研究个体经济单位的行为和决策,如消费者、企业和政府。
CH5~6作業解答CH51. a. Mystery novels have more elastic demand than required textbooks becausemystery novels have close substitutes and are a luxury good, while required textbooks area necessity with no close substitutes. If the price of mystery novels were to rise, readerscould substitute other types of novels, or buy fewer novels altogether. But if the price ofrequired textbooks were to rise, students would have little choice but to pay the higherprice. Thus, the quantity demanded of required textbooks is less responsive to price thanthe quantity demanded of mystery novels.b. Beethoven recordings have more elastic demand than classical music recordings ingeneral. Beethoven recordings are a narrower market than classical music recordings,so it is easier to find close substitutes for them. If the price of Beethoven recordingswere to rise, people could substitute other classical recordings, like Mozart. But if theprice of all classical recordings were to rise, substitution would be more difficult. (Atransition from classical music to rap is unlikely!) Thus, the quantity demanded ofclassical recordings is less responsive to price than the quantity demanded ofBeethoven recordings.c. Subway rides during the next five years have more elastic demand than subway ridesduring the next six months. Goods have a more elastic demand over longer timehorizons. If the fare for a subway ride was to rise temporarily, consumers could notswitch to other forms of transportation without great expense or great inconvenience.But if the fare for a subway ride was to remain high for a long time, people wouldgradually switch to alternative forms of transportation. As a result, the quantitydemanded of subway rides during the next six months will be less responsive tochanges in the price than the quantity demanded of subway rides during the next fiveyears.d. Root beer has more elastic demand than water. Root beer is a luxury withclose substitutes, while water is a necessity with no close substitutes. If theprice of water were to rise, consumers have little choice but to pay the higherprice. But if the price of root beer were to rise, consumers could easily switch toother sodas or beverages. So the quantity demanded of root beer is moreresponsive to changes in price than the quantity demanded of water.2. a. For business travelers, the price elasticity of demand when the price of tickets risesfrom $200 to $250 is [(2,000 – 1,900)/1,950]/[(250 – 200)/225] = 0.05/0.22 = 0.23. Forvacationers, the price elasticity of demand when the price of tickets rises from $200 to $250 is [(800 – 600)/700] / [(250 – 200)/225] = 0.29/0.22 = 1.32.b. The price elasticity of demand for vacationers is higher than the elasticity forbusiness travelers because vacationers can choose a substitute more easily thanbusiness travelers. For example, vacationers can choose a different mode oftransportation (like driving or taking the train), a different destination, a differentdeparture date, and a different return date. They may also choose to not travel at all.Business travelers are less likely to do so because their schedules are less adaptable.3. a. The percentage change in price is equal to (2.20 – 1.80)/2.00 x 100 = 20%. If theprice elasticity of demand is 0.2, quantity demanded will fall by 4% in the short run[0.20 ⨯ 0.20]. If the price elasticity of demand is 0.7, quantity demanded will fall by 14%in the long run [0.7 ⨯ 0.2].b. Over time, consumers can make adjustments to their homes by purchasingalternative heat sources such as natural gas or electric furnaces. Thus, they canrespond more easily to the change in the price of heating oil in the long run than inthe short run.4. If quantity demanded fell, price must have increased according to the law of demand. Fora price increase to increase total revenue, the percentage increase in the price must begreater than the percentage decline in quantity demanded. Therefore, demand isinelastic.6. a. If your income is $10,000, your price elasticity of demand as the price of DVDsrises from $8 to $10 is [(40 – 32)/36]/[(10 – 8)/9] =0.22/0.22 = 1. If yourincome is $12,000, the elasticity is [(50 – 45)/47.5]/[(10 – 8)/9] = 0.11/0.22 =0.5.b. If the price is $12, your income elasticity of demand as your income increasesfrom $10,000 to $12,000 is [(30 – 24)/27]/[(12,000 – 10,000)/11,000] =0.22/0.18 = 1.22. If the price is $16, your income elasticity of demand as yourincome increases from $10,000 to $12,000 is [(12 – 8)/10]/[(12,000 –10,000)/11,000] = 0.40/0.18 = 2.22.8. a. The percentage change in price (using the midpoint formula) is (1.50 –1.25)/(1.375) × 100% = 18.18%. Therefore, the price elasticity of demand is4.3/18.18 = 0.24, which is very elastic.b. Because the demand is inelastic, the Transit Authority's revenue rises whenthe fare rises.c. The elasticity estimate might be unreliable because it is only the first monthafter the fare increase. As time goes by, people may switch to other means oftransportation in response to the price increase. So the elasticity may be largerin the long run than it is in the short run.10. a. With a price elasticity of demand of 0.4, reducing the quantity demanded ofcigarettes by 20% requires a 50% increase in price, because 20/50 = 0.4. Withthe price of cigarettes currently $2, this would require an increase in the priceto $3.33 a pack using the midpoint method (note that ($3.33 – $2)/$2.67= .50).b. The policy will have a larger effect five years from now than it does one yearfrom now. The elasticity is larger in the long run, because it may take sometime for people to reduce their cigarette usage. The habit of smoking is hard tobreak in the short run.c. Because teenagers do not have as much income as adults, they are likely tohave a higher price elasticity of demand. Also, adults are more likely to beaddicted to cigarettes, making it more difficult to reduce their quantitydemanded in response to a higher price.CH62. a. The imposition of a binding price floor in the cheese market is shown in Figure 4. In theabsence of the price floor, the price would be P1 and the quantity would be Q1. With the floor set at P f, which is greater than P1, the quantity demanded is Q2, while quantitysupplied is Q3, so there is a surplus of cheese in the amount Q3– Q2.Figure 4b. The producers’ complaint that their total revenue has declined is correct if demand iselastic. With elastic demand, the percentage decline in quantity would exceed thepercentage rise in price, so total revenue would decline.c. If the government purchases all the surplus cheese at the price floor, producers benefit and taxpayers lose. Producers would produce quantity Q3 of cheese, and their total revenue would increase substantially. However, consumers would buy only quantity Q2 of cheese, so they are in the same position as before. Taxpayers lose because they would be financing the purchase of the surplus cheese through higher taxes.3. a. The equilibrium price of Frisbees is $8 and the equilibrium quantity is six millionFrisbees.b. With a price floor of $10, the new market price is $10 because the price floor is binding.At that price, only two million Frisbees are sold, because that is the quantitydemanded.c. If there’s a price ceiling of $9, it has no effect, because the market equilibrium price is$8, which is below the ceiling. So the market price is $8 and the quantity sold is sixmillion Frisbees.6. The price will rise by less than $500. The burden of any tax is shared by both producers andconsumers−the price paid by consumers rises and the price received by producers falls, with the difference between the two equal to the amount of the tax. The only exceptions would be if the supply curve were perfectly elastic or the demand curve were perfectly inelastic, in which case consumers would bear the full burden of the tax and the price paid by consumers would rise by exactly $500..7. a. It does not matter whether the tax is imposed on producers or consumers−the effect will be the same. With no tax, as shown in Figure 7, the demand curve is D1 and the supply curve is S1. If the tax is imposed on producers, the supply curve shifts left by the amount of the tax (50 cents) to S2. Then the equilibrium quantity is Q2, the price paid by consumers is P2, and the price received (after taxes are paid) by producers is P2 – 50 cents. If the tax is instead imposed on consumers, the demand curve shifts left by the amount of the tax (50 cents) to D2. The leftward shift in the demand curve (when the tax is imposed on consumers) is exactly the same magnitude as the leftward shift in the supply curve when the tax is imposed on producers. So again, the equilibrium quantity is Q2, the price paid by consumers is P2 (including the tax paid to the government), and the price received by producers is P2 – 50 centsFigure 7 Figure 8b. The more elastic the demand curve is, the more effective this tax will be in reducing thequantity of gasoline consumed. Greater elasticity of demand means that quantity falls more in response to the rise in the price. Figure 8 illustrates this result. Demand curve D1 represents an elastic demand curve, while demand curve D2 is more inelastic. The tax will cause a greater decline in the quantity sold when demand is elastic.c. The consumers of gasoline are hurt by the tax because they get less gasoline at ahigher price.d. Workers in the oil industry are hurt by the tax as well. With a lower quantity of gasolinebeing produced, some workers may lose their jobs. With a lower price received by producers, wages of workers might decline.CH71. a. Consumer surplus is equal to willingness to pay minus the price paid.Therefore, Melissa’s willingness to pay must be $200 ($120 + $80).b. Her consumer surplus at a price of $90 would be $200 − $90 = $110.c. If the price of an iPhone was $250, Melissa would not have purchased onebecause the price is greater than her willingness to pay. Therefore, she wouldreceive no consumer surplus.2. If an early freeze in California sours the lemon crop, the supply curve for lemonsshifts to the left, as shown in Figure 5. The result is a rise in the price of lemonsand a decline in consumer surplus from A + B + C to just A. So consumer surplusdeclines by the amount B + C.Figure 5 Figure 6In the market for lemonade, the higher cost of lemons reduces the supply oflemonade, as shown in Figure 6. The result is an increase in the price of lemonadeand a decline in consumer surplus from D + E + F to just D, a loss of E + F. Notethat an event that affects consumer surplus in one market often has effects onconsumer surplus in other markets.3. A rise in the demand for French bread leads to an increase in producer surplus inthe market for French bread, as shown in Figure 7. The shift of the demand curve leads to an increased price, which increases producer surplus from area A to area A + B + C.Figure 7The increased quantity of French bread being sold increases the demand for flour, as shown in Figure 8. As a result, the price of flour rises, increasing producersurplus from area D to D + E + F. Note that an event that affects producer surplus in one market leads to effects on producer surplus in related markets.Figure 84. a. Bert’s demand schedule is:Bert’s demand curve is shown in Figure 9.Figure 9b. When the price of each bottle of water is $4, Bert buys two bottles of water.His consumer surplus is shown as area A in the figure. He values his first bottle of water at $7, but pays only $4 for it, so has consumer surplus of $3. Hevalues his second bottle of water at $5, but pays only $4 for it, so hasconsumer surplus of $1. Thus Bert’s total consumer surplus is $3 + $1 = $4,which is the area of A in the figure.c. When the price of each bottle of water falls from $4 to $2, Bert buys threebottles of water, an increase of one. His consumer surplus consists of bothareas A and B in the figure, an increase in the amount of area B. He getsconsumer surplus of $5 from the first bottle ($7 value minus $2 price), $3 from the second bottle ($5 value minus $2 price), and $1 from the third bottle ($3value minus $2 price), for a total consumer surplus of $9. Thus consumersurplus rises by $5 (which is the size of area B) when the price of each bottle of water falls from $4 to $2.5. a. Ernie’s supply schedule f or water is:Ernie’s supply curve is shown in Figure 10.Figure 10b. When the price of each bottle of water is $4, Ernie sells two bottles of water.His producer surplus is shown as area A in the figure. He receives $4 for hisfirst bottle of water, but it costs only $1 to produce, so Ernie has producersurplus of $3. He also receives $4 for his second bottle of water, which costs$3 to produce, so he has producer surplus of $1. Thus Ernie’s total producersurplus is $3 + $1 = $4, which is the area of A in the figure.c. When the price of each bottle of water rises from $4 to $6, Ernie sells threebottles of water, an increase of one. His producer surplus consists of bothareas A and B in the figure, an increase by the amount of area B. He getsproducer surplus of $5 from the first bottle ($6 price minus $1 cost), $3 fromthe second bottle ($6 price minus $3 cost), and $1 from the third bottle ($6price minus $5 price), for a total producer surplus of $9. Thus producer surplus rises by $5 (which is the size of area B) when the price of each bottle of water rises from $4 to $6.6. a. From Ernie’s supply schedule and Bert’s demand schedule, the quantitydemanded and supplied are:Only a price of $4 brings supply and demand into equilibrium, with anequilibrium quantity of two.b. At a price of $4, consumer surplus is $4 and producer surplus is $4, as shownin Problems 3 and 4 above. Total surplus is $4 + $4 = $8.c. If Ernie produced one less bottle, his producer surplus would decline to $3, asshown in Problem 4 above. If Bert consumed one less bottle, his consumersurplus would decline to $3, as shown in Problem 3 above. So total surpluswould decline to $3 + $3 = $6.d. If Ernie produced one additional bottle of water, his cost would be $5, but theprice is only $4, so his producer surplus would decline by $1. If Bert consumed one additional bottle of water, his value would be $3, but the price is $4, so his consumer surplus would decline by $1. So total surplus declines by $1 + $1 = $2.7. a. The effect of falling production costs in the market for flat-screen TVs results ina shift to the right in the supply curve, as shown in Figure 11. As a result, theequilibrium price of flat-screen TVs declines and the equilibrium quantityincreases.b. The decline in the price of flat-screen TVs increases consumer surplus fromarea A to A + B + C + D, an increase in the amount B + C + D. Prior to the shift in supply, producer surplus was areas B + E (the area above the supply curve and below the price). After the shift in supply, producer surplus is areas E + F + G. So producer surplus changes by the amount F + G – B, which may bepositive or negative. The increase in quantity increasesproducer surplus, while the decline in the price reduces producer surplus. Because consumer surplusrises by B + C + D and producer surplus rises by F + G – B, total surplus rises by C + D + F + G.c. If the supply of flat-screen TVs is very elastic, then the shift of the supply curvebenefits consumers most. To take the most dramatic case, suppose the supply curve were horizontal, as shown in Figure 12. Then there is no producersurplus at all. Consumers capture all the benefits of falling production costs,with consumer surplus rising from area A to area A + B.8. Figure 13 shows supply and demand curves for haircuts. Supply equals demand ata quantity of three haircuts and a price between $4 and $5. Firms A, C, and Dshould cut the hair of Claire, Gloria, and Phil. Jay’s willingness to pay is too low and firm B’s costs are too high, so they do not participate. The maximum total surplus is the area between the demand and supply curves, which totals $11 ($8 value minus $2 cost for the first haircut, plus $7 value minus $3 cost for the second, plus $5 value minus $4 cost for the third).CH85. Because the demand for food is inelastic, a tax on food is a good way to raiserevenue because it leads to a small deadweight loss; thus taxing food is lessinefficient than taxing other things. But it is not a good way to raise revenue froman equity point of view, because poorer people spend a higher proportion of theirincome on food. The tax would affect them more than it would affect wealthierpeople.6. a. This tax has such a high rate that it is not likely to raise much revenue.Because of the high tax rate, the equilibrium quantity in the market is likely tobe at or near zero.b. Senator Moynihan's goal was probably to ban the use of hollow-tipped bullets.In this case, the tax could be as effective as an outright ban.8. Figure 7 illustrates the effects of the $2 subsidy on a good. Without the subsidy,the equilibrium price is P1 and the equilibrium quantity is Q1. With the subsidy,buyers pay price P B, producers receive price P S (where P S = P B + $2), and thequantity sold is Q2. The following table illustrates the effect of the subsidy onconsumer surplus, producer surplus, government revenue, and total surplus.Because total surplus declines by area D + H, the subsidy leads to a deadweightloss in that amount.Figure 710. a. Setting quantity supplied equal to quantity demanded gives 2P = 300 –P.Adding P to both sides of the equation gives 3P = 300. Dividing both sides by 3gives P = 100. Substituting P = 100 back into either equation for quantitydemanded or supplied gives Q = 200.b. Now P is the price received by sellers and P +T is the price paid by buyers.Equating quantity demanded to quantity supplied gives 2P= 300 − (P+T).Adding P to both sides of the equation gives 3P = 300 –T. Dividing both sidesby 3 gives P = 100 –T/3. This is the price received by sellers. The buyers pay aprice equal to the price received by sellers plus the tax (P +T = 100 + 2T/3).The quantity sold is now Q = 2P = 200 – 2T/3.c. Because tax revenue is equal to T x Q and Q = 200 – 2T/3, tax revenue equals200T− 2T2/3. Figure 10 (on the next page) shows a graph of this relationship.Tax revenue is zero at T = 0 and at T = 300.Figure 10 Figure 11d. As Figure 11 shows, the area of the triangle (laid on its side) that representsthe deadweight loss is 1/2 × base × height, where the base is the change in the price, which is the size of the tax (T) and the height is the amount of the decline in quantity (2T/3). So the deadweight loss equals 1/2 ×T × 2T/3 = T2/3. This rises exponentially from 0 (when T = 0) to 30,000 when T = 300, as shown in Figure 12.Figure 12e. A tax of $200 per unit is a bad policy, because tax revenue is declining at thattax level. The government could reduce the tax to $150 per unit, get more tax revenue ($15,000 when the tax is $150 versus $13,333 when the tax is $200), and reduce the deadweight loss (7,500 when the tax is $150 compared to 13,333 when the tax is $200).。
曼昆经济学原理第六版英文答案【篇一:曼昆《经济学原理(微观经济学分册)》第6版课后习题详解(1~2章)】class=txt>课后习题详解第一篇导言第1章经济学十大原理一、概念题1. 稀缺性稀缺性是指在给定的时间内,相对于人的需求而言,经济资源的供给总是不足的,也就是资源的有限性与人类的欲望无限性之间的矛盾。
2. 经济学经济学是研究如何将稀缺的资源有效地配置给相互竞争的用途,以使人类的欲望得到最大限度满足的科学。
其中微观经济学是以单个经济主体为研究对象,研究单个经济主体面对既定资源约束时如何进行选择的科学;宏观经济学则以整个国民经济为研究对象,主要着眼于经济总量的研究。
3. 效率效率是指人们在实践活动中的产出与投入比值或者是效益与成本比值,比值大效率高,比值小效率低。
它与产出或收益大小成正比,与投入或成本成反比。
4. 平等平等是指人与人的利益关系及利益关系的原则、制度、做法、行为等都合乎社会发展的需要,即经济成果在社会成员中公平分配的特性。
它是一个历史范畴,按其所产生的社会历史条件和社会性质的不同而不同,不存在永恒的公平;它也是一个客观范畴,尽管在不同的社会形态中内涵不同对其的理解不同,但都是社会存在的反映,具有客观性。
5. 机会成本机会成本是指将一种资源用于某种用途,而未用于其他用途所放弃的最大预期收益。
其存在的前提条件是:①资源是稀缺的;②资源具有多种用途;③资源的投向不受限制。
6. 理性人理性人是指系统而有目的地尽最大努力去实现其目标的人,是经济研究中所假设的、在一定条件下具有典型理性行为的经济活动主体。
7. 边际变动边际变动是指对行动计划的微小增量调整。
8. 激励激励是指引起一个人做出某种行为的某种东西。
9. 市场经济市场经济是指由家庭和企业在市场上的相互交易决定资源配置的经济,而资源配置实际上就是决定社会生产什么、生产多少、如何生产以及为谁生产的过程。
10. 产权产权是指个人拥有并控制稀缺资源的能力,也可以理解为人们对其所交易东西的所有权,即人们在交易活动中使自己或他人在经济利益上受益或受损的权力。
SOLUTIONS TO TEXT PROBLEMS:Quick Quizzes1. Monetary and fiscal policies work with a lag. Monetary policy works with a lagbecause it affects spending for residential and business investment, but spending plans for such investment are often set in advance. Thus it takes time for changes inmonetary policy, working through interest rates, to affect investment. Fiscal policyworks with a lag because of the long political process that governs changes in spending and taxes.These lags matter for the choice between active and passive policy because if the lags are long, policy must be set today for conditions far in the future, about which we can only guess. Since economic conditions may change between the time a policy isimplemented and when it takes effect, policy changes may be destabilizing. Thus the lags favor policy that is passive rather than active.2. There are many possible rules for monetary policy. One example is a rule that setsmoney growth at 3 percent per year. This rule might be better than discretionarypolicy because it prevents the political business cycle and the time inconsistencyproblem. It might be worse than discretionary policy because it would tie the Fed’shands when there are shocks to the economy. For example, in response to a stockmarket crash, the rule would prevent the Fed from easing monetary policy, even if itsaw the economy slipping into recession.3. The benefits of reducing inflation to zero include: (1) eliminating shoeleather costs;(2) eliminating menu costs; (3) reducing the variability of relative prices; (4)preventing unintended changes in tax liabilities due to nonindexation of the tax code;(5) eliminating the confusion and inconvenience resulting from a changing unit ofaccount; and (6) preventing arbitrary redistribution of wealth associated withdollar-denominated debts. These benefits are all permanent. The costs of reducing inflation to zero are the high unemployment and low output needed to reduce inflation;these costs are temporary.4. Reducing the budget deficit makes future generations better off because with lowerdebt today, future taxes will be lower; in addition, lower debt will reduce real interest rates, causing investment to increase, leading to a larger stock of capital in the future, which means higher future labor productivity and higher real wages. A fiscal policythat might improve the lives of future generations even more than reducing the budget deficit is increased spending on education, which will also increase incomes in thefuture.5. Our society discourages saving in a number of ways: (1) taxing the return on interestincome; (2) taxing some forms of capital twice; (3) taxing bequests; (4) having means tests for welfare and Medicaid; and (5) granting financial aid as a function of wealth.The drawback of eliminating these disincentives is that, in most cases [(1) to (3) and(5)], doing so would increase income for wealthy taxpayers and the lost income to thegovernment would require higher taxes on everyone, so there would be a redistribution from rich to poor.Questions for Review1. The lags in the effect of monetary and fiscal policy on aggregate demand are caused bythe fact that many households and firms set their spending plans in advance, so ittakes time for changes in interest rates to alter the aggregate demand for goods andservices. As a result, it is more difficult to engage in activist stabilization policy,because the economy will not respond immediately to policy changes.2. A central banker might be motivated to cause a political business cycle by trying toinfluence the outcome of elections. A central banker who is sympathetic to theincumbent knows that if the economy is doing well at election time, the incumbent islikely to be reelected. So the central banker could stimulate the economy before the election. To prevent this, it might be desirable to have monetary policy set by rules,rather than discretion.3. Credibility might affect the cost of reducing inflation because it influences how quicklythe short-run Phillips curve adjusts. If the Fed announces a credible plan to reduceinflation, the short-run Phillips curve will shift down quickly and the cost of disinflation will be low. But if the plan is not credible, people will not adjust their expectations of inflation, the short-run Phillips curve will not shift, and the cost of disinflation will behigh.4. Some economists are against a target of zero inflation because they believe the costsof reaching zero inflation are large and the benefits are small.5. Two ways in which a government budget deficit hurts a future worker are: (1) taxeson future workers are higher to pay off the government debt; and (2) because ofcrowding out, budget deficits lead to a reduction in the economy's capital stock, sofuture workers have lower incomes.6. Two situations in which a budget deficit is justifiable are: (1) in wartime, so tax rateswill not have to be increased so much that they lead to large deadweight losses; and (2) during a temporary downturn in economic activity, during which balancing the budget would force the government to increase taxes and cut spending, making the downturn even worse.7. An example of how the government might hurt young generations while reducing thegovernment debt they inherit occurs if the government reduces spending on education.Then the government debt will be smaller, so future generations will pay less in taxes.But they will also be less educated, so they will have less human capital and thus have lower incomes. So future generations might be worse off in this case.8. The government can run a budget deficit forever because population and productivitycontinuously increase. Thus the economy's capacity to pay off its debt grows overtime. So as long as the government debt grows slower than the economy's income,government deficits can continue forever.9. Income from capital is taxed twice in the case of dividends on corporate stock. Theincome is taxed once by the corporate income tax and a second time by the individual income tax on dividend income.10. Examples, other than tax policy, of how our society discourages saving include: (1)the fact that some government benefits, such as welfare and Medicaid, aremeans-tested, so people who save get reduced benefits; and (2) the fact that colleges and universities grant financial aid inversely to the wealth of students and their families, so people who save get less financial aid.11. Tax incentives to raise saving may have the adverse effect of raising the governmentbudget deficit, which reduces public saving. Thus national saving may not increaseeven though private saving rises.Problems and Applications1. a. Figure 1 illustrates the short-run effect of a fall in aggregate demand. Theeconomy starts at point A on aggregate-demand curve AD1 and short-runaggregate-supply curve SRAS1. The decline in aggregate demand shifts theaggregate-demand curve from AD1 to AD2 and the economy moves to point B.Total output falls from Y1 to Y2, so income and employment fall as well.Figure 1b. With no policy changes, the economy restores itself gradually over time. Therecession induces declines in wages, so the cost of production declines, andthe short-run aggregate-supply curve shifts down to SRAS2. The economyends up at point C, with a lower price level, but with output back at Y1.However, this process may take years to complete.c. If policymakers are passive, the economy restores itself, but very slowly. Ifpolicymakers shift aggregate demand to the right, they can get the economyback to long-run equilibrium much more quickly. However, due to lags andimperfect information, a policy to increase aggregate demand may bedestabilizing.2. It is difficult for policymakers to choose the appropriate strength of their actionsbecause of lags between when policy is changed and when it affects aggregatedemand, as well as the difficulty in forecasting the economy's future condition. It is also difficult to anticipate how sensitive consumers and firms will be to the changes in policy.3. a. If money demand rises, the interest rate increases for a given money supply,as shown in Figure 2. The rise in the interest rate from r1 to r2 reducesconsumption and investment spending, shifting the aggregate-demand curveto the left from AD1 to AD2. The result is a decline in output from Y1 to Y2 anda reduction of the price level from P1 to P2.Figure 2Figure 3b. If the Fed's rule responded to the unemployment rate, then the effects in parta would be modified, as shown in Figure 3. After output declines to Y2 as inpart a, which causes a rise in the unemployment rate, the Fed increases themoney supply to from MS1 to MS2, thus reducing the interest rate from r2 to r3.This stimulates consumption and investment spending, so theaggregate-demand curve shifts from AD2 to AD3. The result is a rise in output from Y2 to Y3.c. Having an element of feedback in the Fed's rule, as in part b, helps to stabilizethe economy. If shocks to aggregate demand can be anticipated, as in thecase of changes in fiscal policy, then it would help if the Fed's rule respondedto predicted unemployment instead of current unemployment, especially giventhe lags in the effects of policy. For example, suppose the governmentannounced a cut in spending to occur in a year. Then forecasts of theeconomy would show rising unemployment in the future because of thereduction in aggregate demand. If the Fed's rule could respond to thoseforecasts, the money supply could increase today, so that interest rates woulddecline today, causing spending in the future to increase, offsetting thecontractionary fiscal policy.4. a. The logic behind this rule has 3 elements. First, the 2% + π term means thatin long-run equilibrium when y = y* and π = π*, the real interest rate is 2percent, since 2 percent is the difference between the nominal interest rate (r)and the inflation rate (π).Second, when the term y - y* is positive, that would mean that aggregatedemand and short-run aggregate supply intersect to the right of long-runaggregate supply, so the Fed should tighten monetary policy (raising r) to shiftthe aggregate-demand curve left. If y - y* is negative, that would mean thataggregate demand and short-run aggregate supply intersect to the left oflong-run aggregate supply, so the Fed should ease monetary policy (reducing r)to shift the aggregate-demand curve right.Third, when the term π - π* is positive, the inflation rate exceeds the Fed’s goal,so it needs to tighten monetary policy (raising r) to move down the short-runPhillips curve to reduce inflation. When π - π* is negative, the inflation rateis below the Fed’s goal, so it needs to ease monetary policy (reducing r) tomove up the short-run Phillips curve to increase inflation.b. With actual values used in the rule, the rule is backward looking, which is apotential problem since policy works with lags−thus, the policy could bedestabilizing. Using forecasts in the rule makes more sense because it avoidsthe lag problem, but forecasts may not be good enough for basing policy.5. a. If investors believe that capital taxes will remain low, then a reduction incapital taxes leads to increased investment.b. After the increase in investment has occurred, the government has anincentive to renege on its policy because it can get more tax revenue byincreasing taxes on the higher income from the larger capital stock.c. Given the government's obvious incentive to renege on its promise, firms willbe reluctant to increase investment when the government reduces tax rates.The government can increase the credibility of its tax change by somehowcommitting to low future tax rates. For example, it could write a law thatguarantees low future tax rates for all capital income from investments madewithin the next year, or write a law penalizing itself if it raises future taxes.d. This situation is similar to the time-inconsistency problem facing monetarypolicymakers because the government's incentives change over time. In bothcases, the policymaker has an incentive to tell people one thing, then to doanother once people have made an economic decision. For example, in thecase of monetary policy, policymakers could announce an intention to lowerinflation, so firms and workers will enter labor contracts with lower nominalwages, then the policymakers could increase inflation to reduce real wagesand stimulate the economy.6. Issues about whether the costs of inflation are large or small are positive statements,as is the question about the size of the costs of reducing inflation. But the question of whether the Fed should reduce inflation to zero is a normative question.7. The benefits of reducing inflation are permanent and the costs are temporary. Figure4 illustrates this. The economy starts at point A. To reduce inflation, the Fed usescontractionary policy to move the economy down the short-run Phillips curve SRPC1.Inflation declines and unemployment rises, so there are costs to reducing inflation.But the costs are only temporary, since the short-run Phillips curve eventually shiftsdown to SRPC2, and the economy ends up at point B. Since inflation is lower at pointB than at point A, and point B is on the long-run Phillips curve, the benefits of reducinginflation are permanent.Figure 4The costs of increasing inflation are permanent and the benefits are temporary forsimilar reasons. Again, suppose the economy starts at point A. To increase inflation, the Fed uses expansionary policy to move the economy up the short-run Phillips curve SRPC1. Inflation rises and unemployment declines, so there are benefits to increasing inflation. But the benefits are only temporary, since the short-run Phillips curveeventually shifts up to SRPC3, and the economy ends up at point C. Since inflation is higher at point C than at point A, and point C is on the long-run Phillips curve, the costs of increasing inflation are permanent.8. If the budget deficit is 12 percent of GDP and nominal GDP is rising 7 percent each year,the ratio of government debt to GDP will rise until it hits a fairly high level. (That level turns out to be debt/income = 12/7, because at that point, a deficit that's 12 percent of GDP with GDP growing 7 percent maintains the debt/income ratio at exactly 12/7. To be sustainable, debt and GDP must grow at the same rate, 7 percent each year. If the deficit is 12 percent of GDP, which is growing 7 percent each year, the ratio of debt to GDP must be 12/7, so that the deficit can be both 12 percent of GDP and maintain aconstant ratio of debt to GDP.) Such a high debt level is likely to require a big taxincrease on future generations. To keep future generations from having to pay such high taxes, you could increase your savings today and leave a bequest to them.9. a. An increase in the budget deficit redistributes income from young to old, sincefuture generations will have to pay higher taxes and will have a lower capitalstock.b. More generous subsidies for education loans redistribute income from old toyoung, since future generations benefit from having higher human capital.c. Greater investments in highways and bridges redistribute income from old toyoung, since future generations benefit from having a higher level of publiccapital than otherwise.d. The indexation of Social Security benefits to inflation prevents income frombeing unintentionally redistributed from old to young, since older people getunchanged real benefits with indexation, but their benefits would decline overtime without indexation.10. People's opposition to budget deficits may be stronger in principle than in practicebecause people want the budget deficit to be lower, but they also don't want to cutgovernment spending or to pay increased taxes.11. In a recession, the government can use a budget deficit to increase aggregate demand,thus boosting income and output. But in the long run, budget deficits raise interestrates, reducing investment, thus leading to a lower capital stock and reduced futureincome. An ideal fiscal policy would be one that allows budget deficits in the short run to combat recessions, but requires that the budget be balanced over time so that itdoes not have a detrimental effect on future income.12. The fundamental tradeoff that society faces if it chooses to save more is that it willhave to reduce its consumption. Thus, society can consume less today and save more if it wants higher future income and consumption. The choice is really one ofconsumption today versus consumption in the future.13. a. A reduction in the tax rate on income from saving would most directly benefitwealthy people who have a greater amount of capital income.b. The increased incentive to save would reduce the interest rate, thus increasinginvestment, so the capital stock would be larger. As capital per worker rises,productivity would increase, as well as the real wage paid to workers.c. Thus, in the long run, everyone, not just the wealthy, would benefit fromreducing the tax rate on income from savings.。
CHAPTER 23: MEASURING A NATION’S INCOMETrue/False Indicate whether the statement is true or false.1. T he circular flow diagram describes all transactions between households and firms in a simpleeconomy and shows the equality of expenditures and income.ANSWER: TPOINTS: 0 / 12. G ross domestic product includes most items produced and sold illicitly.ANSWER: FPOINTS: 0 / 13. N et national product is the total income of a nation’s residents minus losses from depreciation.ANSWER: TPOINTS: 0 / 14. D isposable personal income is the income that households and unincorporated business haveleft after satisfying all their obligations to the government. It equals personal income minuspersonal taxes and certain non-tax payments to government.ANSWER: TPOINTS: 0 / 15. T he purchase of new houses by households is included in the calculation of personalconsumption expenditures of GDP.ANSWER: FPOINTS: 0 / 1Multiple Choice Identify the choice that best completes the statement or answers the question.1. W hen GDP falls,a. income and expenditure must both fall.b. income and expenditure can both rise.c. income must fall, but expenditure may rise or fall.d. expenditure must fall, but income may rise or fall.ANSWER: APOINTS: 0 / 12. I ncome equals expenditure becausea. firms always pay out all their revenue as income to someone.b. each time a sale is made, there is a buyer and a seller.c. households own the factors of production used to generate incomes.d. All of the above are correct.ANSWER: BPOINTS: 0 / 13. I f a province makes the production and sale of illicit drugs legal, then GDPa. must increase.b. must decrease.c. wouldn't change.d. may increase or decrease.ANSWER: APOINTS: 0 / 14. W hen a government provides subsidies to encourage growth of small businesses, the subsidieswoulda. be included in GDP because they are invested by businesses.b. be included in GDP because they are a form of government spending.c. not be included in GDP because they are transfer payments.d. may or may not be included in GDP, depending on how the funds are used.ANSWER: CPOINTS: 0 / 15. D iesel fuel isa. always considered a final good.b. counted as an intermediate good if a company uses it to provide transportation services.c. counted as a final good if a farmer uses it to run a tractor to grow crops.d. Both b and c are correct.ANSWER: BPOINTS: 0 / 16. G ross domestic producta. is the market value of all final goods and services produced within a country in a givenperiod (usually a year)b. is the income in the hands of individuals after deducting income taxes; income availableto households to spend and savec. is the value of goods and services purchased by all levels of government— federal,provincial, and local—in a given periodd. is the market value of all final goods and services produced by permanent residents of anation in a given time periodANSWER: APOINTS: 0 / 17. M acroeconomics is that branch of economics that studiesa. the conditions of individual marketsb. the influence of governments on individual marketsc. economy-wide phenomenad. only the private sector of the economyANSWER: CPOINTS: 0 / 18. S uppose that nominal GDP is $6,000 billion and real GDP is $3,000. What is the GDP pricedeflator?a. 125b. 150c. 200d. 250ANSWER: CPOINTS: 0 / 19. T he purchase of final goods and services by households is calleda. investmentb. public sector expenditurec. consumptiond. net exportsANSWER: CPOINTS: 0 / 110. I nvestment is the purchase of capital equipment, inventories, anda. structuresb. non-durable goodsc. depreciationd. import investmentANSWER: APOINTS: 0 / 111. T ransfer paymentsa. are included in GDP because they are forms of incomeb. are included in GDP because goods and services have been produced in the transferc. are NOT included in the GDP because goods and services have not been produced inthe transferd. are included in GDP because they represent the production of transfers of goods andservices to foreign countriesANSWER: CPOINTS: 0 / 112. W hich of the following would be considered consumption expenditure?a. The Smiths buy a home built in 1990.b. The federal government pays the salary of a captain in the Armed Forces.c. The Hostlers buy a new car that was manufactured in Germany.d. The government buys food for its armed forces.ANSWER: CPOINTS: 0 / 113. T he method that measures GDP in relationship to the size of the population is calleda. GNPb. worker GDPc. GDP per persond. capital GDPANSWER: CPOINTS: 0 / 114. T he components of GDP area. C + I + Gb. NX + G + Cc. C + G + NXd. C + I + G + NXANSWER: DPOINTS: 0 / 115. S uppose nominal GDP is $7700 and the GDP deflator is 110. Real GDP isa. $7700b. $7000c. $847,000d. $8470ANSWER: BPOINTS: 0 / 1Short Answer1. W hat are the components of gross domestic product (GDP)?RESPONSE:ANSWER: The components of GDP are: (1) consumption spending by households on goods and services, with the exception of purchases of new housing; (2) Investmentspending on capital equipment, inventories, and structures, including householdpurchases of new housing; (3) government purchases or spending on goods andservices by the local, provincial, and federal levels governments; and (4) netexports which is spending on domestically produced goods and services byforeigners (exports) minus spending on foreign goods and services by domesticresident (imports).POINTS: -- / 12. D ifferentiate between gross domestic product (GDP) and gross national product (GNP).RESPONSE:ANSWER: GDP is the value of all final goods and services produced within a country in agiven year; while GNP is the total income earned by a nation’s permanentresidents or nationals (that is, Canadians). GNP differs from GDP by includingincome that citizens of the nation (Canada) earned aboard, and excluding incomethat foreigners earn in the particular country (E.g. in Canada).POINTS: -- / 13. D ifferentiate between real GDP and nominal GDP.RESPONSE:ANSWER: Nominal GDP is the value of all final goods and services produced within a country in a year and valued at current prices; and real GDP is the GDP valued at constantbase year prices. Real GDP is not affected by changes in the level of prices, so itreflects only changes in the amounts being produced.POINTS: -- / 14. E xplain why GDP is not considered a perfect measure of well- being?RESPONSE:ANSWER: GDP is not considered a perfect measure of well-being because some of thefactors that contribute to a good life are omitted. These would include: leisuretime, the quality of the environment, the distribution of income, and the productionof goods and services that did not pas through the market (for example,housework done by the homemaker, and volunteer work)POINTS: -- / 15. H ow do economists measure economic growth?RESPONSE:ANSWER: Economists measure economic growth as the percentage change in real GDPfrom one period to another. This is because changes in real GDP reflect onlychanges in the amounts being produced.POINTS: -- / 1CHAPTER 24: MEASURING THE COST OF LIVINGTrue/False Indicate whether the statement is true or false.1. T he GDP deflator reflects the prices of goods and services bought by consumers, and theconsumer price index reflects the price of all final goods and services produced domestically.ANSWER: FPOINTS: 0 / 12. T he consumer price index compares the price of a fixed basket of goods and services to the priceof the basket in the base year. On the other hand, the GDP deflator compares the price of currently produced goods and services to the price of the same goods and services in the base years.ANSWER: TPOINTS: 0 / 13. I ndexation refers to the automatic correction of a dollar amount for the effects of inflation by law orcontract.ANSWER: TPOINTS: 0 / 14. L ong term contracts between firms and unions will sometimes include partial or complete indexationof the wage to the consumer price index. This is called a cost-of-living allowance clause.ANSWER: TPOINTS: 0 / 15. T he core inflation rate is the consumer price index with the exclusion of the most volatilecomponents such as energy and food.ANSWER: TPOINTS: 0 / 1Multiple Choice Identify the choice that best completes the statement or answers the question.1. I n the CPI, goods and services are weighted according toa. how much a typical consumer buys of each item.b. whether the items are necessities or luxuries.c. how much of each item is produced in the domestic economy.d. how much is spent on them in the national income accounts.ANSWER: APOINTS: 0 / 12. B y not taking into account the possibility of consumer substitution, the CPIa. understates the standard of living.b. overstates the cost of living.c. neither overstates nor understates the cost of living.d. doesn't accurately reflect the cost of living, but it is unclear if it overstates or understatesthe cost of living.ANSWER: BPOINTS: 0 / 13. I f the prices of Brazilian-made shoes imported into Canada increases, thena. both Canada’s GDP deflator and it’s consumer price index will increase.b. neither Canada’s GDP deflator nor it’s consumer price index will increase.c. Canada’s GDP deflator will increase but its CPI will not increase.d. Canada’s consumer price index will increase, but its GDP deflator won’t change.ANSWER: DPOINTS: 0 / 14. I f increases in the prices of Canadian car insurance causes the CPI to increase by 3 percent, theGDP deflator will likely increase bya. more than 3 percent.b. 3 percent.c. less than 3 percent.d. All of the above are correct.ANSWER: CPOINTS: 0 / 15. T he real interest rate tells youa. how quickly your savings account will grow.b. how quickly the purchasing power of your savings account will grow.c. the size of your savings account.d. the purchasing power of your savings account.ANSWER: BPOINTS: 0 / 16. I nflation refers toa. a temporary increase in the price level due to higher tax ratesb. a large increase in food and gasoline pricesc. a situation in which the economy's overall price level is risingd. an increase in the purchasing power of the dollarANSWER: CPOINTS: 0 / 17. I f nominal interest rates increase from 8 percent to 10 percent while inflation increases from 3percent to 12 percenta. the real interest rate falls from 5 percent to –2 percentb. the real interest rate rises from –2 percent to 5 percentc. the real interest rate falls from 8 percent to 12 percentd. the real interest rate rises from 8 percent to 12 percentANSWER: APOINTS: 0 / 18. I f the nominal rate of interest is 10 percent and the rate of inflation is 3 percent, what is the real rateof interest?a. 13 percentb. 7 percentc. 3 percentd. –7 percentANSWER: BPOINTS: 0 / 19. T he consumer price index:a. measures price changes of raw materialsb. adjusts all prices of goods and services for five-year periodsc. measures the cost of goods and services bought by a typical consumerd. cannot measure price changes of intangible production such as servicesANSWER: CPOINTS: 0 / 110. I f the consumer price index (CPI) at the end of 1996 was 125 and the CPI at the end of 1997 was131, then the rate of inflation during 1997 wasa. zero – prices were stable during 1997b. 4.8 percentc. 6.0 percentd. 125 percentANSWER: BPOINTS: 0 / 111. F rank's nominal income in 1998 is $45,000. Suppose the CPI in 1998 is 150. What is Frank's realincome?a. $51,750b. $45,000c. $38,250d. $30,000ANSWER: DPOINTS: 0 / 112. A change in the price of imports bought by consumers will bea. reflected in the GDP deflatorb. reflected in GDPc. reflected in the CPId. reflected in net national incomeANSWER: CPOINTS: 0 / 113. A ll of the following but one are problems associated with the CPIa. substitution biasb. the introduction of new goods and servicesc. unmeasured quality changesd. The CPI is not based on a fixed basket of goods and servicesANSWER: DPOINTS: 0 / 114. W hich of the following is correct?a. The CPI is not based on a fixed basket of goods and services.b. The GDP deflator reflects the prices of all domestically produced goods and services.c. The GDP deflator is based on a fixed basket of goods and services.d. The GDP deflator is subject to substitution bias.ANSWER: BPOINTS: 0 / 115. T he inflation ratea. is a measure of the cost of a basket of goods and services bought by firmsb. is the absolute change in prices between yearsc. is the percentage change in the price index from the preceding periodd. measures changes in incomes from one year to the nextANSWER: CPOINTS: 0 / 1Short Answer1. W hat is the consumer price index (CPI)? What are the three major items included in the CPI?RESPONSE:ANSWER: The CPI is a measure of the overall cost of the goods and services bought by a typical consumer. The three major items included in the CPI are shelter,transportation and food.POINTS: -- / 12. H ow is the CPI computed?RESPONSE:ANSWER: First the basket of goods and services must be determined and also the relative importance of the various items to be included in the basket. Then the prices of thevarious items in the basket are determined. The cost of the basket is then determinedusing the data on prices and quantity. The base year is chosen, and the index for thebase year is computed using the quantities in the basket and the base year prices.The index is calculated by taking the price of the basket in the each year and dividingthis by the price of the basket in the base year. This ratio is then multiplied by 100.POINTS: -- / 13. D ifferentiate between the nominal rate of interest and the real rate of interest.RESPONSE:ANSWER: The nominal interest rate is the interest rate as usually reported without a correction for the effects of inflation. The real interest rate is the interest rate corrected for theeffects of inflation. The real interest rate = nominal interest rate minus the inflationrate.POINTS: -- / 14. W hat is meant by the inflation rate? If the CPI in 1996 was 107.6 and in 1995 was 105.9, calculatethe inflation rate for 1996.RESPONSE:ANSWER: The inflation rate is the percentage change in the price index from the preceding period. The inflation rate for 1996 would be:POINTS: -- / 15. W hat are the problems associated with using the consumer price index to measure the cost ofliving?RESPONSE:ANSWER: The problems are: (1) Prices do not change proportionately. Consumers respond by buying less of the goods whose prices have risen by large amounts and by buyingmore of the goods whose price have risen by less, or even fallen. The index iscomputed using a fixed basket of items, so theses changes in quantity would not bereflected in the basket. This is referred to as the substitution bias. (2) The CPI isdeveloped using a fixed basket of goods and services, when new products areintroduced during the time period that a particular fixed basket is being used, thesenew products will not be included in calculation of the index. (3) The CPI does notmeasure quality changes. If the quality of a good deteriorates from one year to thenext, the value of the dollar falls, even if the price of the good stays the same.Likewise, if the quality of the good increases from one year to the next, the value of adollar also rises. Statistics Canada will try to adjust the price of the good to accountfor the quality change, but it is very difficult to measure quality.POINTS: -- / 1CHAPTER 25: PRODUCTION AND GROWTHTrue/False Indicate whether the statement is true or false.1. O ne way to raise future productivity is to invest less current resources in the production ofcapital.ANSWER: FPOINTS: 0 / 12. D iminishing returns occur when the benefits from an extra unit of output declines as the quantityof output declines.ANSWER: FPOINTS: 0 / 13. M althusian theory states that an ever-inc reasing population would continually strain society’sability to provide for itself. This doomed human beings to forever live in poverty.ANSWER: TPOINTS: 0 / 14. P roductivity growth is measured by real output per worker.ANSWER: TPOINTS: 0 / 15. T he primary reason that living standards are higher today than they were a century ago is thattechnological knowledge has advanced.ANSWER: TPOINTS: 0 / 1Multiple Choice Identify the choice that best completes the statement or answers the question.1. O f the following countries, which grew the slowest over the last 100 years?a. Brazil.b. Mexico.c. Singapore.d. United States.ANSWER: DPOINTS: 0 / 12. O n average, each year of schooling raises a person's wage in Canada by abouta. 3 percent.b. 10 percent.c. 15 percent.d. 25 percent.ANSWER: BPOINTS: 0 / 13. T he primary reason that Canadian living standards are higher today than they were a centuryago is thata. more productive natural resources have been discovered.b. physical capital per worker has increased.c. technological knowledge has increased.d. human capital has increased.ANSWER: CPOINTS: 0 / 14. M any countries in Africa have low growth rates. This is partly due toa. few natural resourcesb. high trade barriers.c. low incomes, making it very difficult for them to grow.d. All of the above are correct.ANSWER: BPOINTS: 0 / 15. A government can encourage growth and, in the long run, raise the economy’s standard of livingby encouraginga. population growth.b. consumption spending.c. saving and investment.d. trade restrictions.ANSWER: CPOINTS: 0 / 16. D iminishing returns is the notion thata. as the stock of capital ages, the extra output produced decreasesb. as the stock of capital is increased, the extra output produced from an additional unit ofcapital fallsc. as resources are used to produce capital goods, fewer additional capital goods can beproducedd. you always get what you pay forANSWER: BPOINTS: 0 / 17. C ompared with richer countries, poorer countries are generally characterized bya. high real GDP per personb. political stabilityc. rapid population growthd. strongly enforced property rightsANSWER: CPOINTS: 0 / 18. W hich one of the following countries would most likely be considered a poorer nation, using realGDP/person?a. Canadab. Germanyc. Japand. IndiaANSWER: DPOINTS: 0 / 19. W hich of the following factors would be most likely to encourage capital formation in a poorernation?a. the expectation of sustained high rates of inflation in the futureb. the expectation that property rights will remain securec. the expectation that a struggle between capitalist and socialist forces will lead to majorstructural change in the economyd. an increase in corporate taxes in order to finance an expanded government welfareprogramANSWER: BPOINTS: 0 / 110. W hich of the following is most likely to cause the productivity of labour to increase?a. higher money wage ratesb. a higher rate of investment in human and physical capitalc. more flexible working hours and improved retirement plansd. none of the aboveANSWER: BPOINTS: 0 / 111. S uppose that factory output rose from 50,000 units to 55,000 units while labour hours rose from1100 to 1200. Which of the following is true?a. Labour productivity remained unchanged.b. Labour productivity increased slightly.c. Labour productivity decreased slightly.d. Labour productivity increased sharply.ANSWER: BPOINTS: 0 / 112. W hich of the following would be most likely to cause the real income per person of poorercountries to rise?a. a more rapid population growthb. a rapid rate of inflationc. an international minimum-wage lawd. an increase in foreign investment that enhanced the productivity of the labour forceANSWER: DPOINTS: 0 / 113. I f a production function has constant returns to scale, then:a. doubling inputs will double output.b. doubling inputs will triple output.c. doubling inputs will cause output to increase, but the increase in output will be less thanthe increase in inputs.d. doubling inputs will decrease output.ANSWER: APOINTS: 0 / 114. T he most important source of rising living standards over time is:a. the increase in the size of the labour force.b. the increase in the labour force participation rate.c. the increase in productivity.d. the increase in human capital—the skills embodied in the work force.ANSWER: CPOINTS: 0 / 1Short Answer1. W hat is productivity and why is it important?RESPONSE:ANSWER: Productivity is the amount of goods and services produced from each hour of a worker’s time. It is the major determinant of the standard of living of a country.POINTS: -- / 12. H ow is productivity determined?RESPONSE:ANSWER: Productivity is determined by a country’s physical capital, human capital, natural resources and technological knowledge.POINTS: -- / 13. W hat is the World Bank and what are its functions?RESPONSE:ANSWER: The World Bank is an international organization that among other thingsencourages the flow of capital to poor countries. It obtains funds from the world’sadvance counties and loans them to less developed countries so that they caninvest in capital infrastructure. The World Bank offers advice to developingcountries on how the funds might best be used.POINTS: -- / 14. W hat are property rights? What role does property rights play in economic growth?RESPONSE:ANSWER: Property rights refer to the ability of people to exercise authority over the resources they own. There must be an economy-wide respect for property rights for the pricesystem or the free market to work. Lack of respect for property rights or theenforcement of property rights would not only cause political instability but wouldalso discourage savings and investment. These are necessary for economicgrowth.POINTS: -- / 15. D ifferentiate between inward-oriented policies and outward-oriented policies.RESPONSE:ANSWER: Inward-oriented policies are aimed at raising productivity and living standardswithin a county by avoiding interaction with the rest of the world. This approachinvolves the protection of domestic industries to allow them to develop and growwithout competition from foreign firms. Outward-oriented policies are designed tointegrate countries into the world economy as international trade is considered tobe a factor in generating economic growth.POINTS: -- / 1CHAPTER 26: SAVING, INVESTMENT, AND THE FINANCIAL SYSTEMTrue/False Indicate whether the statement is true or false.1. P rivate savings are the tax revenue that the government has left after paying for its spending; andpublic savings is the income that households have left after paying for taxes and consumption.ANSWER: FPOINTS: 0 / 12. A budget deficit is an excess of tax revenue over government spending; and a budget surplus is ashortfall of tax revenue from government spending.ANSWER: FPOINTS: 0 / 13. A budget surplus decreases the supply of loanable funds, increases the interest rate, andstimulates investment.ANSWER: FPOINTS: 0 / 14. T he financia l system is the group of institutions in the economy that help to match one person’ssavings with another person’s investment.ANSWER: TPOINTS: 0 / 15. A mutual fund is an institution that sells shares to the public and uses the proceeds to buy aselection, or portfolio, of various types of stocks, bonds, or both stocks and bonds.ANSWER: TMultiple Choice Identify the choice that best completes the statement or answers the question.1. W hich of the following is correct?a. Lenders buy bonds and borrowers sell them.b. Long-term bonds usually pay a lower interest rate than do short-term bonds becauselong-term bonds are riskier.c. Junk bonds refer to bonds that have been resold many times.d. None of the above are correct.ANSWER: APOINTS: 0 / 12. I n a closed economy, national saving equalsa. investment.b. income minus the sum of consumption and government expenditures.c. private saving plus public saving.d. All of the above are correct.ANSWER: DPOINTS: 0 / 13. I f the current market interest rate for loanable funds is below the equilibrium level, then there is aa. shortage of loanable funds and the interest rate will rise.b. surplus of loanable funds and the interest rate will rise.c. shortage of loanable funds and the interest rate will fall.d. surplus of loanable funds and the interest rate will fall.ANSWER: APOINTS: 0 / 14. S uppose that Parliament were to introduce a new investment tax credit. What would happen inthe market for loanable funds?a. The demand for loanable funds would shift left and interest rates fall.b. The demand for loanable funds would shift right and interest rates rise.c. The supply of loanable funds would shift left and interest rates rise.d. The supply of loanable funds would shift right and interest rates fall.ANSWER: BPOINTS: 0 / 15. I f Canada increases its budget deficit, it will reducea. private saving and so shift the supply of loanable funds left.b. investment and so shift the demand for loanable funds left.c. public saving and so shift the supply of loanable funds left.d. None of the above are correct.ANSWER: CPOINTS: 0 / 16. C rowding out refers toa. the increase in national saving that occurs when government runs a deficitb. the decrease in the real interest rates due to government borrowingc. a reduction in investment spending resulting from government borrowingd. a decrease in consumption spending resulting from government borrowingANSWER: CPOINTS: 0 / 17. F or a bank to be profitable, the loans it makes must _____ than the _____ obtaining funds.a. cost more; price ofb. pay less interest; total revenue fromc. make more interest; total cost ofd. be less profitable; total revenue fromANSWER: C8. L arge budget deficits will likelya. increase the nation's pool of savingb. decrease the nation's pool of savingc. have no impact on the nation's pool of savingd. improve the nation's trade balanceANSWER: BPOINTS: 0 / 19. T he supply curve of loanable funds isa. upward-sloping, reflecting the fact that savers need a higher rate of interest to coax theminto lending moreb. downward-sloping, reflecting the fact that savers will increase their supply for loanablefunds at lower rates of interestc. upward-sloping, reflecting the fact that savers will increase their saving at lower rates ofinterestd. None of the aboveANSWER: APOINTS: 0 / 110. L oanable funds area. the money in banks and other financial institutionsb. the amount of credit availablec. equal to the total value of capital in the economyd. available only to businessesANSWER: BPOINTS: 0 / 111. I f the market for loanable funds is not in equilibrium, which of the following factors must change tobring it to equilibrium?a. outputb. profitsc. the inflation rated. the interest rateANSWER: DPOINTS: 0 / 112. I n the market for loanable fundsa. higher interest rates discourage savingsb. lower interest rates encourage investmentc. lower interest rates make borrowers worse offd. higher interest rates increase the demand for loanable fundsANSWER: BPOINTS: 0 / 113. B anksa. use people's deposits to make loansb. do not issue mortgage loansc. print and circulate money.d. have no positive impact on the economic systemANSWER: APOINTS: 0 / 114. G DP last year in a closed economy was $2000, taxes were $100, government spending was$200, and consumption was $1200. What was national saving?a. $1000b. $800c. $700d. $600ANSWER: D。
WHAT’S NEW IN THE SEVENTH EDITION:The section on ”A Financial Crisis Takes Us for a Ride Along t he Phillips Curve” has been updated.LEARNING OBJECTIVES:By the end of this chapter, students should understand:why policymakers face a short-run trade-off between inflation and unemployment.why the inflation-unemployment trade-off disappears in the long run.how supply shocks can shift the inflation-unemployment trade-off.the short-run cost of reducing inflation.how policymakers’ credibility might affect the cost of reducing inflation.CONTEXT AND PURPOSE:Chapter 22 is the final chapter in a three-chapter sequence on the economy’s short-run fluctuations around its long-term trend. Chapter 20 introduced aggregate supply and aggregate demand. Chapter 21 developed how monetary and fiscal policies affect aggregate demand. Both Chapters 20 and 21 addressed the relationship between the price level and output. Chapter 22 will concentrate on a similar relationship between inflation and unemployment.The purpose of Chapter 22 is to trace the history of economists’ thinking about the relationship between inflation and unemployment. Students will see why there is a temporary trade-off between inflation and unemployment, and why there is no permanent trade-off. This result is an extension of the results produced by the model of aggregate supply and aggregate demand where a change in the price level induced by a change in aggregate demand temporarily alters output but has no permanent impact on output.389390❖Chapter 22/The Short-Run Trade-off between Inflation and UnemploymentKEY POINTS:∙ The Phillips curve describes a negative relationship between inflation and unemployment. By expanding aggregate demand, policymakers can choose a point on the Phillips curve with higher inflation and lower unemployment. By contracting aggregate demand, policymakers can choose apoint on the Phillips curve with lower inflation and higher unemployment.∙ The trade-off between inflation and unemployment described by the Phillips curve holds only in the short run. In the long run, expected inflation adjusts to changes in actual inflation, and the short-run Phillips curve shifts. As a result, the long-run Phillips curve is vertical at the natural rate ofunemployment.∙ The short-run Phillips curve also shifts because of shocks to aggregate supply. An adverse supply shock, such as an increase in world oil prices, gives policymakers a less favorable trade-off between inflation and unemployment. That is, after an adverse supply shock, policymakers have to accept a higher rate of inflation for any given rate of unemployment, or a higher rate of unemployment for any given rate of inflation.∙ When the Fed contracts growth in the money supply to reduce inflation, it moves the economy along the short-run Phillips curve, which results in temporarily high unemployment. The cost of disinflation depends on how quickly expectations of inflation fall. Some economists argue that a crediblecommitment to low inflation can reduce the cost of disinflation by inducing a quick adjustment of expectations.CHAPTER OUTLINE:I. The Phillips CurveA. Origins of the Phillips Curve1. In 1958, economist A. W. Phillips published an article discussing the negative correlationbetween inflation rates and unemployment rates in the United Kingdom.2. American economists Paul Samuelson and Robert Solow showed a similar relationshipbetween inflation and unemployment for the United States two years later.3. The belief was that low unemployment is related to high aggregate demand, and highaggregate demand puts upward pressure on prices. Likewise, high unemployment is relatedto low aggregate demand, and low aggregate demand pulls price levels down.4. Definition of Phillips curve: a curve that shows the short-run trade-off betweeninflation and unemployment.Chapter 22/The Short-Run Trade-off between Inflation and Unemployment❖ 3915. Samuelson and Solow believed that the Phillips curve offered policymakers a menu ofpossible economic outcomes. Policymakers could use monetary and fiscal policy to chooseany point on the curve.B. Aggregate Demand, Aggregate Supply, and the Phillips Curve1. The Phillips curve shows the combinations of inflation and unemployment that arise in theshort run as shifts in the aggregate-demand curve move the economy along the short-runaggregate-supply curve.2. The greater the aggregate demand for goods and services, the greater the economy’s outputand the higher the price level. Greater output means lower unemployment. The higher theprice level in the current year, the higher the rate of inflation.3. Example: The price level is 100 (measured by the Consumer Price Index) in the year 2020.There are two possible changes in the economy for the year 2021: a low level of aggregatedemand or a high level of aggregate demand.a. If the economy experiences a low level of aggregate demand, we would be at a short-run equilibrium like point A. This point also corresponds with point A on the Phillips curve.Note that when aggregate demand is low, the inflation rate is relatively low and theunemployment rate is relatively high.b. If the economy experiences a high level of aggregate demand, we would be at a short-run equilibrium like point B. This point also corresponds with point B on the Phillips curve.Note that when aggregate demand is high, the inflation rate is relatively high and theunemployment rate is relatively low.392❖Chapter 22/The Short-Run Trade-off between Inflation and Unemployment Figure 24. Because monetary and fiscal policies both shift the aggregate-demand curve, these policiescan move the economy along the Phillips curve.a. Increases in the money supply, increases in government spending, or decreases in taxesall increase aggregate demand and move the economy to a point on the Phillips curvewith lower unemployment and higher inflation.b. Decreases in the money supply, decreases in government spending, or increases in taxesall lower aggregate demand and move the economy to a point on the Phillips curve withhigher unemployment and lower inflation.II. Shifts in the Phillips Curve: The Role of ExpectationsA. The Long-Run Phillips Curve1. In 1968, economist Milton Friedman argued that monetary policy is only able to choose acombination of unemployment and inflation for a short period of time. At the same time,economist Edmund Phelps wrote a paper suggesting the same thing.2. In the long run, monetary growth has no real effects. This implies that it cannot affect thefactors that determine the economy’s long-run unemployment rate.Chapter 22/The Short-Run Trade-off between Inflation and Unemployment ❖ 3933. Thus, in the long run, we would not expect there to be a relationship between unemployment and inflation. This must mean that, in the long run, the Phillips curve is vertical.4. The vertical Phillips curve occurs because, in the long run, the aggregate supply curve is vertical as well. Thus, increases in aggregate demand lead only to changes in the price leveland have no effect on the economy’s level of output. Thus, in the long run, unemployment will not change when aggregate demand changes, but inflation will.5. The long-run aggregate-supply curve occurs at the economy’s natural level of output. Thismeans that the long-run Phillips curve occurs at the natural rate of unemployment.394❖Chapter 22/The Short-Run Trade-off between Inflation and UnemploymentB. The Meaning of “Natural”1. Friedman and Phelps considered the natural rate of unemployment to be the rate towardwhich the economy gravitates in the long run.2. The natural rate of unemployment may not be the socially desirable rate of unemployment.3. The natural rate of unemployment may change over time.C. Reconciling Theory and Evidence1. The conclusion of Friedman and Phelps that there is no long-run trade-off between inflationand unemployment was based on theory, while the correlation between inflation andunemployment found by Phillips, Samuelson, and Solow was based on actual evidence.2. Friedman and Phelps believed that an inverse relationship between inflation andunemployment exists in the short run.3. The long-run aggregate-supply curve is vertical, indicating that the price level does notinfluence output in the long run.4. But, the short-run aggregate-supply curve is upward sloping because of misperceptionsabout relative prices, sticky wages, and sticky prices. These perceptions, wages, and pricesadjust over time, so that the positive relationship between the price level and the quantity ofgoods and services supplied occurs only in the short run.5. This same logic applies to the Phillips curve. The trade-off between inflation andunemployment holds only in the short run.6. The expected level of inflation is an important factor in understanding the difference betweenthe long-run and the short-run Phillips curves. Expected inflation measures how much peopleexpect the overall price level to change.7. The expected rate of inflation is one variable that determines the position of the short-runaggregate-supply curve. This is true because the expected price level affects the perceptionsof relative prices that people form and the wages and prices that they set.8. In the short run, expectations are somewhat fixed. Thus, when the Fed increases the moneysupply, aggregate demand increases along the upward sloping short-run aggregate-supplycurve. Output grows (unemployment falls) and the price level rises (inflation increases).9. Eventually, however, people will respond by changing their expectations of the price level.Specifically, they will begin expecting a higher rate of inflation.Chapter 22/The Short-Run Trade-off between Inflation and Unemployment ❖ 395D. The Short-Run Phillips Curve1. We can relate the actual unemployment rate to the natural rate of unemployment, the actual inflation rate, and the expected inflation rate using the following equation:a. Because expected inflation is already given in the short run, higher actual inflation leadsto lower unemployment.b. How much unemployment changes in response to a change in inflation is determined by the variable a, which is related to the slope of the short-run aggregate-supply curve.2. If policymakers want to take advantage of the short-run trade-off between unemployment and inflation, it may lead to negative consequences.a. Suppose the economy is at point A and policymakers wish to lower the unemploymentrate. Expansionary monetary policy or fiscal policy is used to shift aggregate demand tothe right. The economy moves to point B, with a lower unemployment rate and a higherrate of inflation.b. Over time, people get used to this new level of inflation and raise their expectations ofinflation. This leads to an upward shift of the short-run Phillips curve. The economy ends up at point C, with a higher inflation rate than at point A, but the same level ofunemployment.396 ❖ Chapter 22/The Short-Run Trade-off between Inflation and UnemploymentE. The Natural Experiment for the Natural-Rate Hypothesis1. Definition of the natural-rate hypothesis: the claim that unemployment eventually returns to its normal, or natural rate, regardless of the rate of inflation .2. Figure 6 shows the unemployment and inflation rates from 1961 to 1968. It is easy to see the inverse relationship between these two variables.3. Beginning in the late 1960s, the government followed policies that increased aggregate demand.a. Government spending rose because of the Vietnam War.b. The Fed increased the money supply to try to keep interest rates down.4. As a result of these policies, the inflation rate remained fairly high. However, even thoughinflation remained high, unemployment did not remain low.a. Figure 7 shows the unemployment and inflation rates from 1961 to 1973. The simple inverse relationship between these two variables began to disappear around 1970.b. Inflation expectations adjusted to the higher rate of inflation and the unemployment rate returned to its natural rate of around 5% to 6%.III. Shifts in the Phillips Curve: The Role of Supply ShocksA. In 1974, OPEC increased the price of oil sharply. This increased the cost of producing many goods and services and therefore resulted in higher prices.1. Definition of supply shock : an event that directly alters firms’ costs and prices,shifting the economy’s aggregate -supply curve and thus the Phillips curve .2. Graphically, we could represent this supply shock as a shift in the short-run aggregate-supplycurve to the left.3. The decrease in equilibrium output and the increase in the price level left the economy with stagflation.Chapter 22/The Short-Run Trade-off between Inflation and Unemployment ❖ 397B. Given this turn of events, policymakers are left with a less favorable short-run trade-off between unemployment and inflation.1. If they increase aggregate demand to fight unemployment, they will raise inflation further.2. If they lower aggregate demand to fight inflation, they will raise unemployment further. C. This less favorable trade-off between unemployment and inflation can be shown by a shift of theshort-run Phillips curve. The shift may be permanent or temporary, depending on how people adjust their expectations of inflation.D. During the 1970s, the Fed decided to accommodate the supply shock by increasing the supply of money. This increased the level of expected inflation. Figure 9 shows inflation and unemploymentin the United States during the late 1970s and early 1980s.IV. The Cost of Reducing InflationA. The Sacrifice Ratio1. To reduce the inflation rate, the Fed must follow contractionary monetary policy.a. When the Fed slows the rate of growth of the money supply, aggregate demand falls.b. This reduces the level of output in the economy, increasing unemployment.c. The economy moves from point A along the short-run Phillips curve to point B, which hasa lower inflation rate but a higher unemployment rate.Price Unemployment Rate398❖Chapter 22/The Short-Run Trade-off between Inflation and Unemploymentd. Over time, people begin to adjust their inflation expectations downward and the short-run Phillips curve shifts. The economy moves from point B to point C, where inflation islower and the unemployment rate is back to its natural rate.2. Therefore, to reduce inflation, the economy must suffer through a period of highunemployment and low output.3. Definition of sacrifice ratio: the number of percentage points of annual output lostin the process of reducing inflation by one percentage point.4. A typical estimate of the sacrifice ratio is five. This implies that for each percentage pointinflation is decreased, output falls by 5%.B. Rational Expectations and the Possibility of Costless Disinflation1. Definition of rational expectations: the theory according to which people optimallyuse all the information they have, including information about governmentpolicies, when forecasting the future.2. Proponents of rational expectations believe that when government policies change, peoplealter their expectations about inflation.3. Therefore, if the government makes a credible commitment to a policy of low inflation,people would be rational enough to lower their expectations of inflation immediately. Thisimplies that the short-run Phillips curve would shift quickly without any extended period ofhigh unemployment.C. The Volcker Disinflation1. Figure 11 shows the inflation and unemployment rates that occurred while Paul Volckerworked at reducing the level of inflation during the 1980s.2. As inflation fell, unemployment rose. In fact, the United States experienced its deepest recession since the Great Depression.3. Some economists have offered this as proof that the idea of a costless disinflation suggested by rational-expectations theorists is not possible. However, there are two reasons why we might not want to reject the rational-expectations theory so quickly.a. The cost (in terms of lost output) of the Volcker disinflation was not as large as many economists had predicted.b. While Volcker promised that he would fight inflation, many people did not believe him.Few people thought that inflation would fall as quickly as it did; this likely kept the short-run Phillips curve from shifting quickly.D. The Greenspan Era1. Figure 12 shows the inflation and unemployment rate from 1984 to 2005, called the Greenspan era because Alan Greenspan became the chairman of the Federal Reserve in 1987.2. In 1986, OPEC’s agreement with its members b roke down and oil prices fell. The result of this favorable supply shock was a drop in both inflation and unemployment.3. The rest of the 1990s witnessed a period of economic prosperity. Inflation gradually dropped, approaching zero by the end of the decade. Unemployment also reached a low level, leadingmany people to believe that the natural rate of unemployment had fallen.4. The economy ran into problems in 2001 due to the end of the dot-com stock market bubble,the 9-11 terrorist attacks, and corporate accounting scandals that reduced aggregate demand. Unemployment rose as the economy experienced its first recession in a decade.5. But a combination of expansionary monetary and fiscal policies helped end the downturn,and by early 2005, the unemployment rate was close to the estimated natural rate.6. In 2005, President Bush nominated Ben Bernanke as the Fed chairman. E. A Financial Crisis Takes Us for a Ride Along the Phillips Curve1. In his first couple of years as Fed chairman, Bernanke faced some significant economicchallenges.a. One challenge arose from problems in the housing and financial markets.b. The resulting financial crisis led to a large drop in aggregate demand and high rates of unemployment.c. Figure 13 shows the implications of these events for inflation and unemployment.d. From 2007 to 2009, as the decline in aggregate demand raised unemployment, it alsoreduced the inflation rate from about 3 percent to about 1 percent.e. From 2010 to 2012, unemployment fell and the inflation rate rose from about 1 percentto about 2 percent.f. In essence, the economy first rode down the Phillips curve and then rode back up.g. Note that expected inflation and the position of the short-run Phillips curve wererelatively stable during this period.SOLUTIONS TO TEXT PROBLEMS:Quick Quizzes1. The Phillips curve is shown in Figure 1.Figure 1To see how policy can move the economy from a point with high inflation to a point with lowinflation, suppose the economy begins at point A in Figure 2. If policy is used to reduceaggregate demand (such as a decrease in the money supply or a decrease in governmentpurchases), the aggregate-demand curve shifts from AD1 to AD2, and the economy movesfrom point A to point B with lower inflation, a reduction in real GDP, and an increase in theunemployment rate.Figure 22. Figure 3 shows the short-run Phillips curve and the long-run Phillips curve. The curves aredifferent because in the long run, monetary policy has no effect on unemployment, which tends toward its natural rate. However, in the short run, monetary policy can affect the unemployment rate. An increase in the growth rate of money raises actual inflation above expected inflation, causing firms to produce more since the short-run aggregate supply curve is positively sloped, which reduces unemployment temporarily.Figure 33. Examples of favorable shocks to aggregate supply include improved productivity and adecline in oil prices. Either shock shifts the aggregate-supply curve to the right, increasing output and reducing the price level, moving the economy from point A to point B in Figure 4.As a result, the Phillips curve shifts to the left, as the figure shows.Figure 44. The sacrifice ratio is the number of percentage points of annual output lost in the process ofreducing inflation by 1 percentage point. The credibility of the Fed’s commitment to reduceinflation might affect the sacrifice ratio because it affects the speed at which expectations ofinflati on adjust. If the Fed’s commitment to reduce inflation is credible, people will reducetheir expectations of inflation quickly, the short-run Phillips curve will shift downward, andthe cost of reducing inflation will be low in terms of lost output. But if the Fed is not credible,people will not reduce their expectations of inflation quickly, and the cost of reducinginflation will be high in terms of lost output.Questions for ReviewFigure 51. Figure 5 shows the short-run trade-off between inflation and unemployment. The Fed canmove the economy from one point on this curve to another by changing the money supply.An increase in the money supply reduces the unemployment rate and increases the inflation rate, while a decrease in the money supply increases the unemployment rate and decreases the inflation rate.Figure 62. Figure 6 shows the long-run trade-off between inflation and unemployment. In the long run,there is no trade-off, as the economy must return to the natural rate of unemployment on the long-run Phillips curve. In the short run, the economy can move along a short-run Phillips curve, like SRPC1 shown in the figure. But over time (as inflation expectations adjust) the short-run Phillips curve will shift to return the economy to the long-run Phillips curve, for example shifting from SRPC1 to SRPC2.3. The natural rate of unemployment is natural because it is beyond the influence of monetarypolicy. The rate of unemployment will move to its natural rate in the long run, regardless of the inflation rate.The natural rate of unemployment might differ across countries because countries havevarying degrees of union power, minimum-wage laws, collective-bargaining laws,unemployment insurance, job-training programs, and other factors that influence labor-market conditions.4. If a drought destroys farm crops and drives up the price of food, the short-run aggregate-supply curve shifts to the left and the short-run Phillips curve shifts to the right, because the costs of production have increased. The higher short-run Phillips curve means the inflation rate will be higher for any given unemployment rate.5. When the Fed decides to reduce inflation, the economy moves down along the short-runPhillips curve, as shown in Figure 7. Beginning at point A on short-run Phillips curve SRPC1, the economy moves down to point B as inflation declines. Once people's expectations adjust to the lower rate of inflation, the short-run Phillips curve shifts to SRPC2, and the economy moves to point C. The short-run costs of disinflation, which arise because the unemployment rate is temporarily above its natural rate, could be reduced if the Fed's action was credible, so that expectations would adjust more rapidly.Figure 7Quick Check Multiple Choice1. b2. d3. c4. a5. b6. dProblems and Applications1. Figure 8 shows two different short-run Phillips curves depicting these four points. Points aand d are on SRPC1 because both have expected inflation of 3%. Points b and c are onSRPC2 because both have expected inflation of 5%.Figure 82. a. A rise in the natural rate of unemployment shifts both the long-run Phillips curve and theshort-run Phillips curve to the right, as shown in Figure 9. The economy is initially onLRPC1 and SRPC1 at an inflation rate of 3%, which is also the expected rate of inflation.The increase in the natural rate of unemployment shifts the long-run Phillips curve toLRPC2 and the short-run Phillips curve to SRPC2, with the expected rate of inflationremaining equal to 3%.Figure 9b. A decline in the price of imported oil shifts the short-run Phillips curve to the left, asshown in Figure 10, from SRPC1 to SRPC2. For any given unemployment rate, theinflation rate is lower, because oil is such a significant aspect of production costs in the economy.Figure 10c. A rise in government spending represents an increase in aggregate demand, so it movesthe economy along the short-run Phillips curve, as shown in Figure 11. The economy moves from point A to point B, with a decline in the unemployment rate and an increase in the inflation rate.Figure 11d. A decline in expected inflation causes the short-run Phillips curve to shift to the left, asshown in Figure 12. The lower rate of expected inflation shifts the short-run Phillips curve from SRPC1 to SRPC2.Figure 12Figure 133. a. Figure 13 shows how a reduction in consumer spending causes a recession in both anaggregate-supply/aggregate-demand diagram and a Phillips-curve diagram. In bothdiagrams, the economy begins at full employment at point A. The decline in consumerspending reduces aggregate demand, shifting the aggregate-demand curve to the leftfrom AD1 to AD2. The economy initially remains on the short-run aggregate-supply curve AS1, so the new equilibrium occurs at point B. The movement of the aggregate-demand curve along the short-run aggregate-supply curve leads to a movement along short-run Phillips curve SRPC1, from point A to point B. The lower price level in the aggregate-supply/aggregate-demand diagram corresponds to the lower inflation rate in the Phillips-curve diagram. The lower level of output in the aggregate-supply/aggregate-demanddiagram corresponds to the higher unemployment rate in the Phillips-curve diagram.b. As expected inflation falls over time, the short-run aggregate-supply curve shifts to theright from AS1 to AS2, and the short-run Phillips curve shifts to the left from SRPC1 toSRPC2. In both diagrams, the economy eventually gets to point C, which is back on thelong-run aggregate-supply curve and long-run Phillips curve. After the recession is over, the economy faces a better set of inflation-unemployment combinations.Figure 144. a. Figure 14 shows the economy in long-run equilibrium at point a, which is on both thelong-run and short-run Phillips curves.b. A wave of business pessimism reduces aggregate demand, moving the economy to pointb in the figure. The unemployment rate increases and the inflation rate declines. If theFed undertakes expansionary monetary policy, it can increase aggregate demand,offsetting the pessimism and returning the economy to point a, with the initial inflationrate and unemployment rate.c. Figure 15 shows the effects on the economy if the price of imported oil rises. The higherprice of imported oil shifts the short-run Phillips curve to the right from SRPC1 to SRPC2.The economy moves from point a to point c, with a higher inflation rate and higherunemployment rate. If the Fed engages in expansionary monetary policy, it can returnthe economy to its original unemployment rate at point d, but the inflation rate will behigher. If the Fed engages in contractionary monetary policy, it can return the economy to its original inflation rate at point e, but the unemployment rate will be higher. Thissituation differs from that in part (b) because in part (b) the economy stayed on thesame short-run Phillips curve, but in part (c) the economy moved to a higher short-runPhillips curve, which gives policymakers a less favorable trade-off between inflation and unemployment.。