经济学原理-英文答案ch8
- 格式:doc
- 大小:410.50 KB
- 文档页数:9
经济学原理ch08CHAPTER 81. The market will be in equilibrium with a tax on sales of a good whena.the quantity demanded equals the quantity supplied and the price buyers payexceeds the price sellers receive by the per-unit tax.b.the price received by the seller equals the price paid by the buyer and thequantity demanded is less than the quantity supplied by the amount of the tax.c.the tax is equal to the price paid by the buyer and quantity demanded is equalto the quantity supplied.d.there cannot be a market equilibrium with a tax on sales.2. The tax rate on a good is thea.total amount of taxes paid by consumers on that goods.b.total amount of taxes paid by producers on that good.c.total amount of taxes paid by both producers and consumers on that good.d.per-unit tax on a good, expressed as a percentage of its price.3. Deadweight lossa.means that there is a loss to some individuals without a corresponding gain toothers.b.is not really a loss to society because what one individualloses anotherindividual gains.c.can be eliminated by sales taxes.d.can occur even if output is at the efficient level.4. Deadweight loss measuresa.the amount people would pay to gain an additional unit ofa good.b.the loss from economic inefficiency.c.the difference between two efficient situations.d.the amount required to compensate producers for lost surplus due to theimposition of a sales tax.5. The deadweight loss from an economically inefficient situation id equal toa.consumer surplus minus producer surplus.b.consumer surplus plus producer surplus.c.the consumer and producer surplus that people could gain by eliminating thatinefficiency.d.the increase in consumer surplus minus the increase in producer surplus thatpeople could gain by eliminating that inefficiency.6. A per-unit tax on a good creates deadweight loss becausea.it makes demand more inelastic.b.it makes supply more elastic.c.by increasing the price consumers pay, and reducing the price sellers receive,it prevents some mutually beneficial trades.d.the government wastes the tax revenues it receives.7. If the supply curve is perfectly elastic, a per-unit taxa.does not create deadweight loss.b.does not reduce consumer surplus.c.does not reduce producer surplus.d.reduces consumer surplus but increases producer surplus.8. Suppose demand for electricity is perfectly inelastic. A tax on electricity will bea.split between producers and consumers in equal shares.b.paid only by producers.c.paid only by consumers.d.split between producers and consumers in unequal shares.9. The coastal town of Milford, Connecticut recently increased taxes on beachfront property. They did this becausea.taxes on land generate no deadweight loss and lots of revenues forgovernment.b.politicians recognize that the supply of beachfront property is perfectlyinelastic and so the tax would generate no deadweight loss.c.taxes on land are paid entirely by the suppliers since the supply of beachfrontproperty is perfectly inelastic.d.of all of the above.10. When the government increases taxes on labor income,a.people tend to work harder to make up for lost income.b.people tend to work less because their take-home wage is lower.c.most employers reduce employment.d.any of the above, depending on the elasticities of demandand supply.11. Which of the following groups has a relatively elastic supply of labor?a.heads-of-households who must support other people with their income.b.Elderly people on Social Security, who can choose whether or not to work.c.Second earners in a household, who make lower wages than the primary wageearner.d. B and C both have relatively elastic labor supplies.12. Which of the following groups has a relatively inelastic supply of labor?e.heads-of-households who must support other people with their incomes.f.Elderly people on Social Security, who can choose whether or not to work.g.Second earners in a household, who make lower wages than the primary wageearner.h. B and C both have relatively elastic labor supplies.13. Henry George’s arguments were based on the idea thata.income taxes are optimal because they distort incentives.b.income taxes are optimal because they create no deadweight loss.c.taxes on land are optimal because they create no deadweight loss.d.income taxes are optimal because they are paid by employers.14. According to supply-side economists, the U.S. tax systemtends toa.decrease interest rates and loans to businesses.b.dampen incentives to work, save, and invest.c.reduce unemployment and push up the price level.d.provide lower tax rates to people who work on salary.15. According to the Laffer Curve, when taxes are increased from 0 percent to a rate consistent with the maximum point on the curve, tax revenue willa.decrease.b.increase.c.be the same as the tax rate.d.remain constant.16. According to supply-side economists, a policy that ________ will cause productivity to increase, which increase the supply of goods and services in the marketplace.a.increases interest ratesb.decreases inflationc.reduces marginal tax ratesd.funds capital investment in the economy17. In the early 1980s, supply-side economists suggested that the U.S. was ata.the minimum point along its Laffer curve.b.the maximum point along its Laffer curve.c.some point along the rising portion of its Laffer curve.d.some point along the falling portion of its Laffer curve.18. U.S. policymakers disagree most often about the effects of taxation becausea.some are capitalists and some are communists.b.some supply-siders and some are not.c.they have different ideas about relative elasticities of demand and supply.d.some are rich and some are poor.。
Chapter 8The Instruments of Trade PolicyChapter OrganizationBasic Tariff AnalysisSupply, Demand, and Trade in a Single IndustryEffects of a TariffMeasuring the Amount of ProtectionCosts and Benefits of a TariffConsumer and Producer SurplusMeasuring the Costs and BenefitsOther Instruments of Trade PolicyExport Subsidies: TheoryCase Study: Europe’s Common Agricultural PolicyImport Quotas: TheoryCase Study: An Import Quota in Practice: U.S. SugarVoluntary Export RestraintsCase Study: A Voluntary Export Restraint in Practice: Japanese Autos Local Content RequirementsBox: American Buses, Made in HungaryOther Trade Policy InstrumentsThe Effects of Trade Policy: A SummarySummaryAppendix I: Tariff Analysis in General EquilibriumA Tariff in a Small CountryA Tariff in a Large CountryAppendix II: Tariffs and Import Quotas in the Presence of Monopoly The Model with Free TradeThe Model with a TariffThe Model with an Import QuotaComparing a Tariff with a QuotaChapter 8 The Instruments of Trade Policy 33Chapter OverviewThis chapter and the next three focus on international trade policy. Students will have heard various arguments for and against restrictive trade practices in the media. Some of these arguments are sound and some are clearly not grounded in fact. This chapter provides a framework for analyzing the economic effects of trade policies by describing the tools of trade policy and analyzing their effects on consumers and producers in domestic and foreign countries. Case studies discuss actual episodes of restrictive trade practices. An instructor might try to underscore the relevance of these issues by having students scan newspapers and magazines for other timely examples of protectionism at work.The analysis presented here takes a partial equilibrium view, focusing on demand and supply in one market, rather than the general equilibrium approach followed in previous chapters. Import demand and export supply curves are derived from domestic and foreign demand and supply curves. There are a number of trade policy instruments analyzed in this chapter using these tools. Some of the important instruments of trade policy include specific tariffs, defined as taxes levied as a fixed charge for each unit of a good imported; ad valorem tariffs, levied as a fraction of the value of the imported good; export subsidies, which are payments given to a firm or industry that ships a good abroad; import quotas, which are direct restrictions on the quantity of some good that may be imported; voluntary export restraints, which are quotas on trading that are imposed by the exporting country instead of the importing country; and local content requirements, which are regulations that require that some specified fraction of a good is produced domestically.The import supply and export demand analysis demonstrates that the imposition of a tariff drives a wedge between prices in domestic and foreign markets, and increases prices in the country imposing the tariff and lowers the price in the other country by less than the amount of the tariff. This contrasts with most textbook presentations which make the small country assumption that the domestic internal price equals the world price times one plus the tariff rate. The actual protection provided by a tariff willnot equal the tariff rate if imported intermediate goods are used in the production of the protected good. The proper measurement, the effective rate of protection, is described in the text and calculated for a sample problem.The analysis of the costs and benefits of trade restrictions require tools of welfare analysis. The text explains the essential tools of consumer and producer surplus. Consumer surplus on each unit sold is defined as the difference between the actual price and the amount that consumers would have been willing to pay for the product. Geometrically, consumer surplus is equal to the area under the demand curve and above the price of the good. Producer surplus is the difference between the minimum amount for which a producer is willing to sell his product and the price which he actually receives. Geometrically, producer surplus is equal to the area above the supply curve and below the price line. These tools are fundamental to the student’s understanding of the implications of trade polici es and should be developed carefully. The costs of a tariff include distortionary efficiency losses in both consumption and production. A tariff provides gains from terms of trade improvement when and if it lowers the foreign export price. Summing the areas in a diagram of internal demand and supply provides a method for analyzing the net loss or gain from a tariff.Other instruments of trade policy can be analyzed with this method. An export subsidy operates in exactly the reverse fashion of an import tariff. An import quota has similar effects as an import tariff upon prices and quantities, but revenues, in the form of quota rents, accrue to foreign producers of the protected good. Voluntary export restraints are a form of quotas in which import licenses are held by foreign governments. Local content requirements raise the price of imports and domestic goods and do not result in either government revenue or quota rents.34 Krugman/Obstfeld •International Economics: Theory and Policy, Eighth EditionThroughout the chapter the analysis of different trade restrictions are illustrated by drawing upon specific episodes. Europe’s common agricultural policy provides and example of export subsidies in action. The case study corresponding to quotas describes trade restrictions on U.S. sugar imports. Voluntary export restraints are discussed in the context of Japanese auto sales to the United States. The oil import quota in the United States in the 1960’s provides an example of a local content scheme.There are two appendices to this chapter. Appendix I uses a general equilibrium framework to analyze the impact of a tariff, departing from the partial equilibrium approach taken in the chapter. When a small country imposes a tariff, it shifts production away from its exported good and toward the imported good. Consumption shifts toward the domestically produced goods. Both the volume of trade and welfare of the country decline. A large country imposing a tariff can improve its terms of trade by an amount potentially large enough to offset the production and consumption distortions. For a large country, a tariff may be welfare improving.Appendix II discusses tariffs and import quotas in the presence of a domestic monopoly. Free trade eliminates the monopoly power of a domestic producer and the monopolist mimics the actions of a firm in a perfectly competitive market, setting output such that marginal cost equals world price. A tariff raises domestic price. The monopolist, still facing a perfectly elastic demand curve, sets output such that marginal cost equals internal price. A monopolist faces a downward sloping demand curve under a quota.A quota is not equivalent to a tariff in this case. Domestic production is lower and internal price higher when a particular level of imports is obtained through the imposition of a quota rather than a tariff.Answers to Textbook Problems1. The import demand equation, MD, is found by subtracting the home supply equation from the homedemand equation. This results in MD= 80 - 40 ⨯P. Without trade, domestic prices and quantities adjust such that import demand is zero. Thus, the price in the absence of trade is 2.2. a. Foreign’s export supply curve, XS, is XS=-40 + 40⨯P. In the absence of trade, the price is 1.b. When trade occurs, export supply is equal to import demand, XS=MD. Thus, using theequations from Problems 1 and 2a, P= 1.50, and the volume of trade is 20.3. a. The new MD curve is 80 - 40 ⨯ (P+ t) where t is the specific tariff rate, equal to 0.5. (Note: Insolving these problems, you should be careful about whether a specific tariff or ad valorem tariff is imposed. With an ad valorem tariff, the MD equation would be expressed as MD= 80 - 40 ⨯(1 + t)P.) The equation for the export supply curve by the foreign country is unchanged. Solving,we find that the world price is $1.25, and thus the internal price at home is $1.75. The volume of trade has been reduced to 10, and the total demand for wheat at home has fallen to 65 (from thefree trade level of 70). The total demand for wheat in Foreign has gone up from 50 to 55.b. andc. The welfare of the home country is best studied using the combined numerical andgraphical solutions presented below in Figure 8.1.Figure 8.1Chapter 8 The Instruments of Trade Policy 35where the areas in the figure are:a.55(1.75 - 1.50) -0.5(55 - 50)(1.75 - 1.50) = 13.125b. 0.5(55 - 50)(1.75 - 1.50) = 0.625c. (65 - 55)(1.75 - 1.50) = 2.50d. 0.5(70 - 65)(1.75 - 1.50) = 0.625e. (65 - 55)(1.50 - 1.25) = 2.50Consumer surplus change: -(a+ b+ c+ d) =-16.875. Producer surplus change: a= 13.125.Government revenue change: c+ e= 5. Efficiency losses b+ d are exceeded by terms of tradegain e. (Note: In the calculations for the a, b, and d areas, a figure of 0.5 shows up. This isbecause we are measuring the area of a triangle, which is one-half of the area of the rectangledefined by the product of the horizontal and vertical sides.)4. Using the same solution methodology as in Problem 3, when the home country is very small relativeto the foreign country, its effects on the terms of trade are expected to be much less. The smallcountry is much more likely to be hurt by its imposition of a tariff. Indeed, this intuition is shown in this problem. The free trade equilibrium is now at the price $1.09 and the trade volume is now$36.40.With the imposition of a tariff of 0.5 by Home, the new world price is $1.045, the internal home price is $1.545, home demand is 69.10 units, home supply is 50.90, and the volume of trade is 18.20.When Home is relatively small, the effect of a tariff on world price is smaller than when Home is relatively large. When Foreign and Home were closer in size, a tariff of 0.5 by home lowered world price by 25 percent, whereas in this case the same tariff lowers world price by about 5 percent. The internal Home price is now closer to the free trade price plus t than when Home was relatively large.In this case, the government revenues from the tariff equal 9.10, the consumer surplus loss is 33.51, and the producer surplus gain is 21.089. The distortionary losses associated with the tariff (areas b+ d) sum to 4.14 and the terms of trade gain (e) is 0.819. Clearly, in this small country example, the distortionary losses from the tariff swamp the terms of trade gains. The general lesson is the smaller the economy, the larger the losses from a tariff since the terms of trade gains are smaller.5. ERP = (200 ⨯ 1.50 - 200)/100 = 100%6. The effective rate of protection takes into consideration the costs of imported intermediate goods.Here, 55% of the cost can be imported, suggesting with no distortion, home value added would be 45%. A 15% increase in the price of ethanol, though, means home value added could be as high as 60%. Effective rate of protection = (V t-V w)/V w, where V t is the value added in the presence of trade policies, and V w is the value added without trade distortions. In this case, we have (60 - 45)/45 = 33% effective rate of protection.7. We first use the foreign export supply and domestic import demand curves to determine the newworld price. The foreign supply of exports curve, with a foreign subsidy of 50 percent per unit,becomes XS=-40 + 40(1 + 0.5) ⨯P. The equilibrium world price is 1.2 and the internal foreign price is 1.8. The volume of trade is 32. The foreign demand and supply curves are used to determine the costs and benefits of the subsidy. Construct a diagram similar to that in the text and calculate the area of the various polygons. The government must provide (1.8 - 1.2)⨯ 32 = 19.2 units of output to support the subsidy. Foreign producers surplus rises due to the subsidy by the amount of 15.3 units of output. Foreign consumers surplus falls due to the higher price by 7.5 units of the good. Thus, the net loss to Foreign due to the subsidy is 7.5 + 19.2 - 15.3 = 11.4 units of output. Home consumers and producers face an internal price of 1.2 as a result of the subsidy. Home consumers surplus rises by 70 ⨯ 0.3 + 0.5 (6⨯ 0.3) = 21.9, while Home producers surplus falls by 44 ⨯ 0.3 + 0.5(6 ⨯ 0.3) =14.1, for a net gain of 7.8 units of output.36 Krugman/Obstfeld •International Economics: Theory and Policy, Eighth Edition8. a. False, unemployment has more to do with labor market issues and the business cycle than withtariff policy.b. False, the opposite is true because tariffs by large countries can actually reduce world priceswhich helps offset their effects on consumers.c. This kind of policy might reduce automobile production and Mexico, but also would increase theprice of automobiles in the United States, and would result in the same welfare loss associatedwith any quota.9. At a price of $10 per bag of peanuts, Acirema imports 200 bags of peanuts. A quota limiting theimport of peanuts to 50 bags has the following effects:a. The price of peanuts rises to $20 per bag.b. The quota rents are ($20 - $10) ⨯ 50 = $500.c. The consumption distortion loss is 0.5 ⨯ 100 bags ⨯ $10 per bag = $500.d. The production distortion loss is 0.5 ⨯ 50 bags ⨯ $10 per bag = $250.10. The reason is largely that the benefits of these policies accrue to a small group of people and thecosts are spread out over many people. Thus, those that benefit care far more deeply about these policies. These typical political economy problems associated with trade policy are probably even more troublesome in agriculture, where there are long standing cultural reasons for farmers andfarming communities to want to hold onto their way of life, making the interests even moreentrenched than they would normally be.11. It would improve the income distribution within the economy since wages in manufacturing wouldincrease, and real incomes for others in the economy would decrease due to higher prices formanufactured goods. This is true only under the assumption that manufacturing wages are lower than all others in the economy. If they were higher than others in the economy, the tariff policies would worsen the income distribution.。
曼昆-十大经济学原理,中英文对照第一篇:曼昆-十大经济学原理,中英文对照十大经济学原理。
曼昆在《经济学原理》一书中提出了十大经济学原理,他们分别是:十大经济学原理一:人们面临权衡取舍。
人们为了获得一件东西,必须放弃另一件东西。
决策需要对目标进行比较。
People Face Trade offs.To get one thing, you have to give up something else.Making decisions requires trading off one goal against another.例子:这样的例子很多,典型的是在“大炮与黄油”之间的选择,军事上所占的资源越多,可供民用消费和投资的资源就会越少。
同样,政府用于生产公共品的资源越多,剩下的用于生产私人品的资源就越少;我们用来消费的食品越多,则用来消费的衣服就越少;学生用于学习的时间越多,那么用于休息的时间就越少。
十大经济学原理二:某种东西的成本是为了得到它所放弃的东西。
决策者必须要考虑其行为的显性成本和隐性成本。
The Cost of Something is what You Give Up to Get It.Decision-makers have to consider both the obvious and implicit costs of their actions.例子:某公司决定在一个公园附近开采金矿的成本。
开采者称由于公园的门票收入几乎不受影响,因此金矿开采的成本很低。
但可以发现伴随着金矿开采带来的噪声、水和空气的污染、环境的恶化等,是否真的不会影响公园的风景价值?尽管货币价值成本可能会很小,但是考虑到环境和自然生态价值会丧失,因此机会成本事实上可能很大。
十大经济学原理三:理性人考虑边际量。
理性的决策者当且仅当行动的边际收益超过边际成本时才采取行动。
Rational People Think at Margin.A rational decision-makertakes action if and only if the marginal benefit of the action exceeds the marginal cost.例子:“边际量”是指某个经济变量在一定的影响因素下发生的变动量。

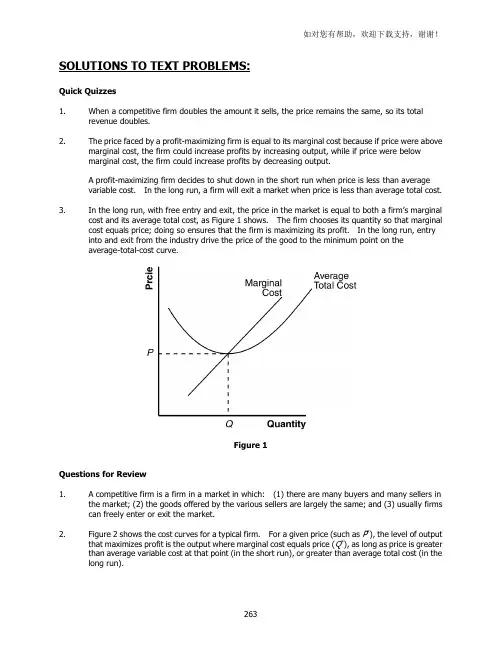
SOLUTIONS TO TEXT PROBLEMS:Quick Quizzes1. When a competitive firm doubles the amount it sells, the price remains the same, so its totalrevenue doubles.2. The price faced by a profit-maximizing firm is equal to its marginal cost because if price were abovemarginal cost, the firm could increase profits by increasing output, while if price were belowmarginal cost, the firm could increase profits by decreasing output.A profit-maximizing firm decides to shut down in the short run when price is less than averagevariable cost. In the long run, a firm will exit a market when price is less than average total cost.3. In the long run, with free entry and exit, the price in the market is equal to both a firm’s marginalcost and its average total cost, as Figure 1 shows. The firm chooses its quantity so that marginal cost equals price; doing so ensures that the firm is maximizing its profit. In the long run, entry into and exit from the industry drive the price of the good to the minimum point on theaverage-total-cost curve.Figure 1Questions for Review1. A competitive firm is a firm in a market in which: (1) there are many buyers and many sellers inthe market; (2) the goods offered by the various sellers are largely the same; and (3) usually firms can freely enter or exit the market.2. Figure 2 shows the cost curves for a typical firm. For a given price (such as P*), the level of outputthat maximizes profit is the output where marginal cost equals price (Q*), as long as price is greater than average variable cost at that point (in the short run), or greater than average total cost (in the long run).Figure 23. A firm will shut down temporarily if the revenue it would get from producing is less than thevariable costs of production. This occurs if price is less than average variable cost.4. A firm will exit a market if the revenue it would get if it stayed in business is less than its total cost.This occurs if price is less than average total cost.5. A firm's price equals marginal cost in both the short run and the long run. In both the short runand the long run, price equals marginal revenue. The firm should increase output as long asmarginal revenue exceeds marginal cost, and reduce output if marginal revenue is less thanmarginal cost. Profits are maximized when marginal revenue equals marginal cost.6. The firm's price equals the minimum of average total cost only in the long run. In the short run,price may be greater than average total cost, in which case the firm is making profits, or price may be less than average total cost, in which case the firm is making losses. But the situation isdifferent in the long run. If firms are making profits, other firms will enter the industry, which will lower the price of the good. If firms are making losses, they will exit the industry, which will raise the price of the good. Entry or exit continues until firms are making neither profits nor losses. At that point, price equals average total cost.7. Market supply curves are typically more elastic in the long run than in the short run. In acompetitive market, since entry or exit occurs until price equals the minimum of average total cost, the supply curve is perfectly elastic in the long run.Problems and Applications1. A competitive market is one in which: (1) there are many buyers and many sellers in the market;(2) the goods offered by the various sellers are largely the same; and (3) usually firms can freelyenter or exit the market. Of these goods, bottled water is probably the closest to a competitive market. Tap water is a natural monopoly because there's only one seller. Cola and beer are not perfectly competitive because every brand is slightly different.2. Since a new customer is offering to pay $300 for one dose, marginal revenue between 200 and 201doses is $300. So we must find out if marginal cost is greater than or less than $300. To do this, calculate total cost for 200 doses and 201 doses, and calculate the increase in total cost.Multiplying quantity by average total cost, we find that total cost rises from $40,000 to $40,401, so marginal cost is $401. So your roommate should not make the additional dose.3. a. Remembering that price equals marginal cost when firms are maximizing profit, we knowthe marginal cost must be 30 cents, since that is the price.b. The industry is not in long-run equilibrium since price exceeds average total cost.4. Once you have ordered the dinner, its cost is sunk, so it does not represent an opportunity cost.As a result, the cost of the dinner should not influence your decision about stuffing yourself.5. Since Bob’s average total cost is $280/10 = $28, which is greater than the price, he will exit theindustry in the long run. Since fixed cost is $30, average variable cost is ($280 - $30)/10 = $25, which is less than price, so Bob won’t shut down in the short run.6. Here’s the table showing costs, revenues, and profits:a. The firm should produce 5 or 6 units to maximize profit.b. Marginal revenue and marginal cost are graphed in Figure 3. The curves cross at aquantity between 5 and 6 units, yielding the same answer as in part (a).c. This industry is competitive since marginal revenue is the same for each quantity. Theindustry is not in long-run equilibrium, since profit is positive.Figure 37. a. Figure 4 shows the short-run effect of declining demand for beef. The shift of theindustry demand curve from D1 to D2 reduces the quantity from Q1 to Q2 and reduces theprice from P1 to P2. This affects the firm, reducing its quantity from q1 to q2. Before thedecline in the price, the firm was making zero profits; afterwards, profits are negative, asaverage total cost exceeds price.Figure 4b. Figure 5 shows the long-run effect of declining demand for beef. Since firms were losingmoney in the short run, some firms leave the industry. This shifts the supply curve fromS1 to S3. The shift of the supply curve is just enough to increase the price back to itsoriginal level, P1. As a result, industry output falls still further, to Q3. For firms thatremain in the industry, the rise in the price to P1 returns them to their original situation,producing quantity q1 and earning zero profits.Figure 58. Figure 6 shows that although high prices cause an industry to expand, entry into the industryeventually returns prices to the point of minimum average total cost. In the figure, the industry is originally in long-run equilibrium. The industry produces output Q1, where supply curve S1intersects demand curve D1, and the price is P1. At this point the typical firm produces output q1.Since price equals average total cost at that point, the firm makes zero economic profit.Now suppose an increase in demand occurs, with the demand curve shifting to D2. This causes "high prices" in the industry, as the price rises to P2. It also causes the industry to increase output to Q2. With the higher price, the typical firm increases its output from q1 to q2, and now makes positive profits, since price exceeds average total cost.However, the positive profits that firms earn encourage other firms to enter the industry. Their entry, "an expansion in an industry," leads the supply curve to shift to S3. The new equilibrium reduces the price back to P1, "bringing an end to high prices and manufacturers' prosperity," since now firms produce q1 and earn zero profit again. The only long-lasting effect is that industryoutput is Q3, a higher level than originally.Figure 69. a. Figure 7 shows the typical firm in the industry, with average total cost ATC1, marginal costMC1, and price P1.b. The new process reduces Hi-Tech’s marginal cost to MC2 and its average total cost to ATC2,but the price remains at P1 since other firms cannot use the new process. Thus Hi-Techearns positive profits.c. When the patent expires and other firms are free to use the technology, all firms’average-total-cost curves decline to ATC2, so the market price falls to P3 and firms earn noprofits.Figure 710. The rise in the price of petroleum increases production costs for individual firms and thus shifts theindustry supply curve up, as shown in Figure 8. The typical firm's initial marginal-cost curve is MC1 and its average-total-cost curve is ATC1. In the initial equilibrium, the industry supply curve, S1, intersects the demand curve at price P1, which is equal to the minimum average total cost of the typical firm. Thus the typical firm earns no economic profit.The increase in the price of oil shifts the typical firm's cost curves up to MC2 and ATC2, and shifts the industry supply curve up to S2. The equilibrium price rises from P1 to P2, but the price does not increase by as much as the increase in marginal cost for the firm. As a result, price is less than average total cost for the firm, so profits are negative.In the long run, the negative profits lead some firms to exit the industry. As they do so, theindustry-supply curve shifts to the left. This continues until the price rises to equal the minimum point on the firm's average-total-cost curve. The long-run equilibrium occurs with supply curve S3, equilibrium price P3, industry output Q3, and firm's output q3. Thus, in the long run, profits arezero again and there are fewer firms in the industry.Figure 811. a. Figure 9 illustrates the situation in the U.S. textile industry. With no international trade,the market is in long-run equilibrium. Supply intersects demand at quantity Q1 and price$30, with a typical firm producing output q1.Figure 9b. The effect of imports at $25 is that the market supply curve follows the old supply curve upto a price of $25, then becomes horizontal at that price. As a result, demand exceedsdomestic supply, so the country imports textiles from other countries. The typicaldomestic firm now reduces its output from q1 to q2, incurring losses, since the large fixedcosts imply that average total cost will be much higher than the price.c. In the long run, domestic firms will be unable to compete with foreign firms because theircosts are too high. All the domestic firms will exit the industry and other countries willsupply enough to satisfy the entire domestic demand.12. a. Figure 10 shows the current equilibrium in the market for pretzels. The supply curve, S1,intersects the demand curve at price P1. Each stand produces quantity q1 of pretzels, sothe total number of pretzels produced is 1,000 x q1. Stands earn zero profit, since priceequals average total cost.b. If the city government restricts the number of pretzel stands to 800, the industry-supplycurve shifts to S2. The market price rises to P2, and individual firms produce output q2.Industry output is now 800 x q2. Now the price exceeds average total cost, so each firm ismaking a positive profit. Without restrictions on the market, this would induce other firmsto enter the market, but they cannot, since the government has limited the number oflicenses.c. The city could charge a license fee for the licenses. Since it is a lump-sum fee for thelicense, not based on the quantity of sales, such a tax has no effect on marginal cost, sowon't affect the firm's output. It will, however, reduce the firm's profits. As long as thefirm is left with a zero or positive profit, it will continue to operate. So the license fee thatbrings the most money to the city is to charge each firm the amount (P2 - ATC2)q2, theamount of the firm's profit.Figure 1013. a. Figure 11 illustrates the gold market (industry) and a representative gold mine (firm).The demand curve, D1, intersects the supply curve at industry quantity Q1 and price P1.Since the industry is in long-run equilibrium, the price equals the minimum point on therepresentative firm's average total cost curve, so the firm produces output q1 and makeszero profit.b. The increase in jewelry demand leads to an increase in the demand for gold, shifting thedemand curve to D2. In the short run, the price rises to P2, industry output rises to Q2,and the representative firm's output rises to q2. Since price now exceeds average totalcost, the representative firm now earns positive profits.c. Since gold mines are earning positive economic profits, over time other firms will enter theindustry. This will shift the supply curve to the right, reducing the price below P2. Butit's unlikely that the price will fall all the way back to P1, since gold is in short supply.Costs for new firms are likely to be higher than for older firms, since they'll have to discovernew gold sources. So it's likely that the long-run supply curve in the gold industry isupward sloping. That means the long-run equilibrium price will be higher than it wasinitially.Figure 1114. a. Figure 12 shows cost curves for a California refiner and a non-California refiner. Since theCalifornia refiner has access to lower-cost oil, its costs are lower.Figure 12b. In long-run equilibrium, the price is determined by the costs of non-California refiners,since California refiners cannot supply the entire market. The market price will equal theminimum average total cost of the other refiners; they will thus earn zero profits. SinceCalifornia refiners have lower costs, they will earn positive profits, equal to (P* - ATC C) xQ C.c. Yes, there is a subsidy to California refiners that is not passed on to consumers. Thesubsidy accounts for the long-run profits of the California refiners. It arises simplybecause the oil cannot be exported.。
Chapter 8The Instruments of Trade PolicyChapter OrganizationBasic Tariff AnalysisSupply, Demand, and Trade in a Single IndustryEffects of a TariffMeasuring the Amount of ProtectionCosts and Benefits of a TariffConsumer and Producer SurplusMeasuring the Costs and BenefitsOther Instruments of Trade PolicyExport Subsidies: TheoryCase Study: Europe’s Common Agricultural PolicyImport Quotas: TheoryCase Study: An Import Quota in Practice: U.S. SugarVoluntary Export RestraintsCase Study: A Voluntary Export Restraint in Practice: Japanese Autos Local Content RequirementsBox: American Buses, Made in HungaryOther Trade Policy InstrumentsThe Effects of Trade Policy: A SummarySummaryAppendix I: Tariff Analysis in General EquilibriumA Tariff in a Small CountryA Tariff in a Large CountryAppendix II: Tariffs and Import Quotas in the Presence of Monopoly The Model with Free TradeThe Model with a TariffThe Model with an Import QuotaComparing a Tariff with a QuotaChapter 8 The Instruments of Trade Policy 33Chapter OverviewThis chapter and the next three focus on international trade policy. Students will have heard various arguments for and against restrictive trade practices in the media. Some of these arguments are sound and some are clearly not grounded in fact. This chapter provides a framework for analyzing the economic effects of trade policies by describing the tools of trade policy and analyzing their effects on consumers and producers in domestic and foreign countries. Case studies discuss actual episodes of restrictive trade practices. An instructor might try to underscore the relevance of these issues by having students scan newspapers and magazines for other timely examples of protectionism at work.The analysis presented here takes a partial equilibrium view, focusing on demand and supply in one market, rather than the general equilibrium approach followed in previous chapters. Import demand and export supply curves are derived from domestic and foreign demand and supply curves. There are a number of trade policy instruments analyzed in this chapter using these tools. Some of the important instruments of trade policy include specific tariffs, defined as taxes levied as a fixed charge for each unit of a good imported; ad valorem tariffs, levied as a fraction of the value of the imported good; export subsidies, which are payments given to a firm or industry that ships a good abroad; import quotas, which are direct restrictions on the quantity of some good that may be imported; voluntary export restraints, which are quotas on trading that are imposed by the exporting country instead of the importing country; and local content requirements, which are regulations that require that some specified fraction of a good is produced domestically.The import supply and export demand analysis demonstrates that the imposition of a tariff drives a wedge between prices in domestic and foreign markets, and increases prices in the country imposing the tariff and lowers the price in the other country by less than the amount of the tariff. This contrasts with most textbook presentations which make the small country assumption that the domestic internal price equals the world price times one plus the tariff rate. The actual protection provided by a tariff willnot equal the tariff rate if imported intermediate goods are used in the production of the protected good. The proper measurement, the effective rate of protection, is described in the text and calculated for a sample problem.The analysis of the costs and benefits of trade restrictions require tools of welfare analysis. The text explains the essential tools of consumer and producer surplus. Consumer surplus on each unit sold is defined as the difference between the actual price and the amount that consumers would have been willing to pay for the product. Geometrically, consumer surplus is equal to the area under the demand curve and above the price of the good. Producer surplus is the difference between the minimum amount for which a producer is willing to sell his product and the price which he actually receives. Geometrically, producer surplus is equal to the area above the supply curve and below the price line. These tools are fundamental to the student’s understanding of the implications of trade polici es and should be developed carefully. The costs of a tariff include distortionary efficiency losses in both consumption and production. A tariff provides gains from terms of trade improvement when and if it lowers the foreign export price. Summing the areas in a diagram of internal demand and supply provides a method for analyzing the net loss or gain from a tariff.Other instruments of trade policy can be analyzed with this method. An export subsidy operates in exactly the reverse fashion of an import tariff. An import quota has similar effects as an import tariff upon prices and quantities, but revenues, in the form of quota rents, accrue to foreign producers of the protected good. Voluntary export restraints are a form of quotas in which import licenses are held by foreign governments. Local content requirements raise the price of imports and domestic goods and do not result in either government revenue or quota rents.34 Krugman/Obstfeld •International Economics: Theory and Policy, Eighth EditionThroughout the chapter the analysis of different trade restrictions are illustrated by drawing upon specific episodes. Europe’s common agricultural policy provides and example of export subsidies in action. The case study corresponding to quotas describes trade restrictions on U.S. sugar imports. Voluntary export restraints are discussed in the context of Japanese auto sales to the United States. The oil import quota in the United States in the 1960’s provides an example of a local content scheme.There are two appendices to this chapter. Appendix I uses a general equilibrium framework to analyze the impact of a tariff, departing from the partial equilibrium approach taken in the chapter. When a small country imposes a tariff, it shifts production away from its exported good and toward the imported good. Consumption shifts toward the domestically produced goods. Both the volume of trade and welfare of the country decline. A large country imposing a tariff can improve its terms of trade by an amount potentially large enough to offset the production and consumption distortions. For a large country, a tariff may be welfare improving.Appendix II discusses tariffs and import quotas in the presence of a domestic monopoly. Free trade eliminates the monopoly power of a domestic producer and the monopolist mimics the actions of a firm in a perfectly competitive market, setting output such that marginal cost equals world price. A tariff raises domestic price. The monopolist, still facing a perfectly elastic demand curve, sets output such that marginal cost equals internal price. A monopolist faces a downward sloping demand curve under a quota.A quota is not equivalent to a tariff in this case. Domestic production is lower and internal price higher when a particular level of imports is obtained through the imposition of a quota rather than a tariff.Answers to Textbook Problems1. The import demand equation, MD, is found by subtracting the home supply equation from the homedemand equation. This results in MD= 80 - 40 ⨯P. Without trade, domestic prices and quantities adjust such that import demand is zero. Thus, the price in the absence of trade is 2.2. a. Foreign’s export supply curve, XS, is XS=-40 + 40⨯P. In the absence of trade, the price is 1.b. When trade occurs, export supply is equal to import demand, XS=MD. Thus, using theequations from Problems 1 and 2a, P= 1.50, and the volume of trade is 20.3. a. The new MD curve is 80 - 40 ⨯ (P+ t) where t is the specific tariff rate, equal to 0.5. (Note: Insolving these problems, you should be careful about whether a specific tariff or ad valorem tariff is imposed. With an ad valorem tariff, the MD equation would be expressed as MD= 80 - 40 ⨯(1 + t)P.) The equation for the export supply curve by the foreign country is unchanged. Solving,we find that the world price is $1.25, and thus the internal price at home is $1.75. The volume of trade has been reduced to 10, and the total demand for wheat at home has fallen to 65 (from thefree trade level of 70). The total demand for wheat in Foreign has gone up from 50 to 55.b. andc. The welfare of the home country is best studied using the combined numerical andgraphical solutions presented below in Figure 8.1.Figure 8.1Chapter 8 The Instruments of Trade Policy 35where the areas in the figure are:a.55(1.75 - 1.50) -0.5(55 - 50)(1.75 - 1.50) = 13.125b. 0.5(55 - 50)(1.75 - 1.50) = 0.625c. (65 - 55)(1.75 - 1.50) = 2.50d. 0.5(70 - 65)(1.75 - 1.50) = 0.625e. (65 - 55)(1.50 - 1.25) = 2.50Consumer surplus change: -(a+ b+ c+ d) =-16.875. Producer surplus change: a= 13.125.Government revenue change: c+ e= 5. Efficiency losses b+ d are exceeded by terms of tradegain e. (Note: In the calculations for the a, b, and d areas, a figure of 0.5 shows up. This isbecause we are measuring the area of a triangle, which is one-half of the area of the rectangledefined by the product of the horizontal and vertical sides.)4. Using the same solution methodology as in Problem 3, when the home country is very small relativeto the foreign country, its effects on the terms of trade are expected to be much less. The smallcountry is much more likely to be hurt by its imposition of a tariff. Indeed, this intuition is shown in this problem. The free trade equilibrium is now at the price $1.09 and the trade volume is now$36.40.With the imposition of a tariff of 0.5 by Home, the new world price is $1.045, the internal home price is $1.545, home demand is 69.10 units, home supply is 50.90, and the volume of trade is 18.20.When Home is relatively small, the effect of a tariff on world price is smaller than when Home is relatively large. When Foreign and Home were closer in size, a tariff of 0.5 by home lowered world price by 25 percent, whereas in this case the same tariff lowers world price by about 5 percent. The internal Home price is now closer to the free trade price plus t than when Home was relatively large.In this case, the government revenues from the tariff equal 9.10, the consumer surplus loss is 33.51, and the producer surplus gain is 21.089. The distortionary losses associated with the tariff (areas b+ d) sum to 4.14 and the terms of trade gain (e) is 0.819. Clearly, in this small country example, the distortionary losses from the tariff swamp the terms of trade gains. The general lesson is the smaller the economy, the larger the losses from a tariff since the terms of trade gains are smaller.5. ERP = (200 ⨯ 1.50 - 200)/100 = 100%6. The effective rate of protection takes into consideration the costs of imported intermediate goods.Here, 55% of the cost can be imported, suggesting with no distortion, home value added would be 45%. A 15% increase in the price of ethanol, though, means home value added could be as high as 60%. Effective rate of protection = (V t-V w)/V w, where V t is the value added in the presence of trade policies, and V w is the value added without trade distortions. In this case, we have (60 - 45)/45 = 33% effective rate of protection.7. We first use the foreign export supply and domestic import demand curves to determine the newworld price. The foreign supply of exports curve, with a foreign subsidy of 50 percent per unit,becomes XS=-40 + 40(1 + 0.5) ⨯P. The equilibrium world price is 1.2 and the internal foreign price is 1.8. The volume of trade is 32. The foreign demand and supply curves are used to determine the costs and benefits of the subsidy. Construct a diagram similar to that in the text and calculate the area of the various polygons. The government must provide (1.8 - 1.2)⨯ 32 = 19.2 units of output to support the subsidy. Foreign producers surplus rises due to the subsidy by the amount of 15.3 units of output. Foreign consumers surplus falls due to the higher price by 7.5 units of the good. Thus, the net loss to Foreign due to the subsidy is 7.5 + 19.2 - 15.3 = 11.4 units of output. Home consumers and producers face an internal price of 1.2 as a result of the subsidy. Home consumers surplus rises by 70 ⨯ 0.3 + 0.5 (6⨯ 0.3) = 21.9, while Home producers surplus falls by 44 ⨯ 0.3 + 0.5(6 ⨯ 0.3) =14.1, for a net gain of 7.8 units of output.36 Krugman/Obstfeld •International Economics: Theory and Policy, Eighth Edition8. a. False, unemployment has more to do with labor market issues and the business cycle than withtariff policy.b. False, the opposite is true because tariffs by large countries can actually reduce world priceswhich helps offset their effects on consumers.c. This kind of policy might reduce automobile production and Mexico, but also would increase theprice of automobiles in the United States, and would result in the same welfare loss associatedwith any quota.9. At a price of $10 per bag of peanuts, Acirema imports 200 bags of peanuts. A quota limiting theimport of peanuts to 50 bags has the following effects:a. The price of peanuts rises to $20 per bag.b. The quota rents are ($20 - $10) ⨯ 50 = $500.c. The consumption distortion loss is 0.5 ⨯ 100 bags ⨯ $10 per bag = $500.d. The production distortion loss is 0.5 ⨯ 50 bags ⨯ $10 per bag = $250.10. The reason is largely that the benefits of these policies accrue to a small group of people and thecosts are spread out over many people. Thus, those that benefit care far more deeply about these policies. These typical political economy problems associated with trade policy are probably even more troublesome in agriculture, where there are long standing cultural reasons for farmers andfarming communities to want to hold onto their way of life, making the interests even moreentrenched than they would normally be.11. It would improve the income distribution within the economy since wages in manufacturing wouldincrease, and real incomes for others in the economy would decrease due to higher prices formanufactured goods. This is true only under the assumption that manufacturing wages are lower than all others in the economy. If they were higher than others in the economy, the tariff policies would worsen the income distribution.。
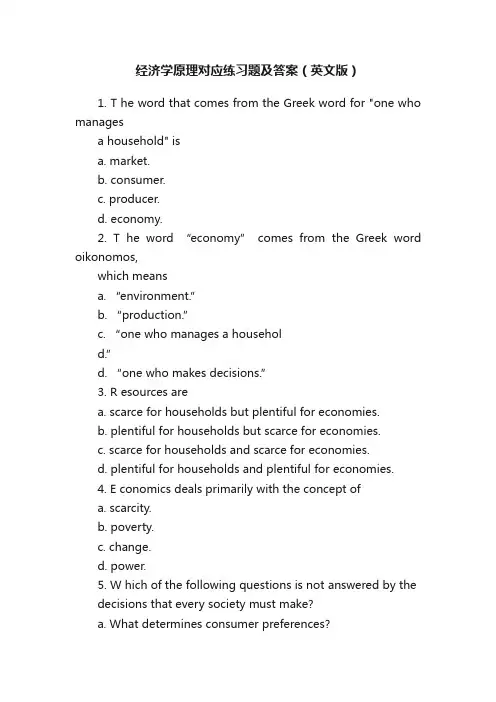
经济学原理对应练习题及答案(英文版)1. T he word that comes from the Greek word for "one who managesa household" isa. market.b. consumer.c. producer.d. economy.2. T he word “economy” comes from the Greek word oikonomos,which meansa. “environment.”b. “production.”c. “one who manages a household.”d. “one who makes decisions.”3. R esources area. scarce for households but plentiful for economies.b. plentiful for households but scarce for economies.c. scarce for households and scarce for economies.d. plentiful for households and plentiful for economies.4. E conomics deals primarily with the concept ofa. scarcity.b. poverty.c. change.d. power.5. W hich of the following questions is not answered by thedecisions that every society must make?a. What determines consumer preferences?b. What goods will be produced?c. Who will produce the goods?d. Who will consume the goods?6. T he overriding reason as to why households and societies facemany decisions is that2 Chapter 1/Ten Principles of Economicsa. resources are scarce.b. goods and services are not scarce.c. incomes fluctuate with business cycles.d. people, by nature, tend to disagree.7. T he phenomenon of scarcity stems from the fact thata. most economies’production methods are not very good.b. in most economies, wealthy people consumedisproportionate quantities of goods and services.c. governments restricts production of too many goods andservices.d. resources are limited.8. A pproximately what percentage of the world's economiesexperience scarcity?a. 25%b. 50%c. 75%d. 100%9. W hen a society cannot produce all the goods and servicespeople wish to have, it is said that the economy isexperiencinga. scarcity.b. shortages.c. inefficiencies.d. inequities.10. F or society, a good is not scarce ifa. at least one individual in society can obtain all he orshe wants of the good.b. firms are producing the good at full capacity.c. all members of society can have all they want of thegood.Chapter 1/Ten Principles of Economics 3d. those who have enough income can buy all they want ofthe good.11. W hich of the following products would be considered scarce?a. golf clubsb. Picasso paintingsc. applesd. All of the above are correct.12. E conomics is the study ofa. production methods.b. how society manages its scarce resources.c. how households decide who performs which tasks.d. the interaction of business and government.14. I n most societies, resources are allocated bya. a single central planner.b. a small number of central planners.c. those firms that use resources to provide goods andservices.d. the combined actions of millions of households andfirms.15. T he adage, "There is no such thing as a free lunch," isusedto illustrate the principle thata. goods are scarce.b. people face tradeoffs.(to get something we like, weusually have to give up another thing we like)c. income must be earned.d. households face many decisions.18. W hich of the following statements best represents theprinciple represented by the adage, "There is no such thing as a free lunch"?4 Chapter 1/Ten Principles of Economicsa. Melissa can attend the concert only if she takes hersister with her.b. Greg is hungry and homeless.c. Brian must repair the tire on his bike before he can rideit to class.d. Kendra must decide between going to Colorado or Cancunfor spring break.19. T he principle that "people face tradeoffs" applies toa. individuals.b. families.c. societies.d. All of the above are correct.20. A typical society strives to get the most it can from itsscarce resources. At the same time, the society attempts to distribute the benefits of those resources to the members of the society in a fair manner. In other words, the society facesa tradeoff betweena. guns and butter.b. efficiency and equity.c. inflation and unemployment.d. work and leisure.21. G uns and butter are used to represent the classic societaltradeoff between spending ona. durable and nondurable goods.b. imports and exports.c. national defense and consumer goods.d. law enforcement and agriculture.22. W hen society requires that firms reduce pollution, there isa. a tradeoff because of reduced incomes to the firms'owners and workers.b. a tradeoff only if some firms are forced to close.Chapter 1/Ten Principles of Economics 5c. no tradeoff, since the cost of reducing pollution fallsonly on the firms affected by the requirements.d. no tradeoff, since everyone benefits from reducedpollution.23. A tradeoff exists between a clean environment and a higherlevel of income in thata. studies show that individuals with higher levels ofincome actually pollute less than low-income individuals.b. efforts to reduce pollution typically are notcompletely successful.c. laws that reduce pollution raise costs of production andreduce incomes.d. by employing individuals to clean up pollution,employment and income both rise.24. W hich of the following phrases best captures the notion ofefficiency?a. absolute fairnessb. equal distributionc. minimum wasted. equitable outcome25. W hich of the following is true?a. Efficiency refers to the size of the economic pie;equity refers to how the pie is divided.b. Government policies usually improve upon both equityand efficiency.c. As long as the economic pie continually gets larger, noone will have to go hungry.d. Efficiency and equity can both be achieved if theeconomic pie is cut into equal pieces.26. E fficiency means that6 Chapter 1/Ten Principles of Economicsa. society is conserving resources in order to save themfor the future.b. society's goods and services are distributed equallyamong society's members.c. society's goods and services are distributed fairly,though not necessarily equally, among society's members.d. society is getting the maximum benefits from its scarceresources.27. E conomists use the word equity to describe a situation inwhicha. each member of society has the same income.b. each member of society has access to abundant quantitiesof goods and services, regardless of his or her income.c. society is getting the maximum benefits from its scarceresources.d. the benefits of society's resources are distributedfairly among society's members.28. S enator Smith wants to increase taxes on people with highincomes and use the money to help the poor. Senator Jones argues that such a tax will discourage successful people from working and will therefore make society worse off. An economist would say thata. we should agree with Senator Smith.b. we should agree with Senator Jones.c. a good decision requires that we recognize bothviewpoints.d. there are no tradeoffs between equity and efficiency.29. W hich of the following words and phrases best captures thenotion of equity?a. minimum wasteb. maximum benefitChapter 1/Ten Principles of Economics 7c. samenessd. fairnessANS: D DIF: 1 REF: 1-1TOP: Equity MSC: Definitional30. W hen government policies are enacted,a. equity can usually be enhanced without an efficiencyloss, but efficiency can never be enhanced without an equity loss.b. efficiency can usually be enhanced without an equityloss, but equity can never be enhanced without an efficiency loss.c. it is always the case that either efficiency andfairness are both enhanced, or efficiency and equity are both diminished.d. None of the above are correct.ANS: D DIF: 2 REF: 1-1TOP: Government, Efficiency, Equity MSC: Applicative31. A likely effect of government policies that redistributeincome and wealth from the wealthy to the poor is that those policiesa. enhance equity.b. reduce efficiency.c. reduce the reward for working hard.d. All of the above are correct.ANS: D DIF: 2 REF: 1-1TOP: Government, Efficiency, Equity MSC: Interpretive8 Chapter 1/Ten Principles of Economics32. W hen the government implements programs such as progressiveincome tax rates, which of the following is likely to occur?a. Equity is increased and efficiency is increased.b. Equity is increased and efficiency is decreased.c. Equity is decreased and efficiency is increased.d. Equity is decreased and efficiency is decreased. ANS: B DIF:2 REF: 1-1TOP: Government, Efficiency, Equity MSC: Interpretive33. A s a result of a successful attempt by government to cut theeconomic pie into more equal slices,a. it is easier to cut the pie, and therefore the economycan produce a larger pie.b. the government can more easily allocate the pie to thosemost in need.c. the pie gets smaller, and there will be less pie overall.d. government will spend too much time cutting and itcauses the economy to lose the ability to produce enough pie for everyone.ANS: C DIF: 3 REF: 1-1TOP: Government, Efficiency, Equity MSC: Analytical34. W hen the government attempts to improve equity in an economythe result is oftena. an increase in overall output in the economy.b. additional government revenue since overall income willincrease.c. a reduction in equity.d. a reduction in efficiency.ANS: D DIF: 2 REF: 1-1TOP: Government, Efficiency, Equity MSC: InterpretiveChapter 1/Ten Principles of Economics 935. W hen the government redistributes income from the wealthy tothe poor,a. efficiency is improved, but equity is not.b. both wealthy people and poor people benefit directly.c. people work less and produce fewer goods and services.d. wealthy people consume fewer goods, but poor people consume more goods, resulting in no real change. ANS: C DIF: 2 REF: 1-1TOP: Government, Efficiency, Equity MSC: Interpretive36. I n economics, the cost of something isa. the dollar amount of obtaining it.b. always measured in units of time given up to get it.c. what you give up to get it.d. often impossible to quantify, even in principle. ANS: C DIF: 1 REF: 1-1TOP: Opportunity cost MSC: Definitional37. W hat you give up to obtain an item is called youra. opportunity cost.b. explicit cost.c. true cost.d. direct cost.ANS: A DIF: 1 REF: 1-1TOP: Opportunity cost MSC: Definitional10 Chapter 1/Ten Principles of Economics38. T he opportunity cost of going to college isa. the total spent on food, clothing, books, transportation, tuition, lodging, and other expenses.b. the value of the best opportunity a student gives up to attend college.c. zero for students who are fortunate enough to have all of their college expenses paid by someone else.d. zero, since a college education will allow a student toearn a larger income after graduation.ANS: B DIF: 2 REF: 1-1TOP: Opportunity cost MSC: Interpretive39. M aurice receives $100 as a birthday gift. In deciding how tospend the money, he narrows his options down to four choices: Option A, Option B, Option C, and Option D. Each option costs $100. Finally he decides on Option B. The opportunity cost of this decision isa. the value to Maurice of the option he would have chosenhad Option B not been available.b. the value to Maurice of Options A, C and D combined.c. $100.d. $300.ANS: A DIF: 2 REF: 1-1TOP: Opportunity cost MSC: ApplicativeChapter 1/Ten Principles of Economics 1140. A furniture maker currently produces 100 tables per week andsells them for a profit. She is considering expanding her operation in order to make more tables. Should she expand?a. Yes, because making tables is profitable.b. No, because she may not be able to sell the additionaltables.c. It depends on the marginal cost of producing more tablesand the marginal revenue she will earn from selling more tables.d. It depends on the average cost of producing more tablesand the average revenue she will earn from selling more tables.ANS: C DIF: 2 REF: 1-1TOP: Marginal changes MSC: Applicative41. F or most students, the largest single cost of a collegeeducation isa. the wages given up to attend school.b. tuition, fees, and books.c. room and board.d. transportation, parking, and entertainment.ANS: A DIF: 2 REF: 1-1TOP: Opportunity cost MSC: Interpretive12 Chapter 1/Ten Principles of Economics42. F or a college student who wishes to calculate the true costsof going to college, the costs of room and boarda. should be counted in full, regardless of the costs ofeating and sleeping elsewhere.b. should be counted only to the extent that they are moreexpensive at college than elsewhere.c. usually exceed the opportunity cost of going to college.d. plus the cost of tuition, equals the opportunity costof going to college.ANS: B DIF: 2 REF: 1-1TOP: Opportunity cost MSC: Applicative43. F or which of the following individuals would the opportunitycost of going to college be highest?a. a promising young mathematician who will command a highsalary once she earns her college degreeb. a student with average grades who has never held a jobc. a famous, highly-paid actor who wants to take time awayfrom show business to finish college and earn a degreed. a student who is the best player on his collegebasketball team, but who lacks the skills necessary to play professional basketballANS: C DIF: 2 REF: 1-1TOP: Opportunity cost MSC: ApplicativeChapter 1/Ten Principles of Economics 1344. W hen you calculate your true costs of going to college, whatportion of your room-and-board expenses should be included?a. Your full room-and-board expenses should always beincluded.b. None of your room-and-board expenses should ever beincluded.c. You should include only the amount by which yourroom-and-board expenses exceed the income you earn while attending college.d. You should include only the amount by which yourroom-and-board expenses exceed the expenses for rent and food if you were not in college.ANS: D DIF: 2 REF: 1-1TOP: Opportunity cost MSC: Applicative45. T he opportunity cost of an item isa. the number of hours needed to earn money to buy the item.b. what you give up to get that item.c. usually less than the dollar value of the item.d. the dollar value of the item.ANS: B DIF: 1 REF: 1-1TOP: Opportunity cost MSC: Definitional14 Chapter 1/Ten Principles of Economics46. M allory decides to spend three hours working overtime ratherthan watching a video with her friends. She earns $8 an hour.Her opportunity cost of working isa. the $24 she earns working.b. the $24 minus the enjoyment she would have received fromwatching the video.c. the enjoyment she would have received had she watchedthe video.d. nothing, since she would have received less than $24 ofenjoyment from the video.ANS: C DIF: 3 REF: 1-1TOP: Opportunity cost MSC: Applicative47. R ussell spends an hour studying instead of playing tennis.The opportunity cost to him of studying isa. the improvement in his grades from studying for thehour.b. the improvement in his grades from studying minus theenjoyment of playing tennis.c. the enjoyment and exercise he would have received hadhe played tennis.d. zero. Since Russell chose to study rather than to playtennis, the value of studying must have been greater than the value of playing tennis.ANS: C DIF: 3 REF: 1-1TOP: Opportunity cost MSC: ApplicativeChapter 1/Ten Principles of Economics 1548. C ollege-age athletes who drop out of college to playprofessional sportsa. are not rational decision makers.b. are well aware that their opportunity cost of attendingcollege is very high.c. are concerned more about present circumstances thantheir future.d. underestimate the value of a college education. ANS: B DIF:2 REF: 1-1TOP: Opportunity cost MSC: Interpretive49. A rational decisionmakera. ignores marginal changes and focuses instead on “thebig picture.”b. ignores the likely effects of government policies whenhe or she makes choices.c. takes an action only if the marginal benefit of thataction exceeds the marginal cost of that action.d. takes an action only if the combined benefits of thataction and previous actions exceed the combined costs of that action and previous actions.ANS: C DIF: 2 REF: 1-1TOP: Marginal changes MSC: Interpretive50. R ational people make decisions at the margin bya. following marginal traditions.b. behaving in a random fashion.c. thinking in black-and-white terms.d. comparing marginal costs and marginal benefits. ANS: D DIF: 1 REF: 1-1TOP: Marginal changes MSC: Interpretive。

曼昆经济学原理英文版文案加习题答案8章WHAT’S NEW IN THE S EVENTH EDITION:A new In the News box on “The Tax Debate ” has been added.LEARNING OBJECTIVES:By the end of this chapter, students should understand:➢ how taxes reduce consumer and producer surplus.➢ the meaning and causes of the deadweight loss from a tax.➢ why some taxes have larger deadweight losses than others.➢ how tax revenue and deadweight loss vary with the size of a tax.CONTEXT AND PURPOSE:Chapter 8 is the second chapter in a three-chapter sequence dealing with welfare economics. In theprevious section on supply and demand, Chapter 6 introduced taxes and demonstrated how a tax affects the price and quantity sold in a market. Chapter 6 also described the factors that determine how the burden of the tax is divided between the buyers and sellers in a market. Chapter 7 developed welfare economics —the study of how the allocation of resources affects economic well-being. Chapter 8 combines the lessons learned in Chapters 6 and 7 and addresses the effects of taxation on welfare. Chapter 9 will address the effects of trade restrictions on welfare.The purpose of Chapter 8 is to apply the lessons learned about welfare economics in Chapter 7 to the issue of taxation that was addressed in Chapter 6. Students will learn that the cost of a tax to buyers and sellers in a market exceeds the revenue collected by the government. Students will also learn about the factors that determine the degree by which the cost of a tax exceeds the revenue collected by the government.APPLICATION: THE COSTS OF TAXATIONKEY POINTS:• A tax on a good reduces the welfare of buyers and sellers of the good, and the reduction in consumer and producer surplus usually exceeds the revenue raised by the government. The fall in total surplus—the sum of consumer surplus, producer surplus, and tax revenue—is called the deadweight loss of the tax.•Taxes have deadweight losses because they cause buyers to consume less and sellers to produce less, and these changes in behavior shrink the size of the market below the level that maximizes total surplus. Because the elasticities of supply and demand measure how much market participants respond to market conditions, larger elasticities imply larger deadweight losses.•As a tax grows larger, it distorts incentives more, and its deadweight loss grows larger.Because a tax reduces the size of a market, however, tax revenue does not continuallyincrease. It first rises with the size of a tax, but if the tax gets large enough, tax revenue starts to fall.CHAPTER OUTLINE:I. The Deadweight Loss of TaxationA. Remember that it does not matter who a tax is levied on; buyers and sellers will likely share inthe burden of the tax.B. If there is a tax on a product, the price that a buyer pays will be greater than the price the sellerreceives. Thus, there is a tax wedge between the two prices and the quantity sold will be smaller if there was no tax.Figure 1C. How a Tax Affects Market Participants1. We can measure the effects of a tax on consumers by examining the change in consumersurplus. Similarly, we can measure the effects of the tax on producers by looking at the change in producer surplus.2. However, there is a third party that is affected by the tax —the government, which gets total tax revenue of T × Q. If the tax revenue is used to provide goods and services to the public,then the benefit from the tax revenue must not be ignored.3. Welfare without a Taxa. Consumer surplus is equal to: A + B + C.b. Producer surplus is equal to: D + E + F.c. Total surplus is equal to: A + B + C + D + E + F.4. Welfare with a TaxFigure 2 If you spent enough time covering consumer and producer surplus in Chapter7, students should have an easy time with this concept.Figure 3a. Consumer surplus is equal to: A.b. Producer surplus is equal to: F.c. Tax revenue is equal to: B + D.d. Total surplus is equal to: A + B + D + F.5. Changes in Welfarea. Consumer surplus changes by: –(B + C).b. Producer surplus changes by: –(D + E).c. Tax revenue changes by: +(B + D).d. Total surplus changes by: –(C + E).6. Definition of deadweight loss: the fall in total surplus that results from a marketdistortion, such as a tax.D. Deadweight Losses and the Gains from Trade1. Taxes cause deadweight losses because they prevent buyers and sellers from benefiting fromtrade.2. This occurs because the quantity of output declines; trades that would be beneficial to boththe buyer and seller will not take place because of the tax.3. The deadweight loss is equal to areas C and E (the drop in total surplus).4. Note that output levels between the equilibrium quantity without the tax and the quantitywith the tax will not be produced, yet the value of these units to consumers (represented by the demand curve) is larger than the cost of these units to producers (represented by thesupply curve).II. The Determinants of the Deadweight LossA. The price elasticities of supply and demand will determine the size of the deadweight loss that occurs from a tax.1. Given a stable demand curve, the deadweight loss is larger when supply is relatively elastic.2. Given a stable supply curve, the deadweight loss is larger when demand is relatively elastic.B. Case Study: The Deadweight Loss Debate1. Social Security tax and federal income tax are taxes on labor earnings. A labor tax places a tax wedge between the wage the firm pays and the wage that workers receive.2. There is considerable debate among economists concerning the size of the deadweight loss from this wage tax.Figure 53. The size of the deadweight loss depends on the elasticity of labor supply and demand, andthere is disagreement about the magnitude of the elasticity of supply.a. Economists who argue that labor taxes do not greatly distort market outcomes believethat labor supply is fairly inelastic.b. Economists who argue that labor taxes lead to large deadweight losses believe that laborsupply is more elastic.III. Deadweight Loss and Tax Revenue as Taxes VaryA. As taxes increase, the deadweight loss from the tax increases.B. In fact, as taxes increase, the deadweight loss rises more quickly than the size of the tax.1. The deadweight loss is the area of a triangle and the area of a triangle depends on the square of its size.2. If we double the size of a tax, the base and height of the triangle both double so the area of the triangle (the deadweight loss) rises by a factor of four.C. As the tax increases, the level of tax revenue will eventually fall.D. Case Study: The Laffer Curve and Supply-Side Economics1. The relationship between the size of a tax and the level of tax revenues is called a Laffercurve.2. Supply-side economists in the 1980s used the Laffer curve to support their belief that a dropin tax rates could lead to an increase in tax revenue for the government.3. Economists continue to debate Laffer’s argume nt.a. Many believe that the 1980s refuted Laffer’s theory.b. Others believe that the events of the 1980s tell a more favorable supply-side story.c. Some economists believe that, while an overall cut in taxes normally decreases revenue,some taxpayers may find themselves on the wrong side of the Laffer curve.E. In the News: The Tax Debate1. Recently, policymakers have debated the effects of increasing the tax rate, particularly onhigher-income taxpayers.ALTERNATIVE CLASSROOM EXAMPLE:Draw a graph showing the demand and supply of paper clips. (Draw each curve as a 45-degree line so that buyers and sellers will share any tax equally.) Mark theequilibrium price as $0.50 (per box) and the equilibrium quantity as 1,000 boxes. Show students the areas of producer and consumer surplus.Impose a $0.20 tax on each box. Assume that sellers are required to “pay” the tax to the government. Show students that:▪ the price buyers pay will rise to $0.60.▪ the price sellers receive will fall to $0.40.▪ the quantity of paper clips purchased will fall (assume to 800 units).▪ tax revenue would be equal to $160 ($0.20 800).Have students calculate the area of deadweight loss. (You may have to remindstudents how to calculate the area of a triangle.)2. These two opinion pieces from The Wall Street Journal present both sides of the issue.SOLUTIONS TO TEXT PROBLEMS:Quick Quizzes1. Figure 1 shows the supply and demand curves for cookies, with equilibrium quantity Q 1 andequilibrium price P 1. When the government imposes a tax on cookies, the price to buyers rises to P B , the price received by sellers declines to P S , and the equilibrium quantity falls to Q 2. The deadweight loss is the triangular area below the demand curve and above the supply curve between quantities Q 1 and Q 2. The deadweight loss shows the fall in total surplus that results from the tax.Figure 12. The deadweight loss of a tax is greater the greater is the elasticity of demand. Therefore, a tax on beer would have a larger deadweight loss than a tax on milk because the demand forbeer is more elastic than the demand for milk.B.Rank these taxes from smallest deadweight loss to largest deadweight loss.Lowest deadweight loss —tax on children, very inelastic Then —tax on food. Demand is inelastic; supply is elastic.Third —tax on vacation homes Demand is elastic; short-run supply is inelastic. Most deadweight loss —tax on jewelryDemand is elastic; supply is elastic.C. Is deadweight loss the only thing to consider when designing a tax system? No. This can generate a lively discussion. There are a variety of equity or fairnessconcerns. The taxes on children and on food would be regressive. Each of the taxeswould tax certain households at much higher rates than other households with similarincomes.3. If the government doubles the tax on gasoline, the revenue from the gasoline tax could riseor fall depending on whether the size of the tax is on the upward or downward slopingportion of the Laffer curve. However, if the government doubles the tax on gasoline, you canbe sure that the deadweight loss of the tax rises because deadweight loss always rises as thetax rate rises.Questions for Review1. When the sale of a good is taxed, both consumer surplus and producer surplus decline. Thedecline in consumer surplus and producer surplus exceeds the amount of governmentrevenue that is raised, so society's total surplus declines. The tax distorts the incentives ofboth buyers and sellers, so resources are allocated inefficiently.2. Figure 2 illustrates the deadweight loss and tax revenue from a tax on the sale of a good.Without a tax, the equilibrium quantity would be Q1, the equilibrium price would be P1,consumer surplus would be A + B + C, and producer surplus would be D + E + F. Theimposition of a tax places a wedge between the price buyers pay, P B, and the price sellersreceive, P S, where P B = P S + tax. The quantity sold declines to Q2. Now consumer surplus isA, producer surplus is F, and government revenue is B + D. The deadweight loss of the tax isC+E, because that area is lost due to the decline in quantity from Q1 to Q2.Figure 23. The greater the elasticities of demand and supply, the greater the deadweight loss of a tax.Because elasticity measures the responsiveness of buyers and sellers to a change in price,higher elasticity means the tax induces a greater reduction in quantity, and therefore, agreater distortion to the market.4. Experts disagree about whether labor taxes have small or large deadweight losses becausethey have different views about the elasticity of labor supply. Some believe that labor supplyis inelastic, so a tax on labor has a small deadweight loss. But others think that workers canadjust their hours worked in various ways, so labor supply is elastic, and thus a tax on laborhas a large deadweight loss.5. The deadweight loss of a tax rises more than proportionally as the tax rises. Tax revenue,however, may increase initially as a tax rises, but as the tax rises further, revenue eventuallydeclines.Quick Check Multiple Choice1. a2. b3. c4. a5. b6. aProblems and Applications1. a. Figure 3 illustrates the market for pizza. The equilibrium price is P1, the equilibriumquantity is Q1, consumer surplus is area A + B + C, and producer surplus is area D + E +F. There is no deadweight loss, as all the potential gains from trade are realized; totalsurplus is the entire area between the demand and supply curves: A + B + C + D + E +F.Figure 3b. With a $1 tax on each pizza sold, the price paid by buyers, P B, is now higher than theprice received by sellers, P S, where P B = P S + $1. The quantity declines to Q2, consumersurplus is area A, producer surplus is area F, government revenue is area B + D, anddeadweight loss is area C + E. Consumer surplus declines by B + C, producer surplusdeclines by D + E, government revenue increases by B + D, and deadweight lossincreases by C + E.c. If the tax were removed and consumers and producers voluntarily transferred B + D tothe government to make up for the lost tax revenue, then everyone would be better offthan without the tax. The equilibrium quantity would be Q1, as in the case without thetax, and the equilibrium price would be P1. Consumer surplus would be A + C, becauseconsumers get surplus of A + B + C, then voluntarily transfer B to the government.Producer surplus would be E + F, because producers get surplus of D + E + F, thenvoluntarily transfer D to the government. Both consumers and producers are better offthan the case when the tax was imposed. If consumers and producers gave a little bitmore than B + D to the government, then all three parties, including the government,would be better off. This illustrates the inefficiency of taxation.2. a. The statement, "A tax that has no deadweight loss cannot raise any revenue for thegovernment," is incorrect. An example is the case of a tax when either supply or demand is perfectly inelastic. The tax has neither an effect on quantity nor any deadweight loss, but it does raise revenue.b. The statement, "A tax that raises no revenue for the government cannot have anydeadweight loss," is incorrect. An example is the case of a 100% tax imposed on sellers.With a 100% tax on their sales of the good, sellers will not supply any of the good, sothe tax will raise no revenue. Yet the tax has a large deadweight loss, because it reduces the quantity sold to zero.3. a. With very elastic supply and very inelastic demand, the burden of the tax on rubberbands will be borne largely by buyers. As Figure 4 shows, consumer surplus declinesconsiderably, by area A + B, but producer surplus decreases only by area C+D..Figure 4 Figure 5b.With very inelastic supply and very elastic demand, the burden of the tax onrubber bands will be borne largely by sellers. As Figure 5 shows, consumersurplus does not decline much, just by area A + B, while producer surplus fallssubstantially, by area C + D. Compared to part (a), producers bear much more of the burden of the tax, and consumers bear much less.4. a. The deadweight loss from a tax on heating oil is likely to be greater in the fifth year afterit is imposed rather than the first year. In the first year, the demand for heating oil isrelatively inelastic, as people who own oil heaters are not likely to get rid of them rightaway. But over time they may switch to other energy sources and people buying newheaters for their homes will more likely choose gas or electric, so the tax will have agreater impact on quantity. Thus, the deadweight loss of the tax will get larger over time.b. The tax revenue is likely to be higher in the first year after it is imposed than in the fifthyear. In the first year, demand is more inelastic, so the quantity does not decline asmuch and tax revenue is relatively high. As time passes and more people substitute away from oil, the quantity sold declines, as does tax revenue.5. Because the demand for food is inelastic, a tax on food is a good way to raise revenuebecause it leads to a small deadweight loss; thus taxing food is less inefficient than taxing other things. But it is not a good way to raise revenue from an equity point of view, because poorer people spend a higher proportion of their income on food. The tax would affect them more than it would affect wealthier people.6. a. This tax has such a high rate that it is not likely to raise much revenue. Because of thehigh tax rate, the equilibrium quantity in the market is likely to be at or near zero.b. Senator Moynihan's goal was probably to ban the use of hollow-tipped bullets. In thiscase, the tax could be as effective as an outright ban.7. a. Figure 6 illustrates the market for socks and the effects of the tax. Without a tax, theequilibrium quantity would be Q1, the equilibrium price would be P1, total spending byconsumers equals total revenue for producers, which is P1 x Q1, which equals area B + C + D + E + F, and government revenue is zero. The imposition of a tax places a wedgebetween the price buyers pay, P B, and the price sellers receive, P S, where P B = P S + tax.The quantity sold declines to Q2. Now total spending by consumers is P B x Q2, whichequals area A + B + C + D, total revenue for producers is P S x Q2, which is area C + D,and government tax revenue is Q2 x tax, which is area A + B.b. Unless supply is perfectly elastic or demand is perfectly inelastic, the price received byproducers falls because of the tax. Total receipts for producers fall, because producerslose revenue equal to area B + E + F.Figure 6c. The price paid by consumers rises, unless demand is perfectly elastic or supply isperfectly inelastic. Whether total spending by consumers rises or falls depends on theprice elasticity of demand. If demand is elastic, the percentage decline in quantityexceeds the percentage increase in price, so total spending declines. If demand isinelastic, the percentage decline in quantity is less than the percentage increase in price,so total spending rises. Whether total consumer spending falls or rises, consumer surplusdeclines because of the increase in price and reduction in quantity.8. Figure 7 illustrates the effects of the $2 subsidy on a good. Without the subsidy, theequilibrium price is P1 and the equilibrium quantity is Q1. With the subsidy, buyers pay priceP B, producers receive price P S (where P S = P B + $2), and the quantity sold is Q2. Thefollowing table illustrates the effect of the subsidy on consumer surplus, producer surplus,government revenue, and total surplus. Because total surplus declines by area D + H, thesubsidy leads to a deadweight loss in that amount.BeforeSubsidyAfter Subsidy ChangeConsumerSurplus A + B A + B + E + F + G +(E + F + G)ProducerSurplus E + I B + C + E + I +(B + C)Government Revenue 0 –(B + C + D + E + F + G +H)–(B + C + D + E + F + G +H)Total Surplus A + B + E + I A + B – D + E – H + I –(D + H)Figure 79. a. Figure 8 shows the effect of a $10 tax on hotel rooms. The tax revenue is represented byareas A + B, which are equal to ($10)(900) = $9,000. The deadweight loss from the tax is represented by areas C + D, which are equal to (0.5)($10)(100) = $500.Figure 8 Figure 9b. Figure 9 shows the effect of a $20 tax on hotel rooms. The tax revenue is represented byareas A + B, which are equal to ($20)(800) = $16,000. The deadweight loss from the tax is represented by areas C + D, which are equal to (0.5)($20)(200) = $2,000.When the tax is doubled, the tax revenue rises by less than double, while thedeadweight loss rises by more than double. The higher tax creates a greaterdistortion to the market.10. a. Setting quantity supplied equal to quantity demanded gives 2P = 300 –P. Adding P toboth sides of the equation gives 3P = 300. Dividing both sides by 3 gives P = 100.Substituting P = 100 back into either equation for quantity demanded or supplied gives Q = 200.b. Now P is the price received by sellers and P +T is the price paid by buyers. Equatingquantity demanded to quantity supplied gives 2P = 300 − (P+T). Adding P to both sides of the equation gives 3P = 300 –T. Dividing both sides by 3 gives P = 100 –T/3. This is the price received by sellers. The buyers pay a price equal to the price received by sellers plus the tax (P +T = 100 + 2T/3). The quantity sold is now Q = 2P = 200 – 2T/3.c. Because tax revenue is equal to T x Q and Q = 200 – 2T/3, tax revenue equals 200T−2T2/3. Figure 10 (on the next page) shows a graph of this relationship. Tax revenue iszero at T = 0 and at T = 300.Figure 10 Figure 11d. As Figure 11 shows, the area of the triangle (laid on its side) that represents thedeadweight loss is 1/2 × base × height, where the base is the change in the price, which is the size of the tax (T) and the height is the amount of the decline in quantity (2T/3).So the deadweight loss equals 1/2 ×T × 2T/3 = T2/3. This rises exponentially from 0 (when T = 0) to 30,000 when T = 300, as shown in Figure 12.Figure 12e. A tax of $200 per unit is a bad policy, because tax revenue is declining at that tax level.The government could reduce the tax to $150 per unit, get more tax revenue ($15,000 when the tax is $150 versus $13,333 when the tax is $200), and reduce the deadweight loss (7,500 when the tax is $150 compared to 13,333 when the tax is $200).。
曼昆经济学原理第六版英文答案【篇一:曼昆《经济学原理(微观经济学分册)》第6版课后习题详解(1~2章)】class=txt>课后习题详解第一篇导言第1章经济学十大原理一、概念题1. 稀缺性稀缺性是指在给定的时间内,相对于人的需求而言,经济资源的供给总是不足的,也就是资源的有限性与人类的欲望无限性之间的矛盾。
2. 经济学经济学是研究如何将稀缺的资源有效地配置给相互竞争的用途,以使人类的欲望得到最大限度满足的科学。
其中微观经济学是以单个经济主体为研究对象,研究单个经济主体面对既定资源约束时如何进行选择的科学;宏观经济学则以整个国民经济为研究对象,主要着眼于经济总量的研究。
3. 效率效率是指人们在实践活动中的产出与投入比值或者是效益与成本比值,比值大效率高,比值小效率低。
它与产出或收益大小成正比,与投入或成本成反比。
4. 平等平等是指人与人的利益关系及利益关系的原则、制度、做法、行为等都合乎社会发展的需要,即经济成果在社会成员中公平分配的特性。
它是一个历史范畴,按其所产生的社会历史条件和社会性质的不同而不同,不存在永恒的公平;它也是一个客观范畴,尽管在不同的社会形态中内涵不同对其的理解不同,但都是社会存在的反映,具有客观性。
5. 机会成本机会成本是指将一种资源用于某种用途,而未用于其他用途所放弃的最大预期收益。
其存在的前提条件是:①资源是稀缺的;②资源具有多种用途;③资源的投向不受限制。
6. 理性人理性人是指系统而有目的地尽最大努力去实现其目标的人,是经济研究中所假设的、在一定条件下具有典型理性行为的经济活动主体。
7. 边际变动边际变动是指对行动计划的微小增量调整。
8. 激励激励是指引起一个人做出某种行为的某种东西。
9. 市场经济市场经济是指由家庭和企业在市场上的相互交易决定资源配置的经济,而资源配置实际上就是决定社会生产什么、生产多少、如何生产以及为谁生产的过程。
10. 产权产权是指个人拥有并控制稀缺资源的能力,也可以理解为人们对其所交易东西的所有权,即人们在交易活动中使自己或他人在经济利益上受益或受损的权力。
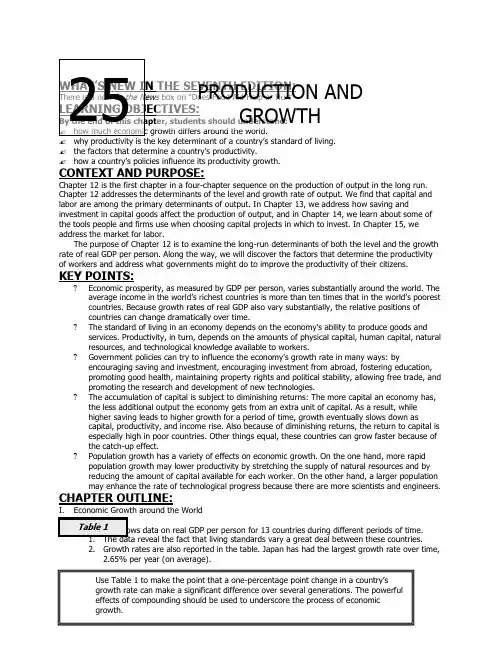
✍ the factors that determine a country’s productivity.✍ how a country’s policies influence its productivity growth. CONTEXT AND PURPOSE:Chapter 12 is the first chapter in a four-chapter sequence on the production of output in the long run. Chapter 12 addresses the determinants of the level and growth rate of output. We find that capital and labor are among the primary determinants of output. In Chapter 13, we address how saving andinvestment in capital goods affect the production of output, and in Chapter 14, we learn about some of the tools people and firms use when choosing capital projects in which to invest. In Chapter 15, we address the market for labor.The purpose of Chapter 12 is to examine the long-run determinants of both the level and the growth rate of real GDP per person. Along the way, we will discover the factors that determine the productivity of workers and address what governments might do to improve the productivity of their citizens. KEY POINTS:?Economic prosperity, as measured by GDP per person, varies substantially around the world. The average income in the world’s richest countries is more than ten times that in the world’s poorest countries. Because growth rates of real GDP also vary substantially, the relative positions of countries can change dramatically over time. ?The standard of living in an economy depends on the economy’s ability to produce goods and services. Productivity, in turn, depends on the amounts of physical capital, human capital, natural resources, and technological knowledge available to workers. ?Government policies can try to influence the economy’s growth rate in many ways: by encouraging saving and investment, encouraging investment from abroad, fostering education, promoting good health, maintaining property rights and political stability, allowing free trade, and promoting the research and development of new technologies. ?The accumulation of capital is subject to diminishing returns: The more capital an economy has, the less additional output the economy gets from an extra unit of capital. As a result, while higher saving leads to higher growth for a period of time, growth eventually slows down as capital, productivity, and income rise. Also because of diminishing returns, the return to capital is especially high in poor countries. Other things equal, these countries can grow faster because of the catch-up effect. ?Population growth has a variety of effects on economic growth. On the one hand, more rapid population growth may lower productivity by stretching the supply of natural resources and by reducing the amount of capital available for each worker. On the other hand, a larger population may enhance the rate of technological progress because there are more scientists and engineers. CHAPTER OUTLINE: I. Economic Growth around the World 2. Growth rates are also reported in the table. Japan has had the largest growth rate over time,2.65% per year (on average).Use Table 1 to make the point that a one-percentage point change in a country’s growth rate can make a significant difference over several generations. The powerfuleffects of compounding should be used to underscore the process of economicgrowth.3. Because of different growth rates, the ranking of countries by income per person changesover time.a. In the late 19th century, the United Kingdom was the richest country in the world.b. Today, income per person is lower in the United Kingdom than in the United States (aformer colony of the United Kingdom).B. FYI: Are You Richer Than the Richest American1. According to the magazine American Heritage, the richest American of all time is John B.Rockefeller, whose wealth today would be the equivalent of approximately $200 billion.2. Yet, because Rockefeller lived from 1839 to 1937, he did not get the chance to enjoy manyof the conveniences we take for granted today such as television, air conditioning, andmodern medicine.3. Thus, because of technological advances, the average American today may enjoy a “richer”life than the richest American who lived a century ago.C. FYI: A Picture Is Worth a Thousand Statistics1. This box presents three photos showing a typical family in three countries – the UnitedKingdom, Mexico, and Mali. Each family was photographed outside their home, together withall of their material possessions.2. These photos demonstrate the vast difference in the standards of living in these countries. II. Productivity: Its Role and DeterminantsA. Why Productivity Is So Important1. Example: Robinson Crusoea. Because he is stranded alone, he must catch his own fish, grow his own vegetables, andmake his own clothes.b. His standard of living depends on his ability to produce goods and services.2. Definition of productivity: the quantity of goods and services produced from eachunit of labor input.3. Review of Principle #8: A Country’s Standard of Living Depends on Its Ability to ProduceGoods and Services.B. How Productivity Is Determined1. Physical Capital per Workera. Definition of physical capital: the stock of equipment and structures used toproduce goods and services.b. Example: Crusoe will catch more fish if he has more fishing poles.2. Human Capital per Workera. Definition of human capital: the knowledge and skills that workers acquirethrough education, training, and experience.b. Example: Crusoe will catch more fish if he has been trained in the best fishing techniquesor as he gains experience fishing.3. Natural Resources per Workera. Definition of natural resources: the inputs into production that are provided bynature, such as land, rivers, and mineral deposits.b. Example: Crusoe will have better luck catching fish if there is a plentiful supply aroundhis island.4. Technological Knowledgea. Definition of technological knowledge: society’s understanding of the best waysto produce goods and services.b. Example: Crusoe will catch more fish if he has invented a better fishing lure.C. FYI: The Production Function1. A production function describes the relationship between the quantity of inputs used inproduction and the quantity of output from production.2. The production function generally is written like this:where Y = output, L = quantity of labor, K = quantity of physical capital, H = quantity of human capital, N = quantity of natural resources, A reflects the available productiontechnology, and F () is a function that shows how inputs are combined to produce output. 3. Many production functions have a property called constant returns to scale.a. This property implies that as all inputs are doubled, output will exactly double.b. This implies that the following must be true: where x = 2 if inputs are doubled.c. This also means that if we want to examine output per worker we could set x = 1/L and we would get the following:This shows that output per worker depends on the amount of physical capital per worker (K /L ), the amount of human capital per worker (H /L ), and the amount of naturalresources per worker (N /L ).4. Case Study: Are Natural Resources a Limit to Growth a. This section points out that as the population has grown over time, we have discoveredways to lower our use of natural resources. Thus, most economists are not worried about shortages of natural resources.1. Because capital is a produced factor of production, a society can change the amount ofcapital that it has. 2. However, there is an opportunity cost of doing so; if resources are used to produce capital goods, fewer goods and services are produced for current consumption.B. Diminishing Returns and the Catch-Up Effect 1. Definition of diminishing returns: the property whereby the benefit from an extraunit of an input declines as the quantity of the input increases .b. This can be seen in Figure 1, which shows how the amount of capital per workerdetermines the amount of output per worker, holding constant all other determinants of output.c. Thus, if workers already have a large amount of capital to work with, giving them an additional unit of capital will not increase their productivity by much.d. In the long run, a higher saving rate leads to a higher level of productivity and income,but not to higher growth rates in these variables. 2. An important implication of diminishing returns is the catch-up effect.a. Definition of catch-up effect: the property whereby countries that start off poor tend to grow more rapidly than countries that start off rich .b. When workers have very little capital to begin with, an additional unit of capital will increase their productivity by a great deal.C. Investment from Abroad1. Saving by domestic residents is not the only way for a country to invest in new capital.2. Investment in the country by foreigners can also occur.a. Foreign direct investment occurs when a capital investment is owned and operated by a foreign entity.b. Foreign portfolio investment occurs when a capital investment is financed with foreignmoney but operated by domestic residents.3. Some of the benefits of foreign investment flow back to foreign owners. But the economy stillexperiences an increase in the capital stock, which leads to higher productivity and higherwages.4. The World Bank is an organization that tries to encourage the flow of investment to poorcountries.a. The World Bank obtains funds from developed countries such as the United States andmakes loans to less-developed countries so that they can invest in roads, sewer systems,schools, and other types of capital.b. The World Bank also offers these countries advice on how best to use these funds.D. Education1. Investment in human capital also has an opportunity cost.a. When students are in class, they cannot be producing goods and services forconsumption.b. In less-developed countries, this opportunity cost is considered to be high; as a result,children often drop out of school at a young age.2. Because there are positive externalities in education, the effect of lower education on theeconomic growth rate of a country can be large.3. Many poor countries also face a “brain drain”—the best educated often leave to go to othercountries where they can enjoy a higher standard of living.E. Health and Nutrition1. Human capital can also be used to describe another type of investment in people:expenditures that lead to a healthier population.2. Other things being equal, healthier workers are more productive.3. Making the right investments in the health of the population is one way for a nation toincrease productivity.F. Property Rights and Political Stability1. Protection of property rights and promotion of political stability are two other important waysthat policymakers can improve economic growth.2. There is little incentive to produce products if there is no guarantee that they cannot betaken. Contracts must also be enforced.3. Countries with questionable enforcement of property rights or an unstable political climatewill also have difficulty in attracting foreign (or even domestic) investment.4. In the News: Does Food Aid Help or Hurta. Economic policies designed to improve productivity sometimes have adverse unintendedeffects.b. This article from The Wall Street Journal, Real Time Economics blog discusses economicresearch on the effects of food aid to poor countries on armed conflict in a recipientcountry.G. Free Trade1. Some countries have tried to achieve faster economic growth by avoiding transacting withthe rest of the world.2. However, trade allows a country to specialize in what it does best and thus consume beyondits production possibilities.3. When a country trades wheat for steel, it is as well off as it would be if it had developed anew technology for turning wheat into steel.4. The amount a nation trades is determined not only by government policy but also bygeography.a. Countries with good, natural seaports find trade easier than countries without thisresource.b. Countries with more than 80 percent of their population living within 100 kilometers of acoast have an average GDP per person that is four times as large as countries with lessthan 20 percent of their population living near a coast.H. Research and Development1. The primary reason why living standards have improved over time has been due to largeincreases in technological knowledge.2. Knowledge can be considered a public good.3. The U.S. government promotes the creation of new technological information by providingresearch grants and providing tax incentives for firms engaged in research.4. The patent system also encourages research by granting an inventor the exclusive right toproduce the product for a specified number of years.I. Population Growth1. Stretching Natural Resourcesa. Thomas Malthus (an English minister and early economic thinker) argued that an ever-increasing population meant that the world was doomed to live in poverty forever.b. However, he failed to understand that new ideas would be developed to increase theproduction of food and other goods, including pesticides, fertilizers, mechanizedequipment, and new crop varieties.2. Diluting the Capital Stocka. High population growth reduces GDP per worker because rapid growth in the number ofworkers forces the capital stock to be spread more thinly.b. Countries with a high population growth have large numbers of school-age children,placing a burden on the education system.3. Some countries have already instituted measures to reduce population growth rates.4. Policies that foster equal treatment for women should raise economic opportunities forwomen leading to lower rates of population.5. Promoting Technological Progressa. Some economists have suggested that population growth has driven technologicalprogress and economic prosperity.b. In a 1993 journal article, economist Michael Kremer provided evidence that increases inSOLUTIONS TO TEXT PROBLEMS:Quick Quizzes1. The approximate growth rate of real GDP per person in the United States is 1.77 percent(based on Table 1) from 1870 to 2010. Countries that have had faster growth include Japan,Brazil, Mexico, China, Germany, and Canada; countries that have had slower growth includeArgentina, India, United Kingdom, Indonesia, Pakistan, and Bangladesh.2. The four determinants of a country’s productivity are: (1) physical capital, which is the stockof equipment and structures that are used to produce goods and services; (2) human capital,which is the knowledge and skills that workers acquire through education, training, andexperience; (3) natural resources, which are inputs into production that are provided bynature, such as land, rivers, and mineral deposits; and (4) technological knowledge, which issociety’s understanding of the best ways to produce goods and services.3. Ways in which a government policymaker can try to raise the growth in living standards in asociety include: (1) investing more current resources in the production of capital, which hasthe drawback of reducing the resources used for producing current consumption; (2)encouraging investment from abroad, which has the drawback that some of the benefits ofinvestment flow to foreigners; (3) increasing education, which has an opportunity cost in thatstudents are not engaged in current production; (4) protecting property rights and promotingpolitical stability, which has the drawback of enforcement costs; (5) pursuing outward-oriented policies to encourage free trade, which may have the drawback of making a countrymore dependent on its trading partners; (6) reducing the rate of population growth, whichmay have the drawbacks of reducing individual freedom and lowering the rate oftechnological progress; and (7) encouraging research and development, which (likeinvestment) may have the drawback of reducing current consumption.Questions for Review1. The level of a nation’s GDP measures both the total income earned in the economy and thetotal expenditure on the economy’s output of goods and services. The level of real GDP is agood gauge of economic prosperity, and the growth rate of real GDP is a good gauge ofeconomic progress. You would rather live in a nation with a high level of GDP, even though ithad a low growth rate, than in a nation with a low level of GDP and a high growth rate,because the level of GDP is a measure of prosperity.2. The four determinants of productivity are: (1) physical capital, which is the stock ofequipment and structures that are used to produce goods and services; (2) human capital,which consists of the knowledge and skills that workers acquire through education, training,and experience; (3) natural resources, which are inputs into production that are provided bynature; and (4) technological knowledge, which is society’s understanding of the best waysto produce goods and services.3. A college degree is a form of human capital. The skills learned in earning a college degreeincrease a worker's productivity.4. Higher saving means fewer resources are devoted to consumption and more to producingcapital goods. The rise in the capital stock leads to rising productivity and more rapid growthin GDP for a while. In the long run, the higher saving rate leads to a higher standard of living.A policymaker might be deterred from trying to raise the rate of saving because doing sorequires that people reduce their consumption today and it can take a long time to get to ahigher standard of living.5. A higher rate of saving leads to a higher growth rate temporarily, not permanently. In theshort run, increased saving leads to a larger capital stock and faster growth. But as growthcontinues, diminishing returns to capital mean growth slows down and eventually settlesdown to its initial rate, though this may take several decades.6. Removing a trade restriction, such as a tariff, would lead to more rapid economic growthbecause the removal of the trade restriction acts like an improvement in technology. Freetrade allows all countries to consume more goods and services.7. The higher the rate of population growth, the lower is the level of GDP per person becausethere's less capital per person, hence lower productivity.8. The U.S. government tries to encourage advances in technological knowledge by providingresearch grants through the National Science Foundation and the National Institute of Health,with tax breaks for firms engaging in research and development, and through the patentsystem.Quick Check Multiple Choice1. b2. c3. d4. c5. c6. aProblems and Applications1. The facts that countries import many goods and services yet must produce a large quantityof goods and services themselves to enjoy a high standard of living are reconciled by notingthat there are substantial gains from trade. To be able to afford to purchase goods fromother countries, an economy must generate income. By producing many goods and services,then trading them for goods and services produced in other countries, a nation maximizes itsstandard of living.2. a. More investment would lead to faster economic growth in the short run.b. The change would benefit many people in society who would have higher incomes as theresult of faster economic growth. However, there might be a transition period in whichworkers and owners in consumption-good industries would get lower incomes, andworkers and owners in investment-good industries would get higher incomes. In addition, some group would have to reduce their spending for some time so that investment could rise.3. a. Private consumption spending includes buying food and buying clothes; privateinvestment spending includes people buying houses and firms buying computers. Manyother examples are possible. Education can be considered as both consumption andinvestment.b. Government consumption spending includes paying workers to administer governmentprograms; government investment spending includes buying military equipment andbuilding roads. Many other examples are possible.4. The opportunity cost of investing in capital is the loss of consumption that results fromredirecting resources toward investment. Over-investment in capital is possible because of diminishing marginal returns. A country can "over-invest" in capital if people would prefer to have higher consumption spending and less future growth. The opportunity cost of investing in human capital is also the loss of consumption that is needed to provide the resources for investment. A country could "over-invest" in human capital if people were too highlyeducated for the jobs they could get for example, if the best job a Ph.D. in philosophy could find is managing a restaurant.5. a. The United States benefited from the Chinese and Japanese investment because it madeour capital stock larger, increasing our economic growth.b. It would have been better for Americans to make the investments because then theywould have received all of the returns on the investments, instead of the returns going to China and Japan.6. Greater educational opportunities for women could lead to faster economic growth in thesedeveloping countries because increased human capital would increase productivity and there would be external effects from greater knowledge in the country. Second, increasededucational opportunities for young women may lower the population growth rate because such opportunities raise the opportunity cost of having a child.7. a. Individuals with higher incomes have better access to clean water, medical care, andgood nutrition.b. Healthier individuals are likely to be more productive.c. Understanding the direction of causation will help policymakers place proper emphasis onthe programs that will achieve both greater health and higher incomes.8. Peace would promote economic growth because it is an indication that property rights will berespected in the future. Armed conflict and the threat of a revolutionary government reduce domestic residents' incentive to save, invest, and start new businesses. Moreover, foreigners have less incentive to invest in the country.Easy taxes would promote economic growth because they result in citizens and businesses retaining a greater share of the income they earn and, thus, being able to save and invest a greater portion of that income.A tolerable administration of justice would promote economic growth because it wouldensure the maintenance of property rights, which encourages domestic saving andinvestment from abroad.。
高三经济学原理英语阅读理解20题1. What is the main function of central banks in an economy?A. To print money.B. To control interest rates.C. To lend money to businesses.D. To manage foreign exchange reserves.答案:B。
中央银行为了调节经济,主要的职能之一是控制利率。
A 选项印刷货币不是其主要功能。
C 选项向企业贷款通常不是其主要任务。
D 选项管理外汇储备不是最主要功能。
涉及的经济学原理是货币政策中中央银行通过利率调节经济。
英语阅读技巧:注意题干中的main function,要从选项中选出最符合的主要功能。
2. In macroeconomics, what does GDP stand for?A. Gross Domestic Product.B. Gross Domestic Price.C. General Domestic Product.D. General Domestic Price.答案:A。
GDP 是Gross Domestic Product 的缩写,即国内生产总值。
B、D 选项中的Price 错误。
C 选项General 错误。
涉及的经济学原理是宏观经济指标之一的GDP。
英语阅读技巧:对于常见的经济学缩写要熟悉。
3. Which of the following is a tool of fiscal policy?A. Changing interest rates.B. Increasing money supply.C. Government spending.D. Open market operations.答案:C。
财政政策的工具主要有政府支出和税收等。
A 选项改变利率是货币政策工具。
曼昆经济学原理答案英文版一、选择题1、在经济学中,什么是GDP?A.国内生产总值B.国民生产总值C.国内总收入D.国民总收入答案:A.国内生产总值(Gross Domestic Product,GDP)是指一个国家在一定时期内所有常住单位的生产活动的最终成果。
2、GDP的计算方法是什么?A.收入法B.支出法C.生产法D.混合法答案:B.支出法。
GDP可以通过对一国所有常住单位的商品和服务的最终消费支出、资本形成总额和货物与服务净出口进行计算,这种计算方法被称为支出法。
3、在经济学中,什么是通货膨胀?A.货币贬值B.物价上涨C.货币供应增加D.以上都不是答案:A.通货膨胀是指商品和服务的总体价格水平上升,导致货币购买力下降。
4、什么是货币政策?A.政府调节货币供应量的政策B.政府调节利率的政策C.政府调节汇率的政策D.以上都不是答案:A.货币政策是指中央银行通过控制货币供应量来调节利率和影响经济活动的政策。
二、简答题1、请简述GDP的概念及作用。
答案:GDP是指一个国家在一定时期内所有常住单位的生产活动的最终成果。
GDP是国民经济核算的核心指标,也是衡量一个国家经济状况和发展水平的重要指标。
它反映了整个国家经济运行的有效性,以及国民收入分配的公平性。
2、请简述通货膨胀的原因及影响。
答案:通货膨胀的原因有多种,包括货币供应量增加、需求拉动、成本推动等。
其中,货币供应量增加是最主要的原因。
当货币供应量增加时,物价上涨,导致货币购买力下降。
通货膨胀会对经济产生负面影响,包括降低消费者购买力、增加企业成本、扭曲价格信号等。
通货膨胀还会导致社会不稳定和政治风险。
曼昆的经济学原理课件是经济学教育中的重要资源,它以深入浅出的方式解释了经济学的基本原理和概念。
本文将对这些原理进行概述,并解释它们在现实生活中的应用。
曼昆的经济学原理主要包括微观经济学和宏观经济学两个部分。
微观经济学主要研究个体经济单位的行为和决策,如消费者、企业和政府。
CH5~6作業解答CH51. a. Mystery novels have more elastic demand than required textbooks becausemystery novels have close substitutes and are a luxury good, while required textbooks area necessity with no close substitutes. If the price of mystery novels were to rise, readerscould substitute other types of novels, or buy fewer novels altogether. But if the price ofrequired textbooks were to rise, students would have little choice but to pay the higherprice. Thus, the quantity demanded of required textbooks is less responsive to price thanthe quantity demanded of mystery novels.b. Beethoven recordings have more elastic demand than classical music recordings ingeneral. Beethoven recordings are a narrower market than classical music recordings,so it is easier to find close substitutes for them. If the price of Beethoven recordingswere to rise, people could substitute other classical recordings, like Mozart. But if theprice of all classical recordings were to rise, substitution would be more difficult. (Atransition from classical music to rap is unlikely!) Thus, the quantity demanded ofclassical recordings is less responsive to price than the quantity demanded ofBeethoven recordings.c. Subway rides during the next five years have more elastic demand than subway ridesduring the next six months. Goods have a more elastic demand over longer timehorizons. If the fare for a subway ride was to rise temporarily, consumers could notswitch to other forms of transportation without great expense or great inconvenience.But if the fare for a subway ride was to remain high for a long time, people wouldgradually switch to alternative forms of transportation. As a result, the quantitydemanded of subway rides during the next six months will be less responsive tochanges in the price than the quantity demanded of subway rides during the next fiveyears.d. Root beer has more elastic demand than water. Root beer is a luxury withclose substitutes, while water is a necessity with no close substitutes. If theprice of water were to rise, consumers have little choice but to pay the higherprice. But if the price of root beer were to rise, consumers could easily switch toother sodas or beverages. So the quantity demanded of root beer is moreresponsive to changes in price than the quantity demanded of water.2. a. For business travelers, the price elasticity of demand when the price of tickets risesfrom $200 to $250 is [(2,000 – 1,900)/1,950]/[(250 – 200)/225] = 0.05/0.22 = 0.23. Forvacationers, the price elasticity of demand when the price of tickets rises from $200 to $250 is [(800 – 600)/700] / [(250 – 200)/225] = 0.29/0.22 = 1.32.b. The price elasticity of demand for vacationers is higher than the elasticity forbusiness travelers because vacationers can choose a substitute more easily thanbusiness travelers. For example, vacationers can choose a different mode oftransportation (like driving or taking the train), a different destination, a differentdeparture date, and a different return date. They may also choose to not travel at all.Business travelers are less likely to do so because their schedules are less adaptable.3. a. The percentage change in price is equal to (2.20 – 1.80)/2.00 x 100 = 20%. If theprice elasticity of demand is 0.2, quantity demanded will fall by 4% in the short run[0.20 ⨯ 0.20]. If the price elasticity of demand is 0.7, quantity demanded will fall by 14%in the long run [0.7 ⨯ 0.2].b. Over time, consumers can make adjustments to their homes by purchasingalternative heat sources such as natural gas or electric furnaces. Thus, they canrespond more easily to the change in the price of heating oil in the long run than inthe short run.4. If quantity demanded fell, price must have increased according to the law of demand. Fora price increase to increase total revenue, the percentage increase in the price must begreater than the percentage decline in quantity demanded. Therefore, demand isinelastic.6. a. If your income is $10,000, your price elasticity of demand as the price of DVDsrises from $8 to $10 is [(40 – 32)/36]/[(10 – 8)/9] =0.22/0.22 = 1. If yourincome is $12,000, the elasticity is [(50 – 45)/47.5]/[(10 – 8)/9] = 0.11/0.22 =0.5.b. If the price is $12, your income elasticity of demand as your income increasesfrom $10,000 to $12,000 is [(30 – 24)/27]/[(12,000 – 10,000)/11,000] =0.22/0.18 = 1.22. If the price is $16, your income elasticity of demand as yourincome increases from $10,000 to $12,000 is [(12 – 8)/10]/[(12,000 –10,000)/11,000] = 0.40/0.18 = 2.22.8. a. The percentage change in price (using the midpoint formula) is (1.50 –1.25)/(1.375) × 100% = 18.18%. Therefore, the price elasticity of demand is4.3/18.18 = 0.24, which is very elastic.b. Because the demand is inelastic, the Transit Authority's revenue rises whenthe fare rises.c. The elasticity estimate might be unreliable because it is only the first monthafter the fare increase. As time goes by, people may switch to other means oftransportation in response to the price increase. So the elasticity may be largerin the long run than it is in the short run.10. a. With a price elasticity of demand of 0.4, reducing the quantity demanded ofcigarettes by 20% requires a 50% increase in price, because 20/50 = 0.4. Withthe price of cigarettes currently $2, this would require an increase in the priceto $3.33 a pack using the midpoint method (note that ($3.33 – $2)/$2.67= .50).b. The policy will have a larger effect five years from now than it does one yearfrom now. The elasticity is larger in the long run, because it may take sometime for people to reduce their cigarette usage. The habit of smoking is hard tobreak in the short run.c. Because teenagers do not have as much income as adults, they are likely tohave a higher price elasticity of demand. Also, adults are more likely to beaddicted to cigarettes, making it more difficult to reduce their quantitydemanded in response to a higher price.CH62. a. The imposition of a binding price floor in the cheese market is shown in Figure 4. In theabsence of the price floor, the price would be P1 and the quantity would be Q1. With the floor set at P f, which is greater than P1, the quantity demanded is Q2, while quantitysupplied is Q3, so there is a surplus of cheese in the amount Q3– Q2.Figure 4b. The producers’ complaint that their total revenue has declined is correct if demand iselastic. With elastic demand, the percentage decline in quantity would exceed thepercentage rise in price, so total revenue would decline.c. If the government purchases all the surplus cheese at the price floor, producers benefit and taxpayers lose. Producers would produce quantity Q3 of cheese, and their total revenue would increase substantially. However, consumers would buy only quantity Q2 of cheese, so they are in the same position as before. Taxpayers lose because they would be financing the purchase of the surplus cheese through higher taxes.3. a. The equilibrium price of Frisbees is $8 and the equilibrium quantity is six millionFrisbees.b. With a price floor of $10, the new market price is $10 because the price floor is binding.At that price, only two million Frisbees are sold, because that is the quantitydemanded.c. If there’s a price ceiling of $9, it has no effect, because the market equilibrium price is$8, which is below the ceiling. So the market price is $8 and the quantity sold is sixmillion Frisbees.6. The price will rise by less than $500. The burden of any tax is shared by both producers andconsumers−the price paid by consumers rises and the price received by producers falls, with the difference between the two equal to the amount of the tax. The only exceptions would be if the supply curve were perfectly elastic or the demand curve were perfectly inelastic, in which case consumers would bear the full burden of the tax and the price paid by consumers would rise by exactly $500..7. a. It does not matter whether the tax is imposed on producers or consumers−the effect will be the same. With no tax, as shown in Figure 7, the demand curve is D1 and the supply curve is S1. If the tax is imposed on producers, the supply curve shifts left by the amount of the tax (50 cents) to S2. Then the equilibrium quantity is Q2, the price paid by consumers is P2, and the price received (after taxes are paid) by producers is P2 – 50 cents. If the tax is instead imposed on consumers, the demand curve shifts left by the amount of the tax (50 cents) to D2. The leftward shift in the demand curve (when the tax is imposed on consumers) is exactly the same magnitude as the leftward shift in the supply curve when the tax is imposed on producers. So again, the equilibrium quantity is Q2, the price paid by consumers is P2 (including the tax paid to the government), and the price received by producers is P2 – 50 centsFigure 7 Figure 8b. The more elastic the demand curve is, the more effective this tax will be in reducing thequantity of gasoline consumed. Greater elasticity of demand means that quantity falls more in response to the rise in the price. Figure 8 illustrates this result. Demand curve D1 represents an elastic demand curve, while demand curve D2 is more inelastic. The tax will cause a greater decline in the quantity sold when demand is elastic.c. The consumers of gasoline are hurt by the tax because they get less gasoline at ahigher price.d. Workers in the oil industry are hurt by the tax as well. With a lower quantity of gasolinebeing produced, some workers may lose their jobs. With a lower price received by producers, wages of workers might decline.CH71. a. Consumer surplus is equal to willingness to pay minus the price paid.Therefore, Melissa’s willingness to pay must be $200 ($120 + $80).b. Her consumer surplus at a price of $90 would be $200 − $90 = $110.c. If the price of an iPhone was $250, Melissa would not have purchased onebecause the price is greater than her willingness to pay. Therefore, she wouldreceive no consumer surplus.2. If an early freeze in California sours the lemon crop, the supply curve for lemonsshifts to the left, as shown in Figure 5. The result is a rise in the price of lemonsand a decline in consumer surplus from A + B + C to just A. So consumer surplusdeclines by the amount B + C.Figure 5 Figure 6In the market for lemonade, the higher cost of lemons reduces the supply oflemonade, as shown in Figure 6. The result is an increase in the price of lemonadeand a decline in consumer surplus from D + E + F to just D, a loss of E + F. Notethat an event that affects consumer surplus in one market often has effects onconsumer surplus in other markets.3. A rise in the demand for French bread leads to an increase in producer surplus inthe market for French bread, as shown in Figure 7. The shift of the demand curve leads to an increased price, which increases producer surplus from area A to area A + B + C.Figure 7The increased quantity of French bread being sold increases the demand for flour, as shown in Figure 8. As a result, the price of flour rises, increasing producersurplus from area D to D + E + F. Note that an event that affects producer surplus in one market leads to effects on producer surplus in related markets.Figure 84. a. Bert’s demand schedule is:Bert’s demand curve is shown in Figure 9.Figure 9b. When the price of each bottle of water is $4, Bert buys two bottles of water.His consumer surplus is shown as area A in the figure. He values his first bottle of water at $7, but pays only $4 for it, so has consumer surplus of $3. Hevalues his second bottle of water at $5, but pays only $4 for it, so hasconsumer surplus of $1. Thus Bert’s total consumer surplus is $3 + $1 = $4,which is the area of A in the figure.c. When the price of each bottle of water falls from $4 to $2, Bert buys threebottles of water, an increase of one. His consumer surplus consists of bothareas A and B in the figure, an increase in the amount of area B. He getsconsumer surplus of $5 from the first bottle ($7 value minus $2 price), $3 from the second bottle ($5 value minus $2 price), and $1 from the third bottle ($3value minus $2 price), for a total consumer surplus of $9. Thus consumersurplus rises by $5 (which is the size of area B) when the price of each bottle of water falls from $4 to $2.5. a. Ernie’s supply schedule f or water is:Ernie’s supply curve is shown in Figure 10.Figure 10b. When the price of each bottle of water is $4, Ernie sells two bottles of water.His producer surplus is shown as area A in the figure. He receives $4 for hisfirst bottle of water, but it costs only $1 to produce, so Ernie has producersurplus of $3. He also receives $4 for his second bottle of water, which costs$3 to produce, so he has producer surplus of $1. Thus Ernie’s total producersurplus is $3 + $1 = $4, which is the area of A in the figure.c. When the price of each bottle of water rises from $4 to $6, Ernie sells threebottles of water, an increase of one. His producer surplus consists of bothareas A and B in the figure, an increase by the amount of area B. He getsproducer surplus of $5 from the first bottle ($6 price minus $1 cost), $3 fromthe second bottle ($6 price minus $3 cost), and $1 from the third bottle ($6price minus $5 price), for a total producer surplus of $9. Thus producer surplus rises by $5 (which is the size of area B) when the price of each bottle of water rises from $4 to $6.6. a. From Ernie’s supply schedule and Bert’s demand schedule, the quantitydemanded and supplied are:Only a price of $4 brings supply and demand into equilibrium, with anequilibrium quantity of two.b. At a price of $4, consumer surplus is $4 and producer surplus is $4, as shownin Problems 3 and 4 above. Total surplus is $4 + $4 = $8.c. If Ernie produced one less bottle, his producer surplus would decline to $3, asshown in Problem 4 above. If Bert consumed one less bottle, his consumersurplus would decline to $3, as shown in Problem 3 above. So total surpluswould decline to $3 + $3 = $6.d. If Ernie produced one additional bottle of water, his cost would be $5, but theprice is only $4, so his producer surplus would decline by $1. If Bert consumed one additional bottle of water, his value would be $3, but the price is $4, so his consumer surplus would decline by $1. So total surplus declines by $1 + $1 = $2.7. a. The effect of falling production costs in the market for flat-screen TVs results ina shift to the right in the supply curve, as shown in Figure 11. As a result, theequilibrium price of flat-screen TVs declines and the equilibrium quantityincreases.b. The decline in the price of flat-screen TVs increases consumer surplus fromarea A to A + B + C + D, an increase in the amount B + C + D. Prior to the shift in supply, producer surplus was areas B + E (the area above the supply curve and below the price). After the shift in supply, producer surplus is areas E + F + G. So producer surplus changes by the amount F + G – B, which may bepositive or negative. The increase in quantity increasesproducer surplus, while the decline in the price reduces producer surplus. Because consumer surplusrises by B + C + D and producer surplus rises by F + G – B, total surplus rises by C + D + F + G.c. If the supply of flat-screen TVs is very elastic, then the shift of the supply curvebenefits consumers most. To take the most dramatic case, suppose the supply curve were horizontal, as shown in Figure 12. Then there is no producersurplus at all. Consumers capture all the benefits of falling production costs,with consumer surplus rising from area A to area A + B.8. Figure 13 shows supply and demand curves for haircuts. Supply equals demand ata quantity of three haircuts and a price between $4 and $5. Firms A, C, and Dshould cut the hair of Claire, Gloria, and Phil. Jay’s willingness to pay is too low and firm B’s costs are too high, so they do not participate. The maximum total surplus is the area between the demand and supply curves, which totals $11 ($8 value minus $2 cost for the first haircut, plus $7 value minus $3 cost for the second, plus $5 value minus $4 cost for the third).CH85. Because the demand for food is inelastic, a tax on food is a good way to raiserevenue because it leads to a small deadweight loss; thus taxing food is lessinefficient than taxing other things. But it is not a good way to raise revenue froman equity point of view, because poorer people spend a higher proportion of theirincome on food. The tax would affect them more than it would affect wealthierpeople.6. a. This tax has such a high rate that it is not likely to raise much revenue.Because of the high tax rate, the equilibrium quantity in the market is likely tobe at or near zero.b. Senator Moynihan's goal was probably to ban the use of hollow-tipped bullets.In this case, the tax could be as effective as an outright ban.8. Figure 7 illustrates the effects of the $2 subsidy on a good. Without the subsidy,the equilibrium price is P1 and the equilibrium quantity is Q1. With the subsidy,buyers pay price P B, producers receive price P S (where P S = P B + $2), and thequantity sold is Q2. The following table illustrates the effect of the subsidy onconsumer surplus, producer surplus, government revenue, and total surplus.Because total surplus declines by area D + H, the subsidy leads to a deadweightloss in that amount.Figure 710. a. Setting quantity supplied equal to quantity demanded gives 2P = 300 –P.Adding P to both sides of the equation gives 3P = 300. Dividing both sides by 3gives P = 100. Substituting P = 100 back into either equation for quantitydemanded or supplied gives Q = 200.b. Now P is the price received by sellers and P +T is the price paid by buyers.Equating quantity demanded to quantity supplied gives 2P= 300 − (P+T).Adding P to both sides of the equation gives 3P = 300 –T. Dividing both sidesby 3 gives P = 100 –T/3. This is the price received by sellers. The buyers pay aprice equal to the price received by sellers plus the tax (P +T = 100 + 2T/3).The quantity sold is now Q = 2P = 200 – 2T/3.c. Because tax revenue is equal to T x Q and Q = 200 – 2T/3, tax revenue equals200T− 2T2/3. Figure 10 (on the next page) shows a graph of this relationship.Tax revenue is zero at T = 0 and at T = 300.Figure 10 Figure 11d. As Figure 11 shows, the area of the triangle (laid on its side) that representsthe deadweight loss is 1/2 × base × height, where the base is the change in the price, which is the size of the tax (T) and the height is the amount of the decline in quantity (2T/3). So the deadweight loss equals 1/2 ×T × 2T/3 = T2/3. This rises exponentially from 0 (when T = 0) to 30,000 when T = 300, as shown in Figure 12.Figure 12e. A tax of $200 per unit is a bad policy, because tax revenue is declining at thattax level. The government could reduce the tax to $150 per unit, get more tax revenue ($15,000 when the tax is $150 versus $13,333 when the tax is $200), and reduce the deadweight loss (7,500 when the tax is $150 compared to 13,333 when the tax is $200).。
曼昆经济学原理英文第六版答案【篇一:曼昆经济学原理英文版文案加习题答案8章】ation a new in the news box on ―the tax debate‖ has been added.by the end of this chapter, students should understand:? how taxes reduce consumer and producer surplus.? the meaning and causes of the deadweight loss from a tax. ? why some taxes have larger deadweight losses than others. ? how tax revenue and deadweight loss vary with the size of a tax.chapter 8 is the second chapter in a three-chapter sequence dealing with welfare economics. in theprevious section on supply and demand, chapter 6 introduced taxes and demonstrated how a tax affects the price and quantity sold in a market. chapter 6 also described the factors that determine how the burden of the tax is divided between the buyers and sellers in a market. chapter 7 developed welfare economics—the study of how the allocation of resources affects economic well-being. chapter 8 combines the lessons learned in chapters 6 and 7 and addresses the effects of taxation on welfare. chapter 9 will address the effects of trade restrictions on welfare. the purpose of chapter 8 is to apply the lessons learned about welfare economics in chapter 7 to the issue of taxation that was addressed in chapter 6. students will learn that the cost of a tax to buyers and sellers in a market exceeds the revenue collected by the government. students will also learn about the factors that determine the degree by which the cost of a tax exceeds the revenue collected by the government.144? a tax on a good reduces the welfare of buyers and sellers of the good, and the reduction in consumer and producer surplus usually exceeds the revenue raised by the government. the fall in total surplus—the sum of consumer surplus, producer surplus, and tax revenue—is called thedeadweight loss of the tax.taxes have deadweight losses because they cause buyers to consume less and sellers to produce less, and these changesin behavior shrink the size of the market below the level that maximizes total surplus. because the elasticities of supply and demand measure how much market participants respond to market conditions, larger elasticities imply larger deadweight losses.as a tax grows larger, it distorts incentives more, and its deadweight loss grows larger. because a tax reduces the size of a market, however, tax revenue does not continually increase. it first rises with the size of a tax, but if the tax gets large enough, tax revenue starts to fall. ? ?i. the deadweight loss of taxationa. remember that it does not matter who a tax is levied on; buyers and sellers will likely share inthe burden of the tax.b. if there is a tax on a product, the price that a buyer pays will be greater than the price the sellerreceives. thus, there is a tax wedge between the two prices and the quantity sold will be smaller if there was no tax.c. how a tax affects market participants1. we can measure the effects of a tax on consumers by examining the change in consumersurplus. similarly, we can measure the effects of the tax on producers by looking at the change in producer surplus.then the benefit from the tax revenue must not be ignored.3. welfare without a taxa. consumer surplus is equal to: a + b + c.b. producer surplus is equal to: d + e + f.c. total surplus is equal to: a + b + c + d + e + f. 4. welfare with a tax a. consumer surplus is equal to: a.b. producer surplus is equal to: f.5. changes in welfare a. consumer surplus changes by: –(b +c). b. producer surplus changes by: –(d + e). c. tax revenue changes by: +(b + d). d. total surplus changes by: –(c + e). 6. definition of distortion, such as a tax. d. deadweight losses and the gains from tradec. tax revenue is equal to: b +d. d. total surplus is equal to: a +b + d + f.1. taxes cause deadweight losses because they prevent buyers and sellers from benefiting fromtrade.2. this occurs because the quantity of output declines; trades that would be beneficial to both the buyer and seller will nottake place because of the tax.3. the deadweight loss is equal to areas c and e (the drop intotal surplus).4. note that output levels between the equilibrium quantity without the tax and the quantitywith the tax will not be produced, yet the value of these unitsto consumers (represented by the demand curve) is larger than the cost of these units to producers (represented by the supply curve).ii. the determinants of the deadweight lossa. the price elasticities of supply and demand will determinethe size of the deadweight loss that occurs from a tax. 1. givena stable demand curve, the deadweight loss is larger when supply is relatively elastic.2. given a stable supply curve, the deadweight loss is larger when demand is relatively elastic. b. case study: the deadweight loss debate1. social security tax and federal income tax are taxes onlabor earnings. a labor tax places a tax wedge between thewage the firm pays and the wage that workers receive.2. there is considerable debate among economists concerning the size of the deadweight lossfrom this wage tax.3. the size of the deadweight loss depends on the elasticity of labor supply and demand, andthere is disagreement about the magnitude of the elasticity of supply.【篇二:曼昆经济学原理英文版文案加习题答案31章】basic conceptsthere is a new in the news feature on the changing nature of u.s. exports and an updated presentation of the u.s. trade deficit.by the end of this chapter, students should understand:??how net exports measure the international flow of goodsand services.??how net capital outflow measures the international flow of capital.??why net exports must always equal net foreign investment.??how saving, domestic investment, and net capital outflow are related.??the meaning of the nominal exchange rate and the real exchange rate.??purchasing-power parity as a theory of how exchange rates are determined.chapter 18 is the first chapter in a two-chapter sequence dealing with open-economy macroeconomics. chapter 18 develops the basic concepts and vocabulary associated with macroeconomics in an international setting: net exports, net capital outflow, real and nominal exchange rates, and purchasing-power parity. the next chapter, chapter 19, builds an open-economy macroeconomic model that shows how these variables are determined simultaneously.the purpose of chapter 18 is to develop the basic concepts macroeconomists use to study open economies. it addresses why a nation’s net exports must equal its net capital outflow. it also addresses the concepts of the real and nominal exchange rate and develops a theory of exchange ratedetermination known as purchasing-power parity.298??net exports are the value of domestic goods and services sold abroad (exports) minus the value offoreign goods and services sold domestically (imports). net capital outflow is the acquisition of foreign assets by domestic residents (capital outflow) minus the acquisition of domestic assets by foreigners (capital inflow). because every international transaction involves an exchange of an asset for a good or service, an economy’s net capital outflow always equals its net exports.an economy’s saving can be used to finance investment at home or buy assets abroad. thus, national saving equals domestic investment plus net capital outflow.the nominal exchange rate is the relative price of the currency of two countries, and the real exchange rate is the relative price of the goods and services of two countries. when the nominal exchange rate changes so that each dollar buys more foreign currency, the dollar is said to appreciate or strengthen. when the nominal exchange rate changes so that each dollarbuys less foreign currency, the dollar is said to depreciate or weaken.according to the theory of purchasing-power parity, a dollar (or a unit of any other currency) should be able to buy the same quantity of goods in all countries. this theory implies that the nominal exchange rate between the currencies of two countries should reflect the price levels in those countries. as a result, countries with relatively high inflation should have depreciating currencies, and countries with relatively low inflation should have appreciating currencies. ?? ?? ??i. we will no longer be assuming that the economy is a closed economy.a. definition of in the world.b. definition of around the world.ii. the international flows of goods and capitala. the flow of goods: exports, imports, and net exports1. definition of abroad.2. definition of domestically.imports, also called the trade balance.4. definition of : the value of a nation’s exports minus the value of its imports, also called net exports.5. definition of .6. definition of .7. definition of .8. there are several factors that influence a country’s exports, imports, and net exports:a. the tastes of consumers for domestic and foreign goods.b. the prices of goods at home and abroad.c. the exchange rates at which people can use domestic currency to buy foreign currencies.d. the incomes of consumers at home and abroad.e. the cost of transporting goods from country to country.f. government policies toward international trade.9. case study: the increasing openness of the u.s. economy a. figure 1 shows the total value of exports and imports (expressed as a percentage of gdp) for the united states since 1950. b. advances in transportation, telecommunications, and technological progress are some of the reasons why international trade has increased over time. c. policymakers around the world have also become more accepting of freetrade over time. 10. in the news: the changing nature of u.s. exports a. growing u.s. exports include entertainment royalties, tourism, travel, and services. b. this article from the wall street journal describes the growth in new exports. b. the flow of financial resources: net capital outflow1. definition of residents minus the purchase of domestic assets by foreigners.2. the flow of capital abroad takes two forms. a. foreign direct investment occurs when a capital investment is owned and operated by a foreign entity.b. foreign portfolio investment involves an investment that is financed with foreign money but operated by domestic residents.3. net capital outflow can be positive or negative.a. when net capital outflow is positive, domestic residents are buying more foreign assets than foreigners are buying domestic assets. capital is flowing out of the country.b. when net capital outflow is negative, domestic residents are buying fewer foreign assets than foreigners are buying domestic assets. the country is experiencing a capital inflow. 4. there are several factors that influence a country’s net capital outflow:a. the real interest rates being paid on foreign assets.b. the real interest rates being paid on domestic assets.c. the perceived economic and political risks of holding assets abroad.d. the government policies that affect foreign ownership of domestic assets.c. the equality of net exports and net capital outflow1. net exports and net capital outflow each measure a type of imbalance in a world market.a. net exports measure the imbalance between a country’s exports and imports in world markets for goods and services.b. net capital outflow measures the imbalance between the amount of foreign assets bought by domestic residents andthe amount of domestic assets bought by foreigners inworld financial markets.2. for an economy, net exports must be equal to net capital outflow.3. example: you are a computer programmer who sells some software to a japanese consumer for 10,000 yen. a. thesale is an export of the united states so u.s. net exports increase.b. there are several things you could do with the 10,000 yenc. you could hold the yen (which is a japanese asset) or use it to purchase another japanese asset. either way, u.s. net capital outflow rises.d. alternatively, you could use the yen to purchase a japanese good. thus, u.s. imports will rise so the net effect on net exports will be zero.e. one final possibility is that you could exchange the yen for dollars at a bank. this doesnot change the situation though, because the bank then must use the yen for something.alternative classroom example: assume that u.s. residents do not want to buy any foreign assets, but foreign residents want to purchase some stock in a u.s. firm (such as microsoft). how are the foreigners going to get the dollars to purchase the stock? they would do it the same way u.s. residents would purchase the stock—they would have to earn more than they spend. in other words, foreigners must sell the united states more goods and services than they purchase from the united states. this leads to negative net exports for the united states. the extra dollars spent by u.s. residents on foreign-produced goods and services would be used to purchase the stock in microsoft. 4. this example can be generalized to the economy as a whole.a. when a nation is running a trade surplus (nx 0), it must be using the foreign currencyto purchase foreign assets. thus, capital is flowing out of the country (nco 0).b. when a nation is running a trade deficit (nx 0), it must be financing the net purchase of these goods by selling assets abroad. thus, capital is flowing into the country (nco0).5. every international transaction involves exchange. when a seller country transfers a good orservice to a buyer country, the buyer country gives up some asset to pay for the good or service.6. thus, the net value of the goods and services sold by a country (net exports) must equal thenet value of the assets acquired (net capital outflow).d. saving, investment, and their relationship to the international flows1. recall that gdp (y ) is the sum of four components: consumption (c ), investment (i ),government purchases (g ) and net exports (nx ).【篇三:曼昆宏观经济学课后答案(英文版)】quizzes:1. gross domestic product measures two things at once: (1) the total income of everyonein the economy; and (2) the total expenditure on the economy’s output of goods and services. it can measure both of these things at once because income must equal expenditure for the economy as a whole.2. the production of a pound of caviar contributes more to gdp than the production of apound of hamburger because the contribution to gdp is measured by market value and the price of a pound of caviar is much higher than the price of a pound of hamburger.3. the four components of expenditure are: (1) consumption;(2) investment; (3)government purchases; and (4) net exports. the largest component is consumption, which accounts for more thantwo-thirds of total expenditure.4. nominal gdp is the production of goods and services valued at current prices. realgdp is the production of goods and services valued at constant prices. real gdp is a better measure of economicwell-being because it reflects the eco nomy’s ability to satisfy people’s needs and desires. thus a rise in real gdp means people have produced more goods and services, but a rise in nominal gdp could occur either because of increased production or because of higher prices.5. although gdp is not a perfect measure of well-being, policymakers should care about itbecause a larger gdp means that a nation can afford better health care, better educational systems, and more of the material necessities of life.questions for review:1.2.3.4. an economys income must equal its expenditure, since every transaction has a buyer and a seller. thus, expenditure by buyers must equal income by sellers. the production of a luxury car contributes more to gdp than the production of an economy car because the luxury car has a higher market value. the contribution to gdp is $3, the market value of the bread, which is the final good that is sold. the sale of used records does not affect gdp at all because it involves no current production.5. the four components of gdp are consumption, such as the purchase of a music cd;investment, such as the purchase of a computer by a business; government purchases, such as an order for military aircraft; and net exports, such as the sale of american wheat to russia.6. economists use real gdp rather than nominal gdp to gauge economic well-beingbecause real gdp is not affected by changes in prices, so it reflects only changes in the amounts being produced. if nominal gdp rises, you do not know if that is because of increased production or higher prices.7.the percentage change in nominal gdp is (600-200)/200 x 100 = 200%. the percentage change in real gdp is (400-200)/200 x 100 = 100%. the percentage change in the deflator is (150-100)/100 x 100 = 50%.8. it is desirable for a country to have a large gdp because people could enjoy more goodsand services. but gdp is not the only important measure of well-being. for example, laws that restrict pollution cause gdp to be lower. if laws against pollution were eliminated, gdp would be higher but the pollution might make us worse off. or, for example, an earthquake would raise gdp, as expenditures on cleanup, repair, and rebuilding increase. but an earthquake is an undesirable event that lowers our welfare.problems and applications:1. a. consumption increases because a refrigerator is a good purchased by ahousehold.b. investment increases because a house is an investment good.c. consumption increases because a car is a good purchased by a household, butinvestment decreases because the car in ford’s inventory had been counted as aninvestment good until it was sold.d. consumption increases because pizza is a good purchased by a household.e. government purchases increase because the government spent money to providea good to the public.f. consumption increases because the bottle is a good purchased by a household,but net exports decrease because the bottle was imported.g. investment increases because new structures and equipment were built.2.3. with transfer payments, nothing is produced, so there is no contribution to gdp. purchases of new housing are included in the investment portion of gdp because housingprovides services for a long time. for the same reason, purchases of new cars could be thought of as investment, but by convention, they are not. the logic could apply to any durable good, such as household appliances.if gdp included goods that are resold, it would be counting output of that particular year, plus sales of goods produced ina previous year. it would double-count goods that were sold more than once and would count goods in gdp for severalyears if they were produced in one year and resold in another. 4.5. a. 2001: ($1 per qt. of milk ? 100 qts. milk) + ($2 per qt. of honey ? 50 qts. honey)= $2002002: ($1 per qt. of milk ? 200 qts. milk) + ($2 per qt. of honey ? 100 qts.honey) = $4002003: ($2 per qt. of milk ? 200 qts. milk) + ($4 per qt. of honey ? 100 qts.honey) = $8002001: ($1 per qt. of milk ? 100 qts. milk) + ($2 per qt. ofhoney ? 50 qts. honey)= $2002002: ($1 per qt. of milk ? 200 qts. milk) + ($2 per qt. of honey ? 100 qts.honey) = $4002003: ($1 per qt. of milk ? 200 qts. milk) + ($2 per qt. of honey ? 100 qts.honey) = $4002001: ($200/$200) ? 100 = 1002002: ($400/$400) ? 100 = 1002003: ($800/$400) ? 100 = 200b. percentage change in nominal gdp in 2002 = [($400 - $200)/$200] ? 100 =100%.percentage change in nominal gdp in 2003 = [($800 -$400)/$400] ? 100 =100%.percentage change in real gdp in 2002 = [($400 - $200)/$200] ? 100 = 100%.percentage change in real gdp in 2003 = [($400 - $400)/$400] ? 100 = 0%.percentage change in the gdp deflator in 2002 = [(100 -100)/100] ? 100 = 0%.percentage change in the gdp deflator in 2003 = [(200 -100)/100] ? 100 =100%.prices did not change from 2001 to 2002. thus, thepercentage change in thegdp deflator is zero. likewise, output levels did not change from 2002 to 2003.this means that the percentage change in real gdp is zero.c. economic well-being rose more in 2002 than in 2003, since real gdp rose in2002 but not in 2003. in 2002, real gdp rose and prices didn’t. in 2003, realgdp didn’t rise and prices did.6.a.b.c.d.e.f.7. the growth rate of nominal gdp is higher than the growth rate of real gdp because of inflation. the growth rate of real gdp is ($8,367 - $8,203)/$8,203 ? 100% = 2.0%. real gdp in 2000 (in 1996 dollars) is $9,873/(118/100) = $8,367. real gdp in 1999 (in 1996 dollars) is $9,269/(113/100) = $8,203. the growth rate ofthe deflator is (118 - 113)/113 ? 100% = 4.4%. the growth rate of nominal gdp is ($9,873 - $9,269)/$9,269 ? 100% = 6.5%. economists ignore the rise in peoples incomes that is caused by higher prices becausealthough incomes are higher, the prices of the goods and services that people buy are also higher. therefore, they will not necessarily be able to purchase more goods and services. for this reason, economists prefer to look at real gdp instead of nominal gdp.many answers are possible.a. gdp equals the dollar amount barry collects, which is $400.8. 9.c.d.e.10. national income = nnp - sales taxes = $350 - $30 = $320. personal income = national income - retained earnings = $320 - $100 = $220. disposable personal income = personal income - personal income tax = $220 - $70 = $150. in countries like india, people produce and consume a fair amount of food at home that isnot included in gdp. so gdp per person in india and the united states will differ by more than their comparative economicwell-being.if the government cares about the total income of americans,it will emphasize gnp, since that measure includes the income of americans that is earned abroad and excludes the income of foreigners. if the government cares about the total amount ofeconomic activity occurring in the united states, it will emphasize gdp, which measures the level of production in the country, whether produced by domestic citizens or foreigners.a. the increased labor-force participation of women has increased gdp in theunited states, since it means more people are working and production hasincreased.if our measure of well-being included time spent working in the home and takingleisure, it wouldnt rise as much as gdp, since the rise in womens labor-forceparticipation has reduced time spent working in the home and taking leisure.other aspects of well-being that are associated with the rise in womens increasedlabor-force participation include increased self-esteem and prestige for women inthe workforce, especially at managerial levels, but decreased quality time spentwith children, whose parents have less time to spend with them. such aspectswould be quite difficult to measure. 11. 12. b. c.24章quick quizzes1. the consumer price index tries to measure the overall cost of the goods and servicesbought by a typical consumer. it is constructed by surveying consumers to fix a basket of goods and services that the typical consumer buys, finding the prices of the goods and。
经济学原理曼昆英文1. Economics as a Social Science: In this chapter, the author introduces the study of economics as a social science that explores how individuals, firms, and societies make decisions about resource allocation.2. The Role of Incentives: This chapter explores how individuals respond to incentives and how they influence decision-making in economics. Various types of incentives, such as financial rewards and punishments, are discussed.3. Supply and Demand: The concept of supply and demand is explained in this chapter. It delves into how the interaction between buyers and sellers in a market determines the equilibrium price and quantity of a product.4. Elasticity and Its Applications: Elasticity, a measure of responsiveness, is discussed in this chapter. The various types of elasticity, including price elasticity of demand and income elasticity of demand, are explained and their applications are explored.5. Consumer Choice: This chapter explores how individuals make choices as consumers, considering factors such as preferences, constraints, and budget constraints. Utility theory and indifference curves are introduced as tools to understand consumer choice.6. Production and Costs: The author discusses how firms make decisions regarding production and cost in this chapter. Topics covered include production functions, costs of production, and theconcept of economies of scale.7. Perfect Competition: This chapter explores the characteristics of perfect competition, including the large number of buyers and sellers, homogenous products, and ease of entry and exit. It also examines the implications of perfect competition on market outcomes.8. Monopoly: The concept of monopoly, where a single firm controls the market, is discussed in this chapter. The author analyzes the sources of monopoly power and its implications for prices and output in the market.9. Market Failures and Government Intervention: This chapter examines market failures, situations where the market fails to allocate resources efficiently. Different types of market failures, such as externalities and public goods, are explained, along with the role of government intervention in correcting these failures.10. Externalities: Externalities, or the consequences of economic activities on third parties, are explored in this chapter. The author discusses positive and negative externalities and their implications for resource allocation.11. Public Goods and Common Resources: This chapter focuses on the characteristics of public goods and common resources. It discusses the free-rider problem and the challenges in providing public goods efficiently.12. Markets for Factors of Production: The author explores themarkets for factors of production, including labor and capital, in this chapter. Wage determination, discrimination, and other factors influencing the prices of these factors are analyzed.13. The Economics of Income Inequality: Income inequality and its causes are discussed in this chapter. The author explores different theories and factors that contribute to income inequality, as well as its implications for society and policy considerations.14. The Theory of Consumer Choice: This chapter delves deeper into the theory of consumer choice, examining topics such as consumer preferences, budget constraints, and the concept of utility maximization.15. Frontiers of Microeconomics: The final chapter explores the frontiers of microeconomics, including topics such as behavioral economics, game theory, and the economics of information. The author discusses how these fields have expanded our understanding of economic behavior.。
SOLUTIONS TO TEXT PROBLEMS:Quick Quizzes1. Figure 1 shows the supply and demand curves for cookies, with equilibrium quantity Q1 andequilibrium price P1. When the government imposes a tax on cookies, the price to buyers rises to P B, the price received by sellers declines to P S, and the equilibrium quantity falls to Q2. Thedeadweight loss is the triangular area below the demand curve and above the supply curvebetween quantities Q1 and Q2. The deadweight loss shows the fall in total surplus that resultsfrom the tax.Figure 12. A tax on beer would have a larger deadweight loss than a tax on milk, since the demand for beer ismore elastic than the demand for milk and the deadweight loss of a tax is larger the greater is the elasticity of demand.3. If the government doubles the tax on gasoline, the revenue from the gasoline tax could rise or fall,depending on where the tax falls on the Laffer curve. However, if the government doubles the tax on gasoline, you can be sure that the deadweight loss of the tax rises, since deadweight loss always rises as the tax rate rises.Questions for Review1. When the sale of a good is taxed, both consumer surplus and producer surplus decline. Thedecline in consumer surplus and producer surplus exceeds the amount of government revenue that is raised, so society's total surplus declines. The tax distorts the incentives of both buyers andsellers, so resources are allocated inefficiently.2. Figure 2 illustrates the deadweight loss and tax revenue from a tax on the sale of a good. Withouta tax, the equilibrium quantity would be Q1, the equilibrium price would be P1, consumer surpluswould be A+B+C, and producer surplus would be D+E+F. The imposition of a tax places a wedge155between the price buyers pay, P B, and the price sellers receive, P S, where P B = P S + tax. Thequantity sold declines to Q2. Now consumer surplus is A, producer surplus is F, and government revenue is B+D. The deadweight loss of the tax is C+E, since that area is lost because of thedecline in quantity from Q1 to Q2.Figure 23. The greater the elasticities of demand and supply, the greater the deadweight loss of a tax. Sinceelasticity measures the response of quantity to a change in price, higher elasticity means the tax induces a greater reduction in quantity, hence a greater distortion to the market.4. Experts disagree about whether labor taxes have small or large deadweight losses because theyhave different views about the elasticity of labor supply. Some believe that labor supply isinelastic, so a tax on labor has a small deadweight loss. But others think that workers can adjust their hours worked in various ways, so labor supply is elastic, and thus a tax on labor has a large deadweight loss.5. The deadweight loss of a tax rises more than proportionally as the tax rises. Tax revenue,however, may increase initially as the tax rises, but as the tax rises further, revenue eventuallydeclines.Problems and Applications1. a. Figure 3 illustrates the market for pizza. The equilibrium price is P1, the equilibriumquantity is Q1, consumer surplus is area A+B+C, and producer surplus is area D+E+F.There is no deadweight loss, as all the potential gains from trade are realized; total surplusis the entire area between the demand and supply curves A+B+C+D+E+F.Figure 3b. With a $1 tax on each pizza sold, the price paid by buyers, P B, is now higher than the pricereceived by sellers, P S, where P B = P S + $1. The quantity declines to Q2, consumersurplus is area A, producer surplus is area F, government revenue is area B+D, anddeadweight loss is area C+E. Consumer surplus declines by B+C, producer surplusdeclines by D+E, government revenue increases by B+D, and deadweight loss increasesby C+E.c. If the tax were removed and consumers and producers voluntarily transferred B+D to thegovernment to make up for the lost tax revenue, then everyone would be better off thanwithout the tax. The equilibrium quantity would be Q1, as in the case without the tax, andthe equilibrium price would be P1. Consumer surplus would be A+C, because consumersget surplus of A+B+C, then voluntarily transfer B to the government. Producer surpluswould be E+F, since producers get surplus of D+E+F, then voluntarily transfer D to thegovernment. Both consumers and producers are better off than the case when the taxwas imposed. If consumers and producers gave a little bit more than B+D to thegovernment, then all three parties, including the government, would be better off. Thisillustrates the inefficiency of taxation.2. a. The statement, "If the government taxes land, wealthy landowners will pass the tax on totheir poorer renters," is incorrect. With a tax on land, landowners can not pass the tax on.Since the supply curve of land is perfectly inelastic, landowners bear the entire burden ofthe tax. Renters will not be affected at all.b. The statement, "If the government taxes apartment buildings, wealthy landowners willpass the tax on to their poorer renters," is partially correct. With a tax on apartmentbuildings, landowners can pass the tax on more easily, though the extent to which they dothis depends on the elasticities of supply and demand. In this case, the tax is a directaddition to the cost of rental units, so the supply curve will shift up by the amount of thetax. The tax will be shared by renters and landowners, depending on the elasticities ofdemand and supply.Chapter 8 /Application: The Costs of Taxation 1583. a. The statement, "A tax that has no deadweight loss cannot raise any revenue for thegovernment," is incorrect. An example is the case of a tax when either supply or demandis perfectly inelastic. The tax has neither an effect on quantity nor any deadweight loss,but it does raise revenue.b. The statement, "A tax that raises no revenue for the government cannot have anydeadweight loss," is incorrect. An example is the case of a 100 percent tax imposed onsellers. With a 100 percent tax on their sales of the good, sellers won't supply any of thegood, so the tax will raise no revenue. Yet the tax has a large deadweight loss, since itreduces the quantity sold to zero.4. a. With very elastic supply and very inelastic demand, the burden of the tax on rubber bandswill be borne largely by buyers. As Figure 4 shows, consumer surplus declinesconsiderably, by area A+B, but producer surplus doesn't fall much at all, just by area C+D.Figure 4b. With very inelastic supply and very elastic demand, the burden of the tax on rubber bandswill be borne largely by sellers. As Figure 5 shows, consumer surplus does not declinemuch, just by area A+B, while producer surplus falls substantially, by area C+D.Compared to part (a), producers bear much more of the burden of the tax, and consumersbear much less.Figure 55. a. The deadweight loss from a tax on heating oil is likely to be greater in the fifth year after itis imposed rather than the first year. In the first year, the elasticity of demand is fairly low,as people who own oil heaters are not likely to get rid of them right away. But over timethey may switch to other energy sources and people buying new heaters for their homeswill more likely choose gas or electric, so the tax will have a greater impact on quantity.b. The tax revenue is likely to be higher in the first year after it is imposed than in the fifthyear. In the first year, demand is more inelastic, so the quantity does not decline as muchand tax revenue is relatively high. As time passes and more people substitute away fromoil, the equilibrium quantity declines, as does tax revenue.6. Since the demand for food is inelastic, a tax on food is a good way to raise revenue because it doesnot lead to much of a deadweight loss; thus taxing food is less inefficient than taxing other things.But it is not a good way to raise revenue from an equity point of view, since poorer people spend a higher proportion of their income on food, so the tax would hit them harder than it would hitwealthier people.7. a. This tax has such a high rate that it is not likely to raise much revenue. Because of thehigh tax rate, the equilibrium quantity in the market is likely to be at or near zero.b. Senator Moynihan's goal was probably to ban the use of hollow-tipped bullets. In thiscase, a tax is as effective as an outright ban.8. a. Figure 6 illustrates the market for socks and the effects of the tax. Without a tax, theequilibrium quantity would be Q1, the equilibrium price would be P1, total spending byconsumers equals total revenue for producers, which is P1 x Q1, which equals areaB+C+D+E+F, and government revenue is zero. The imposition of a tax places a wedgebetween the price buyers pay, P B, and the price sellers receive, P S, where P B = P S + tax.The quantity sold declines to Q2. Now total spending by consumers is P B x Q2, whichequals area A+B+C+D, total revenue for producers is P S x Q2, which is area C+D, andgovernment tax revenue is Q2 x tax, which is area A+B.b. Unless supply is perfectly elastic, the price received by producers falls because of the tax.Total receipts for producers fall, since producers lose revenue equal to area B+E+F.Figure 6c. The price paid by consumers rises, unless demand is perfectly elastic. Whether totalspending by consumers rises or falls depends on the price elasticity of demand. Ifdemand is elastic, the percentage decline in quantity exceeds the percentage increase inprice, so total spending declines. If demand is inelastic, the percentage decline inquantity is less than the percentage increase in price, so total spending rises. Whethertotal consumer spending falls or rises, consumer surplus declines because of the increasein price and reduction in quantity.9. Since the tax on gadgets was eliminated, all tax revenue must come from the tax on widgets. Thetax revenue from the tax on widgets equals the tax per unit times the quantity produced.Assuming that neither the supply nor the demand curves for widgets are perfectly elastic orinelastic and since the increased tax causes a smaller quantity of widgets to be produced, then it is impossible for tax revenue to double--multiplying the tax per unit (which doubles) times thequantity (which declines) gives a number that is less than double the original tax revenue fromwidgets. So the government's tax change will yield less money than before.10. a. Figure 7 illustrates the effects of the tax increase on the new car market in New Jersey.The quantity of cars sold declines from Q1 to Q2, the price paid by consumers rises from P B1to P B2, and the price received by producers declines from P S1 to P S2, where P B1 = P S1 +$100 and P B2 = P S2 + $150.Figure 7b. The following table shows the welfare impact of the change in the tax.OLD NEW CHANGE Consumer Surplus A+B+C A –(B+C)Producer Surplus F+G+H H –(F+G)Government Revenue D+E B+D+F +(B+F)–ETotal Surplus A+B+C+D+E+F+G+H A+B+D+F+H –(C+E+G)c. The change in government revenue is B + F – E, which could be positive or negative.d. The change in deadweight loss is positive, as it increases by C+E+G, meaning that theeconomy as a whole is worse off.e. The demand for cars in New Jersey is probably fairly elastic, since people could travel tonearby states to buy cars. With elastic demand, area B in the figure will be very small, sothe additional tax is less likely to increase government revenue. New Jersey could try toreduce the elasticity of demand by requiring people to pay sales tax to New Jersey whenthey buy a car outside the state.11. From the standpoint of economic efficiency, the British poll tax is wonderful, because it does notdistort any economic incentives, so it has no deadweight loss. But such a tax is inequitable,because it is more burdensome on the poor than on the rich. As a result, the tax was quiteunpopular.12. Figure 8 illustrates the effects of the $2 subsidy on a good. Without the subsidy, the equilibriumprice is P1 and the equilibrium quantity is Q1. With the subsidy, buyers pay price P B, producers receive price P S (where P S = P B + $2), and the quantity sold is Q2. The following table illustrates the effect of the subsidy on consumer surplus, producer surplus, government revenue, and total surplus. Since total surplus declines by area D+H, the subsidy leads to a deadweight loss in that amount.OLD NEW CHANGE Consumer Surplus A+B A+B+E+F+G +(E+F+G)Producer Surplus E+I B+C+E+I +(B+C)Government Revenue 0 –(B+C+D+E+F+G+H) –(B+C+D+E+F+G+H)Total Surplus A+B+E+I A+B–D+E–H+I -(D+H)Chapter 8 /Application: The Costs of Taxation 162Figure 813. a. Setting quantity supplied equal to quantity demanded gives 2P = 300 –P. Adding P toboth sides of the equation gives 3P = 300. Dividing both sides by 3 gives P = 100.Plugging P = 100 back into either equation for quantity demanded or supplied gives Q =200.b. Now P is the price received by sellers and P+T is the price paid by buyers. Equatingquantity demanded to quantity supplied gives 2P = 300 - (P+T). Adding P to both sidesof the equation gives 3P = 300 –T. Dividing both sides by 3 gives P = 100 - T/3. This isthe price received by sellers. The buyers pay a price equal to the price received by sellersplus the tax (P+T = 100 + 2T/3). The quantity sold is now Q = 2P = 200 – 2T/3.c. Since tax revenue is equal to T x Q and Q = 200 - 2T/3, tax revenue equals200T - 2T2/3. Figure 9 shows a graph of this relationship. Tax revenue is zero at T = 0and at T = 300.Figure 9Chapter 8 /Application: The Costs of Taxation 163d. As Figure 10 shows, the area of the triangle (laid on its side) that represents thedeadweight loss is 1/2 x base x height, where the base is the change in the price, which is the size of the tax (T) and the height is the amount of the decline in quantity (2T/3). So the deadweight loss equals 1/2 x T x 2T/3 = T2/3. This rises exponentially from 0 (when T = 0) to 45,000 when T = 300, as shown in Figure 11.Figure 10Figure 11e. A tax of $200 per unit is a bad idea, because it's in a region in which tax revenue isdeclining. The government could reduce the tax to $150 per unit, get more tax revenue ($15,000 when the tax is $150 versus $13,333 when the tax is $200), and reduce thedeadweight loss (7,500 when the tax is $150 compared to 13,333 when the tax is $200).。
SOLUTIONS TO TEXT PROBLEMS:Quick Quizzes1. Figure 1 shows the supply and demand curves for cookies, with equilibrium quantity Q1 andequilibrium price P1. When the government imposes a tax on cookies, the price to buyers rises to P B, the price received by sellers declines to P S, and the equilibrium quantity falls to Q2. Thedeadweight loss is the triangular area below the demand curve and above the supply curvebetween quantities Q1 and Q2. The deadweight loss shows the fall in total surplus that resultsfrom the tax.Figure 12. A tax on beer would have a larger deadweight loss than a tax on milk, since the demand for beer ismore elastic than the demand for milk and the deadweight loss of a tax is larger the greater is the elasticity of demand.3. If the government doubles the tax on gasoline, the revenue from the gasoline tax could rise or fall,depending on where the tax falls on the Laffer curve. However, if the government doubles the tax on gasoline, you can be sure that the deadweight loss of the tax rises, since deadweight loss always rises as the tax rate rises.Questions for Review1. When the sale of a good is taxed, both consumer surplus and producer surplus decline. Thedecline in consumer surplus and producer surplus exceeds the amount of government revenue that is raised, so society's total surplus declines. The tax distorts the incentives of both buyers andsellers, so resources are allocated inefficiently.2. Figure 2 illustrates the deadweight loss and tax revenue from a tax on the sale of a good. Withouta tax, the equilibrium quantity would be Q1, the equilibrium price would be P1, consumer surpluswould be A+B+C, and producer surplus would be D+E+F. The imposition of a tax places a wedge155between the price buyers pay, P B, and the price sellers receive, P S, where P B = P S + tax. Thequantity sold declines to Q2. Now consumer surplus is A, producer surplus is F, and government revenue is B+D. The deadweight loss of the tax is C+E, since that area is lost because of thedecline in quantity from Q1 to Q2.Figure 23. The greater the elasticities of demand and supply, the greater the deadweight loss of a tax. Sinceelasticity measures the response of quantity to a change in price, higher elasticity means the tax induces a greater reduction in quantity, hence a greater distortion to the market.4. Experts disagree about whether labor taxes have small or large deadweight losses because theyhave different views about the elasticity of labor supply. Some believe that labor supply isinelastic, so a tax on labor has a small deadweight loss. But others think that workers can adjust their hours worked in various ways, so labor supply is elastic, and thus a tax on labor has a large deadweight loss.5. The deadweight loss of a tax rises more than proportionally as the tax rises. Tax revenue,however, may increase initially as the tax rises, but as the tax rises further, revenue eventuallydeclines.Problems and Applications1. a. Figure 3 illustrates the market for pizza. The equilibrium price is P1, the equilibriumquantity is Q1, consumer surplus is area A+B+C, and producer surplus is area D+E+F.There is no deadweight loss, as all the potential gains from trade are realized; total surplusis the entire area between the demand and supply curves A+B+C+D+E+F.Figure 3b. With a $1 tax on each pizza sold, the price paid by buyers, P B, is now higher than the pricereceived by sellers, P S, where P B = P S + $1. The quantity declines to Q2, consumersurplus is area A, producer surplus is area F, government revenue is area B+D, anddeadweight loss is area C+E. Consumer surplus declines by B+C, producer surplusdeclines by D+E, government revenue increases by B+D, and deadweight loss increasesby C+E.c. If the tax were removed and consumers and producers voluntarily transferred B+D to thegovernment to make up for the lost tax revenue, then everyone would be better off thanwithout the tax. The equilibrium quantity would be Q1, as in the case without the tax, andthe equilibrium price would be P1. Consumer surplus would be A+C, because consumersget surplus of A+B+C, then voluntarily transfer B to the government. Producer surpluswould be E+F, since producers get surplus of D+E+F, then voluntarily transfer D to thegovernment. Both consumers and producers are better off than the case when the taxwas imposed. If consumers and producers gave a little bit more than B+D to thegovernment, then all three parties, including the government, would be better off. Thisillustrates the inefficiency of taxation.2. a. The statement, "If the government taxes land, wealthy landowners will pass the tax on totheir poorer renters," is incorrect. With a tax on land, landowners can not pass the tax on.Since the supply curve of land is perfectly inelastic, landowners bear the entire burden ofthe tax. Renters will not be affected at all.b. The statement, "If the government taxes apartment buildings, wealthy landowners willpass the tax on to their poorer renters," is partially correct. With a tax on apartmentbuildings, landowners can pass the tax on more easily, though the extent to which they dothis depends on the elasticities of supply and demand. In this case, the tax is a directaddition to the cost of rental units, so the supply curve will shift up by the amount of thetax. The tax will be shared by renters and landowners, depending on the elasticities ofdemand and supply.Chapter 8 /Application: The Costs of Taxation 1583. a. The statement, "A tax that has no deadweight loss cannot raise any revenue for thegovernment," is incorrect. An example is the case of a tax when either supply or demandis perfectly inelastic. The tax has neither an effect on quantity nor any deadweight loss,but it does raise revenue.b. The statement, "A tax that raises no revenue for the government cannot have anydeadweight loss," is incorrect. An example is the case of a 100 percent tax imposed onsellers. With a 100 percent tax on their sales of the good, sellers won't supply any of thegood, so the tax will raise no revenue. Yet the tax has a large deadweight loss, since itreduces the quantity sold to zero.4. a. With very elastic supply and very inelastic demand, the burden of the tax on rubber bandswill be borne largely by buyers. As Figure 4 shows, consumer surplus declinesconsiderably, by area A+B, but producer surplus doesn't fall much at all, just by area C+D.Figure 4b. With very inelastic supply and very elastic demand, the burden of the tax on rubber bandswill be borne largely by sellers. As Figure 5 shows, consumer surplus does not declinemuch, just by area A+B, while producer surplus falls substantially, by area C+D.Compared to part (a), producers bear much more of the burden of the tax, and consumersbear much less.Figure 55. a. The deadweight loss from a tax on heating oil is likely to be greater in the fifth year after itis imposed rather than the first year. In the first year, the elasticity of demand is fairly low,as people who own oil heaters are not likely to get rid of them right away. But over timethey may switch to other energy sources and people buying new heaters for their homeswill more likely choose gas or electric, so the tax will have a greater impact on quantity.b. The tax revenue is likely to be higher in the first year after it is imposed than in the fifthyear. In the first year, demand is more inelastic, so the quantity does not decline as muchand tax revenue is relatively high. As time passes and more people substitute away fromoil, the equilibrium quantity declines, as does tax revenue.6. Since the demand for food is inelastic, a tax on food is a good way to raise revenue because it doesnot lead to much of a deadweight loss; thus taxing food is less inefficient than taxing other things.But it is not a good way to raise revenue from an equity point of view, since poorer people spend a higher proportion of their income on food, so the tax would hit them harder than it would hitwealthier people.7. a. This tax has such a high rate that it is not likely to raise much revenue. Because of thehigh tax rate, the equilibrium quantity in the market is likely to be at or near zero.b. Senator Moynihan's goal was probably to ban the use of hollow-tipped bullets. In thiscase, a tax is as effective as an outright ban.8. a. Figure 6 illustrates the market for socks and the effects of the tax. Without a tax, theequilibrium quantity would be Q1, the equilibrium price would be P1, total spending byconsumers equals total revenue for producers, which is P1 x Q1, which equals areaB+C+D+E+F, and government revenue is zero. The imposition of a tax places a wedgebetween the price buyers pay, P B, and the price sellers receive, P S, where P B = P S + tax.The quantity sold declines to Q2. Now total spending by consumers is P B x Q2, whichequals area A+B+C+D, total revenue for producers is P S x Q2, which is area C+D, andgovernment tax revenue is Q2 x tax, which is area A+B.b. Unless supply is perfectly elastic, the price received by producers falls because of the tax.Total receipts for producers fall, since producers lose revenue equal to area B+E+F.Figure 6c. The price paid by consumers rises, unless demand is perfectly elastic. Whether totalspending by consumers rises or falls depends on the price elasticity of demand. Ifdemand is elastic, the percentage decline in quantity exceeds the percentage increase inprice, so total spending declines. If demand is inelastic, the percentage decline inquantity is less than the percentage increase in price, so total spending rises. Whethertotal consumer spending falls or rises, consumer surplus declines because of the increasein price and reduction in quantity.9. Since the tax on gadgets was eliminated, all tax revenue must come from the tax on widgets. Thetax revenue from the tax on widgets equals the tax per unit times the quantity produced.Assuming that neither the supply nor the demand curves for widgets are perfectly elastic orinelastic and since the increased tax causes a smaller quantity of widgets to be produced, then it is impossible for tax revenue to double--multiplying the tax per unit (which doubles) times thequantity (which declines) gives a number that is less than double the original tax revenue fromwidgets. So the government's tax change will yield less money than before.10. a. Figure 7 illustrates the effects of the tax increase on the new car market in New Jersey.The quantity of cars sold declines from Q1 to Q2, the price paid by consumers rises from P B1to P B2, and the price received by producers declines from P S1 to P S2, where P B1 = P S1 +$100 and P B2 = P S2 + $150.Figure 7b. The following table shows the welfare impact of the change in the tax.OLD NEW CHANGE Consumer Surplus A+B+C A –(B+C)Producer Surplus F+G+H H –(F+G)Government Revenue D+E B+D+F +(B+F)–ETotal Surplus A+B+C+D+E+F+G+H A+B+D+F+H –(C+E+G)c. The change in government revenue is B + F – E, which could be positive or negative.d. The change in deadweight loss is positive, as it increases by C+E+G, meaning that theeconomy as a whole is worse off.e. The demand for cars in New Jersey is probably fairly elastic, since people could travel tonearby states to buy cars. With elastic demand, area B in the figure will be very small, sothe additional tax is less likely to increase government revenue. New Jersey could try toreduce the elasticity of demand by requiring people to pay sales tax to New Jersey whenthey buy a car outside the state.11. From the standpoint of economic efficiency, the British poll tax is wonderful, because it does notdistort any economic incentives, so it has no deadweight loss. But such a tax is inequitable,because it is more burdensome on the poor than on the rich. As a result, the tax was quiteunpopular.12. Figure 8 illustrates the effects of the $2 subsidy on a good. Without the subsidy, the equilibriumprice is P1 and the equilibrium quantity is Q1. With the subsidy, buyers pay price P B, producers receive price P S (where P S = P B + $2), and the quantity sold is Q2. The following table illustrates the effect of the subsidy on consumer surplus, producer surplus, government revenue, and total surplus. Since total surplus declines by area D+H, the subsidy leads to a deadweight loss in that amount.OLD NEW CHANGE Consumer Surplus A+B A+B+E+F+G +(E+F+G)Producer Surplus E+I B+C+E+I +(B+C)Government Revenue 0 –(B+C+D+E+F+G+H) –(B+C+D+E+F+G+H)Total Surplus A+B+E+I A+B–D+E–H+I -(D+H)Chapter 8 /Application: The Costs of Taxation 162Figure 813. a. Setting quantity supplied equal to quantity demanded gives 2P = 300 –P. Adding P toboth sides of the equation gives 3P = 300. Dividing both sides by 3 gives P = 100.Plugging P = 100 back into either equation for quantity demanded or supplied gives Q =200.b. Now P is the price received by sellers and P+T is the price paid by buyers. Equatingquantity demanded to quantity supplied gives 2P = 300 - (P+T). Adding P to both sidesof the equation gives 3P = 300 –T. Dividing both sides by 3 gives P = 100 - T/3. This isthe price received by sellers. The buyers pay a price equal to the price received by sellersplus the tax (P+T = 100 + 2T/3). The quantity sold is now Q = 2P = 200 – 2T/3.c. Since tax revenue is equal to T x Q and Q = 200 - 2T/3, tax revenue equals200T - 2T2/3. Figure 9 shows a graph of this relationship. Tax revenue is zero at T = 0and at T = 300.Figure 9Chapter 8 /Application: The Costs of Taxation 163d. As Figure 10 shows, the area of the triangle (laid on its side) that represents thedeadweight loss is 1/2 x base x height, where the base is the change in the price, which is the size of the tax (T) and the height is the amount of the decline in quantity (2T/3). So the deadweight loss equals 1/2 x T x 2T/3 = T2/3. This rises exponentially from 0 (when T = 0) to 45,000 when T = 300, as shown in Figure 11.Figure 10Figure 11e. A tax of $200 per unit is a bad idea, because it's in a region in which tax revenue isdeclining. The government could reduce the tax to $150 per unit, get more tax revenue ($15,000 when the tax is $150 versus $13,333 when the tax is $200), and reduce thedeadweight loss (7,500 when the tax is $150 compared to 13,333 when the tax is $200).。