Accruals Quality and Internal Control
- 格式:pdf
- 大小:278.53 KB
- 文档页数:31
The effect of internal control de ficiencies on the usefulness of earnings in executive compensation ☆Kareen E.Brown a ,1,Jee-Hae Lim b ,⁎a School of Accounting and Finance,University of Waterloo,200University Ave W (HH 289D),Waterloo,ON,Canada N2L 3G1bSchool of Accounting and Finance,University of Waterloo,200University Ave W (HH 289G),Waterloo,ON,Canada N2L 3G1a b s t r a c ta r t i c l e i n f o Keywords:Sarbanes –Oxley ActInternal control material weaknesses (ICMW)Executive compensation EarningsSince SOX 404disclosures are informative about earnings,and due to the widespread practice of using earnings-based measures in executive compensation,this study examines whether reports of internal control material weaknesses (ICMW)under SOX 404in fluence firms'reliance on earnings in tying executive pay to ing 391(366)firm-year observations with reported ICMW and 3648(3138)firm-year obser-vations for CEOs (CFOs)reporting NOMW under SOX 404,we find a decreased strength in the association be-tween earnings and executives'(CEO and CFO)compensation when the firm reports an ICMW,and as the number of reported ICMW increases.In addition,we find this decreased weight on earnings for the more se-vere Company-Level than Account-Speci fic material weaknesses.Our study suggests that the ICMW report under SOX 404provides incremental information for executive compensation beyond that contained in reported earnings.©2012Elsevier Ltd.All rights reserved.1.IntroductionThe accounting scandals at firms such as Enron and WorldCom highlighted de ficiencies in corporate governance that were charac-terised by low financial reporting quality and disproportionate pay-for-performance.2To discipline firms and restore investor con fidence,legislative authorities enacted the Sarbanes –Oxley Act.Among the re-forms is Section 404of SOX (SOX 404)which requires both the manage-ment and the external auditor to report on the adequacy of a firm's internal control over financial reporting.Prior research shows that,relative to non-disclosing firms,firms reporting material weaknesses in internal control (ICMW)have inferior accruals and earnings quality (Ashbaugh-Skaife,Collins,Kinney,&LaFond,2008;Bedard,2006;Doyle,Ge,&McVay,2007b ),and lower earnings –returns coef ficients (Chan,Farrell,&Lee,2008).Given the fact that SOX 404disclosures are informative about earnings,and due to the widespread practice of using earnings-based measures in executive compensation,this studyexamines whether reports of ICMW under SOX404in fluence firms're-liance on earnings in tying executive pay to performance.A long line of research shows that earnings-based performance measures are commonly used to motivate and reward executives be-cause such measures correspond to manager actions (Gjesdal,1981).However,there are two drawbacks to using earnings to evaluate ex-ecutive performance.First,because executives know how their ac-tions impact earnings,they can manipulate this measure to increase their wealth.Second,earnings do not fully re flect the long-term im-plications of recent executive decisions.Based on these factors,firms place varying weights on earnings in compensating their exec-utives,and the weights are determined by how sensitive earnings are to effort and on the precision ,or lack of noise,with which it re-flects executives'actions (Banker &Datar,1989;Lambert &Larcker,1987).However,there is evidence that CEOs are shielded from certain negative events,such as firm restructuring (Dechow,Huson,&Sloan,1994),or above the line losses (Gaver &Gaver,1998).Our main focus of inquiry is signi ficant because it builds on this line of research by showing that the sensitivity of compensation –performance relations varies cross-sectionally with the quality of the system producing the earnings information.Weak internal controls potentially permit accounting errors to occur and go undetected,increasing unintentional errors in accrual estimation and/or facilitating intentional earnings management (Doyle et al.,2007b ).A report of an internal control de ficiency,there-fore,signals that the manager is unable to provide reasonable assur-ance regarding the quality of reported earnings (Ashbaugh-Skaife et al.,2008;Bedard,2006;Chan et al.,2008;Doyle et al.,2007b ).Using the sensitivity-precision framework,the errors introduced byAdvances in Accounting,incorporating Advances in International Accounting 28(2012)75–87☆Data availability:Data used in this paper are publicly available and also can be requested from the authors.⁎Corresponding author.Tel.:+15198884567x35702;fax:+15198887562.E-mail addresses:kebrown@uwaterloo.ca (K.E.Brown),jh2lim@uwaterloo.ca (J.-H.Lim).1Tel.:+15198884567x35776;fax:+15198887562.2For example Hall and Liebman (1998)report a 209%increase in CEO mean salary in large US firms from 1980to 1994,and Bebchuk and Grinstein (2005)document a 146%increase in CEO pay from 1993to 2003in S&P 500firms.Bebchuk and Fried (2004)ad-vance the theory that soaring executive pay is the result of managementpower.0882-6110/$–see front matter ©2012Elsevier Ltd.All rights reserved.doi:10.1016/j.adiac.2012.02.006Contents lists available at SciVerse ScienceDirectAdvances in Accounting,incorporating Advances inInternational Accountingj o u r na l h o me p a g e :ww w.e l s e v i e r.c o m /l oc a t e /a di a cweak internal controls are likely to result in earnings that capture ex-ecutives'effort with low precision,diminishing its use as an assess-ment tool for evaluating managers'performance.Motivated by the optimal contracting hypothesis,we posit thatfirms with ICMW report earnings with lower precision-sensitivity.The purpose of this study is to examine whetherfirms reporting ICMW place relatively less weight on earnings compared tofirms reporting no ICMW(NOMW).In other words,whether ICMW reports influence compensation contracts is an empirical issue because,al-though ICMWfirms report lower earnings–returns coefficients (Chan et al.,2008),prior research does not suggest any direct associ-ation between the valuation role of earnings and its usefulness in compensating executives(Bushman,Engel,&Smith,2006).Under the null hypothesis,the sensitivity of executive compensation to earnings is unaffected by internal control deficiency.Consistent with prior research,we also examine the weight placed on earnings forfirms reporting two different types of ICMW:Account-Specific and Company-Level weaknesses(Doyle,Ge,&McVay,2007a, b,Doyle et al.,2007b).Account-Specific(AS)material weaknesses arise from routinefirm operations and may be resolved by additional substantive auditing procedures.When AS material weaknesses are identified,executives or auditors can easily audit around them by per-forming additional substantive pany-Level(CL)mate-rial weaknesses,on the other hand,are less easily resolved by auditor involvement and result from lack of resources or inexperience in main-taining an effective control system.Due to the pervasiveness of CL ma-terial weaknesses,the scope of audit efforts needs to be frequently expanded to deal with these more serious concerns regarding the reli-ability offinancial statements(Moody's,2006;PCAOB2004).The extent to which auditors are able to mitigate the negative effect on earnings of these two types of weaknesses would suggest less noise/greater preci-sion in earnings from Account-Specific relative to Company-Level weaknesses.The impact of precision times sensitivity on the weight of earnings for Account-Specific pany-Level material weaknesses is therefore the second empirical question.Using391(366)firm-year observations with reported ICMW and 3648(3138)firm-year observations for CEOs(CFOs)reporting NOMW under Section404of SOX,wefind a decreased strength in the associa-tion between earnings and CEO compensation when thefirm reports an ICMW,and as the number of reported ICMW increases.Our results are also robust to controls for variousfirm characteristics that prior studies have found to influence the role of earnings in compensation contracts,including earnings quality proxies such as earnings persis-tence(Baber,Kang,&Kumar,1998)and corporate governance charac-teristics(Chhaochharia&Grinstein,2009).In addition,for CL material weaknesses,wefind evidence of a lower strength in the earnings–compensation relation for the CEOs.Wefind no such result with AS material weaknesses suggesting that only CL weaknesses affect the weight placed on earnings in compensating CEOs.This study makes two contributions.First,it contributes to existing literature by making an examination of the role of earnings as a per-formance measure in executive compensation contracts(Bushman et al.,2006;Sloan,1993;among others),and by examining how infor-mation on the quality of afirm's internal controls influences the earn-ings–compensation relation.We confirm that weak internal controls result in a diminished role for accounting measures in the CEO com-pensation relation,consistent with optimal contracting.Specifically, it is thefirms with CL weaknesses that reduce the weight on earnings in CEO cash compensation.Overall,ourfindings suggest that the in-formation in the ICMW report is incremental to,or more timely than,that provided by discretionary accruals or earnings persistence measures.Second,our study extends a growing body of literature on the rela-tion between executive compensation and ICMW in the post-SOX era. Carter,Lynch,and Zechman(2009)show that the implementation of SOX in2002led to a decrease in earnings management,and thatfirms responded by placing more weight on earnings in bonus contracts for CEOs and CFOs in the post-SOX period.Another study by Hoitash, Hoitash,and Johnstone(2009)suggests that the compensation of the CFO,who has primary responsibility for the quality of thefirm's internal controls,is penalized for reports of ICMW.Since prior evidence shows, and stresses the importance of,a performance-based compensation penalty for internal control quality as a non-financial performance mea-sure in the evaluation of executives,our study further investigates whether an ICMW impacts the weight of earnings in compensation con-tracts under the mandate of SOX404.We show thatfirms consider the strength of an earnings generation system and specifically choose to re-duce emphasis on earnings-based performance measures in determin-ing CEOs'cash compensation.The next section of this paper provides background information on the internal control disclosure practices required by the Sar-banes–Oxley Act,discusses the usefulness of earnings as a perfor-mance measure and further develops our hypotheses.The third section describes our sample and research design.The fourth section presents our descriptive statistics,results and sensitivity analyses. Thefifth section concludes the paper.2.Prior research and hypothesisSection404of SOX is one of the most visible and tangible changes tofirms'internal control systems in recent times[(Public Company Accounting Oversight Board(PCAOB)(PCAOB),2004)].3The pivotal requirement of Section404is that management assess the effective-ness of thefirm's internal controls overfinancial reporting and in-clude this information in thefirm's annualfinancial statements.This regulation increases scrutinization by thefirm's auditors because the manager assessments must then be separately attested to by the auditor.One of the benefits of the disclosures under Section404is that internal control information is now readily available and may be informative as a non-financial measure of executive performance (Hoitash et al.,2009).Numerous studies have examined the determinants and conse-quences of ICMW.Early studies document an association between ICMW andfirm characteristics,such as business complexity,organi-zational change,firm size,firm profitability and investment of re-sources in accounting controls(Ashbaugh-Skaife,Collins,&Kinney, 2007;Doyle et al.,2007a;Ge&McVay,2005).The implementation of SOX Section404has resulted in higher audit fees(Hoitash, Hoitash,&Bedard,2008;Raghunandan&Rama,2006),longer audit delays(Ettredge,Li,&Sun,2006)and improved audit committee quality(Krishnan,2005).Several studiesfind negative and significant cumulative abnormal returns(Beneish,Billings,&Hodder,2008;De Franco,Guan,&Lu,2005)and lower quality of earnings(Ashbaugh-Skaife et al.,2008;Chan et al.,2008)after SOX404disclosures.Closely related to our study is the literature that examines the as-sociation between earnings quality and ICMW.Chan et al.(2008) document a greater use of positive and absolute discretionary ac-cruals forfirms reporting ICMW than forfirms receiving a favourable report.Ashbaugh-Skaife et al.(2008)alsofind thatfirms reporting ICMW after the inception of SOX have lower quality accruals and sig-nificantly larger positive and negative abnormal accruals,relative to controlfirms.Both Ashbaugh-Skaife et al.(2008)and Bedard(2006)find evidence of improvements in earnings quality after the remedia-tion of ICMW under Section404,whereas Doyle et al.(2007b)claim lower-quality earnings under Section302,but not Section404.3SOX404sets separation implementation dates for“acceleratedfilers”(primarily largefirms),for“non-acceleratedfilers”(smallerfirms),and for foreignfirms.Specifi-cally,Section404rules required acceleratedfilers to comply beginning in2004,where-as compliance for non-acceleratedfilers and foreignfirms began in phases starting in 2006and ending in2009,at which time those two groups reach full compliance.76K.E.Brown,J.-H.Lim/Advances in Accounting,incorporating Advances in International Accounting28(2012)75–87A recent study suggests thatfirms place greater weight on earn-ings in determining incentive pay after the passage of SOX,and other concurrent reforms,because the more stringent reporting envi-ronment in the post-SOX period of2002results in less earnings man-agement(Carter et al.,2009;Hoitash et al.,2009).Carter et al.(2009) report an increase in the weight placed on earnings changes as a de-terminant of executive compensation,and a decrease in the propor-tion of compensation via salary after SOX,that is larger for CEOs and CFOs than it is for other executives.In addition,Hoitash et al. (2009)claim that changes in CFO total compensation,bonus compen-sation and equity compensation are negatively associated with dis-closures of ICMW,suggesting a performance-based compensation penalty for poor internal controls in the evaluation of CFOs.However, the empirical literature has not yet addressed whether disclosures of ICMW in the post-SOX era influence the importance of earnings in de-termining executive pay.3.The role of earnings in executive compensation contractsPrior research has identified accounting earnings and stock returns as the two implicitfirm performance indicators commonly used to determine executive compensation.Accounting earnings are useful for determining executive compensation because they shield managers from market-wide variations infirm value that are beyond executives'control(Sloan,1993).Stock returns are useful because they anticipate future cashflows and reflect the long-term economic consequences of managers'actions(Sloan,1993).As a result,stock returns capture those facets of executive effort that are missing in earnings but are associated with compensation(Clinch,1991; Lambert&Larcker,1987).The usefulness of thefirm performance measures,such as earnings or returns in executive contracts,is deter-mined by its precision and sensitivity(Banker&Datar,1989),and the optimal weight on a performance measure increases as the precision times sensitivity(or the signal-to-noise ratio)increases.Sensitivity re-fers to the responsiveness of the measure to actions taken by the manager,and precision reflects the noise or variance of the perfor-mance measure conditional on the manager's actions.Consistent with prior studies,we model executive compensation as a function of both accounting earnings and returns.Based on this model specification,the weight on earnings as a performance measure,there-fore,is a function of its precision and sensitivity,relative to stock returns,in providing information about the efforts of managers.4.The impact of ICMW on the earnings–compensation relationIn this study we argue that,for several reasons,an ICMW report indicates that reported earnings capture executives'effort with less precision and is less sensitive to managerial effort thanfirms not reporting an ICMW.First,managers are potentially more likely to use accruals to intentionally bias earnings if internal controls are weak.A more effective internal control system allows less managerial discretion in the accrual process(Ashbaugh-Skaife et al.,2008;Doyle et al.,2007b),and thus reduces the ability of the management to ma-nipulate accruals for the purpose of increasing their compensation.Second,weak internal controls potentially permit accounting er-rors to occur and go undetected(Doyle et al.,2007b).An ICMW can impair the sensitivity of the earnings measure for executive compen-sation because the earnings offirms with ICMW may reflect delayed or untimely information(Chan et al.,2008).Further,the noise regard-ing managers'performance in reported earnings due to deficient in-ternal controls are likely to be unpredictable and may not be reflected in the properties of previously reported earnings numbers. For these reasons,the precision times sensitivity of earnings with regards to the manager's actions forfirms reporting ICMW is pre-dicted to be lower than that offirms not reporting a material weak-ness.If ICMW reports provide information about the precision-sensitivity relation of earnings,then they have the potential to impact the use of earnings in designing executive compensation.It is possible that the ICMW report provides no new information to compensation committees or that the committees fully adjust for earnings characteristics in designing executive compensation con-tracts.In such case,we wouldfind no association between executive cash compensation and reported earnings.However,if effective inter-nal controls provide information on the sensitivity-precision of earn-ings,then an ICMW report has the potential to impact the strength of the relation between accounting earnings and executive compensa-tion.We predict that the relation between executive compensation and accounting earnings is lower forfirms that report ICMW.This leads to ourfirst hypothesis:H1.Firms that report ICMW have lower accounting earnings–executive compensation relation thanfirms with NOMW.5.The impact of ICMW type on theearnings–compensation relationDepending on the underlying cause of the ICMW,additional monitor-ing mechanisms or substantive testing can mitigate the negative effects of poor internal controls and impact the weight placed on earnings in exec-utive compensation contracts.Consistent with Doyle et al.(2007a,b),we categorize ICMW disclosures into two categories that may have different impacts on the earnings–compensation relation.First,Account-Specific (AS)material weaknesses arise from routinefirm operations and relate to controls over specific account balances,such as accounts receivable,in-ventory,and legal proceedings,or transaction-level processes.When AS material weaknesses are identified,executives or auditors can easily audit around them by performing additional substantive procedures.In contrast,Company-Level(CL)material weaknesses reflect is-sues beyond the direct control of the executives and relate to more macro-level controls such as the control environment,general per-sonnel training,organizational-level accountability,or the overallfi-nancial reporting processes.Due to the pervasiveness of CL material weaknesses,the scope of audit efforts needs to be frequently expand-ed to deal with these more serious concerns regarding the reliability of thefinancial statement(Moody's,2006;PCAOB,2004).We there-fore expect a more negative association between disclosures of Company-Level material weaknesses and the weights of earnings in the compensation contract relative to Account-Specific weaknesses. pany-Level ICMW have a stronger negative association with the accounting earnings–executive compensation relation than do Account-Specific ICMW.6.Sample selection and research design6.1.Sample selectionWe use several sources of data:(1)Audit Analytics,(2)Compu-stat,(3)CRSP,(4)ExecuComp,(5)firms'financial statements and (6)Lexis-Nexis Academic Universe.We start by collecting data from Section404disclosures of auditors'opinions on ICMW overfinancial reporting fromfirms'Form10-Kfilings from January2004to Decem-ber2006.4To ensure that the identified acceleratedfilers under SOX 404pertain to a material weakness in internal control,we follow up our initial search offirms that receive adverse opinions on their ICMW in the Audit Analytics database with a manual check through Lexis-Nexis.For our sample period,we identify9899observations 4According to PCAOB(Standard No.2),three types of internal control overfinancial reporting exist:(1)a control deficiency,(2)a significant deficiency,or(3)material weaknesses.Since publicfirms are only required to disclose material weaknesses in Section404,our main empirical test uses all Section404reports available on Audit An-alytics,which includes3864firm-year observations from2004to2006.77K.E.Brown,J.-H.Lim/Advances in Accounting,incorporating Advances in International Accounting28(2012)75–87with clean reports and1399observations that received adverse opin-ions on theirfinancial reporting with at least one type of internal con-trol problem as a material weakness.After controlling for duplicates or non-acceleratedfilers from2004to2006,we validate1336adverse reports and9865clean reports for a total of11,201observations.5 Our research design examines the change in executive compensa-tion in the year following the ICMW.For ICMW in the years 2004–2006,we require compensation data for2004–2007to compute the change in compensation.We eliminate513ICMW and5999 NOMW(532ICMW and6415NOMW)firm-year observations for the CEO(CFO)due to missing salary and bonus data in thefirms'proxy statements or in ExecuComp.Next,we collect stock return and account-ing information from CRSP and Compustat respectively,resulting in a loss of399ICMW and129NOMW(405ICMW and223NOMW)firm-year observations for the CEO(CFO).Finally,we excludefirm-year observations from utility andfinancialfirms because these companies operate in unique regulatory environments that are likely to influence executive compensation.Thefinal sample for this study consists of 391(366)firm-year observations with ICMW and3648(3138)firm-year observations with NOMW for the CEO(CFO).We summarize our sample selection process in panel A of Table1.Panel B of Table1summarizes the ICMW subsample by the type of weakness.Following the recommendations of the PCAOB's Standard No.2and Moody's(Doss&Jonas,2004;Doyle et al.,2007a,b),two types of material weaknesses can be classified based on different ob-jectives.Our study identifiesfirms as having either an Account-Specific(AS)or Company-Level(CL)material weakness.6Of the391 (366)firm-year observations of ICMW reported subsample,162 (140)were Company-Level and229(226)were Account-Specific weaknesses for the CEO(CFO)subsample.Panel C of Table1summarizes the industry distribution of the CEO sample of391firm-years with ICMW and the3648firm-years without some kind of material weakness based on their two-digit SIC codes.The391ICMWfirm-years cover six industry groups.Among them,the Ser-vices industry has the highest number offirms,followed by the Machin-ery,Construction and manufacturing,and the Wholesale and retail industries.The industry distribution for3648NOMWfirm-years has the highest number of observations in the Services industry followed closely by the Machinery and Construction and manufacturing industries.6.2.Research designTo test H1,that predicts a lower strength in the earnings–compensation relation when thefirm reports an ICMW under Section 404of SOX,we use the following model(1):ΔCashComp i;t¼β0þβ1ICMW i;t−1þβ2ΔROA i;tþβ3RET i;tþβ4ICMW i;t−1⁎ΔROA i;tþβ5ICMW i;t−1⁎RET i;tþβ6LOSS i;tþβ7LOSS i;t⁎ΔROA i;tþβ8LOSS i;t⁎RET i;tþβ9SIZE i;tþβ10MTB i;tþβ11CEOCHAIR i;tþβ12IndAC i;tþβ13IndBD i;tþβ14BoardMeetings i;tþβ15AcctExp i;tþYEARþINDþεtð1ÞConsistent with prior studies,we focus on cash compensation be-cause almost allfirms explicitly use accounting measures as a deter-minant of cash bonus(Murphy,2000;Core,Guay,&Larcker,2003; Huson,et al.2012).No such evidence exists for the association be-tween equity-based pay and earnings because stock option grants are offered not only to reward executives but also to introduce con-vexity in executive compensation contracts,for retention purposes and because of tax andfinancial reporting costs(Core et al.,2003).7 Similar to Hoitash et al.(2009),our dependent variable is the change in salary plus bonus pay from year t−1to year t deflated by the beginning of the year salary in year t(ΔCashComp).Our indepen-dent variables are(1)an internal controls deficiency indicator vari-able(ICMW or CL/AS)at time t−1,(2)the percentage change in return on assets(ΔROA),(3)stock returns(RET)and(4)interaction terms between the internal controls deficiency indicator and the per-centage change in both ROA and stock returns.We include annual stock returns for the year t in the model specification because a mean-ingful association between compensation andfirm performance must include returns(Murphy,1998;Sloan,1993).The parameter estimateβ4on ICMW∗ΔROA examines H1.Under the null hypothesis that the sensitivity of executive compensation to earnings is unaffected by internal control deficiency,the parameter,β4would be insignificant.However,we predict that the weight assigned to earnings will decrease with ICMW disclosures.As such, we expect the estimateβ4for the interaction ICMW∗ΔROA to be neg-ative and significant.It is possible that,with poor internal controls,5After controlling for97duplicates or non-acceleratedfilers from2004to2006,we validate1336adverse reports(relating to452firms in2004;487firms in2005;and 397firms in2006)and9865clean reports(2478firms in2004;3478firms in2005; and3909firms in2006)for a total of11,201observations.6We want to thank one of the authors(Doyle et al.,2007a,b)for the conceptual foundations of these two types of ICMW and the coding validations.Our classification of a Company-Level vs.an Account-Specific material weakness is mutually exclusive. For example,if afirm has both Company-Level weaknesses and Account-Specific ma-terial weaknesses,then we code thefirm as having a Company-Level weakness(Doyle et al.,2007a).In addition,three or more Account-Specific material weaknesses are cod-ed Company-level Weaknesses(Doyle et al.,2007b,p.1149).Table1Sample selection and descriptive statistics(January2004–December2007).Panel A:Sample selection and sample compositionCEO subsample CFO subsampleICMW NOMW10-Kfilings from Audit Analytics andsubsequent manual review2004–20061399989913999899 Less:Duplicate observations(63)(34)(63)(34) SOX404disclosure data2004–20061336986513369865 Missing compensation data2004–2007(513)(5999)(532)(6415) Missing Compustat&CRSP data2004–2007(399)(129)(405)(223) Less:Utilities&financialfirms2004–2007(33)(89)(33)(89) Testing H1&H239136483663138 Panel B:Samplefirms by types of ICMWCompany-Level(CL)Account-Specific(AS)CEO CFO CEO CFO 20046860108107 200560528886 200634283333 Panel C:Sample composition by industry(CEO sample)2-digitSICIndustry description ICMW NOMW#Obs.%#Obs.%10–13Mining11 2.8171 4.7 23–34Construction and manufacturing6516.677521.2 35–39Machinery9724.879721.8 42–49Transportation and utilities4411.349413.5 50–59Wholesale and retail4912.539210.7 72–87Services12532.0101927.97For these reasons any inferences that we draw about internal control weaknesses and the use of earnings from tests using equity based compensation would be incon-clusive.Additionally,the importance of earnings in determining executive cash based pay has increased in the post-Sox era,which is the period that we examine(Carter et al.,2009).78K.E.Brown,J.-H.Lim/Advances in Accounting,incorporating Advances in International Accounting28(2012)75–87。
Quality Assurance and Control质量保证和质量控制MICHAEL C. VANDERZWANPharmaceutical Technical, Roche Pharmaceuticals, Basel, SwitzerlandI. Introduction介绍. . . . . . . . . . . . . . . . . . . . . . . . . . . 235II. Defining and Assuring the Quality of the Active Pharmaceutical Ingredient 原料药质量的定义和保证. . . . . . . . . . . . . . . . . . 240III. The Regulations for Quality 质量监管. . . . . . . . . . . . . . . . . 245IV. The Quality Control and Quality Assurance Department质量控制和质量保证. . . . . . . . . . . . . . . . .273Appendix A附录. . . . . . . . . . . . . . . . . . . . . . . . . . . 280目录I. INTRODUCTION介绍 (4)A. The Product产品 (4)B. The Process工艺 (5)C. The Facilities设备 (5)D. The People人员 (6)E. The Quality Management Department质量管理部门 (6)F. The Regulatory Authorities 监管机构 (7)G. The Regulations法规 (8)II. DEFINING AND ASSURING THE QUALITY OF THE ACTIVE PHARMACEUTICAL INGREDIENT 原料药质量的定义和质量保证 (9)A. Defining the API Quality 原料药质量的界定 (10)B. Testing the API for Its Defined Attributes 原料药定义的属性测试 (11)C. Designing Quality into the Process 工艺中的质量设计 (12)D. Validation of the Process 工艺验证 (13)E. Reality实际 (15)III. THE REGULATIONS FOR QUALITY质量法规 ................ 错误!未定义书签。
Title: The Importance of Internal ControlsIn the contemporary business landscape, the significance of internal controls cannot be overstated. Internal controls refer to the policies, procedures, and mechanisms implemented by an organization to safeguard its assets, ensure accurate reporting, promote compliance with regulations, and foster operational efficiency.Firstly, internal controls are essential for safeguarding the assets of an organization. Through effective financial controls, segregation of duties, and regular audits, an organization can minimize the risk of fraud, misappropriation, and waste. This ensures that the organization's resources are utilized efficiently and for the intended purposes.Secondly, internal controls are vital for ensuring accurate financial reporting. Accurate financial statements are crucial for decision-making, investor confidence, and compliance with regulatory requirements. Internal controls help to ensure that all transactions are properly recorded, accounted for, and reported in a timely and accurate manner.Moreover, internal controls promote compliance with laws, regulations, and ethical standards. By establishing clear policies and procedures, organizations can ensure that their employees understand and adhere to the applicable rules and regulations. This not only reduces the risk of legal and reputational damage but also fosters a culture of integrity and trust.Furthermore, internal controls contribute to operational efficiency. By identifying and addressing bottlenecks, waste, and inefficiencies, organizations can improve their operational performance and enhance their profitability. Effective internal controls can also reduce the cost of compliance by automating routine tasks and minimizing the need for manual intervention.In conclusion, internal controls are an indispensable aspect of any successful organization. They safeguard assets, ensure accurate reporting, promote compliance, and foster operational efficiency. By establishing and maintaining robust internal controls, organizations can create a sustainable competitive advantage in today's challenging business environment.。
内部控制英文文献目录1. 内部控制管制对盈余质量的影响:来自德国的证据( March 2008 )The effect of internal control regulation on earnings quality: Evidence from Germany2. 内部控制制度如何影响财务报告?( Altamuro ,June 24, 2009)How Does Internal Control Regulation Affect Financial Reporting3. 财务报告内部控制缺陷的决定因素( Doyle ,May 15, 2006)Determinants of weaknesses in internal control over financial reporting4. 应计质量与财务报告内部控制( Doyle,January 24, 2007)Accruals Quality and Internal Control over Financial Reporting5. SOX 内部控制缺陷对公司风险与权益资本成本的影响( Ashbaugh-Skaife ,June 10, 2008) The Effect of SOX Internal Control Deficiencies on Firm Risk and Cost of Equity6. 审计委员会质量、审计师独立性与内部控制缺陷( Zhang)Audit Committee Quality, Auditor Independence, and Internal Control Weaknesses7. 小企业受益于内部控制缺陷审计师认证吗Do Small Firms Benefit from Auditor Attestation of Internal Control Effectiveness8. 内部控制缺陷的决定因素( Jahmani)Determinants of Internal Control Weaknesses In Accelerated Filers9. 操控性应计项目能帮助区分内部控制缺陷和欺诈吗Do Discretionary Accruals Help Distinguish between Internal Control Weaknesses and Fraud10. 财务报告质量对债务契约的影响:来自内部控制缺陷报告的证据 ( Costello ,September 4, 2010) The impact of financial reporting quality on debt contracting: Evidence from internal control weakness reports11. 重大内部控制缺陷与盈余管理Material Internal Control Weaknesses and Earnings Management in the Post-SOX Environment12. 家族企业的内部控制( April 2013 )Internal Controls in Family-Owned Firms ()13. 内部控制质量对企业并购绩效的影响研究Study on the Impact of the Quality of Internal Control on the Performance of M&A14. 内部控制质量与信用违约互换利差( January 2014)Internal Control Quality and Credit Default Swap Spreads15. 家族企业内部控制:特征和后果Internal Control in Family Firms: Characteristics and Consequences16. 内部控制报告与会计信息质量:洞察”遵守或解释的“内部控制制度Internal control reporting and accounting quality :Insight "comply-or-explain" internal control regime17. 内部控制报告与会计稳健性Internal Control Reporting and Accounting Conservatism18. 会计信息质量影响产品市场契约吗?来自政府合同授予的证据( March 2014 )Does Accounting Quality Influence Product Market Contracting? Evidence from Government Contract Awards19. 公司特征与财务报告质量:尼日利亚制造业上市公司的证据20. 内部控制情况与专家审计师选择The Association between Internal Control Situations and Specialist Auditor Choices21. 审计费用反应了控制风险的风险溢价吗( 2013-07 )Do Audit Fees Reflect Risk Premiums for Control Risk?22. 内部控制质量与审计定价Internal Control Quality and Audit Pricing under the Sarbanes-Oxley Act23. 内部控制缺陷与权益资本成本:来自萨班斯法案404 节披露的证据Internal Control Weakness and Cost of Equity: Evidence from SOX Section 404 Disclosures24. 内部控制缺陷与信息不确定性Internal Control Weaknesses and Information Uncertainty25. 重大内部控制缺陷与股票价格崩溃危险:来自404 条款披露的证据( May 2013 )Material Weaknessin Internal Control and Stock Price Crash Risk: Evidence from SOX Section 404 Disclosure 26. SOX 内部控制缺陷对公司风险与权益资本成本的影响The Effect of SOX Internal Control Deficiencies on Firm Risk and Cost of Equity27. 信用评级、债务成本与内部控制信息披露:SOX302 和SOX404 法的比较28. 萨班斯-奥克斯利法案对会计信息债务契约价值的影响The Effect of Sarbanes-Oxley on the Debt Contracting Value of Accounting Information29. 财务报告内部控制的不利意见与审计师解聘/辞职Adverse Internal Control over Financial Reporting Opinions and Auditor Dismissals/Resignations30. 新管理人员任命与随后的SOX 法案404 的意见Appointment of New Executives and Subsequent SOX 404 Opinion31. 萨班斯奥克斯利:有关萨班斯法案404 影响的证据Sarbanes-Oxley: The Evidence Regarding the Impact of Sox 40432. 内部控制有效性自愿披露的经济决定因素及后果:从首次公开发行的证据( March 2013 ) Economic Determinants and Consequences of Voluntary Disclosure of Internal Control Effectiveness: Evidence from Initial Public Offerings33. 非营利组织中内部控制问题的原因和后果The Causes and Consequences of Internal Control Problems in Nonprofit Organizations34. SOX 内部控制披露在公司控制权市场中的价值The Value of SOX Internal Control Disclosures in the Market for Corporate Control35. 内部控制缺陷与销售、一般的及行政费用的非对称性行为Internal Control Weakness and the Asymmetrical Behavior of Selling, General, and Administrative Costs36. 内部控制缺陷及补救措施披露对投资者感知的盈余质量的影响The Impact of Disclosures of Internal Control Weaknesses and Remediation on Investor-Perceived Earnings Quality37. 内部控制缺陷与美国上市的中国公司与美国公司的审计师SOX Internal Control Deficiencies and Auditors of U.S.-Listed Chinese versus U.S. Firms38. 内部控制信息披露与代理成本—来自瑞士的非金融类上市公司的证据( January 2013) Internal Control Disclosure and Agency Costs Evidence from Swiss listed non-financial Companies39. 萨班斯奥克斯利法案与公司投资:来自自然实验的新证据The Sarbanes-Oxley Act and Corporate Investment: New Evidence from a Natural Experiment40. 国内投资者保护、所有权结构与交叉上市公司遵守SOX 要求披露内部控制缺陷Home Country Investor Protection, Ownership Structure and Cross-Listed Firms 'Compliance with SOX-Mandated Internal Control Deficiency Disclosure41. 审计师对披露重大缺陷相关风险的看法Auditors ' Percenpsti o f the Risks Associated with Disclosing Material Weaknesses42. 交叉上市公司提供与美国公司相同质量的披露?来自萨班斯-奥克斯利法案302 条款下的内部控制缺陷信息披露的证据Do cross-listed firms provide the same quality disclosure as U.S. firms? Evidence from the internal control deficiency disclosure under Section 302 of the Sarbanes-Oxley Act43. 内部控制缺陷与并购绩效Internal Control Weaknesses and Acquisition Performance44. 萨班斯-奥克斯利法案302 条款下的内部控制缺陷对审计费用的影响The Effect of Internal Control Weakness under Section 404 of the Sarbanes-Oxley Act on Audit Fees45. 审计师对财务报告内部控制的评价对审计费用、债务成本及净遵从收益The Effect of Auditors ' Assessment of Internal Control of over Financial Reporting on Audit Fees, Cost of Debt and Net Compliance Benefit46. 上市公司披露的信息含量与萨班斯-奥克斯利法案Information Content of Public Firm Disclosures and the Sarbanes-Oxley Act47. 财务错报与股票市场的契约:从增发的证据Financial Misstatements and Contracting in the Equity Market: Evidence from Seasoned Equity Offerings48. 公司治理质量与SOX 302 条款下内部控制报告Corporate Governance Quality and Internal Control Reporting Under Sox Section 30249. 审计委员会质量、审计师独立性与内部控制缺陷Audit Committee Quality, Auditor Independence, and Internal Control Weaknesses50. SOX404 条款的影响:成本,盈余质量与股票价格The Effect of SOX Section 404: Costs, Earnings Quality, and Stock Prices51. 内部控制缺陷与银行贷款契约:来自SOX404 条款披露的证据Internal Control Weakness and Bank Loan Contracting: Evidence from SOX Section 404 Disclosures52. 审计师对财务报告内部控制的决策:分析、综合和研究方向Auditors I'nternal Control Over Financial Reporting Decisions: Analysis, Synthesis, and Research Directions 53. 应计质量与财务报告内部控制( Doyle ,The Accounting Review, forthcoming )Accruals Quality and Internal Control over Financial Reporting54. 业绩基础CEO 和CFO 薪酬对内部控制质量的影响The impact of performance-based CEO and CFO compensation on internal control quality55. 内部控制重大缺陷与CFO 薪酬Internal Control Material Weaknesses and CFO Compensation56. 财务报告内部控制缺陷的决定因素Determinants of weaknesses in internal control over financial reporting57. 内部控制与管理指南Internal Control and Management Guidance58. 2002 萨班斯-奥克斯利法案302 条款下内部控制缺陷的市场反应以及这些缺陷的特征Market Reactions to the Disclosure of Internal Control Weaknesses and to the Characteristics of thoseWeaknesses under Section 302 of the Sarbanes Oxley Act of 200259. 自愿报告内部风险管理和控制系统的经济激励Economic Incentives for Voluntary Reporting on Internal Risk Management and Control Systems60. 后萨班斯法案时代审计意见的信息含量The information content of audit opinions in the post-sox era61. 上市公司披露的信息含量与萨班斯-奥克斯利法案( April, 2010 )Information Content of Public Firm Disclosures and the Sarbanes-Oxley Act62. 信息摩擦如何影响公司资产流动性的选择?萨班斯法案404 条款的影响How do Informational Frictions Affect the Firm s Choice of A'sset Liquidity? The Effect of SOX Section 404 63. 已审计的信息披露给资本市场参与者带来利益是什么( December 19, 2013)What are the benefits of audited disclosures to equity market participants64. 诉讼风险与审计定价:公众股权的作用( January 7, 2013)Litigation Risk and Audit Pricing: The Role of Public Equity65. 萨班斯-奥克斯利法案对IPO 和高收益债券发行人的影响The Impact of Sarbanes-Oxley on IPOs and High Yield Debt Issuers66. 来自金融危机的公司治理的经验教训The Corporate Governance Lessons from the Financial Crisis67. 谁对企业欺诈吹口哨Who Blows the Whistle on Corporate Fraud68. 内部控制缺陷与现金持有价值Internal Control Weakness and Value of Cash Holdings69. 民族文化和制度环境对内部控制信息披露的影响The impact of national culture and institutional Environment on internal control disclosures70. 财务报告质量与权益资本成本之间联系的讨论:一些个人的意见( June 6, 2013)Some Personal Observations on the Debate on the Link between Financial Reporting Quality and the Cost of Equity Capital71. 使用盈利预测同时估计企业层面的权益资本成本和长期增长Using Earnings Forecasts to Simultaneously Estimate Firm-Specific Cost of Equity and Long-Term Growth72. 高管薪酬差距与权益资本成本Executive Pay Disparity and the Cost of Equity Capital73. 财务报告质量与公司债券市场(博士论文,Mingzhi Liu, 2011 )Financial Reporting Quality and Corporate Bond MarketsReferencesAboody, D., J. Hughes, and J. Liu. (2005) Earnings quality, insider trading, and cost of capital. Journalof Acco un ti ng Research 43: 651 -673.Akins, B., J. Ng and R. Verdi (2012) Investor competition over information and the pricing of information asymmetry. The Accounting Review 87(1): 35-58.Ali, A., A. Klein and J. Rosenfeld. (1992) Analysts ' use of information abouttrpaenrsmitaonryent andearnings components in forecasting annual EPS. The Accounting Review 67: 183-198.Amihud, Y., and H. Mendelson. (1986) Asset pricing and the bid-ask spread. Journal of Financial Econo mics 17: 223 —49.Artiach, T. and P. Clarkson. (2011) Disclosure, conservatism and the cost of equity capital: A review of the foundation literature. Accounting and Finance 51(1): 2-49.Ashbaugh-Skaiffe, H., D. Collins, W. Kinney, Jr., and R. LaFond (2009) The effect of SOX internal control deficiencies on firm risk and cost of equity. Journal of Accounting Research 47(1): 1-43.Armstrong, C., J. Core, D. Taylor and R. Verrecchia (2011) When does information asymmetry affect the cost of capital? Journal of Accounting Research 49(1): 1-40.Balakrishnan, K., R. Vashishtha and R. Verrecchia (2012) Aggregate competition, information asymmetry and cost of capital: Evidence from equity market liberalization. Working paper, University of Pennsylvania.Barron, O., O. Kim, S. Lim and D. Stevens (1998) Using analysts forecasts to measure properties on analysts ' information environmeTnth.e Accounting Review 73: 421-433.Barry, C., and S. Brown. (1985) Differential information and security market equilibrium. Journal of Financial and Quantitative Analysis 20: 407 T22.Barth, M., W. Beaver, and W. Landsman (2001) The relevance of value-relevance literature for financial accounting standard setting: Another view, Journal of A”ccounting and Economics (Sept): 77-104.Barth, M., Y. Konchitchki and W. Landsman (2013) Cost of capital and earnings transparency. Journal of Accounting and Economics , forthcoming.Beyer A., D. Cohen, T. Lys and B. Walther (2010) The financial reporting environment: Review of the recent literature. Journal of Accounting and Economics 50: 296-343.Bhattacharya, N., F. Ecker, P. Olsson, and K. Schipper (2012) Direct and mediated association among earnings quality, information asymmetry, and the cost of capital, The Accounting Review 87(2): 449-482. Botosan, C. (1997) Disclosure level and the cost of equity capital. The Accounting Review 72: 323 -350. Botosan, C., and M. Plumlee. (2002) A re-examination of disclosure level and the expected cost of equity capital. Journal of Accounting Research 40: 21 ZO.Botosan, C., M. Plumlee and Y. Xie (2004) The role of information precision in determining the cost of equity capital. Review of Accounting Studies 9 (2-3): 233-259.Botosan, C., and M. Plumlee. (2005) Assessing alternative proxies for the expected risk premium. The Accounting Review 80: 21-53.Botosan, C., M. Plumlee and H. Wen. (2011) The relation between expected returns, realized returns, and firm risk characteristics. Contemporary Accounting Research 28(4): 1085-1122.Brown, P. and T. Walter (2012) The CAPM: Theoretical validity, empirical intractability and practical applications. Abacus 1-7.Callahan, C., R. Smith and A. Spencer (2012) An examination of the cost of capital implications of FIN 46. The Accounting Review 87(4): 1105-1134.Chava, S., and A. Purnanandam (2010) Is default risk negatively related to stock returns? Review of Financial Studies 23: 2523-2559.Chen, S., B. Miao and T. Shevlin (2013) A new measure of disclosure quality: The level of disaggregation of accounting data in annual reports. Working paper, The University of Texas at Austin. Christensen, P., L. de la Rosa and G. Feltham (2010) Information and the cost of capital: An ex ante perspective. The Accounting Review 85(3): 817-848.Clarkson, P., J. Guedes and R. Thompson (1996) On the diversifiability, observability, and measurement of estimation risk. Journal of Financial and Quantitative Analysis 31: 69084.Claus, J., and J. Thomas (2001) Equity premia as low as three percent? Evidence from analysts earnings forecasts for domestic and international stock markets. The Journal of Finance 56(5): 1629-1666.Clinch G., and B. Lombardi (2011) Information and the cost of capital: the Easley- O' Hara(2004) modelwith endogeneous information acquisition. Australian Journal of Management 36(5): 5-14.Coles, J., U. Loewenstein, and J. Suay. (1995) On equilibrium pricing under parameter uncertainty. The Journal of Financial and Quantitative Analysis 30: 347 -374.Core, J., (2001) A review of the empirical disclosure literature: Discussion. Journal of Accounting and Economics 31: 441-456.Core, J., W. Guay and R. Verdi, (2008) Is accruals quality a priced risk factor? Journal of Accountingand Economics 46: 2-22.Daniel, K. and S. Titman, 1997, Evidence on the characteristics of cross-sectional variation in common stock returns. Journal of Finance 52, 1-33.Daske, H., L Hail, C. Leuz and R. Verdi (2008) Mandatory IFRS reporting around the world: Early evidence on the economic consequences. Journal of Accounting Research 46: 1085-1142.Daske, H., L Hail, C. Leuz and R. Verdi, (2013) Adopting a label: Heterogeneity in the economic consequences around IAS/IFRS adoptions. Journal of Accounting Research 51(3):495-548.Dechow, P. and I. Dichev. (2002) The quality of accruals and earnings: the role of accrual estimation errors. The Accounting Review 77 (Supplement): 35-59.Dechow, P., W. Ge and C. Schrand (2010) Understanding earnings quality: A review of the proxies, their determinants and their consequences. Journal of Accounting and Economics 50: 344-401.Dhaliwal, D., L. Krull and W. Moser (2005) Dividend taxes and implied cost of equity capital. Journal of Accounting Research 43(5): 675-708.Dhaliwal, D., L. Krull and O. Li (2007) Did the 2003 Tax Act reduce the cost of equity capital? Journal of Accounting and Economics 43(1): 121-150.Diamond, D., and R. Verrecchia. (1991) Disclosure, liquidity, and cost of capital. Journal of Finance 46: 1325 -59. Dye, R., (2001) An evaluation of “ essayson disclosure a”nd the disclosure literature in accounting. Journal of Accounting and Economics 32: 181-235.Easley, D., S. Hvidkjaer and M. O'Hara.(2002) Is information risk a determinant of asset returns. Journal of Finance 57: 2185-2221.Easley, D., and M. O' Hara. (2004) Information and the cost of capital. Journal of Fi nance 59: 1553-1583. Easton, P. (2004) PE ratios, PEG ratios, and estimating the implied expected rate of return on equity capital. The Accounting Review 79(1): 73-96.Easton, P., and S. Monahan. (2005) An evaluation of accounting based measures of expected returns. The Accounting Review 80: 501 -538.Easton, P., and S. Monahan. (2010) Evaluating accounting-based measures of expected returns: Easton and Monahan and Botosan and Plumlee redux. Working paper, University of Notre Dame.Ecker, F., J. Francis, I. Kim, P. Olsson, and K. Schipper (2006). A returns-based representation of earnings quality. The Accounting Review 81: 749 -780.Fama, E., and J. MacBeth. 1973. Risk, return, and equilibrium: Empirical tests. Journal of Political Economy 81: 607-636.Fama, E., and K. French. (1992) The cross-section of expected stock returns. Journal of Finance 47(2): 427-465. Fama, E., and K. French. (1993) Common risk factors in the returns on bonds and stocks. Journal of Financial Economics 33: 3-56.Francis, J., LaFond, R., Olsson, P., and K. Schipper. (2004) Costs of equity and earnings attributes. The Accounting Review 79: 967-1010.Francis, J., LaFond, R., Olsson, P., and K. Schipper. (2005) The market pricing of accruals quality. Journal of Accounting & Economics 39: 295-327.Francis, J., Nanda, D., and P. Olsson. (2008) Voluntary disclosure, information quality, and costs of capital. Journal of Accounting Research 46 (1): 53-99.Gebhardt,W., C. Lee and B. Swaminathan (2001) Towards an ex ante cost of capital. Journal of Accounting Research 39(1): 135-176.Goh, B-W., J. Lee, C-Y. Lim and T. Shevlin (2013) The effect of corporate tax avoidance on the cost of equity. Working paper, Singapore Management University.Gow, I., G. Ormazabal and D. Taylor (2010) Correcting for cross-sectional and time-series dependence in accounting research The Accounting Review 85(2): 483-512.Gray, P., P. Koh and Y. Tong (2009) Accruals quality, information risk and cost of capital: Evidence from Australia. Journal of Business Finance and Accounting 36(1-2): 51-72.Guay, W., S.P. Kothari and S. Shu (2011) Properties of implied cost of capital using analysts forecasts. Australian Journal of Management 36(2): 125-149.Hail, L. (2002) The impact of voluntary corporate disclosure on the ex-ante cost of capital for Swiss firms European Accounting Review 11: 741-773.Hail, L., and C. Leuz. (2006) International differences in the cost of equity capital: Do legal institutions and securities regulation matter? Journal of Accounting Research 44(3): 485-531.Healy, P., and K. Palepu (2001) Information asymmetry, corporate disclosure, and the capital markets: A review of the empirical disclosure literature. Journal of Accounting and Economics 31: 405-440. Hirshleifer, D., K. Hou, and S.H. Teoh (2012) The accrual anomaly: Risk or mispricing? ManagementScienee (58-2); 320 -335.Holthausen, R., and R. Watts (2001) The relevance of value-relevance literature for financial accounting standard setting. Journal of Accounting and Economics (Sept): 3-75.Hribar, P. and T, Jenkins. (2004) The effect of accounting restatements on earnings revisions and the estimated cost of capital. Review of Accounting Studies 9(2-3): 337-356.Hughes, J. S., J. Liu, and J. Liu. (2007) Information asymmetry, diversification, and cost of capital. The Accounting Review 82: 705-729.Hughes, J. S., J. Liu, and J. Liu. (2009) On the association between expected returns and implied cost of capital R”eview of Accounting Studies 14: 246-259.Hutchens, M. and S. Rego (2013) Tax risk and the cost of equity capital. Working paper, Indiana University. Hwang, L-S., W-J. Lee, S-Y. Lim and K-H. Park, (2013) Does information risk affect the implied cost of equity capital? An analysis of PIN and adjusted PIN. Journal of Accounting and Economics 55(2-3): 148-167.Kim, D., and Y. Qi (2010) Accruals quality, stock returns, and macroeconomic conditions. The Accounting Review 85(3): 937-978.Klein, R., and V. Bawa. (1977) The effect of estimation risk on optimal portfolio choice. Journal of Financial Economics 3: 215-231.Kothari, S.P., X. Li and J. Short. (2009) The effect of disclosures by management, analysts, and financial press oncost of capital, return volatility, and analyst forecasts: A study using content analysis. The Accounting Review82(5): 1255-1297.Kravet, T. and T. Shevlin. (2010) Accounting restatements and information risk. Review of Accounting Studies 15: 264-294.Kyle, A. (1985) Continuous auctions and insider trade. Econometrica 53(6): 1315-1335.Lambert, R., C. Leuz, and R. Verrecchia. (2007) Accounting information, disclosure, and the cost of capital. Journal of Accounting Research 45(2): 385-420.Lambert, R., C. Leuz, and R. Verrecchia. (2012) Information asymmetry, information precision, and the cost of capital. Review of Finance 16: 1-29.Lambert, R., (2009) Discussion of “onthe association between expected returns and implied cost of capital R”eview of Accounting Studies 14: 260-268.Leuz, C., and R. Verrecchia (2004) Firms ' capital allocatio n choices, in formati on qhuaCys tandcapital. Work ing paper, Uni versity of Penn sylva nia.Li, V., T. Shevli n and D. Shores (2013) Revisit ing the AQ measure of accrual quality. Work ing paper, Uni versityof Wash ington.Lys, T., and S. Sohn. (1990) The associati on betwee n revisi ons of finan cial an alyst forecastsearning and security price cha nges. Jour nal of Acco un ti ng and Econo mics 13: 341-363.Mashruwala, C. and S. Mashruwala (2011) The pric ing of accrual quality: January versus the rest of the year. TheAccou nting Review 86(4): 1349-1381.McInnis, J. (2010) Earnings smoothness, average returns and implied cost of equity capital. The Accou ntingReview 85(1): 315-341.Mohanram, P., and D. Gode (2013) Removing predictable analyst forecast errors to improve implied cost of equity estimates. Review of Acco un ti ng Studies 18: 443-478.Ogneva, M., K.R. Subramanyam, and K. Raghunandan (2007) Internal control weakness and cost of equity: Evidenee from SOX Section 404 disclosures. The Accou nti ng Review 82(5) :1255-1297.Ogneva, M., (2012) Accrual quality, realized returns, and expected returns: The importanee of con trolli ng forcash flow shocks, The Accou nting Review 87(4): 1415-1444.Peterse n, M., (2009) Estimati ng sta ndard errors in finance data pan els: Compari ng approaches. Reviewof Financial Studies 22(1): 435-480.Petkova, R. (2006) Do the Fama-Fre nch factors proxy for inno vati on in predictive variables? Journal of Finance61: 581-612.Reidl, E., and G. Serafeim (2011) In formati on risk and fair values: An exam in ati on of equity betas. Journal ofAccounting Research 49(4): 1083-1122.Strobl, G., (2013) Earnings manipulation and the cost of capital. Journal of Accounting Research, forthco ming. Verrecchia, R. (2001) Essays on disclosure. Journal of Accounting and Economics 32: 97-180.Vuolteenaho, T. (2002) What drives firm-level stock returns? The Journal of Finance 57: 233 -264.How Do Various Forms of Auditor Rotation Affect Audit Quality? Evidence from China内部控制质量、企业风险与权益资本成本一一理论分析与实证检验1. Accruals Quality and In ternal Con trol over Finan cial Report in g.Acco un ti ng Review, Oct2007, V ol.82 Issue52. Audit Committee Quality and Internal Control An Empirical Analysis.FullAccounting Review, Apr2005, Vol.80 Issue 23. Bala ncing the Dual Resp on sibilities of Busin ess Un it Con trollers Field and Survey Evide nee. Accounting Review, Jul2009, Vol. 84 Issue44. Corporate Governance and Internal Control over Financial Reporting A Comparison ofRegulatory Regimes Accou nting Review, May2009, Vol. 84 Issue 35. Ear nings Man ageme nt of Firms Report ing Material In ternal Con trol Weak nesses un der Sect ion 404of the Sarbanes-Oxley Act. Auditing, Nov2008, Vol. 27 Issue 26. Economic Incentives for V oluntary Reporting on Internal Risk Management and Control Systems.Auditing, May2008, V ol. 27 Issue 67. Firm Characteristics and Volu ntary Man ageme nt Reports on In ternal Con trol. Audit ing, Nov2006,Vol. 25 Issue28. Former Audit Partners on the Audit Committee and Internal Control Deficiencies. Accounting Review,Mar2009, Vol. 849.Internal Control Quality and Audit Pricing under the Sarbanes-Oxley Act . Auditing, May2008, Vol.2710.Internal Control Weakness and Cost of Equity Evidenee from SOX Section 404 Disclosures Accou nti ngReview, Oct2007, Vol. 8211.I nternal Control Weak nesses and In formatio n Un certai nty. Accou nting Review, May2008, Vol. 8312.lnternal Controls and the Detection of Management Fraud. Journal of Accounting Research, Sprin g99,Vol. 3713.Reduci ng Man ageme nt's In flue nee on Auditors Judgme nts An Experime ntal In vestigati on of SOX404 Assessme nts Acco un ti ng Review, Nov2008, V)l. 8314.SOX Section 404 Material WeaknessDisclosures and Audit Fees.Full Auditing, May2006, Vol. 2515.The Effect of SOX Internal Control Deficiencies and Their Remediation on Accrual Quality. AccountingReview, Jan2008, Vol. 8316.The Impact of SOX Section 404 Internal Control Quality Assessment on Audit Delay in the SOX Era.Auditing, Nov2006, Vol. 25Ashbaugh-Skaife, H., Collins, D. W., & Kinney Jr., W. R. (2007). The discovery and reporting of internal con trol deficie ncies prior to SOX-ma ndated audits. Jour nal of Acco unting and Economics, 44(1 —2), 166 -92.Ashbaugh-Skaife, H., Collins, D. W., Kinney Jr, W. R., & Lafond, R. (2009). The Effect of SOX Internal Control Deficiencies on Firm Risk and Cost of Equity. Journal of Accounting Research, 47(1),1 -43.Bahramian, A. (2011), Evaluation of the effectiveness of internal controls in an Investment Company, Master Thesis in Imam Hossein University, Iran.Daraby, M, (2006), analyzing the effect of strengthening internal controls, audit reports of companies listed on the Stock Audit, Master Thesis in Azan Islamic university.Doyle, J., Ge, W., & McVay, S. (2007). Determinants of weaknesses in internal control over financial reporting. Journal of Accounting and Economics, 44(1 -2), 193 -223.Feng, M., Li, C., & McVay, S. (2009). Internal control and management guidance. Journal of Accounting and Economics, 48(2 -3), 190 -209.Maham K., Poriya Nasab, A. (2000), Internal control) Integrated Framework( , Report of the Committee of the Commission Tardy, azman Hesabresy, Pages 118, 135.Ogneva, M., Subramanyam, K. R., & Raghunandan, K. (2007). Internal control weakness and cost of equity: evidence from SOX Section 404 disclosures. The Accounting Review, 82(5), 1255-1297.Rezaie Jahangoshaee, H, (1996). A analytical study of the degree of reliance of independent auditors on firms internal controls, Master Thesis, shahid Beheshti University, Iran.。
THE ACCOUNTING REVIEWV ol.83,No.12008pp.217–250The Effect of SOX Internal Control Deficiencies and Their Remediation onAccrual QualityHollis Ashbaugh-SkaifeUniversity of Wisconsin–MadisonDaniel W.CollinsThe University of IowaWilliam R.Kinney,Jr.The University of Texas at AustinRyan LaFondMassachusetts Institute of Technology and Algert Coldiron InvestorsABSTRACT:This paper investigates the effect of internal control deficiencies and theirremediation on accrual quality.Wefirst document thatfirms reporting internal controldeficiencies have lower quality accruals as measured by accrual noise and absoluteabnormal accruals relative tofirms not reporting internal control problems.Second,wefind thatfirms that report internal control deficiencies have significantly larger positiveand larger negative abnormal accruals relative to controlfirms.Thisfinding suggestsinternal control weaknesses are more likely to lead to unintentional errors that add noiseto accruals than intentional misstatements that bias earnings upward.Third,we doc-ument thatfirms whose auditors confirm remediation of previously reported internalcontrol deficiencies exhibit an increase in accrual quality relative tofirms that do notremediate their control problems.Finally,wefindfirms that receive different internalcontrol audit opinions in successive years exhibit changes in accrual quality consistentwith changes in internal control quality.Collectively,our cross-sectional and intertem-poral change tests provide strong evidence that the quality of internal control affectsthe quality of accruals.Keywords:SOX;internal control;accrual quality;financial reporting reliability.We thank seminar participants at Emory University,University of Houston Accounting Research Conference,Penn State Research Conference,University of Technology–Sydney,Washington University in St.Louis,and the Uni-versity of Wisconsin–Madison and two anonymous reviewers for helpful comments on previous versions of this paper.Editor’s note:This paper was accepted by Dan Dhaliwal.Submitted June2006Accepted August2007217218Ashbaugh-Skaife,Collins,Kinney,and LaFondThe Accounting Review,January 2008I.INTRODUCTIONT he reliability of financial reporting is claimed to be a function of the effectiveness of a firm’s internal control (PCAOB 2004;Donaldson 2005).1However,research to date provides mixed evidence on whether internal control weaknesses adversely af-fect accrual quality,an important component of reliable financial statements (Hogan and Wilkins 2005;Bedard 2006;Doyle et al.2007).This paper uses recently available data on the effectiveness of firms’internal controls mandated by the Sarbanes-Oxley Act (SOX)and the PCAOB’s Auditing Standards (AS)No.2to investigate how internal control quality affects the reliability of financial information (U.S.Congress 2002;PCAOB 2004).We posit that if a firm has weak internal control,managers are less able to determine reliable accrual amounts,and a consequence of these unintentional misrepresentations is that finan-cial information is more noisy and less reliable.In addition,managers of firms with weak internal control can more readily override the controls and intentionally prepare biased accrual estimates that facilitate meeting their opportunistic financial reporting objectives.Thus,regardless of whether misstatements are unintentional or intentional,the quality of accruals is likely diminished when firms have weak internal controls.We use SOX-mandated internal control deficiency (ICD)disclosures and external au-ditor opinions on internal control to conduct both cross-sectional and within-firm intertem-poral change tests of whether the effectiveness of firms’internal control affect the quality of reported accruals.Specifically,we test whether:(1)firms that have ICDs exhibit noisier accruals and larger abnormal accruals (both absolute and signed)relative to firms not dis-closing ICDs;(2)firms whose external auditors verify remediation of previously disclosed ICDs subsequently exhibit higher quality accruals relative to firms failing to remediate their control problems;and (3)firms that receive different SOX 404audit opinions in successive years exhibit improvements (declines)in accrual quality consistent with strengthened (weakened)internal controls indicated by the different opinions.To conduct our tests,we identify a sample of firms that have at least one SOX 404audit opinion on internal control (i.e.,accelerated filers).We look back to determine whether a sample firm disclosed an ICD under SOX 302and look forward to see if the firm received a second SOX 404opinion.2Managements’prior internal control disclosures in combination with external audit reports allow us to conduct change analysis tests to provide strong evidence on whether weak internal control diminishes the quality of firms’reported accruals.In cross-section tests,we find that ICD firms have larger absolute,larger positive,and larger negative abnormal total and abnormal working capital accruals relative to non-ICD 1In Auditing Standards No.2,the Public Company Accounting Oversight Board (PCAOB 2004)states:‘‘The Board believes that effective controls provide the foundation for reliable financial reporting.Congress believed this too,which is why the new reporting by management and the auditor on the effectiveness of internal control over financial reporting received such prominent attention in the [SOX]Act.Internal control over finan-cial reporting enhances a company’s ability to produce fair and complete financial reports.Without reliable financial reports,making good judgments and decisions about a company becomes very difficult for anyone,including the board of directors,management,employees,investors,lenders,customers,and regulators.The auditor’s reporting on management’s assessment of the effectiveness of internal control over financial reporting provides users of that report with important assurance about the reliability of the company’s financial reporting ’’(para.E.5.,Appendix E,Background and Basis for Conclusions)(emphasis added).2Section 302of SOX,which became effective in August 2002,requires senior management to evaluate internal controls over financial reporting and certify the effectiveness of the controls (see Ashbaugh-Skaife et al.[2007]for a discussion of the SOX 302reporting requirements).Section 404of SOX requires that public company annual filings contain management’s assessment of the design and operating effectiveness of its internal control and that the external auditor provide an opinion on management’s assessment (Securities and Exchange Com-mission [SEC]2002).Auditing Standards No.2(AS No.2)requires that the auditor form and express a separate opinion on the auditor’s evaluation of internal control.We refer to the auditor’s own opinion as the ‘‘SOX 404opinion.’’The Effect of SOX Internal Control Deficiencies and Their Remediation on Accrual Quality219firms.In addition,wefind that accruals of ICDfirms map less reliably to past,current,and future cashflows.All of these results are consistent with the accruals of ICDfirms being noisier and less reliable relative to accruals offirms with no reported internal control prob-lems.These results hold after controlling for conditional conservatism andfirm character-istics that prior research has shown to be related to accrual quality.As to intertemporal changes in the effectiveness of internal controls,wefind thatfirms that disclose an internal control problem and subsequently receive an unqualified SOX404audit opinion exhibit a decrease in absolute abnormal accruals relative to the year when internal control problems arefirst reported.Wefind no evidence that this decrease is due tofirms becoming more conservative in their accounting choices.In contrast,firms identified as having internal control problems that subsequently receive an adverse SOX404opinion exhibit no signif-icant change in the magnitude of abnormal accruals.Our analysis of successive year SOX404opinions reveals thatfirms whose internal controls improve(going from adverse to unqualified SOX404opinions)exhibit a modest increase in accrual quality,whilefirms whose internal controls worsen(going from un-qualified to adverse SOX404opinions)exhibit a significant decrease in accrual quality. Firms with the same SOX404opinion in successive years(unqualified or adverse in both years)exhibit no change in accrual quality.Collectively,our cross-sectional and intertemporal change tests are consistent with the notion expressed by Congress and regulators that strong internal controls provide a signif-icant long-term benefit in improving the accuracy offinancial reporting that leads to higher quality information forfirms’external stakeholders(Donaldson2005;U.S.House of Rep-resentatives2005;U.S.Senate2002,2004).Our study makes several contributions.First,we add to the literature that seeks to identify the determinants of accrual quality,much of which focuses on innatefirm operating characteristics as the primary determinants of accrual quality(Dechow and Dichev2002; Dechow et al.1995;Francis et al.2004;Kothari et al.2005)or intentional misuse of accounting discretion to manipulate earnings through accruals(Dechow et al.1996).Our study is one of thefirst to investigate how internal control,which is intended to attenuate both intentional and unintentional misstatements,affects the quality of accruals and thereby the reliability offinancial statements.We empirically link the strength offirms’internal control overfinancial reporting to the quality of accruals through the use of SOX302and SOX404reporting.Most importantly,because independent auditors’SOX404opinions provide unambiguous signals about changes in the effectiveness offirms’internal controls, our research design allows tests of the effects of changes in internal control quality on accrual quality in ways that minimize competing explanations for our results.This study also contributes to the literature designed to assess thefinancial reporting consequences of SOX.While much of the prior literature addresses the costs of imple-menting and auditing SOX requirements(Li et al.2008;Zhang2007;Berger et al.2005), our study is among thefirst to provide evidence about potential benefits of strong internal control in terms of the quality of externally reportedfinancial information.Our research is most closely related to concurrent studies by Hogan and Wilkins(2005), Bedard(2006),and Doyle et al.(2007)that examine the relation between internal control weaknesses and earnings(accrual)quality.Hogan and Wilkins(2005)find no difference in the Dechow and Dichev(2002)measure of accrual noise between ICDfirms and a set of controlfirms and only modest differences in absolute abnormal total accruals using the modified Jones model(Dechow et al.1995).Bedard(2006)finds no difference in the absolute value of unexpected total accruals between ICD and controlfirms in the two years prior to the ICDfirms’disclosures and in the two years that follow disclosure.However,The Accounting Review,January2008220Ashbaugh-Skaife,Collins,Kinney,and LaFond The Accounting Review,January 2008Bedard (2006)finds that ICD firms exhibit larger absolute abnormal accruals relative to control firms in the disclosure year.Doyle et al.(2007)find that firms that disclosed ICDs under SOX 302(before required internal control audits)exhibit lower accrual quality rel-ative to control firms,but these differences relate only to overall company level control problems and not to account specific weaknesses.Interestingly,Doyle et al.(2007)find no differences in accrual quality between ICD and non-ICD firms for internal control weak-nesses disclosed during the SOX 404regime.Our study extends these prior studies in several important ways.First,all three of the prior studies are restricted to cross-sectional tests of differences in accrual quality between ICD and non-ICD firms.Accordingly,as in all cross-sectional designs,there are potential concerns of endogeneity,self-selection,and correlated omitted variables,which limit the ability to draw strong causal inferences from the results.3We address these concerns by focusing on firms that received one or more SOX 404opinions and identify which firms have continuously good,continuously bad,or changes in the quality of their internal control.Incorporating SOX 404opinions is a central feature of our research design and is important because:(1)it provides an unambiguous signal from an independent third-party about the effectiveness of a firm’s internal control;(2)it allows identification of which firms were able to remediate internal control weaknesses and when the improvement took place;and (3)it allows identification of subsets of firms that experienced significant changes in internal controls from year to year.In contrast to the prior studies,we use the sequence of ICD disclosures and SOX 404opinions to conduct within-firm and across-firm testing of the effects of changes in the effectiveness of internal controls over time in ways that minimize competing explanations for observed differences in the quality of accounting accruals.By linking changes in the strength or effectiveness of internal controls with changes in measures of accrual quality,we mitigate concerns about self-selection,correlated omitted variables,and endogeneity that cloud the interpretation of results from studies that rely solely on cross-sectional tests,and we provide stronger tests of causal linkages between internal control weaknesses and the quality of external accounting numbers.The remainder of our paper is organized as follows.Section II provides institutional background and provides examples of how internal control weaknesses are likely to intro-duce noise into accruals.Section III describes the accrual quality measures used in our analysis,summarizes the determinants of accrual quality,and sets forth our predictions on the effects of internal control weaknesses and remediation on accrual quality.Section IV describes our sample and provides descriptive statistics.Section V presents our empirical findings and Section VI concludes.II.INSTITUTIONAL BACKGROUND AND EXAMPLESOF CONTROL WEAKNESSESAuditing Standards No.2(AS No.2,PCAOB 2004,para.7)defines internal control over financial reporting (ICFR)as:a process designed by ...the company’s principal executive and principal financial officers ...and effected by the company’s board of directors,management,and other personnel,to provide reasonable assurance regarding the reliability of financial report-ing and the preparation of financial statements for external purposes in accordance with generally accepted accounting principles.3Indeed,Doyle et al.(2007,30),recognize this limitation and state:‘‘[O]ur ability to infer causality between internal control problems and accrual quality is limited.’’The Effect of SOX Internal Control Deficiencies and Their Remediation on Accrual Quality 221The Accounting Review,January 2008An ICD exists ‘‘when the design or operation of a control does not allow management or its employees,in the normal course of performing their assigned functions,to prevent or detect misstatements on a timely basis (AS No.2,para.8).Thus,ICFR is focused on timely prevention and detection of financial misstatements,whether unintentional or intentional.4Internal Control—Integrated Framework (The Framework),the external standard or criteria for evaluating ICFR quality (corresponding to GAAP for financial statements),sug-gests five components or elements of internal control:the control environment,risk assess-ments,control activities,information and communication,and monitoring (Committee of Sponsoring Organizations of the Treadway Commission [COSO]1992).5A high-quality control environment establishes the importance of internal control throughout the firm.Within such an environment,potential causes of financial misstatements are assessed as to risk and control activities are designed and put in place to mitigate important risks,and exceptions that arise are communicated to parties who can take corrective actions.Finally,the entire internal control process is monitored for exceptions by management and the internal audit function.ICDs can affect the noise and the magnitude of abnormal accruals in financial state-ments in two principal ways.One way is through random,unintentional misstatements due to the lack of adequate policies,training,or diligence by company employees.Examples are:inventory counting and pricing errors that misreport inventory on hand and related cost of sales,omission of items such as failure to record credit purchases,variation in revenue recording due to lack of specific policies (or employee discretion)for revenue recognition,expensing amounts that should be capitalized and vice versa ,inadequate basis for account-ing estimates such as the allowance of inventory obsolescence,and unreliable procedures for ‘‘rolling up’’amounts from segments and subsidiaries.These random misstatements can lead to increases or decreases in accruals and resulting net income.A second way that ICDs can adversely affect the quality of accruals is through inten-tional misrepresentations or omissions by employees or by management.These non-random misstatements typically overstate earnings for the current period,but ‘‘big bath’’write-offs or cookie jar reserves result in opportunistic understatement of current earnings as well.For example,management’s exercise of discretion in accounting choices allows financial misrepresentation through manipulation of accruals for recording important accounting es-timates such as warranty liabilities,reserves for sales returns,and allowance for uncollec-tible receivables.Furthermore,employee fraud is made possible by inadequate segregation of internal control duties.Weak internal control in the form of inadequate segregation of duties can allow the misappropriation of assets and alteration of recorded amounts by an employee that is not detected because the company has inadequate staff for monitoring,or lack of action by top management because of a lax control environment.In addition,mis-statements can be introduced into the financial reporting process through ‘‘selective over-sights or omissions’’in accumulating segment and subsidiary information for consolidated reports,as well as through management emphasizing earnings targets in instructions to employees.4There are inherent limitations in ICFR as noted in AS No.2,para.16.These limitations are due to lapses in human judgment,compliance,and diligence,plus collusion and improper management override of ICFR.While these inherent limitations cannot be eliminated,AS No.2asserts that it is possible to design into the ICFR process safeguards that will reduce the risk that they will arise.5The control environment and monitoring may be useful in protecting against manipulation of records as a response to management-prescribed targets based on financial performance.222Ashbaugh-Skaife,Collins,Kinney,and LaFondThe Accounting Review,January 2008Overall,better internal control leads to more reliable recorded amounts useful in con-ducting daily activities such as production,sales,and management of inventory,as well as reducing unintentional and intentional misstatements in external financial statements.Con-versely,weak internal control introduces noise and/or bias into accruals that adversely affect the quality of both internal and externally reported accounting numbers.Prior to the passage of the SOX in July 2002,the Foreign Corrupt Practices Act of 1977required public company management to maintain books and records that would protect corporate assets and facilitate GAAP-based financial reporting,but did not require management to evaluate or certify the effectiveness of internal control (U.S.Congress 1977).Similarly,prior to SOX,auditing standards required the independent auditor to obtain an understanding of ICFR sufficient to properly plan the substantive financial statement audit,but did not require the auditor to evaluate per se the design or operating effectiveness of ICFR.6SOX changed the required public disclosure,audit,and audit reporting with respect to internal controls in two steps.Section 302of SOX,effective August 29,2002(SEC 2002),mandates that a firm’s CEO and CFO certify in periodic SEC filings that the signing officers have ‘‘evaluated ...and have presented in the report their conclusions about the effectiveness of their internal controls based on their evaluation’’(302(a)(4)(C)and (D)).Importantly,neither SOX 302nor SEC interpretations describe procedures for evaluating controls and do not require independent audits of ICFR.However,in conducting the financial statement audit,the auditor might become aware of internal control problems and require that management acknowledge any known material weakness in its SOX 302certification.7Manage-ment certifications and ICD disclosures under SOX 302began appearing in 2003.Section 404of SOX and SEC regulations require that annual reports filed with the SEC contain management’s assessment of the effectiveness of internal control over financial reporting as of the fiscal year-end and require that this assessment be audited by the auditor of its financial statements.AS No.2(effective for larger firms for fiscal years ending on or after November 15,2004)provides guidance for the independent audit to support the auditor’s opinion on management’s report and adds a requirement that the auditor express a separate opinion about internal control effectiveness based on their own review of the firm’s internal controls.In the empirical work to follow,we use management disclosures of ICDs made under SOX 302or 404along with auditors’SOX 404opinions on the effectiveness of internal controls as signals of different levels of internal control effectiveness and test for differences in accrual quality across-and within-firms over time.Specifically,we posit that both inten-tional and unintentional misstatements are likely to be introduced into accruals measure-ments when internal controls are weak and that the quality of accruals is diminished when firms have weak internal controls.In addition,we expect that when previously disclosed ICDs are remediated,as evidenced by firms receiving an unqualified SOX 404audit opinion,accrual quality will improve.Conversely,we posit that firms that receive an adverse SOX 404opinion after receiving an unqualified SOX 404opinion in the prior year will exhibit a decrease in accrual quality.6The Foreign Corrupt Practices Act of 1977did require external auditors to report to the board of directors any material weaknesses in the firm’s internal control over financial reporting noted during conduct of the annual financial statement audit.7In particular,AS No.2,which became effective for accelerated filers for fiscal years ending on or after November 15,2004,requires the auditor to ‘‘perform limited procedures quarterly’’to determine whether material changes in internal control have occurred that should be disclosed in 302certifications (paras.202–203).The Effect of SOX Internal Control Deficiencies and Their Remediation on Accrual Quality 223The Accounting Review,January 2008III.ACCRUAL QUALITYMeasures of Accrual QualityWe use three measures to capture accrual quality:(1)the degree to which accruals fail to map into past,current,or future cash flows (WCA NOISE );(2)absolute and signed abnormal total accruals (AB ACC );and (3)absolute and signed abnormal working cap-ital accruals (AB WCACC ).Note that WCA NOISE and the absolute AB ACC and AB WCACC measures are inversely related to accrual quality.Thus,explanatory variables with a predicted positive relation with these measures imply lower accrual quality.The WCA NOISE measure is based on the standard deviation of the residual estimated from the following regression that controls for conditional conservatism (Dechow and Dichev 2002;Ball and Shivakumar 2006):8WCA ϭϩCFO ϩCFO ϩCFO ϩABNRET t 01t Ϫ12t 3t ϩ14tϩDABNRET ϩDABNRET *ABNRET ϩε(1)5t 6t t where WCA is net income before extraordinary items (Compustat #123)plus depreciation and amortization (Compustat #125)minus cash flows from operations (Compustat #308)scaled by average total assets (Compustat #6),CFO is cash flow from operations scaled by average total assets,ABNRET is the buy and hold return over the fiscal year less the equal weighted market return over the fiscal year (taken from CRSP),and DABNRET is equal to 1if ABNRET is less than 0,and 0otherwise.Note that this specification allows working capital accruals to be different depending on whether the economic climate of the firm is negative or positive,consistent with asymmetric loss versus gain recognition under con-servative accounting.We estimate Equation (1)by three-,two-,or one-digit SIC codes conditional on having at least 20firms in each SIC group.In addition,following Ball and Shivakumar (2006)we require at least five observations in the industry group to have negative ABNRET values.WCA NOISE is the standard deviation of the firm-specific resid-ual from the prior three to five years,where higher values indicate greater accrual noise,i.e.,lower accrual quality.We begin estimating AB ACC using the following OLS regression:TotalAccruals ϭ␣ϩ␣(1/lag 1asset )ϩ␣(⌬REV Ϫ⌬AR )ϩ␣PPE0123ϩ␣ABNRET ϩ␣DABNRET ϩ␣DABNRET *ABNRET ϩε456(2)where TotalAccruals is net income before extraordinary items minus CFO ,⌬REV is sales (Compustat #12)in year t less sales in year t Ϫ1,⌬AR is accounts receivable (Compustat #2)in year t less accounts receivable in year t Ϫ1,PPE is net property,plant,and equip-ment (Compustat #8),and all other variables are as previously defined.All accounting variables are scaled by beginning of fiscal year total assets,lag 1asset .As in Equation (1),we include ABNRET and DABNRET to control for conditional conservatism when esti-mating abnormal total accruals.We estimate Equation (2)by three-,two-,or one-digit SIC codes conditional on having at least 20firms in each SIC group.Similar to 8Following Ball and Shivakumar (2006),we add ABNRET and DABNRET to our three accrual quality models to control for the potential effects of conservatism on the accrual quality metrics.When modeling accrual quality without these two control variables,our results,are qualitatively similar to those reported and discussed later in this study.224Ashbaugh-Skaife,Collins,Kinney,and LaFond The Accounting Review,January 2008estimating Equation (1),we require at least five observations in the industry group to have negative ABNRET values.We use the parameter estimates from Equation (2)to calculate expected total accruals as follows:Expected Total Accruals ϭˆ␣ϩˆ␣(1/lag 1asset )ϩˆ␣(⌬Re Ϫ⌬AR )012ϩˆ␣(PPE )ϩˆ␣ABNRET ϩˆ␣DABNRET345ϩˆ␣DABNRET *ABNRET .6(3)A firm’s unadjusted abnormal total accruals is set equal to the difference between TotalAccruals and Expected Total Accruals .The last step is to performance-adjust abnor-mal accruals (Kasznik 1999;Kothari et al.2005).We rank firms within each industry group into ten groups based on their prior year’s return-on-assets (ROA).AB ACC is the differ-ence between the sample firm’s ‘‘unadjusted abnormal accruals’’and the median abnormal accruals for firms in the same industry ROA decile,where the median ROA value excludes the particular sample firm.We analyze both the absolute value and signed values of AB ACC .Our estimation of abnormal working capital accruals,AB WCACC ,begins with the following OLS regression estimated by three-,two-,or one-digit SIC codes conditional on having at least 20firms in each SIC group on Compustat with at least five firms in the SIC group having negative ABNRET values:WCA ϭ␣ϩ␣(1/lag 1asset )ϩ␣(⌬REV Ϫ⌬AR )ϩ␣ABNRET0123ϩ␣DABNRET ϩ␣DABNRET *ABNRET ϩε(4)45where all variables are as previously defined.We use the parameter estimates from Equation (4)to calculate expected working capital accruals:Expected WCA ϭˆ␣ϩˆ␣(1/lag 1asset )ϩˆ␣(⌬Re Ϫ⌬AR )ϩˆ␣ABNRET0123ϩˆ␣DABNRET ϩˆ␣DABNRET *ABNRET .(5)45A firm’s unadjusted abnormal working capital accruals is set equal to the difference between WCA and Expected WCA .Similar to the total accruals quality measure,we performance-adjust abnormal working capital accruals by ranking firms within each industry group into ten groups based on their prior year’s ROA.AB WCACC is the difference between the sample firm’s unadjusted abnormal working capital accruals and the median abnormal working capital accruals for firms in the same industry ROA decile,where the median ROA value excludes the particular sample firm.We analyze both the absolute value and signed values of AB WCACC .The two abnormal accrual measures are benchmarked against the average industry relation between accruals and changes in sales adjusted for changes in receivables.These two measures differ by noncurrent accruals related to property,plant,and equipment (e.g.,depreciation,amortization,and asset write-offs).The accrual noise measure captures the degree to which working capital accruals fail to map into past,current and future cash flows once again benchmarked against industry norms.While related,the two abnormal accrual measures and the accrual noise measure capture the effects of intentional and un-intentional errors due to weak controls that are distinctly different as evidenced by the fact。
質量管理體系主要詞語中英文對照表范圍scope 通則general 應用application引用標准normative reference 名詞與定義terms and definitions 一般要求general requirements 文件化要求documentation requirements 文件管制control of documents 記錄控制control of records管理責任management responsibility 管理承諾management commitment以客戶為中心customer focus責任,授權與溝通responsibility,authority and communication管理代表management representative 內部溝通internal communication管理審查輸入review input 管理審查輸出review output資源管理resource management 資源提供provision of resource資格,認知與訓練competence,awareness and training工作環境work environment 產品實現product realization產品實現的規划planning of realization processes顧客相關的過程customer-related process決定產品相關的要求determination of requirements related to the product產品相關要法語的審查review of requirements related to the product客戶溝通customer communication 設計與開發design and development設計與開發規划design and development planning設計與開發的輸入design and development inputs設計與開發輸出design and development output設計與開發的審查design and development review設計與開發的驗証design and development verification設計與開發的確認design and development validation設計與開發變更的管制control of design and development changes采購purchasing 采購過程purchasing control 采購資訊purchasing information采購品的驗証verification of purchasing product生產及服務提供production and service provision生產及服務提供之管制control of production and service provision生產與服務提供過程的確認validation of process for production and service provision 鑒別與追溯identification and traceabiltiy 客戶財產customer property產品保存preservation of product量測與監控設備的管制control of monitoring and measuring devices量測,分析與改善measurement, analysis and improvement監控與量測monitoring and measurement 內部稽核internal audit過程的量測與監控measurement and monitoring of process產品的監控與測量measurement and monitoring of product不合格品管制control of nonconformity product資料分析analysis of data 預防措施preventive action。
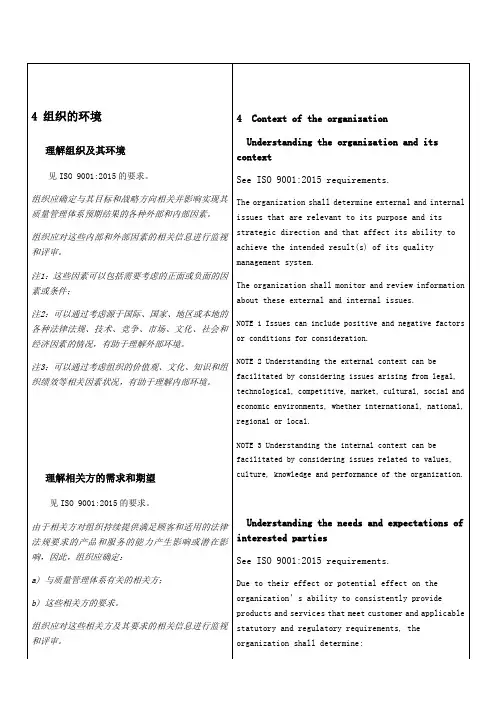
品质管理常用英文术语在品质管理领域,掌握一些常用的英文术语对于有效地沟通、理解和实施品质管理策略至关重要。
以下是一些常见且重要的品质管理英文术语。
一、基本术语1、 Quality 质量指产品或服务满足规定或潜在需要的特征和特性的总和。
2、 Quality Assurance (QA) 质量保证为使人们确信产品或服务能满足质量要求,在质量管理体系中实施并根据需要进行证实的全部有计划和有系统的活动。
3、 Quality Control (QC) 质量控制为达到质量要求所采取的作业技术和活动。
4、 Inspection 检验对产品或服务的一种或多种特性进行测量、检查、试验、度量,并将结果与规定的要求进行比较以确定其符合性的活动。
二、统计过程控制(SPC)相关术语1、 Process 过程将输入转化为输出的一组相互关联或相互作用的活动。
2、 Variation 变异过程的输出之间的差异。
3、 Control Chart 控制图用于区分过程中的正常变异和异常变异的一种统计工具。
4、 Upper Control Limit (UCL) 上控制限控制图中控制上限的值。
5、 Lower Control Limit (LCL) 下控制限控制图中控制下限的值。
6、 Center Line (CL) 中心线控制图中代表过程均值的线。
三、抽样检验相关术语1、 Sample 样本从总体中抽取的一部分个体。
2、 Sampling 抽样抽取样本的过程。
3、 Random Sampling 随机抽样按照随机原则抽取样本的方法。
4、 Acceptance Sampling 验收抽样确定一批产品是否可被接受的抽样检验方法。
四、缺陷与不合格相关术语1、 Defect 缺陷产品或服务中不满足预期使用要求的特性或特征。
2、 Nonconformity 不合格未满足规定的要求。
3、 Major Defect 主要缺陷可能导致产品或服务失效或严重降低其使用性能的缺陷。
Auditor Reporting under Section404:The Association between the Internal Control and Going Concern Audit Opinions*BENG WEE GOH,Singapore Management UniversityJAYANTHI KRISHNAN,Temple UniversityDAN LI,Tsinghua University1.IntroductionSection404of the Sarbanes-Oxley Act of2002(SOX)requires companies’independent auditors to provide an opinion on their clients’internal control overfinancial reporting (ICFR),in addition to the opinion on their clients’financial statements(U.S.Congress 2002).In2004,the Public Company Accounting Oversight Board(PCAOB)issued Audit-ing Standard No.2(AS2),An Audit of Internal Control over Financial Reporting Performed in Conjunction with an Audit of Financial Statements,which provided guidance to auditors for ICFR audits(PCAOB2004).AS2was subsequently replaced by Auditing Standard No. 5(AS5).1Unlike traditional audits of thefinancial statements,AS2and AS5require an “integrated audit of internal control andfinancial statements”because the“objectives of and work involved in performing both an attestation of management’s assessment of inter-nal control and an audit of thefinancial statements are closely interrelated”(PCAOB 2003a).Because,in effect,the internal control and thefinancial statement audit reports are joint products of the audit process,it is important to investigate the relation between the internal control andfinancial statement audit opinions.In this paper,we explore the association between the two audit opinions by examining whether the issuance of an adverse internal control material weakness opinion(MWO) influences,other things equal,the issuance of a going concern audit opinion(GCO)for financially stressed companies.2Although the two opinions are the result of an integrated audit process,they serve different purposes.The GCO reflects the auditor’s view of the financial condition of its client,indicating whether(in the auditor’s opinion)the client will continue to be a going concern for a period of12months beyond thefinancial year end. The MWO reflects the auditor’s opinion on whether there are material weaknesses in internal control and therefore the likelihood that material misstatements in thefinancial statements will not be detected or prevented.*Accepted by Ferdinand Gul.We thank the Editor(Ferdinand Gul),two anonymous reviewers,Bryan Church,Qi Chen,Jagan Krishnan,Yan Zhang,Yinqi Zhang,and conference participants at the2007 AAA annual meetings for helpful comments.Jayanthi Krishnan acknowledges research support from the Temple University Summer Research Fellowship and the Fox School Merves Research Fellowship.Beng Wee Goh acknowledges research support from the Singapore Management University.1.Auditing Standard No.5,An Audit of Internal Control over Financial Reporting That is Integrated with anAudit of Financial Statements,became effective forfiscal years ending November15,2007(PCAOB2007).As we discuss later,the change in standards was effected in response to concerns that AS2led to inefficient audits.2.Technically,a reference to potential“going concern”problems in an audit report is a modification to theaudit opinion of whether thefinancial statements are stated in accordance with generally accepted account-ing principles(GAAP).We refer to such a modified audit report as a going concern opinion.Contemporary Accounting Research Vol.XX No.X(X X)pp.1–27©CAAAdoi:10.1111/j.1911-3846.2012.01180.x2Contemporary Accounting ResearchDespite this difference,the two opinions could be connected.We posit that three fac-tors determine whether a MWO will trigger a GCO,given that thefirm isfinancially dis-tressed.First,although the GCO refers to the client’sfinancial viability,it is issued with the auditor also stating—in its opinion paragraph—that the client’sfinancial state-ments are stated“fairly in accordance with GAAP”.Reliable reporting is necessary for the auditor to be able to forecast cashflows and other aspects of the client’s performance, in order to make the GCO decision.3The GCO decision is a difficult and ambiguous task (Chow,McNamee,and Plumlee1987;Carcello and Neal2000)with grey areas that require auditor judgment.4Previous work has argued that,other things equal,auditors can move their“threshold”(i.e.,become more conservative)by issuing the GCO in response to factors such as uncertainties and litigation risk(Francis and Krishnan1999, 2002;Rosner2003).Thus,because the MWO indicates uncertainty about the potential reliability of thefinancial statements,it may also affect the ability to forecast the going concern status for afinancially stressed client,thus triggering the GCO.5 Second,the negative consequences associated with the MWO can make it difficult for companies infinancial distress to obtain newfinancing because it increasesfinancing costs (Beneish,Billings,and Hodder2008;Ashbaugh-Skaife,Collins,Kinney,and LaFond 2009;Dhaliwal,Hogan,Trezevant,and Wilkins2011;Kim,Song,and Zhang2011).If the auditor perceives such future difficulties,this would impact the GCO decision.Third,some responders to the AS2proposal pointed out that both companies and their auditors may be subject to greater litigation risk when a MWO is issued.6If this increases the auditor’s perceived litigation risk,the issuance of a MWO can further influence the auditor’s GCO decision.Such perceptions can be further heightened by the requirement in AS2(and now AS5)that the auditor explicitly state that it considered the effect of the MWO on the financial statement audit opinion.73.For example,in its10-Kfiling for the year ended December31,2003,Sonus Network Inc.disclosed thatit faced shareholder class action,the allegation being that“we lacked adequate internal controls and were therefore unable to ascertain our truefinancial condition.”4.Similarly,the MWO is also issued under situations of significant uncertainty(Earley,Hoffman,and Joe2008;Hoitash,Hoitash,and Bedard2008)and“criteria for judging misstatement likelihood and material-ity are likely complex to apply in practice”(Bedard and Graham2011).5.In theory,the auditor must tailor audit procedures to offset the material weakness sufficiently to ensurereliablefinancial reporting before making the GCO decision.Therefore,the MWO need not impact the GCO as long as the auditor can“audit around”the material weakness and obtain reasonable assurance about the reliability(or fairness)offinancial reporting.At the extreme,a complete inability to audit around the material weakness may result in a scope limitation opinion.In practice,less extreme situations are more likely.6.Agilent Technologies argues that AS2“will lead to disclosure of many significant deficiencies which mayaggregate to a material weakness judgment and which may cause shareholders and third parties to con-sider the risk of material misstatement to be much greater than it actually is.”Similarly,Health Insurance Plan of Greater New York states that the“auditor’s attestation of management’s assessment of internal control and the effectiveness of those controls is tantamount to a guarantee or warranty that the com-pany’s internal controls overfinancial reporting are effective and result infinancial statements that are free of material misstatement.”All comments on AS2can be found at /Rules/Rulemaking/ Pages/Docket008Comments.aspx.7.See paragraphs193–96of AS2(PCAOB2004).These paragraphs refer to the timing and content of teststhat go into the formation of the audit opinion and not the going concern modification.However,to the extent that the audit report is viewed as a whole,the requirement for such a statement can heighten perceived litigation risk.CAR Vol.XX No.X(X X)Auditor Reporting under Section4043 We examine the association between the MWO and the GCO,using a sample of1,110financially stressedfirms that reported internal control and audit opinions under SOX Section404during the period2004–2009.8Wefind that the issuance of a MWO increases the likelihood of a GCO significantly,after controlling for factors that prior studies have found to be associated with a GCO.This result holds when we control for potential endoge-neity of the MWOs,to incorporate the possibility that ourfinding is driven by unobserved latent factors that drive both GCOs and MWOs.Hence,the empirical evidence suggests that auditors do respond to the uncertainty surrounding a MWO by issuing a GCO.Further analyses corroborate this evidence.Although in theory the auditor can“audit around”the material weakness,and ensure that thefinancial statements are reliable enough to opine on,it is not clear it can always do so.Therefore,we expect that the strength of the association will differ according to the degree of uncertainty engendered by the MWO,and the degree to which the auditor can audit around the weakness to render itsfinancial statement opinion.We compare the association between the MWO and the GCO for MWOs arising out of company-level weaknesses and account-specific weaknesses. Wefind that the former,which are more difficult to audit around(Ettredge,Li,and Sun 2006;Doyle,Ge,and McVay2007a),but not the latter,are associated with GCOs.Next,we examine whether the expectation that the material weaknesses will be reme-died—which reduces the uncertainty surrounding the MWO—impacts the strength of the association between MWO and ing the removal of the MWO in the subse-quent year as the measure of expected remediation in the year the opinion is issued,we find that the association between MWO and GCO holds only for those material weak-nesses which are not subsequently remediated.We also examine whether the issuance of a MWO may hinder the ability of afirm to raise capital in the subsequent year,possibly inducing conservatism in the auditor’s GCO.Wefind a significant negative association between MWOs and subsequent changes in current debt,and a negative but marginally significant association between MWOs and subsequent changes in common stock in the subsequent year,suggesting that the MWO is likely to adversely affect futurefinancing, triggering a GCO in conjunction with the MWO.Finally,we examine whether it is the auditor’s material weakness opinion rather than the disclosure of material weakness that is associated with the GCO.Section404was pre-ceded in2002by the introduction of a related internal control rule,Section302of SOX, which required management(but not auditor)reports on the effectiveness of disclosure controls.We estimate our model using data for the Section302regime to examine the association between GCO and material weakness disclosures.Interestingly,we do not doc-ument an association between the existence of material weaknesses,as reported by man-agement,and the GCO.Taken together,our results suggest that the MWO issued under SOX Section404does increase the likelihood of a GCO,while the existence of material weaknesses in the Section302disclosures does not.Thus,auditors seem to respond to the uncertainties surrounding a material weakness by issuing a GCO only when they have to issue a MWO.Our paper makes three primary contributions.First,unlike most previous research, we examine the impact of the internal control opinion on auditors’decisions.The vast majority of the attention on Sections404and302of SOX has focused on the causes of the internal control weaknesses revealed by the ICFR auditor and management reports, 8.Restricting the sample tofinancially stressed companies is important becausefinancial distress—the keyfactor triggering the GCO—can also be one cause for the existence of material weaknesses.Conse-quently,in the absence of controls forfinancial distress,there could be a mechanical positive association between material weaknesses and GCOs.By confining the sample to distressedfirms and further control-ling for distress in our multivariate analyses,we are able to draw inferences about auditor behavior arising from uncertainties relating to the two opinion decisions.CAR Vol.XX No.X(X X)4Contemporary Accounting Researchand their consequences,measured by stock price reactions and cost of debt and equity (Ogneva,Subramanyam,and Raghunandan2007;Ashbaugh-Skaife,Collins,Kinney,and LaFond2009;Dhaliwal et al.2011).We focus instead on the overall audit,which consists of both the internal control andfinancial statement audits.Second,whereas previous GCO studies have estimated empirical models based on thefinancial statement audit only, our study is thefirst to extend the analysis to an integrated audit of internal control and thefinancial statements.Thus,we argue,studies examining the cross-sectional variations in the incidence of the GCO must consider how the internal control audit affects the out-come.Third,we shed some light on the effects of the policies relating to internal control. The purpose of Sections302and404was primarily to provide information on the internal controls,thus enhancing investor understanding of the quality offirms’financial reporting. Although this was expected to enhance the quality offinancial reporting,none of the pol-icy statements suggest that policymakers envisaged an impact on the likelihood of the GCO.To the extent the increase in the GCO likelihood is a result of auditor conservatism, ourfinding suggests the need for a broader evaluation of the effects of SOX404.The remainder of the paper is organized as follows.Section2describes the research motivation and hypothesis.Section3describes our research design and sample selection. Sections4and5describe the empirical results.Section6concludes.2.Motivation and hypothesis developmentBackgroundSOX includes two sections relating to internal control reporting.Section302,introduced in2002,requires quarterly management to report on the effectiveness of the company’s disclosure controls.Section404,introduced in2004,requires companies’independent auditors to provide an opinion on their clients’ICFR,in addition to the opinion on their clients’financial statements(U.S.Congress2002).The intended effect of the rules is to improve the reliability offirms’financial reporting(PCAOB2004;Donaldson2005).How-ever,Section404has been the subject of intense debate as critics maintain that the high costs of complying with it are not commensurate with its perceived benefits(Michaels 2003;DeFond and Francis2005;Powell2005;Romano2005).Guidance to auditors for ICFR audits was provided by AS2,which was effective for acceleratedfilers in November2004(PCAOB2004).9AS2introduced an integrated audit of internal control andfinancial statements.The standard includes extensive discussions of the relationship between the internal control audit procedures for the two audit opinions (see,e.g.,paragraphs145–58in AS2).Particularly relevant to our study,the standard dis-cusses the effect of a MWO on thefinancial statement opinion.Specifically,when the auditor issues a MWO and a clean audit opinion,it must state in its audit opinion that the material weakness“was considered in determining the nature,timing,and extent of audit tests applied in our audit of the20X3financial statements,and this report does not affect our report dated[date of report]on thosefinancial statements”(paragraph194, PCAOB2004).10A similar disclosure is required when a MWO and a non-cleanfinancial statement opinion are issued.9.Acceleratedfilers are defined as companies(a)with publicfloat(aggregate market value of voting andnonvoting common equity held by nonaffiliates)greater than$75million,(b)that have been subject to Exchange Act reporting requirements for at least12calendar months,(c)that havefiled at least one annual report,and(d)that are not eligible to use Forms10-KSB and10-QSB for their annual and quar-terly reports.SOX Section404was initially applicable to acceleratedfilers.Nonacceleratedfilers were eventually expected to comply,but the effective date for compliance was repeatedly postponed.However, the Dodd-Frank Wall Street Reform Act of2010has permanently exempted nonacceleratedfilers from compliance with Section404.10.The wording is modified if a combined report is issued for the ICFR andfinancial statement opinions. CAR Vol.XX No.X(X X)Auditor Reporting under Section4045 In2007,the PCAOB issued Auditing Standard No.5(PCAOB2007)to replace AS2. AS5emphasized a top-down,risk-based approach to ICFR audits,with the intent of elim-inating the inefficiencies that had been identified in the operation of AS2.Like AS2,AS5 specifically connects the two opinions,stating that the auditor should“disclose whether his or her opinion on thefinancial statements was affected by the adverse opinion on internal control overfinancial reporting.”Thus,SOX Section404and the related auditing standards emphasize the integration of the audits of an entity’s internal controls and itsfinancial statements,and consequently the internal control and audit reports are joint products of the audit process.It is therefore important to investigate the relation between the two audit opinions.Impact of the MWO on the GCOThe GCO expresses the auditor’s view that there is substantial doubt about its client’s ability to continue as a going concern for a period not exceeding one year beyond the financial statement date(Statement of Auditing Standard No.59,AICPA1988;Auditing Standard No.1,PCAOB2003b).Although afirm’sfinancial condition is the underlying factor triggering a GCO,the decision requires considerable judgment(Chow et al.1987; Carcello and Neal2000).Auditing standards provide a list of circumstances,such as loan defaults,work stoppages,and legal proceedings,which could raise doubts about the entity’s ability to continue as a going concern.SAS No.59requires auditors to assess management’s plans to overcome the problems causing the potential going concern prob-lem and,if not satisfied with these plans,issue a GCO.Internal control problems are not mentioned on this list or indeed anywhere in the going concern standards.However,as discussed above,the ICFR audit standards state that the internal control audit opinion (MWO)should be considered when the auditor issues thefinancial statement opinion.Given the inherent ambiguity of the going concern auditing standard,auditors likely develop afinancial distress“range”over which a GCO can be issued and select a thresh-old within that range to actually issue a GCO.Previous studies have argued that auditors move this threshold down(i.e.,become more conservative)in the face of uncertainties regarding,for example,future losses(Nelson and Kinney1997),potential litigation(Krish-nan and Krishnan1996;Geiger and Raghunandan2002),or accounting accruals(Francis and Krishnan1999).Can the issuance of a MWO be a factor that causes auditors to lower the threshold for the GCO?Consider a client whosefinancial condition indicates a potential going con-cern problem.Auditing standards for auditingfinancial statements require the auditor to acquire an understanding of internal control overfinancial reporting and conduct tests to assess control risk should the auditor decide to rely on controls.Assume that the auditor’s understanding of the client’s internal control has revealed a potential material weakness, indicating heightened control risk,requiring the auditor to design its audit to offset the risk.The standard audit risk model suggests that auditors adjust their substantive tests (e.g.,choosing not to rely on controls)to maintain audit risk at acceptable levels.The auditor assesses control risk as high,designs substantive tests and,where necessary, requires clients tofix problems relating to the reliability of thefinancial statements.Then, based on thefinancial statements that have been judged(with reasonable assurance)as being reliable,the auditor must decide whether to issue a GCO.Because the GCO decision is itself fraught with uncertainty,the outcome must depend partly on the extent to which the auditor can effectively audit around the material weak-nesses.At one extreme,if the auditor is able to successfully offset the material weaknesses through audit procedures,and thefinancial statements are judged to be reliable,the GCO can be issued independent of whether a MWO is issued.At the other extreme,if the audi-tor is unable to audit around the material weaknesses and the reliability of thefinancialCAR Vol.XX No.X(X X)6Contemporary Accounting Researchstatements cannot be ensured,it can disclaim an opinion(i.e.,not issue a MWO)or with-draw from the engagement.11In practice,however,it is likely that the extent to which the auditor can audit around the material weakness,and therefore the uncertainty surround-ing the existence of the material weakness,lies between the two extremes,causing the auditor to become conservative in the issuance of the GCO.We posit that three factors can lead to auditor conservatism in the face of a MWO. First,the implication in the audit risk model that audit plans are adjusted adequately to offset variations in control risk is not supported by research evidence.Studies that use pre-SOX data(e.g.,Mock and Wright1999)do notfind that auditors vary audit plans or audit effort based on control reliance.Likewise,studies that used audit fees as a proxy for effort(e.g.,O’Keefe,Simunic,and Stein1994;Felix,Gramling,and Maletta2001)find no association for the pre-SOX period.However,based on data for the post-SOX years,Rag-hunandan and Rama(2006),Hoitash et al.(2008),and Hogan and Wilkins(2008)find a positive association between the presence of material weaknesses as disclosed in SOX302/ SOX404disclosures and audit fees.But,as Hogan and Wilkins(2008)point out,the increased fees could also reflect a risk premium rather than increased effort.If in fact audit plans are not sufficiently risk-adjusted in the presence of material weaknesses,there is uncertainty regarding the extent of assurance offinancial statement reliability.This could make it more difficult for the auditor to evaluate the futurefinancial performance or cashflows of thefirm and hence,the ability of thefirm to operate as a going concern.For example,companies that face uncertainties about going concern pres-ent management plans—including details about intentions to increase cashflows by issu-ing more debt or equity,and/or reduce spending(Behn,Kaplan,and Krumwiede2001)—to overcomefinancial stress.If the auditor’s assessment of management plans leads to the conclusion that these are credible mitigating factors,the auditor may not issue a GCO. The credibility of these plans however depends on the perceived accuracy of future fore-casts,which in turn depends on the reliability offinancial reporting.12Consequently,the auditor may respond to the heightened uncertainty about mitigating factors and become more conservative(i.e.,move its threshold)in the GCO decision.13Second,the negative consequences associated with material weaknesses can make it more difficult for companies that are already infinancial distress to obtain capital.Beneish et al.(2008)and Ashbaugh-Skaife et al.(2009)find that ineffective internal controls are associated with increased cost of equity,possibly reflecting increased information risk. Similarly,Dhaliwal et al.(2011)and Kim et al.(2011)provide evidence that MWOs are 11.AS2(and later AS5)explains that the auditor can issue a disclaimer due to scope limitations if it cannotapply the necessary procedures to express an opinion on ICFR.If,however,the scope restrictions are imposed by management,the auditor should resign from the engagement.12.For instance,Feng,Li,and McVay(2009)find a positive relation between internal control quality and theaccuracy of management guidance,consistent with ineffective internal controls causing errors in internal management reports.13.An example is provided in PHH Corporation’s10-Kfiling for the year ended Dec31,2005(http://www./Archives/edgar/data/77776/000095012306014446/y26027e10vk.htm).The audit report states“As discussed in Note28to the consolidatedfinancial statements,the uncertainty about the Company’s ability to comply with certain of itsfinancing agreement covenants...raises substantial doubt about its ability to continue as a going concern.”Note28mentions the internal control issues:“Due to the existence of material weaknesses in the Company’s internal control overfinancial reporting and delays in completing the2005auditedfinancial statements,it is now uncertain whether the Company can issue its2006quar-terlyfinancial statements within this extended date...the uncertainty about the Company’s ability to meet itsfinancial statement delivery requirements raises substantial doubt about the Company’s ability to continue as a going concern.”CAR Vol.XX No.X(X X)Auditor Reporting under Section4047 associated with increased cost of borrowing.In addition,Kim et al.(2011)find that bor-rowers with company-level weaknesses face stiffer loan conditions,in terms of borrowing rates and collateral requirements,than those with account-specific weaknesses.The increased costs and difficulties of raising capital forfirms with MWOs can reduce their ability to overcome thefinancial distress they are facing,exacerbating the going concern problems.If the auditor anticipates these negative consequences to the issuance of a MWO,it is also likely to issue a GCO.Third,some responders to the AS2proposal pointed out that both companies and their auditors may be subject to greater litigation risk when a MWO is issued.As dis-cussed,the internal control auditing standard explicitly requires the auditor to consider the internal control opinion when determining thefinancial statement audit opinion.Thus, any litigation concern regarding the MWO is likely to carry over to the GCO due to the jointness of the two opinions.Krishnan and Krishnan(1996)and Geiger and Raghunan-dan(2002)have provided evidence that auditors become conservative in the issuance of the GCO when faced with higher litigation risk.Thus,the issuance of a MWO can further induce conservatism in the auditor’s GCO decision.In sum,although in theory the GCO need not be impacted by a MWO,the issuance of a MWO can in practice cause the auditor to move their“threshold”for issuing the GCO,thus increasing the likelihood of a GCO.Therefore,we test the following null hypothesis:H YPOTHESIS.There is no difference in the propensity of auditors to issue GCOs tofinan-cially stressed companies to which they issue a MWO and to those to whichthey do not issue a MWO.In testing our hypothesis,we also extend it to distinguish between two types of mate-rial weaknesses,company-level and account-specific pany-level material weaknesses relate to fundamental problems such as the control environment or the overall financial reporting process,and account-specific weaknesses pertain to transactions and account balances.As Moody’s Investor Services notes,some company-level material weak-nesses cannot be audited around effectively because of the“pervasive nature”of the underlying internal control problems.Thus,although in theory auditors can deal with material weaknesses through substantive tests,it may be difficult in the case of a com-pany-level weakness to determine exactly where substantive testing should occur(Doyle et al.2007a).Further,Moody’s suggests that company-level material weaknesses call into question not only management’s ability to prepare accuratefinancial reports,but also its ability to control the business(Doss and Jonas2004).It is likely therefore that the ambi-guities in the GCO decision are heightened in the presence of a MWO pertaining to a company-level weakness.Therefore we extend our tests of our hypothesis to distinguish between company-level and account-specific material weaknesses.3.Model and sample selectionRegression modelWe use the following logistic regression model to test our hypothesis:GCO¼a0þa1MWOþa2PROBANKZþa3SIZEþa4AGEþa5BETAþa6VOLATILITYþa7RETURNþa8LEVþa9CLEVþa10DLOSSþa11INVESTMENTþa12BIG4þa13OCFþa14REPORTLAGþa15PRIORGCOþa16SEGMENTSþa17RESTRUCTURINGþeð1ÞCAR Vol.XX No.X(X X)。
Quality Control and AssuranceIntroductionQuality control and assurance are vital processes in any organization that aims to deliver high-quality products or services to its customers. In this document, we will explore the concepts of quality control and assurance and their importance in ensuring the quality of products and services.Quality ControlQuality control is the process of ensuring that products or services meet specified standards and customer requirements. It includes monitoring and inspecting the production process to identify defects or non-conformities and taking corrective actions to address them. Qualitycontrol aims to prevent defects from occurring and ensure that the final product meets the desired quality standards.Key Components of Quality Control1.Inspection: Inspection involves checking the products or services at various stages of the production process to identify any defects or deviations from the standards.2.Testing: Testing is conducted to verify the performance, functionality, and quality of the products against the specified requirements.3.Quality Assurance: Quality assurance involves establishing processes and procedures to ensure that the products or services meet the desired quality standards.Quality AssuranceQuality assurance is a proactive process that focuses on preventing defects and ensuring that the products or services meet the required quality standards. It involves establishing quality management systems, implementing quality control measures, and continuously improving processes to enhance quality.Key Principles of Quality Assurance1.Customer Focus: Quality assurance should be customer-centric, focusing on meeting customer needs and expectations.2.Continuous Improvement: Quality assurance involves continuously monitoring and improving processes to enhance quality and efficiency.3.Employee Involvement: Employees at all levels should be involved in the quality assurance process to ensure accountability and commitment to quality.Importance of Quality Control and AssuranceQuality control and assurance play a crucial role in ensuring the success and reputation of an organization. By implementing effective quality control measures, organizations can minimize defects, improve customer satisfaction, and enhance their reputation in the market. Quality assurance, on the other hand, helps organizations establish a culture of quality, compliance, and continuous improvement.Benefits of Quality Control and Assurance1.Improved Customer Satisfaction: Meeting quality standards and customer requirements can lead to higher customer satisfaction and loyalty.2.Reduced Costs: By preventing defects and errors, quality control and assurance help organizations save costs associated with rework, repairs, and customer returns.3.Enhanced Reputation: Consistently delivering high-quality products or services can enhance an organization’s reputation and credibility in the market.ConclusionIn conclusion, quality control and assurance are essential processes for ensuring the quality of products and services in an organization. By implementing robust qualitycontrol measures and establishing effective quality assurance processes, organizations can improve customer satisfaction, reduce costs, and enhance their reputation in the market. It is important for organizations to prioritize quality control and assurance to achieve long-term success and sustainability.The above document provides an overview of the conceptsof quality control and assurance, their key components, principles, importance, and benefits. By following these principles and implementing effective quality control and assurance processes, organizations can enhance their performance and reputation in the market.。
内部控制国外学者发表的观点英文回答:Internal Control: Perspectives from International Scholars.Internal control is a critical component of any organization, as it helps to ensure the accuracy and reliability of financial reporting, safeguard assets, and promote operational efficiency. Over the years, numerous international scholars have conducted extensive research on internal control, offering valuable insights into its various aspects.Committee of Sponsoring Organizations of the Treadway Commission (COSO)。
The Committee of Sponsoring Organizations of the Treadway Commission (COSO) is a renowned organization that has significantly contributed to the development ofinternal control frameworks. COSO's Internal Control Integrated Framework (IC-IF) provides a comprehensive model for evaluating and improving internal control systems. The IC-IF consists of five components: control environment,risk assessment, control activities, information and communication, and monitoring.International Internal Control Framework (IICF)。
内部质量保证体系英语Internal Quality Assurance System (IQAS)。
Definition:An internal quality assurance system (IQAS) is a set of processes and procedures designed to ensure the quality of internal audits within an organization. It provides a framework for monitoring, evaluating, and improving the effectiveness of the internal audit function.Purpose of an IQAS:The primary purpose of an IQAS is to:Enhance the credibility and reliability of internal audits.Ensure that internal audits are conducted in accordance with professional standards and best practices.Improve the efficiency and effectiveness of the internal audit function.Identify and address any deficiencies in the internal audit process.Key Components of an IQAS:An IQAS typically includes the following components:Independence and Objectivity Evaluation: Assesses the independence and objectivity of the internal audit function from the operations and management of the organization.Audit Planning and Execution Review: Examines the planning, execution, and reporting of internal audits to ensure they adhere to professional standards.Quality Control Monitoring: Monitors the implementation and adherence to internal audit policies, procedures, and standards.Continuing Professional Development: Ensures that internal auditors maintain their professional competence through ongoing training and development.Performance Evaluation: Evaluates the performance of individual internal auditors and the overall internal audit function.Corrective Action Plan: Identifies and implements corrective actions to address any deficiencies or weaknesses in the internal audit process.Management Reporting: Provides the organization's management with regular updates on the effectiveness and performance of the internal audit function.Benefits of an IQAS:Implementing an IQAS brings numerous benefits to an organization, including:Enhanced Audit Quality: Improves the reliability and accuracy of internal audits.Increased Stakeholder Confidence: Provides assurance to stakeholders that internal audits are conducted with integrity and professionalism.Improved Risk Management: Provides ongoing monitoring of risk and control processes, allowing for timely identification and mitigation of risks.Operational Efficiency: Streamlines the internal audit process, eliminating inefficiencies and improving resource utilization.Compliance Assurance: Ensures compliance with regulatory requirements and industry best practices.Cost-Effectiveness: Reduces the likelihood of costly rework or remediation efforts by identifying and addressing issues early on.Implementation of an IQAS:The implementation of an IQAS involves the following steps:Establish Framework: Define the scope, objectives, and policies of the IQAS.Develop Procedures: Document specific procedures for each component of the IQAS.Train and Communicate: Train internal auditors and other stakeholders on the IQAS and its implementation.Monitor and Evaluate: Regularly assess the effectiveness of the IQAS and make adjustments as needed.Reporting and Corrective Action: Report findings and recommendations to management and implement corrective actions.Conclusion:An internal quality assurance system (IQAS) is an essential component of an effective internal audit function. It provides a structured approach to monitoring, evaluating, and improving the quality of internal audits, ensuring that they are conducted in accordance with professionalstandards and best practices. By implementing an IQAS, organizations can enhance the credibility and reliabilityof internal audits, improve risk management, increase stakeholder confidence, and optimize the efficiency oftheir internal audit function.。
Internal Controls and ConditionalConservatismBeng Wee GohSingapore Management UniversityDan LiTsinghua UniversityABSTRACT:This study examines the relation between internal controls and conditionalconservatism ͑“conservatism”͒,also referred to as timely loss ing asample of firms that disclose material weaknesses ͑MWs ͒in internal controls under theSarbanes-Oxley Act ͑SOX ͒,we find a positive relation between internal control qualityand conservatism.Specifically,firms with MWs exhibit lower conservatism than firmswithout such weaknesses.Further,firms that disclose MWs and subsequently remedi-ate these weaknesses exhibit greater conservatism than firms that continue to haveMWs.Overall,these results are consistent with strong internal controls acting as amechanism that facilitates conservatism.Our study contributes to the literature on thereporting effects of strong versus weak internal controls.Keywords:internal controls;conservatism;material weaknesses;Sarbanes-OxleyAct .Data Availability:Data are available from sources identified in the text.I.INTRODUCTIONI n 2002,the U.S.Congress passed the Sarbanes-Oxley Act ͑SOX ͒to improve the quality of financial reporting and to restore investor confidence in the reliability of financial statements.An important aspect of SOX is its internal control reporting requirements,which allow inves-tors to be informed about the quality of a firm’s internal controls.Specifically,Section 302of the Act requires management to evaluate and report the effectiveness of disclosure and control pro-cedures ͑SEC 2002͒,while Section 404requires the auditor to form an opinion on the effective-We thank Steve Kachelmeier ͑senior editor ͒and two anonymous referees for suggestions and guidance that have signifi-cantly improved this paper.We also thank Bryan Church,Arnold Schneider,Eugene Comiskey,Steve Matsunaga,Jayanthi Krishnan,Jeffrey Ng,Michael Willenborg,Patricia Dechow,Yuan Zhang,Zhaoyang Gu,Ole-Christian Hope,Stephen Penman,Chee Yeow Lim,Chih-Ying Chen,and participants at the 2008AAA Annual Meeting for their comments.We also appreciate the financial support from Tsinghua University and funding through a research grant from the Office of Research,Singapore Management University.Editor’s note:Accepted by Steven Kachelmeier.THE ACCOUNTING REVIEWAmerican Accounting Association V ol.86,No.3DOI:10.2308/accr.000000412011pp.975–1005Submitted:January 2009Accepted:October 2010Published Online:April 2011975976Goh and Li ness of internal controls͑SEC2003͒.1Using these internal control disclosures,studies have investigated whether the quality of internal controls affects accruals quality͑Doyle et al.2007a; Ashbaugh-Skaife et al.2008͒,afirm’s cost of capital͑Ogneva et al.2007;Beneish et al.2008; Ashbaugh-Skaife et al.2009͒,and the accuracy of management guidance͑Feng et al.2009͒.Given the importance of the internal control provisions as a means to improve the governance offirms, our study extends the literature on the reporting effects of strong versus weak internal controls by examining how the quality of internal controls is related to conservatism infinancial reporting.We focus on conservatism because it has been argued to provide several governance benefits, such as reducing agency conflicts and improving managerial investment decisions͑Holthausen and Watts2001;Watts2003;Ball and Shivakumar2005͒,enhancing the efficiency of debt con-tracts͑Ahmed et al.2002;Zhang2008͒,and reducing litigation costs͑Watts2003͒.Following Basu͑1997͒,we define conservatism as the higher degree of verification to recognize good news as gains than to recognize bad news as losses.That is,earnings reflect bad news more quickly than good news leading to timelier loss recognition.The literature generally refers to this as conditional conservatism͑Beaver and Ryan2005;Ball and Shivakumar2005͒,which we simply refer to as “conservatism”in this study.2Within the agency framework of positive accounting theory that recognizes the contracting benefits of conservatism,it is plausible to expect that strong internal controls facilitate conserva-tivefinancial reporting.First,firms with a strong internal control environment͑e.g.,strong tone-at-the-top and/or good internal control culture͒are more likely to understand the role of conser-vatism in contracting and in reducing agency conflicts.Consequently,thesefirms are more likely to favor its implementation.Further,to the extent thatfirms are committed to produce conservative reports,strong internal controls can facilitate this process by providing reliable accounting infor-mation.Weak internal controls can cause estimation errors in accounting numbers͑Doyle et al. 2007a;Ashbaugh-Skaife et al.2008͒,making the contractible variables less reliable for contract-ing and monitoring purposes.This can reduce the effectiveness of conservatism as a governance mechanism and,hence,the incentives to implement conservatism.Finally,weak internal controls could impede the timely recognition of losses,thereby leading to lower conservatism.We develop these arguments on the positive relation between internal control quality and conservatism more fully in Section II.Moving away from the agency framework of positive accounting theory that argues the contracting benefits of conservatism,it becomes less clear why one would expect a positive relation between internal control quality and conservatism.First,it has been argued that conser-vatism can increase earnings management͑Levitt1998;Penman and Zhang2002͒,which can exacerbate agency conflicts.Under this view,if strong internal controls serve as an effective monitoring mechanism that can mitigate agency problems͑Jensen1993͒,then we should instead expect strong internal controls to provide a disincentive forfirms to produce conservative reports. Second,it is controversial whether conservatism is a desirable attribute offinancial reporting. Barth͑2008͒argues that conservatism is not a qualitative characteristic under the conceptual framework of IASB,which specifies that accounting information should be unbiased.Conserva-tism,by promoting the deliberate understatement of book value and/or earnings,would render 1In Endnote59of the SEC’s͑2002͒release on the Final Rule:Certification of Disclosure in Companies’Quarterly and Annual Reports,internal control is defined as“a process,effected by an entity’s board of directors,management and other personnel,designed to provide reasonable assurance regarding the reliability offinancial reporting.”2Another form of reporting conservatism,referred to as“unconditional conservatism,”manifests itself in a systematic undervaluation of thefirm’s net assets.Ball and Shivakumar͑2005͒argue that unconditional conservatism cannot yield contracting efficiency because it can be observed and,hence,can be“undone”by users of thefinancial statements.Accordingly,we do not consider unconditional conservatism in our context.The Accounting Review May2011 American Accounting AssociationInternal Controls and Conditional Conservatism977financial statements not neutral.Under this investor value relevance framework that emphasizes that accounting numbers should be neutral inputs to investment decisions,the argument that strong internal controls would promote conservative accounting seems tenuous.Given the above arguments and corresponding tension,we empirically test the relation be-tween internal control quality and conservatism usingfirms’internal control disclosures under SOX.We obtain a sample offirms that disclosed at least one material weakness͑MW͒from January2003to November2005and deem thesefirms͑hereafter referred to as“MWfirms”͒to have low internal control quality due to the presence of MWs.3We apply three measures of conservatism that are commonly used in the literature to capture the asymmetric timeliness in the recognition of economic losses:͑1͒the persistence of earnings changes measure in Basu͑1997͒,͑2͒the accrual-based loss recognition measure in Ball and Shivakumar͑2005͒,and͑3͒the time-liness of earnings to news measure in Basu͑1997͒.To afford stronger inferences to be made about the effects of internal controls on conservatism,we further conduct intertemporal tests of changes in the status of internal controls.Specifically,we examine whether MWfirms that subsequently remediate their weaknesses exhibit different levels of conservatism from MWfirms that continue to have these weaknesses.Results using all three measures of conservatism are consistent with a positive relation be-tween internal control quality and conservatism.Specifically,wefind that MWfirms exhibit lower conservatism than controlfirms without such weaknesses.Further,wefind that MWfirms that subsequently remediate their weaknesses͑i.e.,show an improvement in internal control quality͒exhibit greater conservatism than MWfirms that continue to have these weaknesses.These results are robust to a battery of checks,which include controlling for the self-selection bias in the MW firms sample,controlling for the self-selection bias in the improvement of internal control quality, and using alternative conservatism measures suggested by Khan and Watts͑2009͒and Givoly and Hayn͑2000͒.Taken together,our results are consistent with strong internal controls serving as a mechanism that facilitates conservatism.Doyle et al.͑2007a͒and Ashbaugh-Skaife et al.͑2008͒find a positive relation between internal control quality and accruals quality,which is measured by the extent to which accruals are realized as cashflows or the size of abnormal accruals.Our study differs from their studies by examining conservatism,which is a form of accounting bias toward reporting low book values of stockholder equity,conditional onfirms experiencing contemporaneous economic losses͑Ball and Shivakumar2005͒.4In both Doyle et al.͑2007a͒and Ashbaugh-Skaife et al.͑2008͒,the authors conjecture that theirfindings could be due to weak internal controls͑1͒causing unintentional ͑poor estimation ability͒errors,or͑2͒failing to limit intentional income-increasing earnings management.However,Ashbaugh-Skaife et al.͑2008͒find thatfirms that report internal control weaknesses have significantly larger positive and larger negative abnormal accruals relative to3According to Auditing Standards No.2͑PCAOB2004͒,which was in effect during the time period of our study,an MW is“a significant deficiency,or combination of significant deficiencies,that results in more than a remote likelihood thata material misstatement of thefinancial statements will not be prevented or detected.”A significant deficiency is“acontrol deficiency,or combination of control deficiencies,that adversely affects the company’s ability to initiate, authorize,record,process,or report externalfinancial data reliably in accordance with generally accepted accounting principles such that there is more than a remote likelihood that a misstatement of the company’s annual or interim financial statements that is more than inconsequential will not be prevented or detected.”4Ball and Shivakumar͑2006͒argue that conventional accruals models assume that the relation between accruals and cash flows are linear and do not take into account of the asymmetry in the gain and loss recognition role of accruals.Hence, these models misspecify the accounting accrual process and misestimate discretionary accruals,resulting in incorrect inferences about earnings quality.By examining the timely loss recognition property of earnings,our study takes into consideration the gain and loss recognition role of accruals and the nonlinearity implied by the asymmetry therein.This addresses the concerns in the use of the linear accrual models.The Accounting Review May2011American Accounting Association978Goh and Li controlfirms,which suggests that thefirst factor is more plausible.Nonetheless,these two factors need not necessarily result in lower conservatism per se.First,the unintentional estimation errors caused by weak internal controls should affect the recognition of bad news and good news in an unbiased and symmetrical manner.Accordingly, these estimation errors are not likely to cause conservatism per se,which results from the asym-metric response of earnings to bad versus good economic news.Second,even if weak internal controls fail to limit earnings management,the presence of income-increasing earnings manage-ment is not necessarily consistent with the presence of lower conservatism.Givoly et al.͑2010, 221͒argue that earnings management is situational or episodic,occurring when unmanaged earn-ings fail to meet an important reporting objective͑e.g.,meeting analysts’forecasts͒.Further, earnings management tends to be small-scale in nature due to the short supply of the needed positive accruals.Hence,if the company’s accounting is generally conservative,earnings manage-ment will only temporarily interrupt this observed reporting pattern but will not obscure the presence of the more prevalent phenomenon of conservatism.The implication is that earnings management and conservatism can co-exist within afirm.5Hence,our study complements Doyle et al.͑2007a͒and Ashbaugh-Skaife et al.͑2008͒by providing insights into how internal control quality is associated with the phenomenon of conservatism.Overall,our study extends the literature on the reporting effects of strong versus weak internal controls͑e.g.,Doyle et al.2007a;Ogneva et al.2007;Ashbaugh-Skaife et al.2008;Beneish et al. 2008͒.We show that strong internal controls can create an incentive for and facilitate conservative reporting.Our study also contributes to the literature that shows that conservatism is shaped,in part,by afirm’s contracting and governance environment͑e.g.,Ball et al.2000;Basu et al.2001; Ball et al.2003;Ball and Shivakumar2005;Bushman and Piotroski2006;Ahmed and Duellman 2007;LaFond and Roychowdhury2008͒.Section II develops the hypotheses,Section III explains the research design,Section IV presents the empirical results,Section V describes additional analyses,and Section VI concludes.II.HYPOTHESIS DEVELOPMENTIn an attempt to restore investor confidence infirms’financial reporting,SOX requiresfirms to assess and disclose,and auditors to certify,the effectiveness of internal controls overfinancial reporting͑SEC2002,2003͒.Presumably,regulators hope that these requirements can improve the quality of internal controls and enhance the reliability offinancial reporting.Indeed,studies have shown that effective internal controls can enhancefinancial reporting quality,proxied by accruals quality and the size of abnormal accruals͑Doyle et al.2007a;Ashbaugh-Skaife et al.2008͒. Further,Beneish et al.͑2008͒and Ashbaugh-Skaife et al.͑2009͒find that effective internal con-trols result in reduced information risk,which can lower afirm’s cost of equity.However,Ogneva et al.͑2007͒fail tofind a significant relation between internal control weaknesses and cost of equity after controlling for primitivefirm characteristics and analyst forecast bias.Finally,Feng et al.͑2009͒find a positive relation between internal control quality and the accuracy of management guidance,consistent with ineffective internal controls causing errors in internal management re-ports.Our study extends this stream of research by examining how the quality of internal controls affects conservatism infinancial reporting.Conservatism has been argued to play an important governance role in mitigating agency conflicts and enhancing contracting efficiency within thefirm͑Holthausen and Watts2001;Watts 5Consistent with this line of reasoning,Givoly et al.͑2010͒find that public equityfirms report more conservatively than their private equity counterparts,but at the same time,public equityfirms have a greater propensity to manage income.The authors also conduct two tests to show that earnings management and conservative reporting may independently exist in their data.The Accounting Review May2011 American Accounting AssociationInternal Controls and Conditional Conservatism979 2003;Ball and Shivakumar2005͒.The reasoning is that conservatism reduces managers’ability and incentives to overstate earnings and net assets by requiring higher verification standards for gain recognition and reduces managers’ability to withhold information on expected losses.Thus, it prevents overcompensation of managers that is costly to recover ex post because of managers’limited liability and tenure.6Similarly,in a debt-contracting setting,conservatism reduces man-agers’ability to loosen or avoid dividend restrictions and transfer wealth from bondholders to shareholders,thereby mitigating deadweight losses and increasingfirm value͑Ahmed et al.2002; Zhang2008͒.According to Ball and Shivakumar͑2005͒,conservative accounting effectively limits the control rights of managers and transfers those rights back to the providers offinance earlier.Finally,Watts͑2003͒asserts that conservatism can also reduce afirm’s expected litigation costs.Existing studies suggest that the incentives for or against conservative reporting are shaped,in part,by afirm’s contracting and governance environment͑e.g.,Ball et al.2000;Basu et al.2001; Ball2001;Ball et al.2003;Ball and Shivakumar2005;Bushman and Piotroski2006;Ahmed and Duellman2007;LaFond and Roychowdhury2008;LaFond and Watts2008;Nikolaev2010͒.For instance,Ahmed et al.͑2002͒argue that conservatism evolves as an efficient contracting mecha-nism to mitigate dividend policy conflicts between shareholders and bondholders.Theyfind that the more severe such conflicts are͑i.e.,the higher the leverage͒,the more conservative thefirm’s accounting choices Fond and Roychowdhury͑2008͒hypothesize andfind that when managerial ownership is low,the severity of the agency problem increases,driving a demand for greater conservatism.Ball and Shivakumar͑2005͒find that privatefirms are less conservative than publicfirms and attribute thisfinding partly to the differences in governance structures and moni-toring mechanisms between these two types offirms.Given that the internal control system plays an important governance role within thefirm to monitor managers’behavior and to minimize agency costs͑Fama and Jensen1983;Jensen1993͒,we conjecture a potential link between the quality of internal controls and conservative reporting.Within the agency framework of positive accounting theory that recognizes the contracting benefits of conservatism,strong internal controls could therefore create an incentive for conser-vative accounting reports.According to the Internal Control—Integrated Framework͑Committee of Sponsoring Organizations of the Treadway Commission1992͒,the internal control environment is an important component of internal controls.We argue thatfirms with a strong tone-at-the-top ͑e.g.,an effective board of directors that protects the interests of shareholders͒and good internal control culture͑e.g.,a corporate culture that has a wealth-maximization orientation͒are better able to understand the benefits of conservatism in reducing agency conflicts and deadweight loss,in contracting with shareholders and/or debtholders,and in reducing the litigation risks for directors, auditors,and managers.Consequently,thesefirms are more likely to favor the implementation of conservatism and promote an environment that emphasizes the adherence to conservative report-ing.To the extent thatfirms understand the benefits of conservatism and are committed to produce conservative reports,strong internal controls can facilitate the use of conservatism in the contract-ing process by providing reliable accounting information.This is because thefinancial reporting system,by emphasizing verifiable outcomes,supplies a rich set of variables that can be used for contracting purposes͑Watts and Zimmerman1986;Bushman and Smith2001;Armstrong et al. 2010͒.For instance,financial covenants used in debt contracts to limit managerial discretion with 6Conservative accounting reduces the tendency of managers with short-term horizons to invest in negative Net Present Value͑NPV͒projects,making managers aware that they will not be able to defer the recognition of losses to the future ͑Ball and Shivakumar2005͒and imposing greater costs to biasingfinancial reports upward͑Guay and Verrecchia2006͒.The Accounting Review May2011American Accounting Association980Goh and Li respect to dividend distributions͑Ahmed et al.2002͒are often defined in terms of accounting numbers.Similarly,managers’compensation can be tied to changes in book value͑or earnings͒.As mentioned earlier,weak internal controls can cause unintentional errors in accrual estima-tions to occur and impact the reported book value or earnings.For instance,the failure to have appropriate reconciliations and reviews in place allow for procedural errors in accrual estimations ͑Doyle et al.2007a͒,and the lack of adequate policies,training,or diligence by company employ-ees can affect the noise and magnitude of abnormal accruals͑Ashbaugh-Skaife et al.2008͒. Although these estimation errors cannot cause lower conservatism per se,they can make the contractible variables noisy and less reliable,providing a poor signal to the board of directors that conservatism has been used effectively in contracting and reducing the usefulness of conservatism in monitoring managers.7In sum,by enhancing the ability to use accounting numbers effectively in contracts,strong internal controls can create an incentive forfirms to use conservatism as a governance mechanism.Finally,weak internal controls could also impede the timely recognition of losses,thereby leading to lower conservatism.For instance,the lack of proper policies and procedures to regularly value afirm’s inventory orfixed assets prevents asset impairment from being discovered early and, hence,delays the recognition of losses.Unqualified accounting staff may lack the expertise to estimate the future cashflows of assets such as goodwill andfixed assets,and identify any reduction in future cashflows that would trigger early recognition of impairment losses.Weak internal controls in the monitoring of thefirm’s investment decisions can also provide the incen-tive for managers to avoid timely loss recognition in investment projects.One example is the lack of a proper process to provide the board of directors with timely information on thefirm’s investments for oversight and review,which could make it easier for managers to invest in or avoid divesting negative NPV projects.Further,control weaknesses over the computation of the present value of future profits of acquired businesses can result in potential loss-making projects not being discovered and terminated early.The Appendix provides some examples of MWs dis-closed byfirms that could potentially impede the timely recognition of losses.The above arguments suggest a positive effect of conservative accounting reports in terms of contracting efficiency.However,moving away from the agency framework of conservatism as a beneficial governance mechanism,it becomes less clear why one would expect a positive link between internal controls and conservatism.First of all,it is questionable whether conservatism is beneficial tofirms and their shareholders.For instance,Penman and Zhang͑2002͒contend that conservative accounting can create unrecorded reserves that provide managers with theflexibility to report more income in the future.The increased ability to manage earnings can adversely affect the predictive ability of current earnings for future earnings.In addition,three of thefivefinancial reporting problems highlighted by former SEC Chair Arthur Levitt deal with the understatement of assets—big bath charges,creative acquisition accounting,and cookie jar reserves͑Levitt1998͒.If so,then conservative accounting reporters may actually have greater ability to smooth or manipu-late earnings,which could exacerbate,rather than mitigate,agency problems.If strong internal controls serve as an effective monitoring mechanism to reduce agency conflicts͑Jensen1993͒, 7One may question why afirm would not ensure that internal controls are effective or remediate internal control weaknesses promptly if thefirm views strong internal controls as important in ensuring conservative reports.This could be due to several reasons.First,thefirm may fail to constantly invest in internal controls to keep up with the growth of thefirm.Second,managers may not be willing to invest in the time and resources to ensure effective internal controls because such actions divert attention away from the core business.Third,firms may face strainedfinancial resources.Fourth,firms may have complex operations,such as multiple operating segments,making it difficult to implement effective internal controls.The Accounting Review May2011 American Accounting AssociationInternal Controls and Conditional Conservatism981 then the claim that strong internal controls promote conservatism would become untenable.In-stead,strong internal controls could provide no incentive or even a disincentive forfirms to produce conservative accounting reports.Further,regulators and standard-setters do not necessarily view conservatism as a desirable attribute offinancial reporting.For instance,Barth͑2008͒points out that conservatism is not a qualitative characteristic of accounting information under the conceptual framework of the Inter-national Accounting Standards Board͑IASB͒.The framework specifies that accounting informa-tion should be unbiased,and freedom from bias is an essential characteristic of reliability and of neutrality͑IASB2001,para.31,36͒.Conservatism,by allowing the deliberate understatement of assets or income and/or the deliberate overstatement of liabilities or expenses,rendersfinancial statements not neutral and,therefore,jeopardizes the quality of reliability and unbiasedness de-sired by the conceptual framework.The Financial Accounting Standards Board͑FASB͒asserts that the best interest of users is served by neutral reporting accompanied by appropriate disclosure of“the nature and extent of the uncertainty surrounding events and transactions reported to stockholders and others”͑see SFAC No.2,FASB1980,para.93;FASB2000,para.96,97͒.8Consistent with this perspective,the FASB is shifting its focus toward fair value accounting,lessening the asymmetric treatment of bad and good news infinancial statements.If the objective offinancial reporting is to provide infor-mation useful for making economic decisions͑IASB2001,para.12͒,then having strong internal controls that ensure that thefinancial reports are unbiased would satisfy investors’demand for neutral information.Hence,within this investor value-relevance framework,the argument that strong internal controls would promote conservativefinancial reports͑which are essentially bi-ased͒seems tenuous.Given these potentially conflicting perspectives,we empirically test the relation between internal controls and conservatism and test the null hypothesis that internal control quality is unrelated to conservatism.In order to further ascertain the nature of any relation between internal controls and conservatism,we perform intertemporal tests,as in Ashbaugh-Skaife et al.͑2008͒,to determine whetherfirms with weak internal controls that subsequently show an improvement in internal controls exhibit different levels of conservatism fromfirms that fail to do so.This would help strengthen ourfinding on the relation between internal controls and conservatism.The null hypotheses we test are as follows:H1:There is no relation between internal control quality and conservatism.H2:Firms with weak internal controls that subsequently show an improvement in internal controls͑i.e.,remediate their internal control weaknesses͒exhibit no difference in con-servatism fromfirms that fail to do so.III.RESEARCH DESIGNMeasures of Accounting ConservatismPersistence of Earnings Changes(Basu1997)Ourfirst measure to capture the differential timeliness of loss versus gain recognition is the persistence of earnings changes in Basu͑1997͒.Basu͑1997͒shows that,relative to good news 8For example,in SFAC No.2the FASB states,“Conservatism infinancial reporting should no longer connote deliberate, consistent understatement of net assets and profits”͑FASB1980,para.93͒.The FASB also states in the same paragraph that conservatism“became deeply ingrained and is still in evidence despite efforts over the past40years to change it.”In the joint exposure draft by the FASB and IASB,Conceptual Framework for Financial Reporting͑FASB2008,para.BC2.21͒,it states that“the boards concluded that describing prudence or conservatism as a qualitative characteristic ora desirable response to uncertainty would conflict with the quality of neutrality because…an admonition to be prudentis likely to lead to a bias in the reportedfinancial position andfinancial performance…Accordingly,the proposed framework does not include prudence or conservatism as desirable qualities offinancial reporting information”͑em-phasis in the original͒.The Accounting Review May2011American Accounting Association。
内部控制教材,英文Introduction to Internal Control.Internal control is a crucial aspect of any organization, ensuring its efficient and effective operations, safeguarding assets, and maintaining financial integrity. It involves a system of procedures and policies designed to provide reasonable assurance regarding the achievement of objectives, the reliability of financial reporting, and compliance with applicable laws and regulations.Definition of Internal Control.Internal control can be defined as a process implemented by an organization's board of directors, management, and other personnel to provide reasonable assurance regarding the achievement of objectives in the following categories:1. Effectiveness and efficiency of operations.2. Reliability of financial reporting.3. Compliance with applicable laws and regulations.Importance of Internal Control.Internal control is essential for several reasons, including:1. Safeguarding Assets: It ensures that theorganization's assets are used appropriately and are protected from loss, theft, or misuse.2. Enhancing Efficiency: Effective internal controls streamline operations, improve decision-making, and reduce浪费 and redundancy.3. Improving Financial Reporting: Accurate financial reporting is crucial for making informed decisions,attracting investors, and complying with legal requirements.4. Risk Management: Internal controls help identify and mitigate risks, reducing the potential for financial losses and reputational damage.5. Compliance with Laws and Regulations: By ensuring compliance with applicable laws and regulations, internal controls help protect the organization from legal liability.Components of Internal Control.Internal control typically consists of the following components:1. Control Environment: This refers to the tone set by top management regarding the importance of internal control. It involves the integrity and ethical values of the organization's leadership, their commitment to controlling the business, and the allocation of authority and responsibility.2. Risk Assessment: This component involves identifyingand analyzing risks to the achievement of objectives, establishing risk response strategies, and monitoring risks on a regular basis.3. Control Activities: These are the specific policies and procedures implemented to ensure that management directives are carried out. Control activities can include approvals, authorizations, verifications, reconciliations, and audits.4. Information and Communication: Effective internal control requires timely and accurate communication of information within the organization. This includes the flow of information between different levels of management and among various departments.5. Monitoring: Monitoring involves ongoing evaluation of internal control systems to ensure their effectiveness and efficiency. This can be achieved through audits, reviews, and other forms of independent assessments.Implementing Effective Internal Control.To implement effective internal control, organizations should:1. Develop a Strong Control Environment: Leadership should establish a culture of ethics and integrity, demonstrate commitment to internal control, and allocate appropriate authority and responsibility.2. Assess and Manage Risks: Regular risk assessments should be conducted to identify and mitigate risks that could impact the organization's objectives.3. Design and Implement Effective Control Activities: Policies and procedures should be developed to ensure that management directives are followed, and controls should be designed to mitigate identified risks.4. Facilitate Information and Communication: Effective communication channels should be established to ensure timely and accurate flow of information within the organization.5. Monitor and Evaluate Internal Control: Regular monitoring and evaluation of internal control systems are crucial to ensure their effectiveness and efficiency. Independent audits and reviews can provide valuableinsights and recommendations for improvement.In conclusion, internal control is a fundamental aspect of any organization's success. By implementing effective internal control systems, organizations can safeguard their assets, enhance efficiency, improve financial reporting, manage risks, and comply with applicable laws and regulations. By fostering a culture of ethics and integrity, allocating appropriate authority and responsibility, and monitoring and evaluating internal control systems on a regular basis, organizations can ensure their long-term stability and profitability.。
Audit committee quality,auditorindependence,and internalcontrol weaknessesYan Zhang a ,Jian Zhoua,b,*,Nan Zhou a aSchool of Management,State University of New York at Binghamton,Binghamton,NY 13902-6000,United States b Lubin School of Accounting,Whitman School of Management,Syracuse University,NY 13244-2450,United StatesAbstractIn this paper we investigate the relation between audit committee quality,auditor independence,and the disclosure of internal control weaknesses after the enactment of the Sarbanes-Oxley Act.We begin with a sample of firms with internal control weak-nesses and,based on industry,size,and performance,match these firms to a sample of control firms without internal control weaknesses.Our conditional logit analyses indi-cate that a relation exists between audit committee quality,auditor independence,and internal control weaknesses.Firms are more likely to be identified with an internal control weakness,if their audit committees have less financial expertise or,more specif-ically,have less accounting financial expertise and non-accounting financial expertise.They are also more likely to be identified with an internal control weakness,if their auditors are more independent.In addition,firms with recent auditor changes are more likely to have internal control weaknesses.Ó2007Elsevier Inc.All rights reserved.0278-4254/$-see front matter Ó2007Elsevier Inc.All rights reserved.doi:10.1016/j.jaccpubpol.2007.03.001*Corresponding author.Tel.:+16077776067;fax:+16077774422.E-mail addresses:yzhang@ (Y.Zhang),jzhou@ (J.Zhou),nzhou@ (N.Zhou).Journal of Accounting and Public Policy 26(2007)300–327Y.Zhang et al./Journal of Accounting and Public Policy26(2007)300–327301 Keywords:Internal control weakness;Audit committeefinancial expertise;Auditor independence; Sarbanes-Oxley Act1.IntroductionThe Sarbanes-Oxley Act(hereafter SOX)of2002went into effect on July 30,2002to address the increasing concern of investors about the integrity of firms’financial reporting,due to scandals involving once well-respected com-panies,such as Enron and WorldCom and auditors,such as Arthur Ander-sen.One important aspect of SOX is that it has two sections specifically focusing on internal control issues related tofinancial reporting.Under Sec-tion302,management is required to disclose all material weaknesses in inter-nal control,when they certify the periodic,annual and quarterly,statutory financial reports.Under Section404,afirm is required to assess the effective-ness of its internal control structure and procedures forfinancial reporting and disclose such information in its annual reports.Furthermore,thefirm’s auditor is required to provide an opinion on the assessment made by the management in the same report.Because such mandatory disclosure under SOX provides us with more information on internal controls,we are inter-ested in investigating the determinants of internal control weaknesses in the post-SOX era.We begin with a sample offirms with internal control weaknesses,and, based on industry,size,and performance,match thesefirms to a sample of con-trolfirms without internal control weaknesses.Our conditional logit analyses indicate that a relation exists between audit committee quality,auditor inde-pendence,and internal control weaknesses.Firms are more likely to be identi-fied with an internal control weakness,if their audit committees have less financial expertise or,more specifically,have less accountingfinancial expertise and non-accountingfinancial expertise.They are also more likely to be identi-fied with an internal control weakness,if their auditors are more independent. In addition,firms with recent auditor changes are more likely to have internal control weaknesses.Our paper is related to several recent papers on the determinants of inter-nal control weaknesses.Krishnan(2005)examines the period prior to the enactment of SOX,when internal control problems are only disclosed in 8-Ksfiled byfirms when changing auditors.With information collected from 8-Kfilings,shefinds that independent audit committees and audit committees with morefinancial expertise are significantly less likely to be associated with the incidence of internal control problems.Ge and McVay(2005)and Doyle et al.(forthcoming)find that material weaknesses in internal control are more302Y.Zhang et al./Journal of Accounting and Public Policy26(2007)300–327likely forfirms that are smaller,less profitable,more complex,growing rap-idly,or undergoing restructuring.Ashbaugh-Skaife et al.(forthcoming)find thatfirms with more complex operations,recent changes in organization structure,auditor resignation in the previous year,more accounting risk exposure,and less investment in internal control systems are more likely to disclose internal control deficiencies.We document thatfinancial expertise in audit committees continues to be an important determinant of internal control weaknesses after the enactment of SOX.Ourfindings thus complement those in Krishnan(2005),who studies the pre-SOX period.Focusing on the post-SOX period enables us to take advantage of the wealth of information on internal control unleashed by SOX and to construct a sample offirms with internal control problems from both mandated disclosures in thefirms’10-Q and10-Kfilings under SOX and information disclosed in8-Kfilings whenfirms change auditors.Consist-ing of only thosefirms that change auditors in the pre-SOX period,the sample firms in Krishnan(2005)tend to be smaller in size and are traded on smaller stock exchanges.We avoid this sample selection bias by focusing on the post-SOX period,given that allfirms are required to disclose material internal control weaknesses under SOX.In addition,we document that auditor inde-pendence is an important determinant of internal control weaknesses.This adds to the literature that supports the hypothesis that auditor independence matters,such as Frankel et al.(2002)and Krishnamurthy et al.(2006).Differ-ent from other researchers who also focus on the post-SOX period,such as Ge and McVay(2005),Doyle et al.(forthcoming)and Ashbaugh-Skaife et al. (forthcoming),we show that audit committee quality,characterized as having morefinancial expertise or,more specifically,having more accountingfinancial expertise and non-accountingfinancial expertise,is an important determinant of internal control weaknesses.In addition,wefind that auditor independence, calculated as the ratio of audit fee to total fee,is also a determinant of internal control weaknesses.The rest of the paper is organized as follows.Section2introduces the back-ground and proposes our hypotheses.Section3describes the sample selection procedures.Section4discusses the empiricalfindings,and Section5presents our conclusions.2.Background and hypotheses2.1.BackgroundSOX emphasizes internal control,which is defined as‘‘a process,effected by an entity’s board of directors,management and other personnel,designed to provide reasonable assurance regarding the achievement of objectives’’,Y.Zhang et al./Journal of Accounting and Public Policy26(2007)300–327303 according to the COSO framework.1SOX Section302(hereafter SOX302), which went into effect on August29,2002,requires management to disclose significant internal control deficiencies,when they certify annual or quarterly financial statements.Specifically,the signing officers,being responsible for internal controls,have evaluated the internal controls within the previous ninety days and reported in theirfindings:(1)a list of all deficiencies in the internal controls and information on any fraud that involves employees who are involved with internal control activities;(2)any significant changes in inter-nal controls or related factors that could have a negative impact on the internal controls.Section404took this reporting a step further.It not only requires manage-ment to provide an assessment of internal controls,but also requires auditors to provide an opinion on management’s assessment.Under Securities Exchange Commission(SEC)Release No.33-8238(June5,2003),Section 404(a)requires issuers to disclose information concerning the scope and ade-quacy of the internal control structure and procedures forfinancial reporting in their annual reports.This statement shall also assess the effectiveness of such internal controls and procedures.Section404(b)requires the registered audit-ingfirm,in the same report,to attest to and report on the effectiveness of the internal control structure and procedures forfinancial reporting.2According to SEC Release No.33-8392(February24,2004),a company that is an‘‘acceler-atedfiler’’must comply with SOX Section404(hereafter SOX404)for itsfirst fiscal year ending on or after November15,2004.3Appendix A provides a 1COSO stands for the Committee of Sponsoring Organizations of the Treadway Commission, who undertook an extensive study of internal control to establish a common definition that would serve the needs of companies,independent public accountants,legislators,and regulatory agencies and to provide a broad framework of criteria,against which companies could evaluate the effectiveness of their internal control systems.COSO published its Internal Control–Integrated Framework in1992.2The SOX compliance information is from ,and the SOX summaries are from .3In SEC Release No.33-8238(June5,2003),an‘‘acceleratedfiler’’,defined in the original Exchange Act Rule12b-2,referred to a US company that has equity market capitalization over$75 million and hasfiled an annual report with the SEC.According to SEC Release No.33-8618 (September22,2005),prior to December1,2005,‘‘acceleratedfiler’’status did not directly affect a foreign private issuerfiling its annual reports on Form20-F or40-F,even though the definition of ‘‘acceleratedfiler’’did not expressly exclude foreign private issuers by its terms.After December1, 2005,a foreign private issuer meeting the acceleratedfiler definition,andfiling its annual report on Form20-F or Form40-F,became subject to the internal control reporting requirements under SOX404with compliance dates given in Appendix A.SEC Release No.33-8644(December21, 2005)amended the Exchange Act Rule12b-2definition of an‘‘acceleratedfiler’’to create a new category of acceleratedfiler,the‘‘large acceleratedfiler,’’for issuers with equity market value of $700million or more,and re-define the term‘‘acceleratedfiler’’to include an issuer with equity market value of$75million or more,but less than$700million.304Y.Zhang et al./Journal of Accounting and Public Policy26(2007)300–327 comprehensive schedule of Section404compliance dates,including those for non-acceleratedfilers and foreign private issuers.According to Compliance Week,most of the internal control weakness dis-closures under SOX302and SOX404are related tofinancial systems and pro-cedures.This group typically involvesfinancial closing processes,account reconciliation,or inventory processes.For example,United Stationers dis-closed problems with‘‘the design and effectiveness of internal controls relating to receivables from suppliers’’.Personnel issues rank as the second largest cat-egory of weakness disclosures.This category is related to the poor segregation of duties,inadequate staffing,or other related training or supervision prob-lems.For example,Sanmina-SCI cited a‘‘lack of sufficient personnel with appropriate qualifications and training in certain key accounting roles.’’Other common types of weaknesses include revenue recognition,documentation,and IT system and controls(e.g.,security and access controls,backup and recovery issues).In addition,issues related to international operations and mergers and acquisitions are sources of weakness disclosure,although they represent a rel-atively small percentage of all disclosures.For example,Masco cited internal control problems attributable to‘‘historical growth through acquisition and decentralized organizational structure,’’and GulfMark Offshore identified internal control deficiencies related to the complexity of their multi-national operations.Based on their severity,these internal control problems are classified into three types:material weakness,significant deficiency,and control deficiency. Auditing Standard(hereafter AS)No.2defines a material weakness as‘‘a sig-nificant deficiency,or combination of significant deficiencies,that results in more than a remote likelihood that a material misstatement of the annual or interimfinancial statements will not be prevented or detected.’’Under AS No.2,a significant deficiency is‘‘a control deficiency,or a combination of con-trol deficiencies,that adversely affects the company’s ability to initiate,autho-rize,record,process,or report externalfinancial data reliably in accordance with generally accepted accounting principles such that there is more than a remote likelihood that a misstatement of the company’s annual or interim financial statements that is more than inconsequential will not be prevented or detected.’’A control deficiency occurs‘‘when the design or operation of a control does not allow management or employees,in the normal course of per-forming their assigned functions,to prevent or detect misstatement on a timely basis.’’Since only material weaknesses are required to be publicly disclosed under SOX302and SOX404,we follow Doyle et al.,2006,forthcoming, and focus onfirms that disclosed material weaknesses in our study.4For the 4This is also driven by the fact that Compliance Week lists onlyfirms with material weaknesses starting March2005.Y.Zhang et al./Journal of Accounting and Public Policy26(2007)300–327305 sake of brevity,we will refer to material internal control weaknesses as internal control weaknesses hereafter.2.2.Audit committee quality and internal controlSince an entity’s internal control is under the purview of its audit committee (Krishnan,2005),we investigate the relation between audit committee quality and internal control weaknesses.The audit committee not only plays an impor-tant monitoring role to assure the quality offinancial reporting and corporate accountability(Carcello and Neal,2000),but also serves as an important gov-ernance mechanism,because the potential litigation risk and reputation impair-ment faced by audit committee members ensure that these audit committee members discharge their responsibilities effectively.We thus expect thatfirms with high-quality audit committees are less likely to have internal control weaknesses thanfirms with low-quality audit committees.On measuring audit committee quality,we focus on thefinancial expertise in these committees.The Blue Ribbon Committee on Improving the Effectiveness of Corporate Audit Committees(BRC)’s(1999)recommendation that each audit committee should have at least onefinancial expert highlights the impor-tance of thefinancial literacy and expertise of audit committee members.5Sec-tion407of the SOX incorporates the above suggestion and requiresfirms to disclose in periodic reports,whether afinancial expert serves on afirm’s audit committee and,if not,why not.Suchfinancial expertise of audit committee members has been shown to be important for dealing with the complexities offinancial reporting(Kalbers and Fogarty,1993)and for reducing the occur-rence offinancial restatements(Abbott et al.,2004).In addition,DeZoort and Salterio(2001)find that audit committee members withfinancial reporting and auditing knowledge are more likely to understand auditor judgments and sup-port the auditor in auditor-management disputes than members without such knowledge.Moreover,financially knowledgeable members are more likely to address and detect material misstatements.Audit committee members with financial expertise can also perform their oversight roles in thefinancial report-ing process more effectively,such as detecting material misstatements(Scarb-rough et al.,1998;Raghunandan et al.,2001).Indeed,Abbott et al.(2004)find a significantly negative association between an audit committee having 5The Report of the BRC’s recommendation related to Audit Committee Competence states that ‘‘the audit committee should consist of at least three members,each of whom is‘‘independent’’(defined in the Report as having‘‘no relationship to the corporation that may interfere with the exercise of their independence from management and the corporation’’)and‘‘financially literate’’(defined as‘‘the ability to read and understand fundamentalfinancial statements’’).At least one member of the audit committee should have accounting orfinancial management expertise(defined as past employment or professional certification in accounting orfinance,or comparable experience including service as a corporate officer withfinancial oversight responsibility)’’.306Y.Zhang et al./Journal of Accounting and Public Policy26(2007)300–327at least one member withfinancial expertise and the incidence offinancial restatement.Krishnan(2005)presents evidence that audit committees with financial expertise are less likely to be associated with the incidence of internal control problems.Therefore,we have the following directional prediction. Hypothesis1.Firms with greater audit committeefinancial expertise are less likely to have internal control weaknesses.DeFond et al.(2005)document significantly positive cumulative abnormal returns around the appointment of accountingfinancial experts to the audit committee,suggesting that audit committees with accountingfinancial exper-tise improve corporate governance.Therefore,we further separate audit committeefinancial expertise into accountingfinancial expertise and non-accountingfinancial expertise and test the relation between these two variables and internal control weaknesses.In measuring thefinancial expertise of an audit committee member,we fol-low the definition adopted in SOX Section407,and,more specifically,modify the definition used in DeFond et al.(2005).An audit committee member is a financial expert if he or she can be classified into the following two categories: (a)an accountingfinancial expert who has experience as a public accountant, auditor,principal or chieffinancial officer,controller,or principal or chief accounting officer;or(b)a non-accountingfinancial expert who has experience as the chief executive officer,president,or chairman of the board in a for-profit corporation,or who has experience as the managing director,partner or prin-cipal in venturefinancing,investment banking,or money management.With this definition,we measure audit committeefinancial expertise(ACFE)as the percentage of audit committee members who arefinancial experts.We fur-ther separate audit committeefinancial expertise into accountingfinancial expertise(ACCT_ACFE),measured as the percentage of audit committee members who are accountingfinancial experts,and non-accountingfinancial expertise(NONACCT_ACFE),the percentage of audit committee members who are non-accountingfinancial experts.2.3.Auditor independence and internal controlAuditor independence can be related to the disclosure of afirm’s internal control problems.When there is a strong economic bond between an auditor and a clientfirm,the auditor has an incentive to ignore potential problems and issue a clean opinion on the clientfirm’s internal controls.While some studies(DeFond et al.,2002;Asbaugh et al.,2003;Chung and Kallapur, 2003;Reynolds et al.,2004;Francis and Ke,2003)find no relation between non-audit fees and auditor independence and argue that an auditor’s concern with maintaining its reputation for providing high-quality audits could restrainY.Zhang et al./Journal of Accounting and Public Policy26(2007)300–327307 it from undertaking activities that jeopardize independence,since the revenue from each client will be a small percentage of the auditor’s total revenue,other studies suggest that the provision of non-audit services compromises auditor independence.For example,Frankel et al.(2002)find that non-audit services are associated with increased discretionary accruals and the achievement of certain earnings benchmarks and Krishnamurthy et al.(2006)document that the abnormal returns for Andersen’s clients around Andersen’s indictment are significantly more negative,when the market perceived the auditor’s inde-pendence to be compromised.Given these mixed empiricalfindings,we mea-sure auditor independence(RATIO)as the ratio of the audit fee to the total fee,and propose the non-directional null hypothesis,as follows. Hypothesis2.Auditor independence is not associated with the disclosure of internal control weaknesses.2.4.Control variables2.4.1.Audit committeeIn addition to audit committeefinancial expertise,other attributes of an audit committee have been found to be important factors in effective monitor-ing.Specifically,we control for audit committee independence,since Krishnan (2005)finds that there is a positive relation between audit committee indepen-dence and the quality of internal control prior to the enactment of SOX.6While SOX requires that audit committees be composed of all independent directors forfirms traded on an organized stock exchange(e.g.,NYSE,AMEX)or a rec-ognized dealer quotation system(e.g.,NASDAQ),exemptions may be given by the SEC,if it determines that it is appropriate under certain circumstances.We thus still control for audit committee independence(ACIND),defined as the percentage of independent directors on the audit committee.Under SOX,an audit committee member is independent,if he or she is not affiliated with the firm and does not accept any consulting fees.We next control for the natural logarithm of audit committee size(ACSZ), measured as the number of audit committee members,because research sug-gests that a large audit committee tends to enhance the audit committee’s sta-tus and power within an organization(Kalbers and Fogarty,1993),to receive more resources(Pincus et al.,1989),and to lower the cost of debtfinancing (Anderson et al.,2004).We thus expect that a large audit committee is more likely than a small one to improve the quality of internal controls,because6Previous research has also found an association between audit committee independence and the quality of accounting information(e.g.,Klein,2002b;Abbott et al.,2004).308Y.Zhang et al./Journal of Accounting and Public Policy26(2007)300–327 increased resources and enhanced status will make the audit committee more effective in fulfilling its monitoring role.We also control for the natural logarithm of audit committee meetings (ACMEET),measured as the number of audit committee meetings held each year,because research shows that effective audit committees meet regularly (Menon and Williams,1994;Xie et al.,2003).7Consistent with this hypothesis, McMullen and Raghunandan(1996)find that the audit committees offirms with SEC enforcement actions or earnings restatements are less likely to have frequent meetings than those without and Lennox(2002)finds that there is a significant increase in the number of audit committee meetings during an audi-tor dismissal year.However,it is also possible that an audit committee meets more frequently to discuss internal control issues,when there are significant problems associated with afirm’s internal controls.Therefore,we make no pre-diction on the relation between the number of audit committee meetings and the quality of internal controls.2.4.2.Board of directorsThe quality of an entity’s internal controls is a function of the quality of its control environment that includes the board of directors and the audit commit-tee(Krishnan,2005).First,we focus on board independence(BDIND),mea-sured as the percentage of outside directors on the board,8because research suggests that board independence is negatively related to the likelihood of financial fraud and SEC enforcement actions(Beasley,1996;Dechow et al., 1996).We also control for the natural logarithm of board size(BDSZ),mea-sured as the number of directors on the board.While some researchersfind that a large board has more expertise than a small one(Dalton et al.,1999), that it tends to be more effective in monitoring accruals(Xie et al.,2003), and that it leads to a lower cost of debt(Anderson et al.,2004),others suggest that a small board is more effective in mitigating the agency costs associated with a large board(Yermack,1996;Eisenberg et al.,1998;Hermalin and Weis-bach,1998,2003).Given the mixed empirical evidence on board size,we expect that the relation between board size and the likelihood of internal control weaknesses is indeterminate.Finally,we control for the natural logarithm of board meetings(BDMEET),as measured by the number of board meetings held each year.While Conger et al.(1998)suggest that board meeting fre-quency is important to improve board effectiveness,Vafeas(1999)finds that 7Hymowitz and Lublin(2003)report that‘‘many audit committees are spending far more time than they used to reviewingfinancial statements and overseeing auditors,meeting10or11times a year,up from three or four times.’’8Outside directors are those who are not affiliated with thefirm,other than serving on its board. Wefirst exclude those directors who are thefirm’s officers and major shareholders,and then further exclude those who have consulting relationships or other related-party transactions with thefirm.Y.Zhang et al./Journal of Accounting and Public Policy26(2007)300–327309it is inversely related tofirm value,because of the increased board activities fol-lowing share price declines.Since board independence,size,and meeting fre-quency all influence a board’s effectiveness,they,in turn,are related to the quality of internal controls.2.4.3.Auditor typesWe use a dummy variable(BIG4)to measure auditor type,9because afirm’s decision to hire a Big4auditor is likely to be associated with internal controls for several reasons.Doyle et al.(forthcoming)find that smaller and less prof-itablefirms are more likely to have internal control problems than larger or more profitable ones.On the one hand,suchfirms with internal control prob-lems are less likely to hire a Big4auditor,because they are constrained by financial resources and cannot afford it.On the other hand,they might also be avoided by the Big4auditors,because they are perceived as being risky and may expose the Big4to potential litigation.Given that afirm shunned by a Big4auditor may signal that it has potential internal control problems, we introduce the dummy variable BIG4to control for auditor quality.2.4.4.Auditor changesAshbaugh-Skaife et al.(forthcoming)find thatfirms with recent auditor changes are likely to have internal control problems.On the one hand,auditors may drop risky clients as part of their risk management strategies,sincefirms with material internal control weaknesses may represent high audit failure risk. On the other hand,firms may dismiss auditors for lack of performance,when thefirms discover material internal control weaknesses.Therefore,we use a control variable AUDCHG,which is equal to one,if there is an auditor change in2003or2004,and zero otherwise.2.4.5.Other variablesWe also control forfirm characteristics that may be associated with internal control problems.Since Doyle et al.(forthcoming)show that small and high growthfirms are likely to have internal control weaknesses,in our model,we control for size,measured as the natural logarithm of total assets(TA),and growth,measured as industry-median-adjusted sales growth(ADJSALEGR). It may take some time for afirm that recently engaged in mergers and acqui-sition to integrate different internal control systems;consequently,such afirm is more likely to have internal control problems.We thus introduce a dummy variable(ACQUISITION),which takes the value of one,if afirm engages in acquisitions during2003,2004and from January to July of2005,and zero otherwise.Since afirm experiencing restructuring is also likely to have internal control problems,because of the loss of experienced and valuable employees 9The dummy variable(BIG4)takes a value of one,if afirm is a Big4client and zero otherwise.。
Components of Internal Control内部控制的要素Internal control consists of five integrated components. 内部控制包括五个相关关联的要素。
Control Environment控制环境The control environment is the set of standards, processes, and structures that provide the basis for carrying out internal control across the organization. The board of directors and senior management establish the tone at the top regarding the importance of internal control including expected standards of conduct. Management reinforces expectations at the various levels of the organization. The control environment comprises the integrity and ethical values of the organization; the parameters enabling the board of directors to carry out its governance oversight responsibilities; the organizational structure and assignment of authority and responsibility; the process for attracting, developing, and retaining competent individuals; and the rigoraround performance measures, incentives, and rewards to drive accountability for performance. The resulting control environment has a pervasive impact on the overall system of internal control.控制环境是一套标准、流程与结构,能够为内部控制的实施提供基础。
THE ACCOUNTING REVIEWV ol.82,No.52007pp.1141–1170Accruals Quality and Internal Controlover Financial ReportingJeffrey T.DoyleUtah State UniversityWeili GeUniversity of WashingtonSarah McVayUniversity of UtahABSTRACT:We examine the relation between accruals quality and internal controlsusing705firms that disclosed at least one material weakness from August2002toNovember2005andfind that weaknesses are generally associated with poorly esti-mated accruals that are not realized as cashflows.Further,wefind that this relationbetween weak internal controls and lower accruals quality is driven by weakness dis-closures that relate to overall company-level controls,which may be more difficult to‘‘audit around.’’Wefind no such relation for more auditable,account-specific weak-nesses.Wefind similar results using four additional measures of accruals quality:dis-cretionary accruals,average accruals quality,historical accounting restatements,andearnings persistence.Our results are robust to the inclusion offirm characteristics thatproxy for difficulty in accrual estimation,known determinants of material weaknesses,and corrections for self-selection bias.Keywords:earnings quality;accruals quality;internal control;material weaknesses.Data Availability:All data used in the paper are available from publicly available sourcesnoted in the text;the data on internal control weaknesses are avail-able in machine-readable form from the authors upon request.I.INTRODUCTIONI n this paper we examine the relation between accruals quality and the internal controlenvironment of thefirm.By definition,when there is a material weakness in internal control,there is‘‘more than a remote likelihood that a material misstatement of theWe thank two anonymous reviewers,Dan Cohen,Patty Dechow,Dan Dhaliwal(the editor),Ilia Dichev,Kalin Kolev,Russ Lundholm,Matt Magilke,Zoe-V onna Palmrose,Christine Petrovits,Cathy Shakespeare,Tom Smith, and Suraj Srinivasan for their helpful comments and suggestions.This paper has also benefited from comments received at the20054-School Conference at Columbia University,the2005AAA Midwest Regional Meeting,the 2006AAA FARS Midyear Meeting,the2006Accounting and Finance Association of Australia and New Zealand Annual Meeting,the2006International Symposium on Audit Research Conference,and the University of Michigan. Editor’s note:This paper was accepted by Dan Dhaliwal.Submitted August2005Accepted January200711411142Doyle,Ge,and McVayAccruals Quality and Internal Control over Financial Reporting 1143The Accounting Review,October 2007Although there are several plausible explanations for the weaker results using the Section 404disclosures,one obvious difference between Sections 302and 404is the increased level of scrutiny under Section 404,which requires an audit opinion on the internal controls by the external auditors.It is possible that external auditors applied a lower effective threshold for Section 404compared to management’s threshold under Section 302and therefore identified a greater number of material weaknesses that lacked real financial reporting con-sequences.We discuss these results and other possible explanations later in Section IV .Our paper makes two primary contributions.First,we extend the literature on earnings/accruals quality.Conceptually,it makes sense that a good internal control system is the foundation for high-quality financial reporting,since strong internal controls likely curtail both procedural and estimation errors,as well as earnings management.Our findings present empirical evidence to support this fundamental link between internal controls and accruals quality.In addition,our paper extends this basic research question by (1)examining the types of material weaknesses (company-level versus account-specific),(2)distinguishing between the Section 302versus 404reporting regimes,(3)using a cross-section of five earnings/accruals quality measures,and (4)controlling for self-selection bias through the use of both a Heckman (1979)two-stage process and a propensity score matching approach (LaLonde 1986).Second,our paper provides empirical evidence on the effectiveness of Sections 302and 404of Sarbanes-Oxley.These sections have been among the most cumbersome of the new legislation,with many critics alleging that the costs of compliance far exceed any benefits.We find that the most informative material weakness disclosures (i.e.,those that are associated with real economic events such as lower accruals quality)are those that relate to more serious,company-level problems for both Sections 302and 404.Fur-thermore,the company-level disclosures made under Section 302seem to be more strongly related to lower accruals quality than the company-wide disclosures under Section 404.The disclosures of material weaknesses that report less serious,account-specific problems under both Sections 302and 404do not appear to be effective in our tests at identifying firms with lower financial reporting quality.Since the implementation of Sections 302and 404of Sarbanes-Oxley is fairly new,there are a number of concurrent papers in this area.Our findings are generally consistent with and complementary to these other papers.First,our main finding—that material weak-nesses are associated with lower accruals quality—is consistent with several other papers that examine this relation employing varying time periods,accruals quality proxies,and types of deficiencies (Ashbaugh-Skaife et al.2006;Bedard 2006;Chan et al.2005;Hogan and Wilkins 2005).2Second,our finding that the more auditable account-specific weak-nesses are not associated with lower accruals quality is complementary to Hogan and Wilkins (2006)who find that audit fees are abnormally high for firms with an internal control deficiency in the year preceding the deficiency disclosure,indicating that auditors are able to reduce the impact of poor controls through substantive testing.Finally,our conclusion that it is the internal control problem that is the root cause of the lower accruals quality is supported by Ashbaugh-Skaife et al.(2006)and Bedard (2006)who find that accruals quality improves in the year following the reported internal control problem for 2This finding also complements and motivates recent studies that examine market reactions to these disclosures as well as differences in the implied cost of capital for firms with weak internal controls (e.g.,Beneish et al.2006;DeFranco et al.2005;Hammersley et al.2008;Ogneva et al.2007).1144Doyle,Ge,and McVay The Accounting Review,October 2007firms that appear to have remediated their deficiencies.3In sum,the papers in this area jointly present a fairly cohesive picture of how internal controls affect accruals quality.The paper proceeds as follows.The next section motivates our hypotheses,and Section III describes our sample selection and variable definitions.Section IV presents our main results,and Section V describes our robustness tests.A summary and concluding remarks are offered in the final section.II.HYPOTHESESInternal control over financial reporting is defined as ‘‘a process ...to provide reason-able assurance regarding the reliability of financial reporting’’(PCAOB 2004)(emphasis added).By definition,good internal control is supposed to result in more reliable financial information.Internal controls aim to prevent and/or detect errors or fraud that could result in a misstatement of the financial statements.However,there is limited empirical evidence in the existing literature regarding the relation between the quality of internal control and the quality of accounting information.4A major reason is lack of data on internal control;in general,it is difficult to directly observe or verify internal control quality (Kinney 2000).Our sample is generated from the disclosures of material weaknesses in internal controls that first appeared as a result of Section 302of Sarbanes-Oxley,which requires that officers certify the financial statements,including the effectiveness of the internal control over financial reporting,and any material changes in internal control.Material weaknesses have also been disclosed in conjunction with Section 404requirements,which became effective for accelerated filers for fiscal years ending after November 15,2004.5Section 404requires that management issue a report on internal control over financial reporting,and that auditors attest to their findings.The unaudited internal control disclosures under Section 302are meant to be a transition to the full ‘‘attestation’’regime under Section 404,with Section 404becoming the ongoing internal control reporting mechanism.However,as the date for non-accelerated filers to comply with Section 404has been extended several times (most recently to December 15,2008for full attestation),internal control disclosures continue to be reported under Section 302for these smaller companies.Regardless of the origin of the material weakness disclosure,all else equal,we expect these disclosures to be informative about the quality of firms’accruals.3Altamuro and Beatty (2006)examine the impact of the FDICIA-mandated internal control reforms within the banking industry and find that these reforms led to improvements in earnings quality for banks affected by the regulation relative to unaffected banks during the same period.Their findings are also consistent with poorer internal control resulting in lower earnings quality.4In related work,Krishnan (2005)finds that internal control problems are negatively associated with the quality of the audit committee.To the extent that audit committee quality and internal control quality are positively associated,this finding supports our hypothesis.As noted in the introduction,there are several concurrent works examining earnings quality and internal control problems (e.g.,Ashbaugh-Skaife et al.2006;Hogan and Wilkins 2005).5Section 302of the Sarbanes-Oxley Act became effective for fiscal years ending after August 29,2002for all SEC registrants.Section 404became effective for fiscal years ending after November 15,2004for accelerated filers,a classification that generally includes public firms with a market capitalization of at least $75million (the due date was extended an additional 45days for accelerated filers with a market capitalization of less than $700million in November 2004).For non-accelerated filers,Section 404will be effective for years ending on or after December 15,2007for management assessment of the effectiveness of internal control and December 15,2008for the auditor’s attestation report.Since the reporting requirements differ on important dimensions that are likely correlated with accruals quality,we conduct sensitivity analyses that differentiate between Section 302and 404disclosures.These alternative results are discussed in Section IV .Accruals Quality and Internal Control over Financial Reporting1145 Prior research on earnings quality is generally related to accruals quality(Dechow and Schrand2004),and that is also the focus in this paper.Accruals can be of poor quality for two basic reasons:(1)management could intentionally bias accruals through earnings man-agement and(2)unintentional errors in accrual estimation could occur because it is difficult to predict an uncertain future,or simply because there are insufficient controls in place to detect errors.Both of these roles have been investigated in the existing literature.With respect to earnings management,managers have been shown to use‘‘discretionary accruals’’to manage earnings in various settings,such as prior to equity offerings(e.g.,Rangan1998; Teoh et al.1998).As for unintentional errors,Dechow and Dichev(2002)point out that the quality of accruals and earnings are not limited to managerial opportunism,but are also related to the inherent difficulty in estimating accruals forfirms with certain characteristics (e.g.,longer operating cycles).They measure the quality of accruals by the extent to which the accruals map into cashflows.In general,theyfind that the quality of accruals is poorer forfirms with certain characteristics,such as a high proportion of losses,more volatile sales and cashflows,lower total assets,and longer operating cycles.We expect that weaknesses in internal control will result in lower accruals quality because,by definition,they have the potential to allow errors in accrual estimation to occur and impact the reportedfinancial statements.These potential errors include both intentional (earnings management)and unintentional(poor estimation ability)errors.For a company with weak controls,intentionally biased‘‘discretionary’’accruals could be greater by failing to limit management’s ability to manage earnings(e.g.,by segregating duties).Uninten-tional errors could be higher if weak controls result in more estimation errors for difficult to estimate accruals(e.g.,by failing to ensure that qualified personnel are calculating es-timates)and allow more procedural errors(e.g.,by failing to have appropriate reconcilia-tions and reviews in place).As an example,Cardiodynamic International disclosed a ma-terial weakness related to the frequency of their analysis of the inventory obsolescence provision.This material weakness most likely resulted in estimation errors related to its inventory accounts,which may have been intentional to allow the understatement of ex-penses.These estimation errors,caused by the material weakness in internal control,likely resulted in lower overall accruals quality for Cardiodynamic.This leads to ourfirst hypothesis:H1:Material weaknesses in internal control are negatively associated with accruals quality.Ourfirst hypothesis is based on the notion that good internal control overfinancial reporting is an effective internal monitoring device and results in higher qualityfinan-cial reporting.However,the hypothesis does not consider external monitors.It is possible that auditors increase substantive testing when encountering weak internal controls.In other words,internal controls and substantive testing could be substitutes in producing high-quality accruals(e.g.,Wright and Wright1996).Our next hypothesis,therefore,is related to the‘‘auditability’’or potential severity of the internal control weaknesses.While a material weakness is the most severe type of internal control deficiency,within the material weakness classification the severity of internal control problems varies sub-stantially.Moody’s(the bond-rating company)proposes that material weaknesses fall into one of two categories.Account-specific material weaknesses relate to controls over specific account balances or transaction-level processes.Moody’s suggests that these types of ma-terial weaknesses are‘‘auditable,’’and thus do not represent as serious a concern regarding the reliability of thefinancial pany-level material weaknesses,however,The Accounting Review,October20071146Doyle,Ge,and McVay The Accounting Review,October 2007relate to more fundamental problems such as the control environment or the overall financial reporting process,which auditors may not be able to ‘‘audit around’’effectively.Moody’s suggests that company-level material weaknesses call into question not only management’s ability to prepare accurate financial reports,but also its ability to control the business (Doss and Jonas 2004).6The disclosure by Nitches,Inc.,illustrates a typical ‘‘company-level’’material weakness:In October 2004,our management concluded that there were certain material weak-nesses in our internal controls and procedures.The material weaknesses noted related to segregation of duties in the payroll process and in the monthly closing process;inadequate review and approval of management-level adjustments and entries.We have discussed these material weaknesses with our auditors,Moss Adams,LLP,who have recommended taking steps to alleviate the inadequate segregation of duties within these areas.This internal control problem could feasibly affect accruals quality.The lack of proper checks and balances might result in procedural errors,while inadequate review of mana-gerial adjustments might facilitate earnings management.Thus,we expect Nitches to exhibit poorer accruals quality than a similar firm (with respect to size,operating cycle,etc.)without a material weakness in internal control.A seemingly less severe ‘‘auditable’’ma-terial weakness was reported by I-Flow Corporation:As part of the annual audit process,a material weakness was identified in our controls related to the application of generally accepted accounting principles,specifically re-lated to the classification of the Company’s short-term investments,resulting in the Company reclassifying approximately $34million of cash and cash equivalents to short-term investments.It is not clear that this weakness would result in lower accruals quality.The distinction between company-level and account-specific material weaknesses is especially important for the more recent material weakness disclosures in our sample.These disclosures appear to be more conservative,and,per discussions with auditors,might be overly conservative.This leads to our second hypothesis:H2:Company-level material weaknesses have a stronger negative relation with accrualsquality than account-specific material weaknesses.III.DATA,SAMPLE SELECTION,AND V ARIABLE DEFINITIONSIdentifying and Classifying Firms with Material WeaknessesAs mentioned above,material weaknesses in internal control have only been widely disclosed in SEC filings since August 2002.To collect our test firms,we search 10-K Wizard (10-Ks,10-Qs,and 8-Ks;)using the keywords ‘‘mate-rial weakness’’and ‘‘material weaknesses’’from August 1,2002through October 31,2005.6It might seem that auditors should also be able to substantively test company-level weaknesses,however,the general nature of these weaknesses does not pinpoint where additional substantive testing should occur,while the account-specific weaknesses highlight a specific area where auditors can then focus more attention.Accruals Quality and Internal Control over Financial Reporting 1147The Accounting Review,October 2007We include only those firms that classify their internal control problem(s)as a material weakness,the most severe internal control deficiency.7We focus on material weaknesses for two reasons.First,it is the most severe type of deficiency in internal control and the most likely to affect accruals quality.Second,the disclosure of material weaknesses is effectively mandatory,while the disclosure of lesser ‘‘significant deficiencies’’is unambig-uously voluntary (see footnote 19).Focusing on the more mandatory disclosures helps avoid self-selection issues associated with voluntary disclosures.This procedure identifies 1,210firms that disclosed at least one material weakness from August 2002to November 2005,outlined in Table 1,Panel A.Of these firms,164are not covered by Compustat,and 79companies in our sample disclosed a material weakness related to lease accounting in 2005.These disclosures were responses to the views expressed by the Office of the Chief Accountant of the SEC in a February 7,2005letter to the AICPA.Due to the narrow,technical nature of this issue,we exclude these firms from our analysis (the inclusion of these firms leads to very similar results).If a parent and subsidiary both file with the SEC and report the same material weakness,then we include only the parent company and remove the subsidiary from our control firms if the subsidiary is covered by Compustat (17firms).We also exclude from our control sample the 100firms identified by Compliance Week ()as having a significant deficiency that does not reach the severity of a material weakness,in order to create a more powerful test between firms with clear internal control problems (firms reporting material weak-nesses)and those with no apparent internal control problems.Next,259(1,974)of our material weakness (control)sample firms have insufficient data to calculate our measure of accruals quality.We also eliminate three material weakness firms and 14control firms that were involved in a significant merger (greater than 50percent of sales)during the accruals quality estimation period,because the merger could result in mismatched current accruals and future cash flows (Hribar and Collins 2002).A significant merger is identified in Com-pustat footnote 1as ‘‘AB.’’These restrictions result in a sample of 705(3,280)material weakness (control)firms with non-missing accruals quality data and 645(2,943)mater-ial weakness (control)firms in our multivariate tests.8We summarize our sample selection process in Table 1,Panel A.We next classify firms as having either a company-level or account-specific material weakness in order to test the hypothesis that more severe,company-level weaknesses will be more negatively associated with accruals quality.We provide examples of each category in Appendix A.These classifications are mutually exclusive;if a firm has both company-level and account-specific weaknesses,then we code the firm as having a company-level material weakness.In some cases,it is straightforward to categorize a disclosure as company-level;for example,when ‘‘ineffective control environment’’or ‘‘management 7A material weakness is ‘‘a significant deficiency,or combination of significant deficiencies,that results in more than a remote likelihood that a material misstatement of the annual or interim financial statements will not be prevented or detected,’’as defined by the Public Company Accounting Oversight Board (PCAOB)under Auditing Standard No.2.A significant deficiency is defined as ‘‘a control deficiency,or combination of control deficien-cies,that adversely affects the company’s ability to initiate,authorize,record,process,or report external financial data reliably in accordance with generally accepted accounting principles such that there is more than a remote likelihood that a misstatement of the company’s annual or interim financial statements that is more than incon-sequential will not be prevented or detected’’(PCAOB 2004,para.9).8Of the 645material weakness firms in our final sample,eight were disclosed in 2002,55in 2003,207in 2004,and the remaining 375in 2005.Of the 375disclosures in 2005,276(74percent)correspond to our estimate of 404filers (a float greater than or equal to $75million).Only 15(7percent)of the disclosures from 2004correspond to 404filers (a float of greater than or equal to $75million and a filing date after November 14,2004).1148Doyle,Ge,and McVayThe Accounting Review,October 2007TABLE 1Sample Selection and Variable DefinitionsPanel A:Sample SelectionMaterial Weakness Sample Identified material weakness firms from August 2002to November 20051,210Less firms not covered by Compustat(164)Total material weakness firms covered by Compustat1,046Less firms with material weaknesses related only to accounting for leases (79)Less firms with unavailable data on accruals quality (259)Less firms with extreme merger and acquisition activity in the accruals quality estimation period (3)Total material weakness firms examined in univariate tests705Less firms with unavailable data for control variables(60)Total material weakness sample used in multivariate regressions645Compustat Control SampleAll Compustat firms with 2003data 6,431Less firms identified as having a material weakness (1,046)Less firms identified as having an internal control weakness other than a material weakness by Compliance Week (100)Less firms identified as the subsidiary of a material weakness firm (17)Less firms with unavailable data on accruals quality (1,974)Less firms with extreme merger and acquisition activity in the accruals quality estimation period (14)Total control firms examined in univariate tests3,280Less firms with unavailable data for control variables(337)Total control sample used in multivariate regressions2,943Panel B:Variable DefinitionsVariableDefinition Material Weakness DisclosuresMWAn indicator variable that is equal to 1if the firm disclosed a material weakness in internal control in our sample period (August 2002to November 2005),and 0otherwise.MW Account-Specific (Company-Level)An indicator variable that is equal to 1if the firm disclosed a material weakness in internal control in our sample period (August 2002to November 2005)related to an auditable account (a more pervasive company-wide problem),and 0otherwise.Accruals Quality Measures Accruals Quality (AQ)The standard deviation of the residuals from the Dechow and Dichev (2002)accruals quality measure,as adjusted by McNichols (2002)and Francis et al.(2005),measured from 1996–2002(see Section III).Discretionary Accruals The average of the absolute value of discretionary accruals from 1996–2002,where discretionary accruals are calculated following Becker et al.(1998).Average Accruals QualityThe average of the absolute value of the residuals from the Dechow and Dichev (2002)accruals quality measure,as adjusted by McNichols (2002)and Francis et al.(2005),measured from 1996–2002.(continued on next page )Accruals Quality and Internal Control over Financial Reporting1149The Accounting Review,October 2007TABLE 1(continued)VariableDefinition Historical RestatementAn indicator variable that is equal to 1if the firm was listed by the GAO as having restated their financial statements from 1997–2002,and 0otherwise.Earnings Persistence The coefficient on earnings from a cross-sectional regression of current earnings on one-year-ahead earnings estimated from 1996–2002.Innate Firm Characteristics That Affect Accruals QualityLoss ProportionThe ratio of the number of years of losses (Compustat annual data item #123)relative to the total number of years of data from 1996–2002.Sales VolatilityThe standard deviation of sales (data item #12),scaled by average assets (data item #6),from 1996–2002.CFO VolatilityThe standard deviation of cash from operations (data item #308),scaled by average assets,from 1996–2002.Total AssetsThe log of total assets (data item #6)from 2003Compustat.Operating Cycle The log of the average of [(Sales/360)/(Average Accounts Receivable)ϩ(Cost of Goods Sold/360)/Average Inventory)],calculated from 1996–2002.Additional Material Weakness Determinants That Could Be Related To Accruals Quality Firm AgeThe log of the number of years the firm has CRSP data as of 2003.SegmentsThe log of the sum of the number of operating and geographic segments reported by the Compustat Segments database for the firm in 2003.Extreme Sales GrowthAn indicator variable that is equal to 1if year-over-year industry-adjusted sales growth (data item #12)from 2002to 2003falls into the top quintile,and 0otherwise.Restructuring Charge The aggregate restructuring charges [data item #376ϫ(Ϫ1)]in 2003and 2002,scaled by the firm’s 2003market capitalization.override’’is specifically identified as a material weakness in the disclosure.However,most disclosures are not so forthcoming.Thus,if a firm has material weaknesses related to at least three account-specific problems,we classify the firm as having a company-level ma-terial weakness.In two cases,the firm has insufficient information to code the disclosure;we classify both of these disclosures as company-level.Of our 705firms with non-missing accruals quality data,426are classified as account-specific and 279as company-level.Accruals Quality MeasuresWe use the measure of accrual estimation error developed in Dechow and Dichev (2002)and modified in McNichols (2002)and Francis et al.(2005)as our main measure of accruals quality.This measure defines the quality of accruals as the extent to which they map into past,current,and future cash flows.We assume that this measure can capture the effect of internal control on accruals quality for two reasons.First,a large number of disclosed material weaknesses are related to specific accounts (e.g.,inventory [Ge and McVay 2005]).These specific accounts could have estimation errors that will be captured by this measure.For example,if the inventory account is overstated,then the obsolete inventory will not result in cash inflows in the next period,resulting in a low correlation between the accrual and realized cash flows.Second,compared to other measures of ac-cruals quality,the measure in Dechow and Dichev (2002)does not rely solely on earnings。