Connes' trace formula and Dirac realization of Maxwell and Yang-Mills action
- 格式:pdf
- 大小:439.18 KB
- 文档页数:31

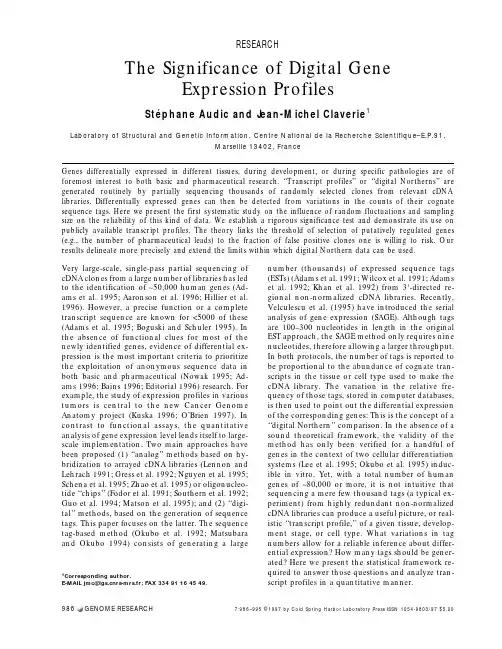
The Significance of Digital GeneExpression ProfilesSte´phane Audic and Jean-Michel Claverie1Laboratory of Structural and Genetic Information,Centre National de la Recherche Scientifique–E.P.91,Marseille13402,FranceGenes differentially expressed in different tissues,during development,or during specific pathologies are of foremost interest to both basic and pharmaceutical research.‘‘Transcript profiles’’or‘‘digital Northerns’’are generated routinely by partially sequencing thousands of randomly selected clones from relevant cDNA libraries.Differentially expressed genes can then be detected from variations in the counts of their cognate sequence tags.Here we present the first systematic study on the influence of random fluctuations and sampling size on the reliability of this kind of data.We establish a rigorous significance test and demonstrate its use on publicly available transcript profiles.The theory links the threshold of selection of putatively regulated genes (e.g.,the number of pharmaceutical leads)to the fraction of false positive clones one is willing to risk.Our results delineate more precisely and extend the limits within which digital Northern data can be used.Very large-scale,single-pass partial sequencing of cDNA clones from a large number of libraries has led to the identification of∼50,000human genes(Ad-ams et al.1995;Aaronson et al.1996;Hillier et al. 1996).However,a precise function or a complete transcript sequence are known for<5000of these (Adams et al.1995;Boguski and Schuler1995).In the absence of functional clues for most of the newly identified genes,evidence of differential ex-pression is the most important criteria to prioritize the exploitation of anonymous sequence data in both basic and pharmaceutical(Nowak1995;Ad-ams1996;Bains1996;Editorial1996)research.For example,the study of expression profiles in various tumors is central to the new Cancer Genome Anatomy project(Kuska1996;O’Brien1997).In contrast to functional assays,the quantitative analysis of gene expression level lends itself to large-scale implementation.Two main approaches have been proposed(1)‘‘analog’’methods based on hy-bridization to arrayed cDNA libraries(Lennon and Lehrach1991;Gress et al.1992;Nguyen et al.1995; Schena et al.1995;Zhao et al.1995)or oligonucleo-tide‘‘chips’’(Fodor et al.1991;Southern et al.1992; Guo et al.1994;Matson et al.1995);and(2)‘‘digi-tal’’methods,based on the generation of sequence tags.This paper focuses on the latter.The sequence tag-based method(Okubo et al.1992;Matsubara and Okubo1994)consists of generating a large number(thousands)of expressed sequence tags (ESTs)(Adams et al.1991;Wilcox et al.1991;Adams et al.1992;Khan et al.1992)from3Ј-directed re-gional non-normalized cDNA libraries.Recently, Velculescu et al.(1995)have introduced the serial analysis of gene expression(SAGE).Although tags are100–300nucleotides in length in the original EST approach,the SAGE method only requires nine nucleotides,therefore allowing a larger throughput. In both protocols,the number of tags is reported to be proportional to the abundance of cognate tran-scripts in the tissue or cell type used to make the cDNA library.The variation in the relative fre-quency of those tags,stored in computer databases, is then used to point out the differential expression of the corresponding genes:This is the concept of a ‘‘digital Northern’’comparison.In the absence of a sound theoretical framework,the validity of the method has only been verified for a handful of genes in the context of two cellular differentiation systems(Lee et al.1995;Okubo et al.1995)induc-ible in vitro.Yet,with a total number of human genes of∼80,000or more,it is not intuitive that sequencing a mere few thousand tags(a typical ex-periment)from highly redundant non-normalized cDNA libraries can produce a useful picture,or real-istic‘‘transcript profile,’’of a given tissue,develop-ment stage,or cell type.What variations in tag numbers allow for a reliable inference about differ-ential expression?How many tags should be gener-ated?Here we present the statistical framework re-quired to answer those questions and analyze tran-script profiles in a quantitative manner.1Corresponding author.E-MAIL jmc@rs-mrs.fr;FAX33491164549.RESEARCH 986RESULTSIn Methods we establish the probability distribution governing the occurrence of the same rare event in duplicate experiments.This probability distribution is a general result applicable to a wide variety of experimental situations,although this paper fo-cuses on its use to analyze digital gene expression patterns.The main and only mathematical assump-tion behind the derivation is that the observed events are rare and part of a large population of possible outcomes(the distribution of which is not specified).In the context of a digital Northern,one event is the observation of a given cDNA sequence tag,and the experiment consists of the random picking and partial sequencing of a number N of cDNA clones.Given the usual complexity(i.e.,the number of different genes expressed)of cDNA li-braries,observing a given cDNA qualifies as a rare event,as the abundance of most individual mes-sages is of the order of a few percents or less. Random Fluctuation vs.Significant Change in Tag Number:When to Infer Differential ExpressionLet us randomly pick N=1000clones from a cDNA library and generate the corresponding sequence tags;a given message(e.g.,interleukin-2)will be picked x(e.g.,two)times,with x in a typical(0–10) range.If we now redo this experiment,that is,again pick1000clones and generate the tags,the same message will now be picked y(e.g.,3)times.If the experiments have been duplicated correctly and the clones selected at random,we expect x and y to be close,albeit often different because of random fluc-tuations.In the Methods section,we show that the expected probability of observing y occurrences of a clone already observed x times is given by the simple formula:p(y|x)=͑x+y͒!x!y!2͑x+y+1͒(1)Equation1can be used to compute a confi-dence interval[y min,y max]⑀within which we expect to find y with a given probability,noted1–2⑀,where 2⑀is the significance level.For⑀small(e.g.,2.5%or less),y values falling outside the[y min,y max]⑀inter-val correspond to p(y|x)<<1,therefore pointing out very unlikely random fluctuations between the two experiments.The confidence intervals for the usual1%and5%significance levels are given in Table1.The same confidence intervals listed in Table1 can in fact be used to analyze the results of sampling N clones from two different libraries.Provided all experimental factors are well replicated,significant discrepancies between x(from one library)and y (from the other)will now characterize differentially expressed genes,for example,the relative abun-dance of which is unlikely to be the same in the two libraries.Simply reading Table1,we see that varia-tions in counts such as7→0,or2→12are signifi-cant(P<0.01)evidence of regulated gene expres-sion,whereas variations such as3→0or8→16are not(P>0.05).However,we do not advocate the use of rigid significance thresholds to analyze digital transcript profiles,as discussed below.Influence of the Sampling SizeSurprisingly at first,p(y|x)in Equation1does not involve the sampling size N,that is,the total num-ber of picked clones.The fluctuation probabilities, and confidence intervals,depend only on the values of the observed counts.To understand why,we must remember that Equation1governs the results of strictly duplicated experiments.Given N clones are sampled,the most likely tags to be picked up are, intuitively,those corresponding to cDNA,the abun-dance of which is of the order of1/N,or larger(ac-cording to Equation3,the probability of finding a given cDNA with1/N abundance while picking up N clones is0.63,see also Equation13).Choosing a sampling size therefore corresponds to targeting a given subset of genes,the level of expression of which allows their tags to occur at reasonable fre-quencies.As expected,more reliable inferences can be made on clones corresponding to larger absolute frequencies(i.e.,the ones more often picked up). For example(see Table1),a variation in counts from 1–3(threefold increase)is not indicative of a signifi-cant(P<0.05)increase,whereas a variation from 4–12is significant at P<0.05,and a variation from 7–21is significant at P<0.01.For a gene expressed at a given rate,increasing the sampling size N leads to higher tag counts,and allows more stringent sta-tistical inference to be made,for the same propor-tional variation.Most often in practice one wishes to compare digital Northerns or gene profiles that have been computed from the random picking of different numbers of clones,N1and N2.The mathematical problem is now to establish the probability for a given cDNA(e.g.,interleukin-2)to be picked up x times when the sampling size was N1and y times when the sampling size was N2.Equation1then becomes(see Methods):STATISTICAL ANALYSIS OF TRANSCRIPT PROFILESGENOME RESEARCHp͑y|x͒=ͩN2N1ͪy͑x+y͒!x!y!ͩ1+N2N1ͪ͑x+y+1͒(2)Whereas Equation1applied to the analysis of fluctuation in counts in strictly identical experi-ments,Equation2now applies to the analysis of counts in experiments only differing by the total number of clones randomly picked up.In practice, Equation2will be used to analyze experiments per-formed on two different libraries,using different sampling sizes.As for Equation1,small p(y|x)are expected to characterize the genes exhibiting regu-lated expression,the relative abundance of which is unlikely to be the same in the two libraries.Table1.Confidence Intervals in Function of the Value of xThe value of x(first column),one of the occurrence numbers.The intervals are given for the95%(2=0.05) and99%(2=0.01)confidence levels.Up to x=20,the exact boundaries,immediately outside the confi-dence interval(first significantly different values)are indicated.A star is used when none are possible.For larger values,the boundaries are given as percentages to be subtracted or added to x.Ricker’s confidence interval characterizes the value of,not y(see Methods).The use of a flat p()prior distribution results in the most stringent test,as expected.Although the number(N)of clones sampled does not appear in the expres-sion of p(y|x)(Equation1),its influence shows in the fact that the confidence interval becomes proportionally smaller as x(and y)increases(e.g.,1¨7has the same statistical significance as40¨60).For the same expression level,larger N will result in larger absolute values for x and y,making the detection of significant differential expression more sensitive.Comparison with Fisher’s(2×2)Exact TestThe(2ן2)contingency tables arising from treat-ment versus control experiments are traditionally analyzed with Fisher’s exact test(Siegel1956; Agresti1996).Differential EST count data can be presented in a tabulated form so as to suggest the use of this test,as follows:Brain cDNA library Liver cDNA libraryNumber of actin ESTs211 Number of other ESTs9981189Total clones sampled10001200 The statistical significance according to Fisher’s exact test for such a result is4.6%(two-tail P-value,i.e.,the probability for such a table to occur in the hypothesis that actin EST frequencies are in-dependent of the cDNA libraries).In comparison, the P-value computed from the cumulative form (Equation9,see Methods)of Equation2(i.e.,for the relative frequency of actin ESTs to be the same in both libraries,given that at least11cognate ESTs are observed in the liver library after two were observed in the brain library)is1.6%.Fisher’s(2ן2)exact test is always more conservative than our test(e.g., Fisher’s P-value of1.6%requires a2→13EST count transition in the above setting).Besides being too conservative,there is a more fundamental difficulty in using this test to analyze EST count data.The sampling scheme assumed by Fisher’s exact test in principle requires the total number of data values in the contingency table to be fixed,as well as both the row marginal total and the column marginal totals. In our prospective experimental situation,only the column marginals(i.e.,the numbers of clones sampled from each library)are fixed.The extension of Fisher’s exact test to cases where only one set of marginal totals is fixed(Tocher1950)is still contro-versial.In the context of the above EST counting results,there is an additional problem with the lack of homogeneity in the definition of the‘‘other EST’’category.This category represents different subsets of transcripts for different libraries.The use of Fisher’s(2ן2)exact test is more natural for a different type of EST data analysis:the study of library-dependent alternative transcripts of the same gene(i.e.,splice or polyadenylation vari-ants)(D.Gautheret,O.Poirot,F.Lopez,S.Audic, and J.-M.Claverie,in prep.).Here,the results for an hypothetical gene G1may look as follows:G1-relatedtranscripts inbrain libraryG1-relatedtranscripts inliver library Long-form mRNA210Short-form mRNA83Total G1-relatedclones1013where the alternative categories are unambiguously defined and refer to the same objects.For example, the above results constitute good evidence that G1is expressed in different forms in those tissues(Fisher’s exact test two-tail P-value=1.2%).False Leads in the Selection of Candidate GenesA crucial measure of the power of statistical signifi-cance tests is their rate of false alarm,that is,how often random fluctuations are expected to be mis-taken for significant differences in the results.When analyzing the transcript profiles from two different libraries,a false alarm would cause a gene to be deemed differentially transcribed,whereas in fact it is not.The rate of false alarm is therefore a direct estimate of the fraction of false leads,when search-ing for differentially expressed genes on the basis of differences in tag counts.The rates of false alarm associated with the P<0.01and P<0.05confi-dence intervals listed in Table1have been com-puted by Monte-Carlo simulation on the basis of two experimental sequence tag distributions(Table 2;Fig.1).The rate of false alarms associated with the use of Equation1(in fact,its cumulative form Equa-tion9,see Methods)is very small for genes repre-sented by small tag counts and slowly increases for higher tag counts,without ever exceeding the se-lected significance level.Such good behavior vali-dates the use of the confidence intervals(Table1) computed from Equation1and Equation9to assess the statistical significance of variations in digital Northern data.The curves labeled‘‘window’’char-acterize the very similar behavior of a slightly less conservative derivation of the same test(see Meth-ods,Equation15).For comparison,Figure1also presents the behavior of another test,based on an inappropriate application of Ricker’s confidence in-tervals(Ricker1937)(see Methods).DISCUSSIONAn appropriate statistical test is now at our disposal to begin analyzing digital gene expression profiles STATISTICAL ANALYSIS OF TRANSCRIPT PROFILESGENOME RESEARCHin a more quantitative way.For example,the test can be used to determine how many genes appear regulated at various confidence levels using the data from a typical experiment(e.g.,sampling a thou-sand clones).We analyzed the data gathered by Okubo et al.(1995)on the human promyelocytic leukemia cell line HL60induced by dimethylsulfox-ide(DMSO)or tetradecanoylphorbolacetate(TPA). Table3shows the21EST classes the occurrences of which exhibit significant variations at the1%level. Most of the corresponding genes make biological sense in term of differentiation along the granulo-cyte or monocyte pathways.This example serves to discuss a subtle point in the interpretation of the P values computed from Equation1,2,and9.Rigorously,these equations apply to the case where a given gene(e.g.,lipocor-tin)would have been selected for scrutiny before looking at the differences in cognate tag counts be-tween libraries.When comparing two libraries with-out specifying in advance the transcripts we want to follow,and then focusing a posteriori on any of those exhibiting significant variations,the average number of expected false positive N f a l s e is N false=PN species,where N species is the number of dif-ferent transcript species encountered and p is a given significance level.For instance,in the experi-ment analyzed in Table3,N species is of the order of 600(Okubo et al.1995).It is therefore possible that up to four(600ן7ן10מ3)out of the21transcript species listed in Table3are not truly differentially expressed.Therefore,when two libraries are compared without prior gene selection,the use of a predeter-mined significance threshold is not advisable.The P values computed from Equation1,2,and9should simply be used to rank all observed variations by order of decreasing statistical significance(analo-gous to how‘‘similarity hits’’are listed after data-base searches).The end-users can then make their own choice about the number of candidate target genes to be retained from the top of the list,bearing in mind the corresponding number of expected false positives.Although the present interpretation of a digital Northern focuses on the genes exhibiting the most spectacular differential expressions,there is already ample evidence that small changes can cause drasticTable2.Publicly Available Distributions of Sequence Tags(Left)Data from Velculescu et al.(1995):Frequency of occurrence of each of the428transcriptspecies represented in840SAGE tags randomly generated from a3Ј-directed cDNA library fromhuman pancreas.(Right)Data from Okubo et al.(1992):Frequency of occurrence of each of641transcript species represented in982randomly sequenced clones from a3Ј-directed cDNAlibrary from human liver cell line HepG2.AUDIC AND CLAVERIE990effects.Disease states caused by haploinsufficiency and trisomy suggest that2→1or2→3propor-tional changes in expression level may be of biologi-cal significance.Table1shows that there is no theo-retical limit to the detection of such small variations from the comparison of digital expression patterns. Simply,the sampling size has to be increased enough for the required numbers of cDNA tags to reach a significance threshold(for instance 40→60,for a confidence level of95%).Analog hybridization-based methods(Fodor et al.1991;Lennon and Lehrach1991;Gress et al. 1992;Southern et al.1992;Guo et al.1994;Matson et al.1995;Nguyen et al.1995;Schena et al.1995; Zhao et al.1995)are traditionally opposed to digital tag-counting methods(Okubo et al.1992;Matsub-ara and Okubo1994;Lee et al.1995;Okubo et al.1995;Vel-culescu et al.1995)for theanalysis of differential geneexpression.Both types ofmethods are sensitive to thequality of the original messen-ger RNA preparation and/orcDNA libraries.Analog meth-ods promise higher through-put,lower cost,and have thecapacity of studying transcriptson a much wider scale of abun-dance.They are therefore ex-pected to supersede digitalmethods.On the down side,however,hybridization signalsare not easily reproducible,andcan be affected by many un-known properties such as thecDNA library complexity,aswell as clone and sequence spe-cific features(e.g.,insert size,nucleotide composition,pres-ence of repeats,secondarystructure,triple helix interac-tion,etc.).Therefore,the hy-bridization-based methods re-quire an estimation of the dis-persion of the signal associatedwith each clone(i.e.,enoughrepetitions of each experi-ment),and multiple standard-ization and calibration proce-dures to allow the meaningfulcomparison of hybridizationpatterns obtained from varioussources(tissues,cell types,etc.) or from different membranes or chips.This is far from routine and has yet to be worked out.In con-trast,and thanks to the unique properties of the Poisson distribution,digital methods have the ca-pacity of providing a quantitative assessment of dif-ferential expression without the repetition or the standardization of individual tag-counting experi-ments.The statistical analysis presented here pro-vides an objective method to analyze digital tran-script profile data,and adapts it to fit(1)the num-ber of leads one wants to be followed;(2)the fraction of false clues to be tolerated;and(3)the level of modulation in gene expression considered of biological interest.A program is available on our web site(http:// rs-mrs.fr)to compute the confidenceFigure1Rate of false alarm computed according to the confidence intervalslisted in Table1.(Top)Monte-Carlo simulation of the random sampling of840tags distributed according to the data from Velculescu et al.(1995;see Table2).(Bottom)Monte-Carlo simulation of the random sampling of982ESTs distrib-uted according to the data from Okubo et al.(1992;see Table2).The fre-quency of false alarm was computed for two significance levels(2⑀=5%,leftand2⑀=1%,right)and plotted in function of the tag class size(from1–64forVelculescu et al.,from1–22for Okubo et al.).In all cases,the rate of false alarmincreases up to a plateau for larger class sizes.The test(cumulative form ofEquation1)derived from the flat p()prior shows perfect behavior with amaximal rate of false alarm always less than the significance levels(brokenlines).The test(cumulative form of Equation15)derived from the window p()prior exhibits a slightly higher rate of false alarms.Both versions of the testexhibit conservative behaviors for class size<5,with a false alarm rate even lessthan expected.In contrast,Ricker’s confidence intervals(Equation12)aregrossly inadequate and lead to false alarm rates up to four times the significancelevel.Graphs are computed from the analysis of1000repetitions of each ex-periment.STATISTICAL ANALYSIS OF TRANSCRIPT PROFILESGENOME RESEARCHintervals corresponding to arbitrary significance lev-els and sampling size N1and N2.METHODSLet us denote p(x)the probability to observe x sequence tags of the same gene(i.e.,from the3Јend of the same transcript) when N cDNA clones are picked randomly.For each transcript representing a small(i.e.,less than5%)fraction of the library and Nജ1000,p(x)will closely follow the Poisson distribu-tion:p͑x͒=e−xx!(3)whereis the actual(albeit unknown)number of transcript of this type per N clones in the library.If we duplicate this ex-periment(i.e.,once again randomly pick N clones of the same library and generate sequence tags),we will now observe y occurrences of the same transcript.What is the probability of the various y values?An approximate solution consists in us-ing x as the maximum likelihood estimate forand compute the probability for y occurrences given a Poisson distribution of mean=x:p͑y|x͒=e−x x yy!(4)Equation4is not symmetrical in x and y.This is an ob-vious flaw as the probability should not depend on which of the x or y values were observed first.p(y|x)=p(x|y)should hold provided that an equal number N of clones is sampled in both experiments.Equation4is not the correct formula,be-cause we have not yet taken into account the fluctuation of x around the unknown mean.To account for the fact that the actual value ofis unknown,we have to integrate Equation4 over all possiblevalues:p͑y|x͒=͐0ϱdp͑d=|x͒p͑y|d=͒(5) p(d=|x)in Equation5is the probability that the actualTable3.List of ESTs Exhibiting Significant(P<0.01)Differences inAbundance in the HL60Cell Line Induced by DMSO or TPAEST ID HL60HL60+TPA HL60+DMSO Significance418221013ן10מ7211241024ן10מ71982328ן10מ735616203ן10מ638012106ן10מ513541206ן10מ528514811ן10מ4201501102ן10מ424401143ן10מ429313613ן10מ429211015ן10מ465014525ן10מ433515339ן10מ444410412ן10מ316740814ן10מ31550834ן10מ38616107ן10מ33056207ן10מ318060607ן10מ318080607ן10מ317660607ן10מ3Only the probability(computed according to Equations7and8)corresponding to the most significanttransition(numbers in bold)is listed(Okubo et al.1995).The total EST numbers sampled from the HL60,HL60+TPA and HL60+DMSO cDNA libraries are845,845,and1058,respectively.ESTs418,211,356,285,293,292,650,335,444,861,305corresponding to ribosomal proteins,and EST380,a tag to an unkown gene,exhibit a marked reduction of expression level in the DMSO-and/or TPA-induced differentiated states.Inconstrast,ESTs135(ferritin),2015(LD78/macrophage inflammatory protein),1674(methionine adenosyl-transferase),155(thymosin-4),1806(lipocortin),1808(thymosin-10),and1766(a metallothionein)appear more abundant in the TPA-induced state,also highly enriched in EST19(the ubiquitous elongationfactor1-␣).-Actin(EST244),is the only markedly increased tag in the DMSO-induced state.EST numbers,abundance data,and protein assignments are from the‘‘body map’’public expression data repository athttp://www.imcb.osaka-u.ac.jp(K.Okubo and K.Matsubara).AUDIC AND CLAVERIE992abundance of a given transcript isgiven that x occurrences of a cognate tag have been observed in one experiment.The second term in the integral is the probability of drawing y occurrences given a Poisson distribution of mean:p͑y|d=͒=e−yy!(6)Using Bayes’theorem p(d=|x)can be written asp͑d=|x͒=p͑x|d=͒p͑d=͒͐0ϱdЈp͑x|d=Ј͒p͑d=Ј͒(7)To evaluate Equation7,we need to define the prior dis-tribution p(d=).The least constrained hypothesis(i.e.,with the least information content),is to attribute an equal a priori probability to allvalues in the[0,ϱ]range.Incorporating such a flat prior in Equation5leads top͑y|x͒=1x!y!͐0ϱde−2͑x+y͒(8)From the definition of the⌫function for integer arguments we observe that͐0ϱde−2͑x+y͒=͑x+y͒!2͑x+y+1͒and finally obtain the expression given in Results:p͑y|x͒=͑x+y͒!x!y!2͑x+y+1͒(1)This equation can be used in a wide variety of experi-mental situations.Equation1defines the probability of ob-serving x and y occurrences of the same rare event in dupli-cated experiments,regardless of the detailed probability dis-tribution of those events among the set of possible outcomes. In particular,in the context of transcription profiles,p(y|x) can be evaluated regardless of the distribution of each tran-script(provided it is rare)within a cDNA library.To compute the confidence intervals listed in Table1,we made use of the cumulative distributions:C͑yഛy min|x͒=͚y=0yഛy min p͑y|x͒(9a)D͑yജy max|x͒=͚y=y maxϱp͑y|x͒(9b) These equations allow the computation of an interval [y m i n,y m a x]⑀s u c h a s C(yഛy m i n|x)ഛ⑀a n d D(yജy max|x)ഛ⑀.Given that an event is observed x times in one experiment,the number y of occurrences of this event in a duplicate experiment is expected to fall within the interval [y min,y max]⑀with a probability of1–2⑀.Equation9,a and b, can therefore serve as a significance test when comparing,for instance,the results of sampling N clones from two different libraries.For2⑀small(e.g.,5%or less),y values falling outside the[y min,y max]⑀interval correspond to p(y|x)<<1,and point out significant differences between the two experiments. They should include differentially expressed genes,for ex-ample,for whichis different in the two libraries.Generalization to Different Sampling SizesWhen different numbers of clones N1and N2are sequenced from the same library,Equation5becomesp͑y|x͒=͐0ϱd2͐0ϱd1p͑d1=1|x͒p͑y|d2=2͒␦ͩ2מN2N11ͪ(10) where the two abundance values1and2are forced in the same ratio as N1and ing the same bayesian argument as before(Equation7)leads top͑y|x͒=1x!y!ͩN2N1ͪy͐0ϱd1e−1ͩ1+N2N1ͪ1͑x+y͒(11)the last integral is simply͑x+y͒!ͩ1+N2N1ͪ͑x+y+1͒leading to the formula presented in the Results section:p͑y|x͒=ͩN2N1ͪy͑x+y͒!x!y!ͩ1+N2N1ͪ͑x+y+1͒(2)Ricker’s Confidence IntervalThe confidence interval computed from Equation1(and its cumulative form,Equation9,a and b)is different from one introduced previously by Ricker(1937)although,at first,the two may appear to be related.Given x occurrences of a sequence tag,Ricker’s formula defines a confidence interval[min,max]x for(again the actual number of transcripts of this type per N clones in the library)such asp͑kഛx͒=͚k=0x e−maxmax kk!ഛ␣2(12a) andp͑kജx͒=͚k=xϱe−minmin kk!ഛ␣2(12b) where␣is typically5%or1%.Ricker’s confidence intervals for various values of x are given in Table1.Those intervals are close to those computed from Equation1,but delineate the range of likelyvalues,not y(the number of occurrences of the same event in a duplicated experiment).It is possible for x and y to fall outside each other’s Ricker’s confidence interval [min,max],while still being nonsignificant fluctuations around the samevalue.The confidence intervals computed from Equation12,a and b,are therefore too narrow to prop-erly define significant discrepancies between x and y.The false alarm rate associated with the use of Ricker’s confidence in-tervals is too high(Fig.1).However,an interesting use of Equation12,a and b,is the estimation of the range of possible frequencies[min,max]x=0for cDNAs not yet encountered after picking N clones.For example,the95%confidence interval is given by:0<N<3.7(13) That is,the abundance of a cDNA not picked up among STATISTICAL ANALYSIS OF TRANSCRIPT PROFILESGENOME RESEARCH。
第十四章 14: CFX 表达式语言(CEL)CFX Expression Language (CEL) is an interpreted, declarative language that has been developed to enable CFX users to enhance their simulations without recourse to writing and linking separate external Fortran routines.You can use CEL expressions anywhere a value is required for input in ANSYS CFX.CEL can be used to:•Define material properties that depend on other variables.•Specify complex boundary conditions.•Add terms to the solved equations.You can also monitor the value of an expression during the solution using monitor points. Important: There is some CEL that works elsewhere in ANSYS CFX, but not in CFD-Post. Any expression created in CFX-Pre and used as a Design Exploration output parameter could potentially cause fatal errors during the Design Exploration run, so you should create all expressions for Design Exploration output parameters in CFD-Post.14.1.1. Values and ExpressionsCEL can be used to generate both values and expressions. Values are dimensional (that is, with units) or dimensionless constants. The simplest type of definition is the dimensionless value, for example:b = 3.743You can also specify a value with units, for example:g = 9.81 [m s^-2]The dimensions of the quantities of interest for CFD calculations can be written in terms of mass, length, time, temperature and angle. The concept of units is fundamental to the behavior of values and expressions.Values can be used directly, or they can be used as part of an expression. For example, you can use an expression to add two values together:<Expr_1> = <Value_1> + <Value_2>In this example, you may want to predefine <Value_1> and <Value_2>, but this is not required. However, in order to add two quantities together, they must have the same dimension; that is, it is meaningful to add a quantity in inches to one expressed in meters, but it is not meaningful to add one expressed in kilograms to one in square feet.Expressions can also be functions of other (predefined) expressions:<Expr_2> = <Expr_1> + <Value_3>Units follow the conventions in the rest of CFX, in that a calculation has a set of solution units (by default, SI units), and that any quantity can be defined either in terms of the solution units, or any other set of units with the correct form.An expression does not have its own units string, but if it references quantities that have dimensions, these will determine the resulting units for the expression. For example, if an expression depends inversely on the square of the x coordinate, then it has implied dimensions of length to the power -2.14.1.1.1. Using Locators in ExpressionsA CFX simulation has physics areas and mesh areas; physics areas are boundaries while mesh areas are regions. These two types of area can occupy completely different spaces in a simulation; however, there is no requirement that area names be unique between physics and mesh. This can lead to ambiguities when you use these names in expressions.To avoid these ambiguities, ANSYS CFX first checks to see if "@<locator>" is a physics name; if this is not found, the name is checked in the list of mesh names. Thus if "in1" is both the name of a physics area and the name of a mesh area, "@<locator>" is taken to indicate the physics area.ANSYS CFX also has @REGION CEL syntax so that you can identify a named area as being a mesh area. Thus to identify the mesh area in1, you would use the syntax:@REGION:in1Note that if <locator> does not appear as a physics name or a mesh name, the expression fails.14.1.2. CFX Expression Language StatementsThe CFX Expression Language is declarative. You declare the name and definition of the expression using expression language statements. The statements must conform to a predefined syntax that is similar to Fortran mathematical statements and to C statements for logical expressions.The statement must consist of the following:• a number, optionally with associated units. This defines a constant. Constants without units are termed dimensionless.•for mathematical expressions, one or more references to mathematical constants, system variables, or existing user variables, separatedby +(addition), - (subtraction), * (multiplication), / (division)and ^(exponentiation), with optional grouping of these by parentheses. Thesyntax rules for these expressions are the same as those for conventionalarithmetic.•for logical expressions involving relational operators, one or more references to mathematical constants or results from mathematical expressions, separatedby <= (is less than or equal to), < (is less than), == (is equal to),!= (is not equalto), > (is greater than) and >= (is greater than or equal to) with optional groupingof these by parentheses.•for logical expressions involving logical operators, one or more references to logical constants or results from relational operations separatedby !(negation), && (logical AND) and || (logical OR), with optional grouping byparentheses.14.1.2.1. Use of ConstantsConstants do not need to be defined prior to being used in an expression. For example, you could choose to evaluate the expression x + 5 [m]. Or, you could define a constant, b = 5 [m] and then create an expression x + b.The logical constants are false and true. Results of logical expressions are either false or true, which are evaluated as 0 and 1 (corresponding to false and true, respectively) when a numerical representation is required.The use of constants may be of benefit in generating complicated expressions or if you have several expressions that use the same constants.14.1.2.2. Expression SyntaxAll numbers are treated as real numbers.The precedence of mathematical operators is as follows (from highest to lowest):•The power operator ^ as in x^y.•The unary minus or negation operator - as in -x.•Multiplication and division as in x*y/z.•Addition and subtraction as in x+y-z.The precedence of logical and relational operators is as follows (from highest to lowest):•The negation operator ! as in !x.•The relational operators involving less than or greater than (<=, <, > and >=) as in x >= y.•The relational operator is equal to and is not equal to (== and !=) as in x != y.•The logical AND operator (&&) as in x && y.•The logical OR operator (||) as in x || y.14.1.2.3. Multiple-Line ExpressionsIt is often useful, particularly with complex expressions, to use more than one line when creating your expression. CFX allows you to use multiple lines to generate an expression, provided each line is separated by an appropriate operator.For example, you may have an equation, A + B/C, that consists of three complex terms, A, B, and C. In this case, you could use three lines to simplify creating the expression:A +B/ CNote that the operator may be used at the end of a line (A +) or at the beginning of a line (/ C). You do not need to enter the operator twice.Once the expression has been created, it will appear in the Existing Definitions list box as if it were generated on a single line (A + B/C).14.2.1. CEL OperatorsCFX provides a range of mathematical, logical and operational operators as built-in functions to help you create complex expressions using the Expression details view.Table 14.1: CEL Operators14.2.2. Conditional if StatementCEL supports the conditional if statement using the following syntax:if( cond_expr, true_expr, false_expr )where:• cond_expr : is the logical expression used as the conditional test •true_expr : is the mathematical expression used to determine the result if theconditional test is true .• false_expr : is the mathematical expression used to determine the result if theconditional test is false . Note: The expressions true_expr and false_expr are always evaluated independent of whether the evaluation of cond_expr is true or false . As a consequence, a conditional statement cannot be used to avoid division by zero as in if( x>0, 1/x, 1.0). In this case, when x=0.0, a division by zero will still occur because the expression 1/x is evaluated independent of whether x>0 is satisfied or not.14.2.3. CEL ConstantsRight-click in the Expression details view to access the following useful constants when developing expressions:Table 14.2: CEL Constants14.2.4. Using ExpressionsThe interaction with CEL consists of two phases:• a definition phase, and,• a use phase.The definition phase consists of creating a set of values and expressions of valid syntax. The purpose of the Expression details view is to help you to do this.14.2.4.1. Use of Offset TemperatureWhen using temperature values in expressions, it is generally safer to use units of [K] only. When units are used that posses an offset (for example, [C]), they are converted internally to [K]. For terms that have temperature to the power of unity, any unit conversion will include the offset between temperature scales. However, in all other cases the offset is ignored because this is usually the most appropriate behavior. You should therefore take care when specifying an expression involving non-unit powers of temperature. For example, each of the expressions below is equivalent:Temperature = 30 [C]Temperature = 303.15 [K]Temperature = 0 [C] + 30 [K]Temperature = 273.15 [K] + 30 [K]These are only equivalent because all units are to the power of unity and units other than [K] appear no more than once in each expression. The following expression will not produce the expected result:Temperature = 0 [C] + 30 [C]This is equivalent to 576.30 [K] because each value is converted to [K] and then summed. The two expression below are equivalent (as expected) because the offset in scales is ignored for non-unit powers of temperature:Specific Heat = 4200 [J kg^-1 C^-1]Specific Heat = 4200 [J kg^-1 K^-1]15.5. Quantitative Function ListThe available quantitative functions are outlined in the sections that follow.In the table that follows, <Expression> applies to CFD-Post only. CFX-Pre andCFX-Solver can only accept variables as arguments to quantitative functions. Note that for CFX-Pre and CFX-Solver, an Additional Variable can be used to pass an expression indirectly into a quantitative function.The behavior of the functions in the table below depends on the type of <Location>. Typically:•On domains and subdomains, the functions use vertex (node) values for the operand.•On a boundary, the functions use conservative values for the operand unless this is overridden by the Boundcon variable operator in CFX-Pre.•On user locations in CFD-Post, the functions use values interpolated from nodal values.Table 15.4: CEL Functions in CFX-Pre/CFX-Solver and in CFD-Post15.5.1. areaThe area function is used to calculate the area of a 2D locator.area[_<Axis>[_<Coord Frame>] ]()@<Location>where:•<Axis> is x, y, or z•<Coord Frame> is the coordinate frame•<Location> is any 2D region (such as a boundary or interface).An error is raised if the location specified is not a 2D object. If an axis is not specified, the total area of the location is calculated.。
Mason's ruleMason's gain formula is a method for finding the transfer function of a given control circuit/loop when you have the signal flow graph. It is used frequently in control theory, and was derived by Samuel Jefferson Mason.[1]It can be determined by looking at a signal-flow graph, or a block diagram. Mason's Gain Formula provides a step by step method to obtain the transfer function from a block diagram or signal flow graph. An alternate method would be to find the transfer function algebraically by labelling each signal, writing down the equation for how that signal depends on other signals, and then solving the multiple equations for the output signal in terms of the input signal. Some people prefer a more structured approach, and Mason's Formula may be easier or more difficult depending on the graph in question.Contents[hide]▪ 1 Formula▪ 2 Usage▪ 3 Equivalent matrix form▪ 4 Notes▪ 5 References[edit] FormulaThe gain formula is as follows:where:▪Δ = the determinant of the graph.▪y in= input-node variable▪y out= output-node variable▪G= complete gain between y in and y out▪N= total number of forward paths between y in and y out▪G k= gain of the k th forward path between y in and y out▪L i= loop gain of each closed loop in the system▪L i L j= product of the loop gains of any two non-touching loops (no common nodes)▪L i L j L k= product of the loop gains of any three pairwise nontouching loops▪Δk = the cofactor value of Δ for the k th forward path, with the loops touching the k th forward path removed. I.e. Remove those parts of the graph which form the loop, while retaining the parts needed for the forward path.[edit] UsageTo use this technique,1Make a list of all forward paths, and their gains, and label these G k.2Make a list of all the loops and their gains, and label these L i (for i loops). Make a list of all pairs of non-touching loops, and the products of their gains (L i L j). Make a list of all pairwise non-touchingloops taken three at a time (L i L j L k), then four at a time, and so forth, until there are no more.3Compute the determinant Δ and cofactors Δk.4Apply the formula.[edit] Equivalent matrix formMason's rule can be stated in a simple matrix form. Assume is the transient matrix of the graph where is the sum transmittance of branches from node m toward node n. Then, the gain from node m to node n of the graph is equal to , where,and is the identity matrix.There have been times when I wanted to determine the z-domain transfer function of some discrete network, but my algebra skills failed me. Some time ago I learned Mason's Rule, which helped me solve my problems. If you're willing to learn the steps in using Mason's Rule, it has the power of George Foreman's right hand in solving network analysis problems.This blog discusses a valuable analysis method (well known to our analog control system engineering brethren) to obtain the z-domain transfer function equations of digital signal processing (DSP) networks. That method, called "Mason's Rule" (sometimes called "Mason's Gain Formula"), was developed by Samuel Mason in the early 1950s to analyze interconnected analog systems[1-3]. Here we describe Mason's Rule and present several examples showing the utility of this network analysis technique. Mason's Rule enables us to determine the H(z) = Y(z)/X(z) transfer function of complicated networks, such as multi-feedback loop networks.Mason's Rule is also particularly useful for deriving the z-domain transfer function of, say, a discretenetwork that has inner feedback loops embedded within outer feedback loops (nested loops). Here's the good news: if we are able to draw the block diagram of some discrete network, then the application of Mason's Rule will give us that network's z-domain H(z) transfer function. Once we have H(z) we can then use all the algebraic and software tools at our command to determine the frequency-domain behavior, and stability, of the network. Here we describe Mason's Rule, accompanied by several examples, in the hope this robust analysis technique is of use to the reader in their future DSP network analysis efforts. For our purposes, Mason's Rule is a method to derive a discrete network's z-domain transfer function by identifying various forward paths from the input node to the output node of a discrete network, and the various feedback paths that may, or may not, share common signal nodes with those feedforward paths. This sounds mysterious, but it's not really too complicated. Let's define our Mason's Rule terminology and then demonstrate this analysis technique by way of examples.I. A Few DefinitionsMason's Rule is based on converting a network's block diagram to a signal flow diagram like that shown in Figure 2, and identifying crucial signal paths and loops.we establish the following definitions:A gain symbol is an arrowhead with its associated z-domain function (indicated by an uppercase letter), such as a sample delay (z-1) or a constant multiplier. The direction of the arrowhead shows the direction of signal flow. A signal node is a single point in the flow diagram. In Figure 2, signal nodes are indicated by an italicized lowercase letter. A path is a sequence of signal flow branches from one node to another node. A forward path is a path that travels from the x(n) input to the y(n) output, without going through the same node twice. In Figure 2, the path from node a to node g, [a,b,c,d,e,f,g], is a forward path. The gainof that forward path is the product ACDFGI. A loop is a path that starts and ends at the same node, with no node encountered more than once. That is, a loop is a feedback path. In Figure 2, the path from node b to node c and back to node b is a loop. A signal flow diagram, of course, can have multiple forward paths and multiple loops. Nontouching loops are two loops that do not share a common signal node. In Figure 2, the loops [b,c,b] and [d,e,d], for example, are nontouching loops. The loops [b,c,b] and [b,c,d,e,f,g,b] are touching loops because they share the signal nodes b and c. The loop gain of a loop is the product of all the branch gain symbols within a loop. In Figure 2, the loop gain of the [d,e,d] loop is the product FE. The loop gain of the [b,c,d,e,f,g,b] loop is the product CDFGIJ. With those simple definitions established (here comes the exciting part), we define the Δ(z) determinant of a signal flow diagram as: Δ(z) = 1 – the sum of all loop gains+ the sum of products of nontouching loop gains taken two at a time– the sum of products of nontouching loop gains taken three at a time+ ... etc. (1)The "nontouching loop gains taken two at a time" are the combinations of pairs of loop gains. The pairs of nontouching loop gains in Figure 2 are the loop gain combinations: CB,FE; CB,IH; and FE,IH. The "nontouching loop gains taken three at a time" are the combinations of triplets of loop gains. The only triplet of nontouching loop gains in Figure 2 is the loop gain combination: CB,FE,IH.The Δ(z) determinant for the diagram in Figure 2 isΔ(z) = 1 – (CB + FE + IH + CDFGIJ)+ (CBFE + CBIH + FEIH) – CBFEIH. (2)For each forward path in a signal flow diagram there is an associated determinant represented by Δi(z). If a diagram has P = 3 forward paths (designated as paths P1(z), P2(z), and P3(z)), then there will be a Δ1(z), a Δ2(z), and a Δ3(z) determinant. Subscript variable i is merely the index identifying the individual forward paths and their associated determinants. Determinant Δi(z) is the determinant of the signal flow diagram that does not touch the ith forward path. To ascertain Δ1(z), for example, we delete the P1(z) forward path in a signal flow diagram (and any branches that touch the P1(z) forward path) and use the above Eq. (1) for whatever signal flow paths that remain. If no loops remain after deleting the P1(z) forward path, then Δ1(z) = 1.To recap, a signal flow diagram has a Δ(z) determinant, and each Pi(z) forward path has a gain as well as its own Δi(z)(z) determinant. All determinants are defined by Eq. (1) once a diagram's loops have been determined. With all this said, we can now (finally) define Mason's Rule.[edit] Notes^Mason, Samuel J. (July 1956). "Feedback Theory - Further Properties of Signal Flow Graphs".Proceedings of the IRE: 920--926.[edit] References▪Bolton, W. Newnes (1998). Control。
文献综述植被是生物地球化学循环如碳循环、氮循环、水循环等地表过程中的重要控制因子,通过植被遥感提供的植被宏观变化信息,可为地表系统过程模拟提供关键参数,所以对于植被的遥感研究极为重要。
在近年的遥感研究中,在利用多波段、多时相、高光谱的遥感数据来提高遥感对地物识别能力的同时,越来越多的学者将针对地物双向反射及它的孪生姊妹偏振反射的测量作为新型遥感手段来进行研究,努力使定性遥感走向定量遥感。
通过这些手段得到的信息在资源调查农作物估产、农林牧业发展、军事目标识别、地质勘探、找矿、土壤分析、环境监测、灾害估计、海洋开发利用、遥感数据订正等方面有着特殊意义(乔延利等,2001;杨之文,2004;张绪国等,2008;麻金继等,2009)。
20 世纪 70 年代以来,遥感对地和大气的观测主要采取垂直收集数据的方式,利用目标地物的辐射强度来推求目标的表面状态、温度、物质组成及其他一些物理化学特性,以获得地面的二维信息(宋开山等,2004)。
遥感解译的主要依据是根据不同的地物具有不同的吸收、反射和发射电磁波的能力来分辨地球表层的地物分布,并假定目标地物的反射光谱在2π空间内分布是一致的,即所谓的朗伯体(赵云升等,2000)。
但实践证明,这种假定引发的结论与实际相差较大,不尽合理。
另外,随着遥感应用的深入研究,传统的解译模式已经不能满足实际的需要,现实表明人们不仅需要地面目标的平面信息,如位置和大小,而且还需要了解更高层的信息,即目标的三维信息(赵云升等,2005)。
因此,在20世纪70年代末,美国Suit G.,Goel N. S., Strahler A. H.及中国的李小文等一小批学者首先开始了分布函数BRDF (Bidirectional Reflectance Distribution Function ,即双向反射分布函数)的研究(Li Xiaowen et al.,1985;Lucht W et al.,2000;Wang Jun-Fa et al.,2001)。
统计学术语中英文对照AbsolutedeviationAbsolute numberAbsoluteresidualsAcceleration array Acceleration in an arbitrary directionAcceleration normal 法向加速度Acceleration space dimension 加速度空间的维数 Acceleration tangential 切向加速度Acceleration vector 加速度向量Acceptable hypothesis 可接受假设Accumulation 累积Accuracy 准确度Actual frequency 实际频数Adaptive estimator 自适应估计量Addition 相加Addition theorem 加法定理Additivity 可加性Adjusted rate 调整率Adjusted value 校正值Admissible error 容许误差Aggregation 聚集性Alternative hypothesis 备择假设Among groups 组间Amounts 总量Analysis of correlation 相关分析Analysis of covariance 协方差分析Analysis of regression 回归分析Analysis of time series 时间序列分析Analysis of variance 方差分析Angular transformation 角转换ANOVA ( analysis of variance ) 方差分析ANOVA Models 方差分析模型Arcing 弧/ 弧旋Arcsine transformation 反正弦变换Area under the curve 曲线面积AREG 评估从一个时间点到下一个时间点回归相关时的误差ARIMA 季节和非季节性单变量模型的极大似然估计绝对离差 绝对数 绝对残差 加速度立体任意方向上的加速度Arithmetic grid paper 算术格纸Arithmetic mean 算术平均数Arrhenius relation 艾恩尼斯关系Assessing fit 拟合的评估Associative laws 结合律Asymmetric distribution 非对称分布Asymptotic bias 渐近偏倚Asymptotic efficiency 渐近效率Asymptotic variance 渐近方差Attributable risk 归因危险度Attribute data 属性资料Attribution 属性Autocorrelation 自相关Autocorrelation of residuals 残差的自相关Average 平均数Average confidence interval length 平均置信区间长度Average growth rate 平均增长率Bar chart 条形图Bar graph 条形图Base period 基期Bayes' theoremBell-shapedcurveBias 偏性 Binary logistic regression Bisquare 双平方Bivariate Correlate 二变量相关Bivariate normal distribution 双变量正态分布 Bivariate normal population 双变量正态总体Biweight interval 双权区间Biweight M-estimator 双权 M 估计量Block 区组/ 配伍组BMDP(Biomedical computer programs) BMDPBoxplots 箱线图 / 箱尾图Breakdown bound 崩溃界 / 崩溃点Canonical correlation 典型相关Caption 纵标目Case-control study 病例对照研究Categorical variable 分类变量Catenary 悬链线Cauchy distribution 柯西分布Cause-and-effect relationship 因果关系 Bernoulli distribution 伯努力分布 Best-trim estimator 最好切尾估计量Binomial distribution 二项分布 Bayes 定理 钟形曲线 二元逻辑斯蒂回归统计软件包Cell 单元Censoring 终检Center of symmetry 对称中心Centering and scaling 中心化和定标Central tendency 集中趋势Central value 中心值CHAID - χ 2 Automatic Interaction Detector卡方自动交互检测Chance 机遇Chance error 随机误差Chance variable 随机变量Characteristic equation 特征方程Characteristic root 特征根Characteristic vector 特征向量Chebshev criterion of fit 拟合的切比雪夫准则Chernoff faces 切尔诺夫脸谱图Chi-square test 卡方检验/ χ2检验Choleskey decomposition 乔洛斯基分解Circle chart 圆图Class interval 组距Class mid-value 组中值Class upper limit 组上限Classified variable 分类变量Cluster analysis 聚类分析Cluster sampling 整群抽样Code 代码Coded data 编码数据Coding 编码Coefficient of contingency 列联系数Coefficient of determination 决定系数Coefficient of multiple correlation 多重相关系数Coefficient of partial correlation 偏相关系数Coefficient of production-moment correlation 积差相关系数Coefficient of rank correlation 等级相关系数Coefficient of regression 回归系数Coefficient of skewness 偏度系数Coefficient of variation 变异系数Cohort study 队列研究Column 列Column effect 列效应Column factor 列因素Combination pool 合并Combinative table 组合表Common factor 共性因子Common regression coefficient 公共回归系数Common value 共同值Common variance 公共方差Common variation 公共变异Communality variance 共性方差Comparability 可比性Comparison of bathes 批比较Comparison value 比较值Compartment model 分部模型Compassion 伸缩Complement of an event 补事件Complete association 完全正相关Complete dissociation 完全不相关Complete statistics 完备统计量Completely randomized design 完全随机化设计Composite event 联合事件Composite events 复合事件Concavity 凹性Conditional expectation 条件期望Conditional likelihood 条件似然Conditional probability 条件概率Conditionally linear 依条件线性Confidence interval 置信区间Confidence limit 置信限Confidence lower limit 置信下限Confidence upper limit 置信上限Confirmatory Factor Analysis 验证性因子分析Confirmatory research 证实性实验研究Confounding factor 混杂因素Conjoint 联合分析Consistency 相合性Consistency check 一致性检验Consistent asymptotically normal estimate 相合渐近正态估计Consistent estimate 相合估计Constrained nonlinear regression 受约束非线性回归Constraint 约束Contaminated distribution 污染分布Contaminated Gausssian 污染高斯分布Contaminated normal distribution 污染正态分布Contamination 污染Contamination model 污染模型Contingency table 列联表Contour 边界线Contribution rate 贡献率Control 对照Controlled experiments 对照实验Conventional depth 常规深度Convolution 卷积Corrected factor 校正因子Corrected mean 校正均值Correction coefficient 校正系数Correctness 正确性Correlation coefficient 相关系数Correlation index 相关指数Correspondence 对应Counting 计数Counts 计数/ 频数Covariance 协方差Covariant 共变Cox Regression Cox 回归Criteria for fitting 拟合准则Criteria of least squares 最小二乘准则Critical ratio 临界比Critical region 拒绝域Critical value 临界值Cross-over design 交叉设计Cross-section analysis 横断面分析Cross-section survey 横断面调查Crosstabs 交叉表Cross-tabulation table 复合表Cube root 立方根Cumulative distribution function 分布函数Cumulative probability 累计概率Curvature 曲率/ 弯曲Curvature 曲率Curve fit 曲线拟和Curve fitting 曲线拟合Curvilinear regressio曲线回归Curvilinear relation 曲线关系Cut-and-try method 尝试法Cycle 周期Cyclist 周期性D test D 检验Data acquisition 资料收集Data bank 数据库Data capacity 数据容量Data deficiencies 数据缺乏Data handling 数据处理Data manipulation 数据处理Data processing 数据处理Data reduction 数据缩减Double blind trial 双盲试验Data set 数据集Data sources 数据来源Data transformation 数据变换Data validity 数据有效性Data-in 数据输入Data-out 数据输出Dead time 停滞期Degree of freedom Degree ofprecision Degreeof reliabilityDegression 递减 Density functionDensity of datapoints DependentvariableDependent 深自由度精密度 可靠性程度 密度函数数据点的密度 应变量 /依变量 /因变量 导数矩阵Derivative-freemethods Design 设计 DeterminacyDeterminantDeterminant 无导数方法 确定性 行列式 决定因素 Deviation 离差 Deviation from average Diagnostic plot 诊断图 Dichotomous variableDifferential equation Direct standardization离均差二分变量微分方程直接标准化法 离散型变量 Discriminantanalysis Discriminant判别分析 判别系数判别值 Dispersion 散布 / 分散度Disproportional 不成比例的Disproportionate sub-class numbers 不成比例次级组含量Distribution free 分布无关性 / 免分布Distribution shape 分布形状Distribution-free method 任意分布法Distributive laws 分配律Disturbance 随机扰动项 Dose response curve 剂量反应曲线Double exponential distribution 双指数分布Double logarithmic 双对数Downward rank 降秩Dual-space plot 对偶空间图DUD 无导数方法Duncan's new multiple range method 新复极差法/DuncanEffect 实验效应Eigenvalue 特征值Eigenvector 特征向量Ellipse 椭圆Empirical distribution 经验分布Empirical probability 经验概率单位Enumeration data 计数资料Equal sun-class number 相等次级组含量Equally likely 等可能Equivariance 同变性Error 误差/ 错误Error of estimate 估计误差Error type I 第一类错误Error type II 第二类错误Estimand 被估量Estimated error mean squares 估计误差均方Estimated error sum of squares 估计误差平方和Euclidean distance 欧式距离Event 事件Event 事件Exceptional data point 异常数据点Expectation plane 期望平面Expectation surface 期望曲面Expected values 期望值Experiment 实验Experimental sampling 试验抽样Experimental unit 试验单位Explanatory variable 说明变量Exploratory data analysis 探索性数据分析Explore Summarize 探索- 摘要Exponential curve 指数曲线Exponential growth 指数式增长EXSMOOTH 指数平滑方法Extended fit 扩充拟合Extra parameter 附加参数Extrapolation 外推法Extreme observation 末端观测值新法Extremes 极端值/ 极值F distribution F 分布F test F 检验Factor 因素/ 因子Factor analysis 因子分析Factor Analysis 因子分析Factor score 因子得分Factorial 阶乘Factorial design 析因试验设计False negative 假阴性False negative error 假阴性错误Family of distributions 分布族Family of estimators 估计量族Fanning 扇面Fatality rate 病死率Field investigation 现场调查Field survey 现场调查Finite population 有限总体Finite-sample 有限样本First derivative 一阶导数First principal component 第一主成分First quartile 第一四分位数Fisher information 费雪信息量Fitted value 拟合值Fitting a curve 曲线拟合Fixed base 定基Fluctuation 随机起伏Forecast 预测Four fold table 四格表Fourth 四分点Fraction blow 左侧比率Fractional error 相对误差Frequency 频率Frequency polygon 频数多边图Frontier point 界限点Function relationship 泛函关系Gamma distribution 伽玛分布Gauss increment 高斯增量Gaussian distribution 高斯分布/ 正态分布Gauss-Newton increment 高斯- 牛顿增量General census 全面普查GENLOG (Generalized liner models)广义线性模型Geometric mean 几何平均数Gini's mean difference 基尼均差GLM (General liner models) 通用线性模型Goodness of fit 拟和优度/ 配合度Gradient of determinant 行列式的梯度Graeco-Latin square 希腊拉丁方Grand mean 总均值Gross errors 重大错误Gross-error sensitivity 大错敏感度Group averages 分组平均Grouped data 分组资料Guessed mean 假定平均数Half-life 半衰期Hampel M-estimators 汉佩尔M 估计量Happenstance 偶然事件Harmonic mean 调和均数Hazard function 风险均数Hazard rate 风险率Heading 标目Heavy-tailed distribution 重尾分布Hessian array 海森立体阵Heterogeneity 不同质Heterogeneity of variance方差不齐Hierarchical classification 组内分组Hierarchical clustering method 系统聚类法High-leverage point高杠杆率点HILOGLINEAR 多维列联表的层次对数线性模型Hinge 折叶点Histogram 直方图Historical cohort study 历史性队列研究Holes 空洞HOMALS 多重响应分析Homogeneity of variance 方差齐性Homogeneity test 齐性检验Huber M-estimators 休伯M 估计量Hyperbola 双曲线Hypothesis testing 假设检验Hypothetical universe 假设总体Impossible event 不可能事件Independence 独立性Independent variable 自变量Index 指标/ 指数Individual 个体Inference band 推断带Indirect standardization 间接标准Infinite population 无限总体化法Infinitely great 无穷大Infinitely small 无穷小Influence curve 影响曲线Information capacity 信息容量Initial condition 初始条件Initial estimate 初始估计值Initial level 最初水平Interaction 交互作用Interaction terms 交互作用项Intercept 截距Interpolation 内插法Interquartile range 四分位距Interval estimation 区间估计Intervals of equal probability 等概率区间Intrinsic curvature 固有曲率Invariance 不变性Inverse matrix 逆矩阵Inverse probability 逆概率Inverse sine transformation 反正弦变换Iteration 迭代Jacobian determinant 雅可比行列式Joint distribution function 分布函数Joint probability 联合概率Joint probability distribution 联合概率分布K means method 逐步聚类法Kaplan-Meier 评估事件的时间长度Kaplan-Merier chart Kaplan-Merier 图Kendall's rank correlation Kendall 等级相关Kinetic 动力学Kolmogorov-Smirnove test 柯尔莫哥洛夫- 斯米尔诺夫检验Kruskal and Wallis test Kruskal 及Wallis 检验/ 多样本的秩和检验/H 检验Kurtosis 峰度Lack of fit 失拟Ladder of powers 幂阶梯Lag 滞后Large sample 大样本Large sample test 大样本检验L-estimator of scale 尺度 L 估计量Level 水平Life expectance 预期期望寿命Life table 寿命表Life table method 生命表法Light-tailed distribution 轻尾分布 Likelihood function 似然函数Likelihood ratio 似然比 line graph 线图Linear correlation 直线相关Linear equation 线性方程Linear programming 线性规划Linear regression 直线回归Linear Regression 线性回归Linear trend 线性趋势Loading 载荷Location and scale equivariance 位置尺度同变性 Location equivariance 位置同变性Location invariance 位置不变性Location scale family 位置尺度族Log rank test 时序检验Logarithmic curve 对数曲线Logarithmic normal distribution 对数正态分布Logarithmic scale 对数尺度Logarithmic transformation 对数变换 Logic check 逻辑检查 Logistic distribution 逻辑斯特分布Logit transformation Logit 转换LOGLINEAR 多维列联表通用模型 Lognormal distribution 对数正态分布Lost function 损失函数Latin square 拉丁方 Latin square design Leakage 泄漏 拉丁方设计 Least favorable configuration Least favorable distribution 最不利构形 最不利分布 Least significant difference 最小显著差法 Least square method 最小二乘法 Least-absolute-residuals estimates 最小绝对残差估计 Least-absolute-residuals fit 最小绝对残差拟合 Least-absolute-residuals line 最小绝对残差线 Legend 图例L-estimator L 估计量 L-estimator of location 位置 L 估计量关 Lower limit 下限Lowest-attained variance 最小可达方差 LSD 最小显著差法的简称Lurking variable 潜在变量Main effect 主效应Major heading 主辞标目Marginal density function 边缘密度函数Marginal probability 边缘概率Marginal probability distribution 边缘概率分布 Matched data 配对资料Minimum variance estimator 最小方差估计量 MINITAB 统计软件包Minor heading 宾词标目Missing data 缺失值Model specification 模型的确定Modeling Statistics 模型统计Models for outliers 离群值模型Modifying the model 模型的修正Modulus of continuity 连续性模Morbidity 发病率Most favorable configuration 最有利构形Multidimensional Scaling (ASCAL) 多维尺度 / 多维Matched distribution Matching of distributionMatching oftransformationMathematical Maximum L-estimatorMaximum likelihoodmethod Mean 均数 Meansquares between groups Mean squares withingroup Means (Comparemeans) Median 中位数Median effective dose匹配过分布 分布的匹配 变换的匹配数学期望 数学模型 极大极小 L 估计量 最大似然法 组间均方 组内均方 均值 -均值比较 半数效量 Median lethal dose 半数致死量 Median polish 中位数平滑 Median test 中位数检验Minimal sufficient statistic Minimum distance estimation Minimum effective dose Minimum lethal dose 最小充分统计量 最小距离估计 最小有效量 最小致死量标度关Multinomial Logistic多项逻辑斯蒂回归RegressionMultiple comparison 多重比较Multiple correlation 复相关Multiple covariance 多元协方差 Multiple linear regression 多元线性回归 Multiple response 多重选项 Multiple solutions 多解Multiplication theorem 乘法定理 Multiresponse 多元响应Multi-stage sampling 多阶段抽样 Multivariate T distribution 多元 T 分布 Mutual exclusive 互不相容 Mutual independence 互相独立Natural boundary 自然边界Natural dead 自然死亡Natural zero 自然零Negative correlation 负相关Negative linear correlation 负线性相关Negatively skewed 负偏 Newman-Keuls method q 检验NK method q 检验No statistical significance 无统计意义Nominal variable 名义变量Nonconstancy of variability 变异的非定常性Nonlinear regression 非线性相关 Nonparametric statistics 非参数统计 Nonparametric test 非参数检验 Nonparametric tests 非参数检验 Normal deviate 正态离差Normal distribution 正态分布Normal equation正规方程组Normal ranges 正常范围Normal value 正常值 Nuisance parameter 多余参数/ 讨厌参数 Null hypothesis 无效假设Numerical variable 数值变量Objective function 目标函数 Observation unit 观察单位 Observed value 观察值One sided test 单侧检验 One-way analysis of variance 单因素方差分析Oneway ANOVA 单因素方差分析Open sequential trial 开放型序贯设计Optrim 优切尾Optrim efficiency 优切尾效率Order statistics 顺序统计量Ordered categories 有序分类Ordinal logistic regression 序数逻辑斯蒂回归Ordinal variable 有序变量Orthogonal basis 正交基Orthogonal design 正交试验设计Orthogonality conditions 正交条件ORTHOPLAN 正交设计Outlier cutoffs 离群值截断点Outliers 极端值OVERALS 多组变量的非线性正规相关Overshoot 迭代过度Paired design 配对设计Paired sample 配对样本Pairwise slopes 成对斜率Parabola 抛物线Parallel tests 平行试验Parameter 参数Parametric statistics 参数统计Parametric test 参数检验Partial correlation 偏相关Partial regression 偏回归Partial sorting 偏排序Partials residuals 偏残差Pattern 模式Pearson curves 皮尔逊曲线Peeling 退层Percent bar graph 百分条形图Percentage 百分比Percentile 百分位数Percentile curves 百分位曲线Periodicity 周期性Permutation 排列P-estimator P 估计量Pie graph 饼图Pitman estimator 皮特曼估计量Pivot 枢轴量Planar 平坦Planar assumption 平面的假设PLANCARDS 生成试验的计划卡Point estimation 点估计Poisson distribution 泊松分布Polishing 平滑Polled standard deviation 合并标准差Polled variance 合并方差Polygon 多边图Polynomial 多项式Polynomial curve 多项式曲线Population 总体Population attributable risk 人群归因危险度 Positive correlation 正相关Positively skewed 正偏 Posterior distribution 后验分布Power of a test 检验效能Precision 精密度 Predicted value 预测值 Preliminary analysis 预备性分析Principal component analysis 主成分分析 Prior probability Probabilisticmodel probability 概率 Probability density Product momentProfile trace 截面迹图Proportion 比/ 构成比Proportion allocation in stratified random samplingProportionate 成比例Proportionate sub-class numbers 成比例次级组含量Prospective study 前瞻性调查Proximities 亲近性Pseudo F test 近似 F 检验Pseudo model 近似模型Pseudosigma 伪标准差Purposive sampling 有目的抽样QR decomposition QR 分解Quadratic approximation 二次近似Qualitative classification 属性分类Qualitative method 定性方法Quantile-quantile plot 分位数 - 分位数图 /Q-Q Prior distribution 先验分布先验概率概率模型概率密度乘积矩 / 协方差按比例分层随机抽样图Quantitative analysis 定量分析Quartile 四分位数Quick Cluster 快速聚类Radix sort 基数排序Random allocation 随机化分组Random blocks design 随机区组设计Random event 随机事件 Randomization 随机化Range 极差 / 全距Rank correlation 等级相关Rank sum test 秩和检验Rank test 秩检验Ranked data 等级资料Rate 比率Ratio 比例Raw data 原始资料原始残差 雷氏检验雷氏 Z 值Rounding 舍入 Row 行 Roweffects 行效应 Row factor行因素 RXC table RXC 表Raw residualRayleigh's test Rayleigh's Z Reciprocal 倒数 Reciprocal transformationRecording 记录Redescendingestimators Reducing 倒数变换回降估计量 降维 Re-expression 重新表达 Reference set 标准组Region of acceptance RegressioncoefficientRegression sum of square Rejectionpoint Relativedispersion Relativenumber Reliability 可靠性ReparametrizationReplication 重复接受域 回归系数回归平方拒绝点 相对离散度相对数 重新设置参数 报告摘要 剩余平方Resistant line 耐抗线 Resistant technique R-R-estimator of scaleRetrospectivestudy Ridgetrace 岭迹 Ridit analysis耐抗技术 位置 R 估计量 尺度 R 估计量 回顾性调查 分析Sample 样本 Sample regression coefficient 样本回归系数 Sample size 样本量Sample standard deviation 样本标准差 Sampling error 抽样误差SAS(Statistical analysis system ) SAS 统计软件包Scale 尺度/ 量表Scatter diagram 散点图 Schematic plot 示意图 / 简图Score test 计分检验 Screening 筛检 SEASON 季节分析 Second derivative 二阶导数 Second principal component 第二主成分SEM (Structural equation modeling) 结构化方程模型 Semi-logarithmic graph 半对数图Semi-logarithmic paper 半对数格纸Sensitivity curve 敏感度曲线 Sequential analysis 贯序分析Sequential data set 顺序数据集Sequential design 贯序设计Sequential method 贯序法 Sequential test 贯序检验法 Serial tests 系列试验Short-cut method 简捷法 Sigmoid curve S 形曲线Sign function 正负号函数 Sign test 符号检验Signed rank 符号秩 Significance test 显著性检验Significant figure 有效数字Simple cluster sampling 简单整群抽样Simple correlation 简单相关 Simple random sampling 简单随机抽样 Simple regression 简单回归 simple table 简单表Sine estimator 正弦估计量 Single-valued estimate 单值估计Singular matrix 奇异矩阵Skewed distribution 偏斜分布Skewness 偏度Slash distribution 斜线分布Slope 斜率Smirnov test 斯米尔诺夫检验Source of variation 变异来源Spearman rank correlation 斯皮尔曼等级相关Specific factor 特殊因子Specific factor variance 特殊因子方差Spectra 频谱Spherical distribution 球型正态分布Spread 展布SPSS(Statistical package for the social science) SPSS Spurious correlation 假性相关Square root transformation 平方根变换Stabilizing variance 稳定方差Standard deviation 标准差Standard error 标准误Standard error ofdifferenceStandard error of estimate 标准估计误差Standard error of rate 率的标准误Standard normal distribution 标准正态分布Standardization 标准化 Starting value 起始值Statistic 统计量Statistical control 统计控制Statistical graph 统计图Statistical inference 统计推断Statistical table 统计表Steepest descent 最速下降法Stem and leaf display 茎叶图统计软件包差别的标准误Step factor 步长因子 Stepwise regression Storage 存 Strata 层(复数) Stratified samplingStratified sampling Strength 强度 Stringency 严密性 Structural relationship Studentized residual Sub-class numbers Subdividing 分割逐步回归分层抽样分层抽样结构关系学生化残差 /t 化残差次级组含量Sufficient statistic 充分统计量Sum of products 积和Sum of squares 离差平方和Sum of squares about regression Sum of squares between groups Sum of squares of partial regressionSure event 必然事件Survey 调查Survival 生存分析Survival rate 生存率Suspended root gram 悬吊根图Symmetry 对称Systematic error 系统误差Systematic sampling 系统抽样Tags 标签Tail area 尾部面积Tail length 尾长Tail weight 尾重Tangent line 切线Target distribution 目标分布Taylor series 泰勒级数Tendency of dispersion 离散趋势Testing of hypotheses 假设检验Theoretical frequency 理论频数Time series 时间序列Tolerance interval 容忍区间Tolerance lower limit 容忍下限Tolerance upper limit 容忍上限Torsion 扰率Total sum of square 总平方和Total variation 总变异Transformation 转换Treatment 处理Trend 趋势Trend of percentage 百分比趋势Trial 试验Trial and error method 试错法Tuning constant 细调常数Two sided test 双向检验Two-stage least squares 二阶最小平方Two-stage sampling 二阶段抽样Two-tailed test 双侧检验回归平方和组间平方和偏回归平方Two-way analysis of variance 双因素方差分析Two-way table 双向表Type I error 一类错误 / α错误Type II error 二类错误 / β错误UMVU 方差一致最小无偏估计简称Unbiased estimate 无偏估计Unconstrained nonlinear regression 无约束非线性回归Unequal subclass number 不等次级组含量Ungrouped data 不分组资料Uniform coordinate 均匀坐标Uniform distribution 均匀分布Uniformly minimum variance unbiased estimate 方差一致最小无偏估计Unit 单元Unordered categories 无序分类Upper limit 上限Upward rank 升秩Vague concept 模糊概念Validity 有效性VARCOMP (Variance component estimation) 方差元素估计Variability 变异性Variable 变量Variance 方差Variation 变异Varimax orthogonal rotation 方差最大正交旋转Volume of distribution 容积W test W 检验Weibull distribution 威布尔分布Weight 权数Weighted Chi-square test 加权卡方检验 /Cochran 检验Weighted linear regression method 加权直线回归Weighted mean 加权平均数Weighted mean square 加权平均方差Weighted sum of square 加权平方和Weighting coefficient 权重系数Weighting method 加权法W-estimation W 估计量W-estimation of location 位置 W 估计量Width 宽度Wilcoxon paired test 威斯康星配对法 / 配对符号秩和检验Wild point 野点 / 狂点Wild value 野值 / 狂值Winsorized mean 缩尾均值Withdraw 失访Youden's index 尤登指数Z test Z 检验Zero correlation 零相关Z-变换。
a rXiv:mat h-ph/99111v28Ma y2CONNES’TRACE FORMULA AND DIRAC REALIZATION OFMAXWELL AND YANG-MILLS ACTION PETER M.ALBERTI AND RAINER MATTHES Abstract.The paper covers known facts about the Dixmier trace (with some generalities about traces),the Wodzicki residue,and Connes’trace theorem,including two variants of proof of the latter.Action formulas are treated very sketchy,because they were considered in other lectures of the workshop.Contents 1.The Dixmier-Traces 21.1.Generalities on traces on C ∗-and W ∗-algebras 21.1.1.Basic topological notions,notations 21.1.2.Traces on C ∗-and W ∗-algebras 31.2.Examples of traces 41.2.1.Traces on compact linear operators 41.2.2.Traces on B (H )81.3.Examples of singular traces on B (H )91.3.1.Step one:Some ideal of compact operators 91.3.2.Step two:Scaling invariant states 121.3.3.Constructing the Dixmier-traces 131.3.4.The Dixmier-trace as a singular trace 141.4.Calculating the Dixmier-trace 151.4.1.Simple criteria of measurability 151.4.2.A residue-formula for the Dixmier-trace 172.The Connes’trace theorem and its application 182.1.Preliminaries182.1.1.Basic facts about pseudodifferential operators182.1.2.Definition of the Wodzicki residue202.2.Connes’trace theorem212.2.1.Formulation of Connes’trace theorem212.2.2.On the proof of Connes’trace theorem222.2.3.An alternative proof of the Connes’trace formula252.3.Classical Yang-Mills actions282.3.1.The classical Dirac operator and integration on manifolds282.3.2.Classical gauge field actions in terms of Dixmier-trace29References302P.M.ALBERTI,R.MATTHES1.The Dixmier-TracesThe essential ingredients of the famous trace formula[3,4]of A.Connes are operator algebraic constructs over the W∗-algebra B(H)of all bounded linear oper-ators over some infinite dimensional separable Hilbert space H which are known asDixmier-traces.The constructions will be explained in this section.For a general operator-algebraic background the reader is referred e.g.to[9,31,36,22,23].1.1.Generalities on traces on C∗-and W∗-algebras.1.1.1.Basic topological notions,notations.A C∗-algebra M is a Banach∗-algebra,with∗-operation x−→x∗and norm · obeying x∗x = x 2,for each x∈M (∗-quadratic property).Let M+={x∗x:x∈M}be the cone of positive elementsof M.For x∈M let x≥0be synonymous with x∈M+.The Banach spaceof all continuous linear forms on M(dual)will be denoted by M∗,the dual norm (functional norm)be · 1.As usual,a linear form f over M is termed positive,f≥0,if f(x∗x)≥0,for each x∈M.Remind that positive linear forms areautomatically continuous and are generating for M∗.Thus M∗+={f∈M∗:f≥0} is the set of all these forms.There is a fundamental result of operator theorysaying that if M possesses a unit1(unital C∗-algebra),then f≥0if,and only if,f(1)= f 1.It is common use to refer to positive linear forms of norm one asstates.Thus,in a unital C∗-algebra the set of all states on M,S(M),is easily seento be a convex set which according to the Alaoglu-Bourbaki theorem isσ(M∗,M)-compact.Here,theσ(M∗,M)-topology(also w∗-topology in the special contextat hand)is the weakest locally convex topology generated by the seminormsρx,x∈M,withρx(f)=|f(x)|,for each f∈M∗.The generalization of the notion of positive linear form on M(which refers to positive linear maps into the specialC∗-algebra of complex numbers C)is the notion of the positive linear map.Say that a linear mapping T:M−→N which acts from one C∗-algebra M into anotherone N is positive if T(x∗x)≥0within N for each x∈M.In the unital case(forM)one then knows that T(1) = T holds( T refers to the operator norm of T as a linear operator acting from the one Banach space M into the other N).Onthe other hand,each linear map T:M−→N which obeys this relation is knownto be positive.If both M and N have a unit,a linear map T:M−→N is said to be unital if T(1)=1is fulfilled(the units being the respective units).Thus,and in particular,each unital linear map T:M−→N of norm one beween unital C∗-algebras has to be a positive map.Remind that a C∗-algebra M is a W∗-algebra,that is,is∗-isomorphic to somevN-algebra on some Hilbert space H,if and only if,there exists a(unique)Banach subspace M∗(the predual space)of M∗such that M is the(continuous)dual ofM∗,M=(M∗)∗.Note that a non-zero W∗-algebra is always unital.Suppose nowthat M is a W∗-algebra.The forms of M∗will be referred to as normal linear forms.One then knows that the normal positive linear forms M∗+=M∗∩M∗+ (resp.the normal states S0(M)=M∗∩S(M))are generating for M∗in the sense that each normal linear form may be represented as a complex linear combinationof at most four normal states.As a consequence of this,for each ascendinglydirected(in the sense of≤)bounded net{xα}⊂M+there exists a lowest upper bound l.u.b.xαwithin M+.On the other hand,a positive linear formω∈M∗+is normal if,and only if,for each ascendingly directed bounded net{xα}⊂M+the relationω(l.u.b.xα)=l.u.b.ω(xα)=limαω(xα)is valid.Note that in the latterCONNES’TRACE FORMULA3 characterization it suffices if the mentioned continuity be fulfilled for ascendingly directed nets of orthoprojections of M.In contrast to the previous,ν∈M∗+is called singular if to each orthoprojection p∈M withν(p)>0there is another orthoprojection q∈M with0<q<p and ν(q)=0.According to[35]eachω∈M∗+\M+∗in a unique way can be decomposed asω=ω1+ω2,with normalω1∈M∗+and singularω2∈M∗+.The simplest example of a W∗-algebra where singular positive linear forms can exist is the commutative W∗-algebraℓ∞=ℓ∞(N)of all bounded sequences x= (x n)=(x1,x2,...)of complex numbers,with norm x ∞=sup n∈N|x n|,and algebra multiplication x·y=(x n y n)and∗-operation x∗=(¯x n)defined com-ponentwise.Recall that in this case the predual spaceℓ∞∗is the Banach space of all absolutely summable sequencesℓ1(N),with norm ω 1= n∈N|ωn|for ω=(ωn)∈ℓ1(N)(=ℓ1).Thereby,each suchωcan be identified with an element in the dual Banach space(ℓ∞)∗via the identification with the linear functionalω(·) given asω(x)= n∈Nωn x n,for each x∈ℓ∞.For simplicity,also this functional ω(·)will be referred to asω,ω=ω(·).In generalizing from the setting of a normal positive linear form,call a positive linear map T:M−→N from one W∗-algebra M into another W∗-algebra N normal if T(l.u.b.xα)=l.u.b.T(xα)holds for each ascendingly directed bounded net{xα}⊂M+.Note that in a W∗-algebra the Alaoglu-Bourbaki theorem may be applied on M,and then yields that the(closed)unit ball M1of M isσ(M,M∗)-compact.From this it follows that the unit ball within the bounded linear operators which map the W∗-algebra M into itself is compact with respect to the topology determined by the system of seminormsρx,f,labelled by x∈M and f∈M∗, and which are defined at T byρx,f(T)=|f◦T(x)|.Refer to this topology as theσ(M,M∗)-weak operator topology on the Banach algebra of bounded linear operators B(M)over the Banach space M.Thereby,by convention for T,S∈B(M) let the product T S∈B(M)be defined through successive application of maps to the elements of M in accordance with the rule‘apply right factorfirst’,that is T S(x)=(T◦S)(x)=T(S(x)).1.1.2.Traces on C∗-and W∗-algebras.We recall the very basic facts on traces as found e.g.in[9,6.1.].A functionτ:M+−→4P.M.ALBERTI,R.MATTHES(which according to the previous is Mτ+)onto[Mτ+]is unique,by tacit under-standing the notationτ(x)will be also used at non-positive x of the defining ideal ofτif the evaluation˜τ(x)of the linear functional˜τat x is meant.The traceτis termedfinite trace if Mτ+=M+,and semifinite trace ifτ(x)= sup{τ(y):y≤x,y∈Mτ+},for each x∈M+.If M is a W∗-algebra,with group of unitary elements U(M),the above condition on invariance usually is replaced with a seemingly weaker requirement upon unitary invariance,that isτ(u∗xu)=τ(x)be fulfilled,for each x∈M+and u∈U(M).However,both conditions are equivalent there(and are so even on unital C∗-algebras).Also,in the W∗-case the traceτis said to be normal provided for each ascendingly directed bounded net{xα}⊂M+ the relationτ(l.u.b.xα)=l.u.b.τ(xα)=limατ(xα)is fulfilled.Now,suppose I⊂M is a proper two-sided ideal of the W∗-algebra M.Then,I is also a∗-subalgebra of M,with generating positive cone I+=I∩M+,that is,I= [I+]is fulfilled(these facts are consequences of the polar decomposition theorem, essentially).Under these premises we have the following extension principle: Lemma1.1.Suppose I+is a hereditary subcone of M+.Then,each additive, positive homogeneous and invariant mapτ0:I+−→CONNES’TRACE FORMULA5 And secondly,each non-zero eigenvalue of x has onlyfinite multiplicity,that is, m(µ)=#{k:µk(x)=µ}obeys m(µ)<∞,for eachµ∈R+\{0}.Recall that C B(H)is also a closed∗-ideal of B(H).Hence,according to polar√decomposition,x∈B(H)is compact if,and only if,the module|x|=√xϕn,6P.M.ALBERTI,R.MATTHES¿From(1.1b)–(1.1d)one now concludes some useful relations and estimates.The first is a rather trivial consequence of the definition ofσk(x)and says that∀x∈C B(H),λ∈C,k∈N:σk(λx)=|λ|σk(x).(1.2a) It is stated here only for completeness.In the special case of positive compact operators from(1.1c)we get the following often used estimates:∀x,y∈C B(H)+,k∈N:y≤x=⇒σk(y)≤σk(x).(1.2b) The next estimate is due to[25]and at once gets obvious from(1.1b),and tells us that the following holds:∀x,y∈C B(H),k∈N:σk(x+y)≤σk(x)+σk(y).(1.2c) The third estimate deals with an upper bound ofσk(x)+σk(y)in case of posi-tive operators x,y∈C B(H)+and arises from(1.1d).In line with the latter,let orthoprojections p,q of rank k be given such thatσk(x)= ∞n=1 xpϕn,ϕn and σk(y)= ∞n=1 yqϕn,ϕn are fulfilled.Then,the least orthoprojection p∨q ma-jorizing both p and q has rank2k at most.Thus there is an orthoprojection Q of rank2k and obeying p∨q≤Q.Hence,in view of the choice of p,q and with the help of(⋆⋆)one infers that ∞n=1 xQϕn,ϕn =σk(x)+ ∞n=1 x(Q−p)ϕn,ϕn ≥σk(x) and ∞n=1 yQϕn,ϕn =σk(y)+ ∞n=1 x(Q−q)ϕn,ϕn ≥σk(y).In view of(1.1d) from this thenσk(x)+σk(y)≤σ2k(x+y)follows.For positive compact operators the previous together with(1.2c)may be summarized into the following one:∀x,y∈C B(H)+,k∈N:σk(x+y)≤σk(x)+σk(y)≤σ2k(x+y).(1.2d) Note that,since C B(H)is a two-sided ideal,from(1.1a)for each y∈C B(H)and a,b∈B(H)the estimate∀k∈N:µk(ayb)≤ a b µk(y)(1.2e) can be obtained.Thus,under these conditions one has∀a,b∈B(H),y∈C B(H),k∈N:σk(ayb)≤ a b σk(y).(1.2f) Especially,if x=u|x|is the polar decomposition of x∈C B(H)within B(H),then with the partial isometry u∈B(H)one has both,xx∗=ux∗xu∗and x∗x=u∗xx∗u. In the special cases of(1.2f)with y=xx∗,a=u∗,b=u and y=x∗x,a=u,b= u∗we arrive at estimates whichfit together into the following assertion:∀x∈C B(H),k∈N:σk(x∗x)=σk(xx∗).(1.2g) In the following,a traceτis said to be non-trivial if there is at least one x≥0with 0<τ(x)<∞.The relations given in eqs.(1.2)are the key facts that the theory of traces on both algebras C B(H)and B(H)can be based on.Lemma1.2.Let tr:C B(H)+−→CONNES’TRACE FORMULA7 is infinite dimensional,tr x=∞will occur for some positive compact operators. To see that tr is semifinite requires to prove that for x∈C B(H)+with tr x=∞there existed a sequence{x n}⊂C B(H)+with x n≤x and tr x n<∞such thatlim n→∞tr x n=∞.Note that by definition of tr,tr x=∞implies that x cannot be offinite rank.Hence,x can be written as x= ∞k=1µk(x)p k,with infinitely many mutually orthogonal one-dimensional orthoprojections p k and allµk(x)=0. Clearly,for each n∈N the operators x n= n k=1µk(x)p k are offinite rank and obey0≤x1≤x2≤x3≤...≤x.Also,owing toσk(x n)=σn(x)for k≥n,one has tr x n=σn(x),and therefore lim n→∞tr x n=∞follows.Thus tr is semifinite. Supposeτis a non-trivial trace.Thus0<τ(y)<∞,for some positive compact y.Supposeτ(x)>0for some x≥0offinite rank.According to additivity and homogeneity ofτthere has to exist a one-dimensional subprojection p of a spectral orthoprojection of x withτ(p)>0.The same arguments for y ensure that τ(q)<∞,for some one-dimensional subprojection q of some spectral projection of y.But since q=vv∗and p=v∗v,with v∈C B(H),by invariance ofτone hasτ(q)=τ(p).Hence∞>τ(p)>0,andτ(q)=τ(p)for each one-dimensional orthoprojection q.Putλ=τ(p)−1.Thenλ·τ(q)=tr q,and thusλ·τ(x)=tr x for each positive operator x offinite rank.Finally,if x∈C B(H)+is not offinite rank,let0≤x1≤x2≤x3≤...≤x be the above approximating sequence of x by finite rank operators x n.Also in such case lim n→∞tr x n=lim n→∞σn(x)=tr x follows.Hence,in view of the above relation over the operators offinite rank,and sinceτ(x n)≤τ(x)holds,tr x=lim n→∞tr x n=λlim n→∞τ(x n)≤λ·τ(x).For completeness,we give yet the most famous formula relating tr and which makes that this trace is so extremely useful.Corollary1.1.For each maximal orthonormal system{ψn}⊂H and x∈C B(H)+ one has tr x= ∞n=1 xψn,ψn .Proof.Let{ϕj}be an o.n.s.with xϕk=µk(x)ϕk,for all k∈N,and be p n the orthoprojection with p n H=[ϕ1,...,ϕn].Then,by positivity of x one has xψn,ψn = √xψn ≥ p k√xψn ,and therefore and in view of(⋆⋆) one gets ∞n=1 xψn,ψn ≥ ∞n=1 p k√xψn = k j=1 xϕj,ϕj =σk(x).Ac-cording to Lemma1.2then ∞n=1 xψn,ψn ≥tr x follows.On the other hand,if q k is the orthoprojection onto[ψ1,...,ψk],according to(1.1d)for each k∈N cer-tainly k n=1 xψn,ψn = ∞n=1 xq kψn,ψn ≤σk(x).From this in view of Lemma 1.2once more again ∞n=1 xψn,ψn ≤tr x is seen.Taking together this with the above estimate provides that equality has to occur.A non-zero traceτon C B(H)will be said to be singular ifτ(x)=0for each x≥0 offinite rank.Relating this and non-trivial traces there is the following result. Corollary1.2.Letτbe a non-trivial trace on C B(H).Then,eitherτ=λ·tr holds,for a uniqueλ∈R+,or there exist a singular traceτs and a uniqueα∈R+ such thatτ=τs+α·tr.Proof.Ifτ=λ·tr is fulfilled,thenτ(p)=λtr p,for each one-dimensional ortho-projection p.Owing to tr p=1(see Corollary1.1)thenλ=τ(p)follows.Supposeτ∈R+tr.Then,τ=0,and if a decompositionτ=τs+α·tr with singularτs exists,thenτ(p)=α,for some(and thus any)one-dimensional orthoprojection p,and the following two alternatives have to be dealt with:firstly, ifτis vanishing on all positive operators offinite rank,τis singular,andτ=τs8P.M.ALBERTI,R.MATTHESandα=0have to be chosen(see above).Secondly,ifτdoes not vanish on all positive operators offinite rank,according to Lemma1.2there exists uniqueλ>0 withλ·τ(x)≥tr x,for each x∈C B(H)+,with equality occuring on any operator offinite rank.Hence,in definingτs(x)=τ(x)−λ−1tr x,for each x with tr x<∞, andτs(x)=∞else,we get a positive mapτs which does not vanish identically on the positive compact operators,but which is vanishing on all positive operators of finite rank.From the previous and since bothτand tr are traces,also additivity, positive homogeneity and invariance ofτs at once follow.Hence,τs is a singular trace,which is easily seen to obeyτ=τs+α·tr,withα=λ−1.1.2.2.Traces on B(H).Remind in short the theory of traces on M=B(H),with separable infinite dimensional Hilbert space H.Let F B(H)be the two-sided ideal of all operators offinit rank in B(H).In the following an ideal I will be termed non-trivial if I={0}and I=B(H).Both F B(H)and C B(H)are non-trivial two-sided ideals.Thereby,the compact operators form a closed ideal,with F B(H) being dense within C B(H).Start with a useful criterion on non-compactness for a positive operator.Lemma1.3.A positive operator x≥0is non-compact if,and only if,there exist realλ>0and infinite dimensional orthoprojection p obeyingλp≤x.Proof.Note that,in contrast to the spectral characterization of positive compact operators,the spectral theorem in case of a non-compact x≥0with#spec(x)<∞provides thatλp≤x has to be fulfilled,for some non-zeroλand orthopro-jection p with dim p H=∞(for oneλ∈spec(x)\{0}at least the correspond-ing spectral eigenprojection p has to meet the requirement).But then,due to normclosedness of the compact operators,and since for each positive x one has x∈CONNES’TRACE FORMULA 9upon defining τ(x )=τ0(x )for x ∈C B (H )+,and τ(x )=∞for x ∈B (H )+\C B (H )+,a non-zero trace τon B (H )is given.Thus,traces (resp.non-trivial traces)on all bounded linear operators are in one-to-one correspondence with traces (resp.non-trivial traces)on the compact operators.For the unique extension of the trace tr of Lemma 1.2from compact operators onto B (H )the same notation tr will be used.Note that in view of Lemma 1.3with the help of 1.2.1(×)and (⋆⋆)easily follows that for non-compact x ≥0and each m.o.n.s.{ϕn }one has ∞n =1 xϕn ,ϕn =∞.Hence,the formula given in Corollary 1.1extends on all x ∈B (H )+.From this formula it is plain to see that tr is a non-trivial normal trace on B (H ).Up to a positive multiple,tr is also unique on B (H )as non-trivial trace with this property :Corollary 1.4.A non-trivial normal trace τhas the form τ=α·tr ,with α>0.Proof.Let p 1<p 2<p 3<...<1be a sequence of orthoprojections with rank(p n )=n ,for each n ∈N .Then,for each x ≥0,l.u.b.√x =x .Note that x n =√x ∈F B (H )+holds.Since also τ|C B (H )+is a non-trivial trace,by Corollary 1.2there is unique α>0with τ(x n )=α·tr x n ,for each n ∈N .Hence,by normality of τand since tr is normal,τ(x )=α·tr x follows,for each x ≥0.Note that in view of the mentioned one-to-one correspondence with traces on the compact operators Corollary 1.2extends to non-trivial traces on B (H )accordingly.In line with this and Corollary 1.4the theory of traces on B (H )with separable infinite dimensional H essentially is the theory of the one normal trace tr and myriads of singular traces.1.3.Examples of singular traces on B (H ).Examples of singular traces have been invented by J.Dixmier in [8].Nowadays this class is referred to as Dixmier-traces.In the following,only the singular traces of this class will be constructed and considered.Thereby,in constructing these traces we will proceed in two steps.In a first step we are going to define some non-trivial two-sided ideal in B (H ),with hereditary positive cone,which later will prove to belong to the defining ideal of each of the singular traces to be constructed.As has been already noticed in context of Theorem 1.1,each such ideal then is an ideal of compact operators.For such ideals one knows that these can be completely described in terms of the classes (Schatten-classes)of the characteristic sequences coming along with the operators of the ideal,see [32,Theorem 12].In these sequences,which are in ℓ∞(N )+,the full information on the ideal is encoded.In a second step,a class of states on ℓ∞(N )is constructed which,in restriction to the mentioned sequences from the ideal,yields a map which vanishes on those sequences which correspond to operators of finite rank.If taken as functions on the positive operators of the ideal these maps will be shown to be additive,positive homogeneous and invariant.Hence,the extension via the extension principle of Lemma 1.1on all of B (H )+finally will provide us with a class of singular traces.1.3.1.Step one :Some ideal of compact operators.For compact x with the help of the characteristic sequence {µn (x )}define∀k ∈N \{1}:γk (x )=1log k .(1.3a)10P.M.ALBERTI,R.MATTHESThen,{γn(x):n>1}is a sequence of non-negative reals which may be bounded or not.The bounded situation deserves our special interest.Let a subset L1,∞(H)⊂C B(H)be defined as follows:L1,∞(H)= x∈C B(H):sup n≥2γn(x)<∞ .(1.3b)It is plain to see that by L1,∞(H)an ideal is given in B(H),for some corresponding terminology see[28,3,4],and e.g.[14].Proposition1.1.L1,∞(H)is a non-trivial two-sided ideal in B(H),and thus is an ideal of compact operators,with hereditary cone L1,∞(H)+of positive elements. Proof.In view of the definitions(1.3)and since C B(H)is a two-sided ideal,the validity of thefirst assertion follows as an immediate consequence of(1.2a),(1.2c) and(1.2f)together with the fact that for each operator x offinite rank{γn(x): n>1}is a null-sequence and thus is bounded.Finally,owing to Corollary1.3for x∈L1,∞(H)+and y∈B(H)with0≤y≤x one infers y∈C B(H)+,and then y≤x according to(1.2b)implies also y∈L1,∞(H)+.For completeness yet another characterization of L1,∞(H)will be noted(without proof,see e.g.in[4,IV.2.β]),and a class of L1,∞-elements,which can be charac-terized through the asymptotic behavior of the singular values,will be given.Let L1(H)be the ideal of all operators of trace-class,that is,the defining ideal which corresponds to the normal trace tr,cf.Lemma1.2and Corollary 1.1.From(1.3b)and Lemma1.2then especially follows that the inclusion rela-tion L1(H)⊂L1,∞(H)takes place amongst L1,∞(H)and the ideal of trace-class operators.Moreover,if in line with[28]another Banach space L∞,1(H)(=Sωin [28])is defined throughL∞,1(H)= y∈C B(H):∞ n=1n−1µn(y)<∞ ,(1.4)then it is essentially due to(1.2c),(1.2e)and by monotonicity of the sequences of the σn(y)’s and1CONNES’TRACE FORMULA11 (the ordering ofµn(x)’s is of importance in this context).Since also the sequence ofµn(y)’s is in decreasing order,it is not hard to see that by successively ex-ploiting the just mentioned conditions on r,for n≤N with N∈N,the validity of k≤Nµk(x)(µk(y)−r k)≥0can be derived,for each N∈N,and any given r which is subject to the above conditions.From this the left-hand side estimate of(1.5a) gets evident.Now,for any two given compact linear operators x,y in view of the polar decomposition theorem and owing to compactness of both operators partial isometries u,w can be chosen such that u|x|w|y|≥0holds,with the singular val-ues of the compact operator u|x|w|y|obeyingµn(u|x|w|y|)=µn(x)µn(y),for each n∈N.In accordance with Lemma1.2one then has|tr u|x|v|y||=tr u|x|w|y|= lim n→∞σn(u|x|w|y|)= µn(u|x|w|y|)= µn(x)µn(y).Hence,since in our par-ticular situation of x,y we have u|x|w|y|∈L1(H)and the above proved left-hand side estimate of(1.5a)has been shown to hold,(1.5a)is completely seen.Especially,in view of Proposition1.2the estimate(1.5a)can be applied with x∈L1,∞(H)and I=L∞,1(H).Relating asymptotic properties of singular values of x∈L1,∞(H)we thus get the following information:x∈L1,∞(H)=⇒∀y∈L∞,1(H):∞n=1µn(x)µn(y)<∞.(1.5b)Viewing(1.4)and(1.5b)together suggests compact x with asymptotic behavior of singular values likeµn(x)=O(n−1)as good candidates for elements of L1,∞(H).1 In fact,such asymptotic behavior implies that,with some C>0,for all n≥2σn(x)= 1≤k≤nµk(x)≤C 1+ 2≤k≤n k−1 ≤C 1+ n1t−1dt =C(1+log n) is fulfilled.In view of(1.3)we therefore arrive at the following result:Corollary1.5.x∈C B(H),µn(x)=O(n−1)=⇒x∈L1,∞(H).Remark1.1.(1)It is easy to see that for compact x with bounded multiplicity function,m(λ)≤N<∞for allλ,the condition imposed by(1.5b)upon x amounts toµn(x)=O(n−1).Unfortunately,in case of unbounded m this can fail to hold.2That this can even occur for x within L1,∞(H)can be seen by the following counterexample:3(2)Let x be positive and compact withµ1(x)=1,and with singular valueswhich for k≥2with(m−1)!<k≤m!,m≥2,are given byµk(x)= log m/m!.One then easily proves thatσk(x)obeysσm!(x)≤1+log m!.Since the function f(t)=log(1+t/m!)−t{log(m+1)/(m+1)!}is non-negative for0≤t≤m·m!,from the previous alsoσk(x)≤1+log k can be followed whenever m!<k≤(m+1)!is fulfilled.This conclusion applies for each m≥2,and thus according to(1.3)wefinally get x∈L1,∞(H).On the other hand,lim m→∞m!µm!(x)=∞holds.Thus in particularµn(x) certainly cannot behave asymptotically like O(n−1).12P.M.ALBERTI,R.MATTHES1.3.2.Step two:Scaling invariant states.Let us come back now to the construction of the Dixmier-traces.The construction will be based on considering a certain classof states on the commutative W∗-algebra M=ℓ∞,see1.1.1for basic notations. Relating special further notations,for each k∈N let e k∈ℓ∞be the k-th atom inℓ∞,with j-th component obeying(e k)j=δkj(Kronecker symbol),and let E kbe the special orthoprojection of rank k given as E k= j≤k e j.The ascendingly directed sequence{E n}obeys l.u.b.E n=1and the following equivalence is valid: x∈ℓ∞: · ∞−lim n→∞E n x=x⇐⇒lim n x n=0.(1.6) Also,for x∈ℓ∞+,{E n x}⊂ℓ∞+is ascendingly directed,with l.u.b.E n x=x.For the following,let a mapping s:ℓ∞−→ℓ∞(scaling)be defined on x∈ℓ∞through s(x)j=x2j,for all j∈N.It is obvious that s is a normal∗-homomorphism ontoℓ∞.Hence,s is a unital normal positive linear map onto itself,andℓ∞s={x∈ℓ∞:s(x)=x}is a W∗-subalgebra ofℓ∞(thefixpoint algebra of s). Lemma1.4.There exists a conditional expectation E:ℓ∞−→ℓ∞s projecting onto thefixpoint algebraℓ∞s such that the following properties hold:(1)E◦s=E;(2)E(x)=(lim n→∞x n)·1,for each x∈ℓ∞with lim n→∞x n existing. Proof.Let us consider the sequence{s n }of partial averages s n =1n hold,for each n∈N,and since owing to normality of s for eachω∈ℓ1alsoω◦s∈ℓ1is fulfilled,by argueing with the mentioned subnet one infers that E◦s=s◦E=E.From this{x∈ℓ∞:E(x)=x}⊂ℓ∞s and s n ◦E=E follow,for each n.Thus in view of the above E2=E◦E=E follows.Hence,E is a projection of norm one(conditionalexpectation)projecting onto thefixpoint algebra of s and which satisfies(1).To see(2),notefirst that owing to s(e k)=0for k odd,and s(e k)=e k/2for keven,one certainly has s n(E k)=0,for each n>log k/log2.Hence,the action of the n-th average s n to the orthoprojection E k can be estimated as s n (E k) ∞≤[log k/log2]/n(here[·]means the integer part),and thus for all k∈N one has · ∞−lim n→∞s n (E k)=0.¿From this and E=σ(ℓ∞,ℓ1)−weak limλs nλ then especiallyω(E(E k))=0follows,for eachω∈ℓ1.Hence E(E k)=0,for each k.Since for each y∈ℓ∞with0≤y≤1one has0≤E k y≤E k,from the previous together with positivity of E also E(E k y)=0follows.By linearity of E and since ℓ∞is the linear span ofℓ∞+∩(ℓ∞)1this remains true for each y∈ℓ∞.But then, for x∈ℓ∞withα=lim n→∞x n by continuity of E and in view of(1.6)one infers E(x−α·1)= · ∞−lim k→∞E(E k(x−α·1))=0,which is equivalent with(2).Corollary1.6.There is a stateω∈S(ℓ∞)satisfying the following properties:(1)ω◦s=ω;(2)ω(x)=lim n→∞x n,provided lim n→∞x n exists.CONNES’TRACE FORMULA13 The setΓs(ℓ∞)of all such states is a w∗-compact convex subset of singular states.4 Proof.Let E be constructed as in Lemma1.4.By positivity and unitality of E,for eachν∈S(ℓ∞)alsoω=ν◦E is a state.In view of(1)–(2)this state then obviously satisfies(1)–(2).5ThatΓs(ℓ∞)is w∗-compact and convex is evident from the linear nature of the conditions(1)–(2).Finally,in accordance with(2)one hasω(E k)=0, for eachω∈Γs(ℓ∞)and all k∈N.Now,let p∈ℓ∞be any orthoprojection with ω(p)>0.Then,p=0,and owing to l.u.b.E n p=p there has to exist k∈N with q=E k p=0.Thus0<q<p and q≤E k.In view of the above from the latter by positivity ofωthenω(q)=0follows.Hence,eachω∈Γs(ℓ∞)is singular.1.3.3.Constructing the Dixmier-traces.For given x∈L1,∞(H),let a sequenceγ(x) be given throughγ(x)=(γ2(x),γ3(x),...),withγn(x)in accordance with(1.3a). Then,by definition(1.3b)one hasγ(x)∈ℓ∞+.Hence,if for eachfixed scaling invariant stateω∈Γs(ℓ∞),see Corollary1.6,following[8]we define∀x∈L1,∞(H)+:Trω(x)=ω(γ(x)),(1.7) then according to Proposition1.1and sinceωis a positive linear form,we are given a positive map Trω:L1,∞(H)+∋x−→Trω(x)∈R+defined on the positive cone of the ideal L1,∞(H).The key idea of[8]is that additivity of Trωcan be shown. Lemma1.5.Trωis an additive,positive homogeneous and invariant map from L1,∞(H)+into R+.Proof.Since L1,∞(H)+is the positive cone of a two-sided ideal of compact op-erators,for x,y∈L1,∞(H)+andλ∈R+we have that x+y,λx,x∗x,xx∗∈L1,∞(H)+,and these are compact operators again.Hence,in view of(1.3a)from (1.2a)and(1.2g)bothλ·γ(x)=γ(λx)andγ(x∗x)=γ(xx∗)follow,which in line with(1.7)means that Trωis positive homogeneous and invariant.It remains to be shown that Trωis additive.First note that according to the left-hand side estimate of(1.2d)withinℓ∞+one hasγ(x+y)≤γ(x)+γ(y).Hence,by positivity and linearity ofω,(1.7)yieldsTrω(x+y)≤Trω(x)+Trω(y).(⋆) Now,to each compact operator z letγ0(z)=(γ3(z),γ4(z),...),that is,γ0(z)arises fromγ(x)by application of the one-step left-shift.Also,onℓ∞let a linear map m be defined by m(β)n=log2≤log2log k γ(z) ∞.log k−1。