分子生物学分析常用软件
- 格式:docx
- 大小:37.01 KB
- 文档页数:9

MEGA软件的使用引言现代分子生物学所积累的数据库(如美国国家生物信息中心建立的GeneBank等)隐含着大量的生物系统学和生物进化的有用信息。
计算机软件是挖掘这些知识宝藏的最有效的工具,而且这些数据库不断快速扩展,信息量十分庞大。
因此,如果没有计算机软件的帮助,我们简直无法开战分子系统学和分子进化方面的研究工作。
同样,这些数据分析方法和软件在古DNA研究中是必不可少的。
因为有着坚实的分子进化和人类遗传学基础,序列比对分析已经成为重构物种和基因家族进化历史,估算分子进化速率、推断基因和基因组进化过程中自然选择力量的强度等的必不可少的方法和手段。
计算机的应用和统计学的介入大大简化这些工作。
在这些背景下,Sudhir Kumar、Koichiro Tamura和Masatonshi Nei 和在上世纪九十年代初就发展了Mega遗传分析软件,并不断改进。
现在公布了3.0版,增添很多新功能,并使软件使用者能在线取得帮助。
Mega(Molecular Evolutionary Genetics Analysis)是一个界面友好、操作简便、功能强大的分子进化遗传分析软件,也是文献中经常用到的分析软件。
尤其是,Mega的新版本对使用界面做了优化,并有改进了许多统计学和遗传学算法,其支持的文件格式很多,而且可以直接从测序图谱中读取序列。
另外,Mega 软件还内嵌了一个Web浏览器,能直接登录NCBI网站。
Mega软件操作起来很方便,其界面与传统的Windows程序界面很像,即使初学者也很易上手。
Mega软件功能十分强大,尤其在计算遗传距离、构建分子系统树方面。
Mega 软件提供多种计算距离的模型,包括Jukes-Cantor距离模型、Kimura距离模型、Equal-input距离模型、Tamura距离模型、HEY距离模型、Tamura-Nei距离模型、General reversible距离模型、无限制距离模型等。

关于分子生物学中的同源性分析作者:李尚伟杜娟来源:《教育教学论坛》2014年第51期摘要:同源性是指在进化过程中源于同一祖先的分支之间的关系,包括直系同源和旁系同源。
直系同源基因描述在不同物种中来自于共同祖先的基因,而旁系同源基因描述在同一物种内由于基因复制而分离的同源基因。
同源性与相似性是两个不同的概念,前者是质的概念,后者突出量的描述,但它们之间又有一定关系,可以通过相似性来推测序列是否具有同源性。
介绍了用BLAST进行序列同源性分析的方法。
关键词:同源性;直系同源;旁系同源;相似性;BLAST中图分类号:G642.0 文献标志码:A 文章编号:1674-9324(2014)51-0184-02在分子生物学的教学及研究中,经常对核苷酸或氨基酸序列进行比对以确定基因之间或蛋白质之间的同源关系,进而根据同源性来推测物种间的亲缘关系。
基因或蛋白质之间的同源关系包括直系同源和旁系同源,序列间的同源性可用相似性或一致性来进行量化,用相似性(一致性)来判断序列是否同源。
一、同源性的概念在生物学中,同源性(homology)是指在进化过程中源于同一祖先的分支之间的关系。
我们可以在生物学的不同层次(如形态性状、分子性状等)上进行同源性分析,形态性状由于进行上或个体发育上的共同来源而呈现出本质上的相似性,但其功能不一定相同,那么它们就是同源的,如马的前肢与鸟的翅就是同源器官。
在分子水平上同源性主要是指基因的核苷酸序列或蛋白质的氨基酸序列之间的相似程度。
同源基因或蛋白质(homolog)指遗传上从某一共同祖先经趋异进化而形成的具有不同序列的基因或蛋白质。
同源性是一个相对的概念,在一定水平和范围内对其研究才有意义[1]。
二、直系同源与旁系同源同源关系包括两种类型:直系同源(ortholog)和旁系同源(paralog)。
这里我们主要以同源基因为例来进行讨论,同源蛋白质是同样的情况。
同源基因是遗传上来自某一共同祖先DNA序列的基因,包括直系同源基因和旁系同源基因。
Origin软件在生物学实验数据拟合中的应用分子生物学摘要:Origin软件具有强大的数据分析和实验绘图功能,为用户提供了全面的功能选项,在生物学实验研究中发挥了重要作用。
文章综述了Origin软件在生物学实验数据拟合分析中的应用,并以非线性拟合求参数为例,介绍Origin 8.0在该实验数据处理中的具体拟合方法。
旨在为生物学研究者提供一定分析思路和参考价值。
关键词:Origin软件;生物学研究;数据拟合;实验绘图Origin软件作为一款数据分析和实验绘图的专业软件,已经广泛应用于分析化学、物理化学、生物学等领域,如:化学建模、物理参数分析、酶催化反应反应动力学研究。
其中,Origin软件在化学和物理学研究中的应用,已有诸多学者进行了详细的介绍,但在生物学中的应用尚未零散,而缺乏系统的归纳。
生物学是一门以实验为基础的学科,具有极强的实践性和科学性,对实验数据处理与分析有着较高的要求。
特别地,在酶催化反应动力学参数求解、发酵条件优化、细胞活性分析等实验处理中,一旦存在分析方法不当,不仅产生误差,而且费时费力。
原本实验数据存在一定的误差,加上数据分析处理带来的较大误差,往往造成实验效率低下。
在Origin的排序、调整、统计、数据点屏蔽、频谱变换、曲线拟合等功能中,又以曲线拟合功能的应用较为广泛。
因而,针对Origin软件曲线拟合功能在生物学实验中的全面应用进行总结尤其重要,可以为生物研究分析方法带去更多的参考,提供科学的数据处理依据。
1Origin简介Origin软件是美国OriginLab公司(前身是Microcal公司)推出的,自1991年问世以来,不断更新,直到2013年10月已更新至Origin 9.0版本,但较为稳定的为Origin 8.0版本。
该软件是一款数据分析和函数绘图的专业软件,为用户提供了数据导入、数据分析、数据作图、自动化操作、导出或打开图形、组织项目、混合编程以提高效率等功能选项。
凝胶定量软件Quantity One使用简介1、内容简介凝胶电泳是每个做分子生物学的同学天天都要打交道的基本技术。
电泳之后的信息处理与电泳本身同样重要。
目前有大量软件可以用于分析电泳结果,比较有名的比如BandScan、BandLeader、Sigma Gel等等。
今天要向大家介绍的是来自Bio-Rad的1D凝胶定量软件Quantity One(Bio-Rad还有一个做2D凝胶分析的软件PDQuest)。
这个软件的最新版本可以在Bio-Rad的主页免费下载。
目前的最新版本是4.52版2、Quantity One的定量方法Quantity One的分析功能顾名思义主要用来进行凝胶或者培养皿的荧光定量分析。
它的分析功能或者说分析方式主要有4种:泳道/条带轨迹定量法;等高线直接定量法;菌落计数;分子量测定这三种方法中使用最为方便也是最为广泛的应该是等高线定量法(Volumn Contour)。
它通过半自动描绘电泳条带的等高线边缘来得到等高线区域内部面积,再将该面积乘以区域内平均光密度值得到条带内部总的信号量。
当然这种分析方法的弊病显而易见:无法同等得排除不同泳道的背景亮度;等高线的绘制处于“半自动”状态,即需要人为判断作为等高线标准的电泳条带的边缘;最致命的是在几个电泳条带距离十分接近的时候几乎无法绘制单一条带的轮廓(常出现连续的几个条带等高线相连而无法分离出单独条带的轮廓)。
三种方法中个人感觉最为科学和严谨的应该是泳道/条带轨迹定量法(Trace Tracking)。
这种方法使用起来步骤较为繁琐,必须通过泳道识别---电泳条带识别两个连续的步骤才能进行定量。
然而这种方式的最大优点在于它可以完全抛弃人为主观因素进行全自动定量。
他的定量方式为:首先根据不同电泳条带的光密度值绘制光密度曲线,然后计算光密度曲线下面积作为电泳条带的定量根据。
大家可能会问他能不能排除泳道背景?答案是肯定的,它能够最大程度的排除不同泳道之间的背景差异,让各个泳道上的不同电泳条带在一条几乎相同的起跑线上进行对比。

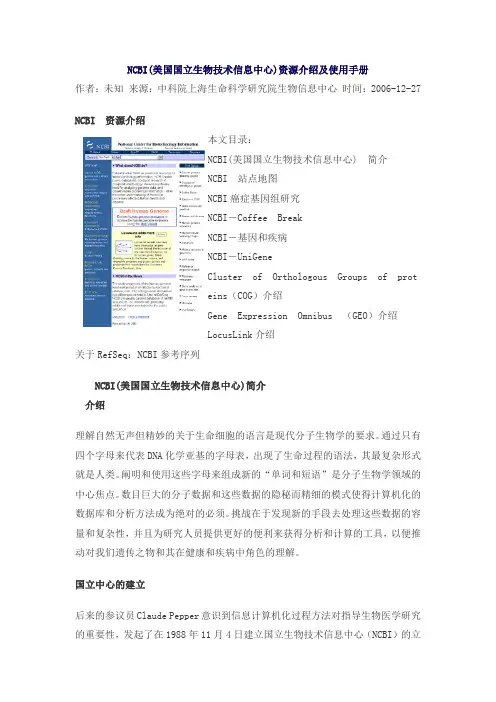
NCBI(美国国立生物技术信息中心)资源介绍及使用手册作者:未知来源:中科院上海生命科学研究院生物信息中心时间:2006-12-27NCBI 资源介绍本文目录:NCBI(美国国立生物技术信息中心) 简介NCBI 站点地图NCBI癌症基因组研究NCBI-Coffee BreakNCBI-基因和疾病NCBI-UniGeneCluster of Orthologous Groups of proteins(COG)介绍Gene Expression Omnibus (GEO)介绍LocusLink介绍关于RefSeq:NCBI参考序列NCBI(美国国立生物技术信息中心)简介介绍理解自然无声但精妙的关于生命细胞的语言是现代分子生物学的要求。
通过只有四个字母来代表DNA化学亚基的字母表,出现了生命过程的语法,其最复杂形式就是人类。
阐明和使用这些字母来组成新的“单词和短语”是分子生物学领域的中心焦点。
数目巨大的分子数据和这些数据的隐秘而精细的模式使得计算机化的数据库和分析方法成为绝对的必须。
挑战在于发现新的手段去处理这些数据的容量和复杂性,并且为研究人员提供更好的便利来获得分析和计算的工具,以便推动对我们遗传之物和其在健康和疾病中角色的理解。
国立中心的建立后来的参议员Claude Pepper意识到信息计算机化过程方法对指导生物医学研究的重要性,发起了在1988年11月4日建立国立生物技术信息中心(NCBI)的立法。
NCBI是在NIH的国立医学图书馆(NLM)的一个分支。
NLM是因为它在创立和维护生物信息学数据库方面的经验被选择的,而且这可以建立一个内部的关于计算分子生物学的研究计划。
NCBI的任务是发展新的信息学技术来帮助对那些控制健康和疾病的基本分子和遗传过程的理解。
它的使命包括四项任务:建立关于分子生物学,生物化学,和遗传学知识的存储和分析的自动系统实行关于用于分析生物学重要分子和复合物的结构和功能的基于计算机的信息处理的,先进方法的研究加速生物技术研究者和医药治疗人员对数据库和软件的使用。
一、PPT模板与软件:1.ScienceSlides:ScienceSlides是一种PPT插件,可方便的画出各种细胞器化学结构,用来论文画图确实很好用。
特别是用这个和AI(illustrator)结合,画的图可以媲美老外的CNS哦。
2.科研医学美图PPT模板3.200+套绝美PPT模板二、代谢与信号分析软件:1.CellNetAnalyzer:CellNetAnalyzer,是一种细胞网络分析工具,前身是FluxAnalyzer,是基于MatLab的代谢网络和信号传导网络分析模块,。
这是一个典型的代谢流分析工具,可以进行代谢流的计算、预测、目标函数的优化,端途径分析、元素模式分析,以及代谢流之间的对比等。
可以基本满足研究一个中型代谢网络的结构尤其是计算流分配的要求,大部分论文中的代谢网络分析都是或明或暗的用这个分析的。
2. 信号通路图汇总3. 药理学思维导图三、二维、三维构图软件:1.DeepViewer _4.10_PCDeepViewer ,曾经也叫做Swiss-PdbViewer,是一个可以同时分析几个蛋白的应用程序。
为了结构比对并且比较活性位点或者任何别的相关部分,蛋白质被分成几个层次。
氨基酸突变,氢键,原子间的角和距离在直观的图示和菜单界面上很容易获得。
2.pymol-0_99rc6-bin-win32PyMOL是一个开放源码,由使用者赞助的分子三维结构显示软件。
PyMOL适用于创作高品质的小分子或是生物大分子(特别是蛋白质)的三维结构图像。
PyMOL的源代码目前仍可以免费下载,供使用者编译。
对于Linux、Unix以及Mac OS X等操作系统,非付费用户可以通过自行编译源代码来获得PyMOL执行程式;而对于Windows的使用者,如果不安装第三方软件,则无法编译源代码。
四、分子生物学软件1.DNASTAR_Lasergene.v7.1LaserGene是美国DNAStar公司发行的综合性序列工具软件,可用于发现和注释DNA序列中的基因,并操作所关注的DNA的其他feature。

ch in a flash Geneious4.8Quickstart ManualBiomatters LtdMarch4,20102IntroductionThis quickstart manual will guide you through the features of Geneious4.8’s interface and help you orient yourself.You should also try the Geneious built in interactive tutorial which can be found by selecting“Help”→“Tutorial”from the menu.For more information you can go to /education where you willfind a number of tutorials on more specific topics.User Interface OverviewFigure1:The main window in GeneiousOn the left of Figure1are the sources and services in the“Sources Panel”.Here you can access many online databases including NCBI and UniProt,then simply drag and drop sequences and other data to your Local folders where you can store,view and analyse them in a customisable workspace.Right clicking(CTRL+click on Mac OS X)on the Local folders allows you to create new folders, share them with other users,delete,rename or move them.You can also mark the contents as read and export an entire folder including subfolders in a single operation.3 Selecting a data source displays the contents of that source in the“Document Table”.This table always has columns relevant to the type of data you are working with making it easy to sort and locate the items you are looking for.Click on the header of a column to sort or click and drag the headers to reorder them.Right click(CTRL+click on Mac OS X)on the header to change the columns that are visible.You can sort sequences by length or organism for example.Use thefilter box above the table to quickly locate items by keyword or click the search button to access powerful searching functionality.Selecting an item in the table gives you a view of the data in the“Document View”area below. Geneious always chooses views which are appropriate for the data you have selected.Often there are several of these so you can switch between them using the tabs directly above.A pairwise alignment has an alignment view and a dotplot for example.The“Help Panel”shows context specific information about the particular viewer that is in use. It also includes the built in tutorial which covers the major functions of Geneious Pro.If you need some extra space to work in,just click the“Expand”button to expand the viewor the“Open”button to open it in a separate window.You can also open a document in a new window by double-clicking on it in the document table.To access any of the analysis features in Geneious such as BLAST searching,sequence align-ment and cloning just select the data you want to analyse before choosing the appropriate analysis from the toolbar or menu.Sequence Viewer BasicsThe sequence viewer allows you to display your annotated sequence or alignment.The plus and minus buttons increase and decrease the magnification of the sequence.You can zoom infully to view the bases/residues,and out to see an overview of the sequence(s).Zooming can also be quickly achieved by holding down the zoom modifier key(the Alt key on Windows,Linux and Mac OS X)and clicking.When the zoom key is pressed a magnifying glass mouse cursor will be displayed.The colors option controls the coloring of the sequence nucleotides or amino acids.Color-ing schemes differ depending on the type of sequence.For example,the“Polarity”and“Hy-drophobicity”coloring schemes are available only for Protein sequences.Annotations can be shown and hidden by opening the“Annotations”section of the sequence viewer panel and clicking the checkbox next to each annotation type(Figure2).By selecting a region and clicking“Annotation”,a custom annotation can be added to aregion of interest.Just enter a name and click OK.Annotations can also be copied between sequences by right-clicking(CTRL+click on Mac OS X)on the annotation.4Figure2:A view of an annotated nucleotide sequence in Geneious DatabasesGeneious allows you to search for documents within your local folders with ease.Clicking the “Search”button at the top right of the main window when a folder is selected will allow you tofind documents by text or sequence(Figure3).Select the top“Local”folder and click Search to search all of your local folders.Figure3:Searching the local foldersGeneious Pro integrates closely with many online databases including a large number from NCBI such as Nucleotide,Gene,SNP,PubMed and Taxonomy as well as UniProt and PFam. To search any of these text-based databases,select the database in the sources panel then you can perform a simple keyword search by entering your keyword(s)in to the search box and5 clicking the“Search”button.To search using a more complex combination of terms,click the “More Options”button to the right.(Figure4).Figure4:Searching the PubMed databaseThe results of your search are displayed as they are downloaded from the internet.While this is happening you can sort by any of the columns orfilter tofind keywords like a particular country or species.Selecting data,immediately gives you a graphical representation of results without having to navigate away from the search.When you’ve found what you’re looking for save it by clicking and dragging the document(s) from the document table over to the desired folder in the sources panel.Sequence SearchGeneious Pro also features integrated access to NCBI’s BLAST databases and the ability to set up your own local personal databases using Custom BLAST.To search for similar sequences in any of these databases,first select your query sequence(orseveral for a batch search)then click on the“Sequence Search”button.The options that are displayed allow you to choose the database and parameters for your search.6Once you click the search button,Geneious creates a folder for the results and starts download-ing them when the search is complete(Figure5).Your results are saved straight away so you won’t lose them even if you have to close the program.Figure5:Sequence Search CompleteImport,Export and StorageGeneious Pro supports importing and exporting a wide array of formats including PDF,FASTA, GenBank and Vector NTI allowing you to share data between many different programs.Geneious will usually be able to recognise the format of afile automatically so you can just click and drag files directly into the Geneious window and they will be imported.Geneious also has a special Vector NTI database import option to import all your data from Vector NTI in one operation (“File”→“Import”→“Vector NTI Database”).In addition to exporting in bioinformatics formats,Geneious also supports high quality graph-ical export for printing and inclusion in publication.More details can be found in the section on printing and exporting images later in this document.As well as storing data on your hard drive,Geneious Pro can also utilise a private SQL server. This allows multiple users to access data simultaneously;great for managing group projects, and gives added security through access controls and backups.For more details on setting this up refer to the Geneious Manual.7 AgentsTo help you stay up to date with the ever-changing contents of all these databases,Geneious Pro brings you Agents.Agents make sure you always have the latest data by performing searches automatically and telling you when new data becomes available.They can be used to run a BLAST search every day and tell you when new sequences that are similar to your query have become available.Alternatively,you could use an agent to stay up to date with publications from your favourite researcher or on your favourite topic(Figure6).To create an agent or check on your existing agents,click the“Agents”button in the toolbar.Figure6:Create a PubMed Search AgentWhen an agentfinds a new publication or sequence,it’s just like receiving a new email.8CollaborationWith collaboration you can connect to our public server,or a secure local server,then share your documents with other Geneious users from within the program streamlining collaborative research.You can see when your colleagues are online and share documents.For full details on setting up collaboration refer to the Geneious Manual.AssembleFor sequence assembly,Geneious Pro supports import of traces from both ABI and SCF for-mats.Once you have acquired your fragments for assembly,you can perform assembly in the same way that almost all analysis is performed in Geneious.Select the documents for analysis then click on the“Assembly”button.You are then asked to choose the parameters for your analysis.Assembly includes options for alignment stringency, selecting a reference sequence and automatic trimming.Click OK and once the assembly is complete,Geneious automatically selects the result so you can view it.Figure7:Assembled contigIn this contig(Figure7)trimmed annotations are ignored during the assembly and in calcu-lation of the consensus.This means you can keep the trimmed regions for future reference without them disrupting your assembly.9 Disagreements between reads are identifiable as black bars.You can also jump quickly to each disagreement by pressing Ctrl+D(+D on Mac)on the keyboard.Zooming in on one of these(Figure8)you can see the base calls with the trace above.Figure8:Editing an assembled contigThe quality of the bases is illustrated by the blue graph behind the trace.You can zoom in further to help resolve tricky base calls.Control the height of the graph using the options on the right.To manually resolve conflicts,edit bases within the same view by clicking“Allow Editing”and just typing in the new base.Edit the consensus sequence to quickly change all base calls at one position.When you are satisfied with your assembly,select the consensus sequence,click“Extract”and choose a name to save it to a separate document for further analysis.Restriction and CloningThe circular sequence viewer(Figure9)not only gives an overview of the features on a se-quence,it also allows you to zoom in,view the bases and even edit them.Restriction analysis is performed in real-time inside the Sequence View.Select“Find Restriction Sites”under“Annotations”→“Restriction Site”on the right and immediately any cut positions will be shown on the sequence.You can create custom sets of restriction enzymes,perhaps the ones that are available in your lab fridge,making it easy to identify cut sites for the enzymes that are available.10Figure9:Viewing a plasmidFigure10:Insert sequence into vectorClick“Apply”to save the current cut sites for use in further analysis.Geneious Pro simplifies virtual cloning with its one-step“Insert into Vector”function.After identifying cut sites on your insert this function will take care of the rest byfinding compat-ible enzymes for the plasmid then performing digestion and ligation in one step(Figure10). Geneious also supports Gateway®Cloning.PrimersGeneious Pro includes Primer3for primer design and testing.Selecting a region or annotation as a target for amplification,you can quickly design a primer to surround it(Figure11)using the“Primers”button.Primer design has many options so you can design the right primerfor your experiment.These include limits on melting point,GC content,primer size and many more.Figure11:Design a pair of primersWhen you click OK primers will be designed and added to the target as annotations.To view the statistics for each primer,hold your mouse over the annotation in the sequence view.To save a primer for ordering or testing against other sequences,just click on the annotation and click“Extract”.Align SequencesFigure12:Dotplot viewerGeneious Pro makes pairwise and multiple sequence comparison easy.Selecting two sequences gives you a dotplot for initial comparison(Figure12).Further investigation can be done using the built in sequence alignment tool.With the se-quences for alignment selected,click the“Alignment”button in the toolbar.Geneious Pro includes built in implementations of global and local alignment as well as several multiple aligners including ClustalW and MUSCLE(Figure13).You can change substitution matrices and gap penalties to optimise your alignments.Once an alignment is complete,the alignment view is automatically displayed.Alignment ViewingInitially,Geneious gives you an overview of the alignment.It displays a graph of identity along the top and you can see the annotations and gap locations on the sequences themselves. Within the alignment view,you can zoom in to see the bases and customize the settings on the right to create the view which is best for your analysis(Figure14).You can also display protein translations alongside the sequences,customise color schemes,graphs,consensus options and annotations.Figure13:Alignment optionsThe statistics section at the bottom is updated in real time as you select a region.On a protein sequence,this includes molecular weight and isoelectric point.To modify your alignment manually,click on“Allow Editing”then type in characters directly with the keyboard or click and drag regions of the alignment to change gap locations. PhylogeneticsGoing from a multiple alignment to the next step-building a tree is simple.Just select thealignment and click the“Tree”button.Geneious Pro features basic tree building such as Neighbour-Joining and bootstrapping.Plug-ins are also available for more advanced analysis including Mr Bayes and PAUP*.Trees are displayed in an interactive viewer that allows editing and customisation of the view. You can rearrange the tree and color the branches for example(Figure15).If you select a subtree by clicking on it,the corresponding sequences are also selected in the associated multiple alignment(click on the Alignment View tab).3D Structure VisualisationGeneious Pro includes a powerful viewer for common3D biological structure formats such as PDB.Structures can be rotated by clicking on the structure and dragging the mouse.You can zoom by holding the Shift key while clicking and dragging,and individual components down to atoms can be selected and highlighted(Figure16).Figure14:Multiple sequence alignmentFeatures of molecules can be explored allowing you to see thefine detail of the structure of the polypeptide chain as well as simplified views such as cartoons to show the overall structure and views can be combined and include custom coloring using the menu at the top of the structure viewer window.When you havefinished you can save the structure and your display settings will be preserved.For advanced users,the command box lets you type in arbitrary jmol scripting commands.To see some examples,select one of the pre-populated options in the boxs drop-down.For a com-plete description of the commands you can use,see /academics/ chemapps/jmol/docs.Printing and Image ExportingAny view within Geneious Pro can be printed or saved for publication.Saving features in common formats like JPEG and high quality vector formats like PDF.Simply set up the display the way you want and select“File”→“Print”or“Save as Image File”.A dialogue will appearallowing you to control the way the image is laid out on the page(Figure17).Figure15:Tree viewer showing colored branchesTeachingGeneious Pro is great for teaching bioinformatics.It gives students easy access to all the tools they need without requiring them to learn tricky command line interfaces.This means they spend less time learning the tool and more time understanding the analysis.Geneious Pro features interactive tutorials which guide students through analyses linking them to relevant data and allowing them to answer questions for submission.These can be down-loaded from /education.Figure16:Viewing a3D structureFigure17:Printing an image。
常用生物学软件简介1. Oligo 6是目前使用最为广泛的一款引物设计软件,除了可以简单快捷地完成各种引物和探针的设计与分析外,还具有很多其他同类软件所不具有的高级功能: a) 已知一个PCR引物的序列,搜寻和设计另一个引物的序列。
b) 按照不同的物种对MM子的偏好性设计简并引物。
c) 对环型DNA片段,设计反向PCR引物。
d) 设计多重PCR引物。
e) 为LCR反应设计探针,以检测某个突变是否出现。
f) 分析和评价用其他途径设计的引物是否合理。
g) 同源序列查找,并根据同源区设计引物。
h) 增强了的引物/探针搜寻手段。
设计引物过程中,可以“Lock”每个参数,如Tm 值范围和引物3’端的稳定性等。
i) 以多种形式存储结果;支持多用户,每个用户可保存自己的特殊设置。
网址:/2. Vector NTI Suite是一套功能最全,而且界面最美观,最友好的分子生物学应用软件包。
主要包括四个大型软件,它们分别可以对DNA、RNA、蛋白质分子进行各种分析和操作。
Vector⑴ NTI:作为Vector NTI Suite的核心组成部分,它可以在生物研究的全过程中提供数据组织和序列编辑的软件支持。
Vector NTI 是以一种窗口形式,且支持项目组织的数据库来完成这一功能的;通过这个数据库,可以保存和组织大部分的实验数据,比如:基因结构、载体、序列片断、引物、蛋白质、多肽、电泳Markers和限制性内切酶等。
实际上,该数据库还支持对Vector NTI Suite 中各种小型的绘图和结果展示工具的管理。
Vector NTI 可以按照用户要求设计克隆策略。
用户只需提供克隆载体,外源片断序列,明确载体克隆的大致位置或酶切位点,其它工作由软件完成。
设计结果以图文形式输出到屏幕;最后根据客户定制的条件进行模拟电泳。
Vector NTI 还具有强大的设计和评估PCR引物、测序引物和杂交探针功能。
BioPlot⑵:BioPlot是一个对蛋白质和核酸序列进行各种理化特性分析的综合性工具,它是一种方便的桌面程序。
第一类:基于引物设计功能的软件。
此类软件主要是针对重亚硫酸盐序列进行甲基化特异性PCR(methylation-specific PCR, MS-PCR or MSP)和重亚硫酸盐测序(bisulfite sequencing, BS)引物的设计。
由于重亚酸盐修饰的特殊性,使常规的分子生物学软件,如Primer Premier、Oligo、DNASis、DNA Max、Vecter NTI Suit等均无法适用于MSP和BS引物的设计。
国外的研究者根据MSP和BS的特殊性,分别提供了多种免费或付费的专业软件,其中,某些软件,如MethPrimer已被国内外研究者广泛使用。
软件:MethPrimer主页:/methprimer简介:设计甲基化特异性PCR(methylation-specific PCR, MS-PCR or MSP)和重亚硫酸盐测序(bisulfite sequencing)引物的最早和最经典的软件,也是一款免费软件,它广受表观遗传学研究者的喜爱,也是DNA甲基化研究者使用最频繁的一款表观遗传学DNA甲基化研究工具软件。
就本人及同事的使用经验而言,该软件所设计的引物扩增效率和特异性均非常好,不过,在实际应用中,如果能配合Primer Premier软件对引物的Tm值进行适当的调整或修改,可进一步提高PCR的扩增效率。
此外,此款软件在进行引物设计的过程中,会自动对待分析序列的CpG岛进行分析,它所得到的结果与其它几款CpG岛专业分析软件(见下)一致。
当然,如果用户只想对CpG岛的分析和密度进行分析时,可选择其它CpG 岛专业分析软件。
文献:Li LC, Dahiya R. MethPrimer: designing primers for methylation PCRs. Bioinformatics. 2002 Nov;18(11):1427-31.评级:★★★★★软件:BiSearch主页:http://bisearch.enzim.hu/简介:与MethPrimer类似的专用于重亚硫酸盐修饰序列相关PCR或测序引物设计的。
三维分子类RASMOL 2.7.2.1 观看生物分子3D微观立体结构的软件。
非常有名,巨棒!RasTop 2.0 为RasMol 2.7.1的图形用户界面软件CHIME 2.6 SP3 直接在浏览器中观看3D分子。
MolMol 2k.1 将pdb等格式的蛋白文件通过微调,存成普通的图形文件。
CrystInfo 1.0 用来快速、容易地构建、观察与检查晶体3d结构。
PDViewer PDB格式文件的查看程序。
Weblab Viewlite 4.2 3维分子浏览工具及大量分子文件例子。
Weblab ViewerPro 4.2 Demo 3维分子浏览工具。
ICMLite 2.8 3维分子浏览工具,有一些其他软件没有的功能。
VMD 1.72 3维分子浏览工具,可以进行动态显示。
CN3D 3.0 3D分子结构观察软件。
WPDB 2.2 PDB文件检索显示分析软件。
DTMM 4.0 3维分子模型显示、编辑与构建程序。
Mole 1.1.8 Demo 高性能的大分子3维图形显示计算工具。
gopenmol 2.1 显示并分析分子结构及其特性的软件。
POV-Ray 3.5 beta rc5 生成三维图像工具软件。
WinMegaPov 0.7 3D渲染软件POV-Ray非官方编译软件。
MolPOV 2.0.8 将PDB文件转化为POV格式文件的软件。
Mol2Mol Demo 4.1 分子文件格式转换软件。
PovChem 2.1.1 将PDB文件转化为POV格式文件的软件。
Ortep-3 for Windows 1.074 生成分子的热椭圆形点图软件。
PLATON(2002.5.16版) 通用结晶学软件工具。
Mage 6.02 读取并演示Kinemage格式文件的专用软件。
Prekin 6.02 将PDB格式文件转换为Kinemage格式文件的软件。
Swiss-PdbViewer 3.7 PDB文件显示与分析软件。
DINAMO 蛋白序列排队比较编辑与三维模型构建工具软件。
核苷酸序列分析软件工具核苷酸序列分析是生物学研究中的重要环节,它可以帮助科学家们更好地理解生物体内的基因组成,以及基因在生物体内的功能。
为了使这一分析过程更加高效和准确,科学家们开发了一系列核苷酸序列分析软件工具。
本文将介绍几个常用的核苷酸序列分析软件工具,并对它们的特点和功能进行详细的解析。
首先,我们来介绍一款被广泛使用的核苷酸序列分析软件工具,即NCBI BLAST(Basic Local Alignment Search Tool)。
NCBI BLAST是一款免费的基因序列比对工具,它能够比对用户提供的核苷酸序列与已知数据库中的序列进行比对,并给出最相似的序列。
通过NCBI BLAST,科学家们可以快速地找到与自己研究对象相关的基因序列,并对它们进行进一步的分析。
NCBI BLAST具有高效、准确的特点,广泛应用于基因组学、生物信息学等领域。
另一个常用的核苷酸序列分析软件工具是DNASTAR Lasergene。
DNASTAR Lasergene是一套全面的分子生物学和生物信息学软件套件,它包含了多个功能强大的软件模块,可以进行多样化的核苷酸序列分析工作。
其中,SeqBuilder模块可以帮助用户进行序列的编辑和构建;序列比对模块可以进行多序列比对和进化分析;序列注释模块可以对序列进行注释和功能预测等。
DNASTAR Lasergene具有界面友好、操作方便等特点,适用于不同层次的用户。
此外,我们还有Geneious作为一个强大的核苷酸序列分析软件工具。
Geneious提供了全面的基因组和蛋白质序列分析功能,可以进行序列比对、进化分析、结构预测、序列注释等多种操作。
与其他软件相比,Geneious具有更强的计算能力和更丰富的功能。
它也支持自定义插件的添加,用户可以根据自己的需求扩展软件的功能。
Geneious在生物学研究领域中被广泛使用,尤其在基因组和序列分析的研究中具有很高的声誉。
此外,还有一些核苷酸序列分析软件工具适用于特定的研究领域。
分子生物学中常用数据库综合数据库:来源:/news/science/article/90048.html生物信息学网址链接:http://www.bioinformatics.ca/links_directory/Nucleic Acid Research Database Issue:/content/vol32/suppl_2/一、蛋白相关数据库蛋白质结构域预测工具Esignal:/esignal/信号传导系统蛋白的结构域预测工具,凡是涉及到信号传导系统的蛋白用这个预测效果最佳SignalP:http://www.cbs.dtu.dk/services/SignalP/信号肽预测工具,适合定位于非胞质位置的蛋白质Emotif:/emotif-search/结构域预测工具,由于其用motif电子学习的方法产生结构域模型,故预测效果比Prosite好Ematrix:/ematrix/是用Matrix的方法创建的结构域数据库,可与emotif互相印证。
其速度快,可快速搜索整个基因组InterPro:/InterProScan/EBI提供的服务,用图形的形式表示出搜索的结构域结果TRRD:http://wwwmgs.bionet.nsc.ru/mgs/gnw/trrd/转录因子结构域预测的最好数据库。
但不会用Protscale:/cgi-bin/protscale.pl可分析该序列的各种性状如活动度、亲水性(Kyte&Doolittle)、抗原性(Hopp&Woods)等通过寻找MOTIF和Domain来分析蛋白质的功能A. MOTIF是蛋白中较小的保守序列片断,其概念比Domain小PROSITE:/tools/scanprosite/是专门搜索蛋白质Motif的数据库,其中signature seqs是最重要的motif信息B. Domain:若干motif可形成一个Domain,每个Domain形成一个球形结构,Domain与Domain之间通常像串珠一样相连Pfam:可以搜索某段序列中的Domain,并以图形化表示出来。
常用分子生物学软件的入门介绍一、基因芯片:1、基因芯片综合分析软件。
ArrayVision 7.0一种功能强大的商业版基因芯片分析软件,不仅可以进行图像分析,还可以进行数据处理,方便protocol的管理功能强大,商业版正式版:6900美元。
Arraypro 4.0Media Cybernetics公司的产品,该公司的gelpro, imagepro一直以精确成为同类产品中的佼佼者,相信arraypro也不会差。
phoretix™Array Nonlinear Dynamics公司的基因片综合分析软件。
J-express挪威Bergen大学编写,是一个用JAVA语言写的应用程序,界面清晰漂亮,用来分析微矩阵(microarray)实验获得的基因表达数据,需要下载安装JAVA运行环境JRE1.2后(5.1M)后,才能运行。
2、基因芯片阅读图像分析软件ScanAlyze 2.44斯坦福的基因芯片基因芯片阅读软件,进行微矩阵荧光图像分析,包括半自动定义格栅与像素点分析。
输出为分隔的文本格式,可很容易地转化为任何数据库。
3、基因芯片数据分析软件Cluster斯坦福的对大量微矩阵数据组进行各种簇(Cluster)分析与其它各种处理的软件。
SAMSignificance Analysis of Microarrays 的缩写,微矩阵显著性分析软件,EXCEL软件的插件,由Stanford大学编制。
4.基因芯片聚类图形显示TreeView 1.5斯坦福开发的用来显示Cluster软件分析的图形化结果。
现已和Cluster成为了基因芯片处理的标准软件。
FreeView是基于JAVA语言的系统树生成软件,接收Cluster生成的数据,比Treeview增强了某些功能。
5.基因芯片引物设计Array Designer 2.00DNA微矩阵(microarray)软件,批量设计DNA和寡核苷酸引物工具常用分子生物学软件的入门介绍二、RNA二级结构。
RNA Structure 3.5RNA Sturcture 根据最小自由能原理,将Zuker的根据RNA一级序列预测RNA二级结构的算法在软件上实现。
预测所用的热力学数据是最近由Turner实验室获得。
提供了一些模块以扩展Zuker算法的能力,使之为一个界面友好的RNA折叠程序。
允许你同时打开多个数据处理窗口。
主窗口的工具条提供一些基本功能:打开文件、导入文件、关闭文件、设置程序参数、重排窗口、以及即时帮助和退出程序。
RNAdraw中一个非常非常重要的特征是鼠标右键菜单打开的菜单显示对鼠标当前所指向的对象/窗口可以使用的功能列表。
RNA文库(RNA Library)用一种容易操作的方式来组织你所有的RNA数据文件。
基本配置:Windows95,Windows98或WindowsNT。
Pentium以上芯片,32兆内存。
RNAdraw 是一个进行RNA二级结构计算的软件。
1. 它是Windows下的多文档窗口(multipledocument interface) 软件,允许你同时打开多个数据处理窗口。
主窗口的工具条提供一些基本功能:打开文件、导入文件、关闭文件、设置程序参数、重排窗口、以及即时帮助和退出程序。
2. RNAdraw中一个非常非常重要的特征是鼠标右键菜单打开的菜单显示对鼠标当前所指向的对象/窗口可以使用的功能列表。
3. RNA文库(RNA Library)用一种容易操作的方式来组织你所有的RNA数据文件。
loopDloop 2.07bJava语言写成的绘制RNA二级结构的软件,需要安装JAVA虚拟机。
Circles 0.1.0 Java语言写成的绘制RNA二级结构的软件,需要安装JAVA虚拟机。
三、序列综合分析Vector NTI Suite 8.0不喜欢装备各种专业性强的软件,而希望用一个综合性的软件代替的同志可以选择本软件。
本阶段的大部分功能它都有。
该软件具体特有良好的数据库管理(增加、修改、查找),对要操作的数据放在一个界面相同的数据库中统一管理。
软件中的大部分分析可以通过在数据库中进行选定(数据)->分析->结果(显示、保存和入库)三步完成。
在分析主界面,软件可以对核酸蛋白分子进行限制酶分析、结构域查找等多种分析和操作,生成重组分子策略和实验方法,进行限制酶片段的虚拟电泳,新建输入各种格式的分子数据、加以注释,输出高质量的图像。
Vector NTI Suite还有以下独立的分析程序,完成相关分析。
这些独立的程序,可以通过选定->分析->结果三步调用。
l 3DMol-显示PDB格式分子的三维结构l Align X-序列相似性比较l Align Xblocks-序列局部完全相同比较l ContigExpress-将小片段拼装成长序列l GCGConverter-GCG格式文件转换成NTI的格式l PubMed/Entrez Search-搜索PubMed、PDB、GenBankl Back Translation-核酸->蛋白->核酸反向翻译的工具l Matrix Editor-矩阵数据编辑l Tools Manager-连接其他程序和网络连接的界面。
分成Align、Analyze、Assemble、Tools 四部分。
常用分子生物学软件的入门介绍DNAStar5.03 即著名的Lasergene Suite,由EditSeq MegAlign、GeneQuest MapDraw PrimerSelect Protean SeqMan II七个模块组成,该软件的MegAlign模块,可以对多达64000的片段进行拼装。
整个拼装过程即时显示,并提示可能的完成时间。
拼装结果采用序列、策略等方式显示。
DNAstar是哈佛大学医学院是使用的序列分析软件,可见其功能强大。
Omiga 2.0实际上,大部分对核酸蛋白的序列分析功能,在Omiga 2.0中都能找到;而且界面非常友好。
Omiga作为强大的蛋白质、核酸分析软件,它还兼有引物设计的功能。
主要功能:编辑、浏览、蛋白质或核酸序列,分析序列组成。
用Clustal. W进行同源序列比较,发现同源区。
实现了核酸序列与其互补链之间的转化,序列的拷贝、删除、粘贴、置换以及转化为RNA链,以不同的读码框、遗传密码标准翻译成蛋白质序列。
查找核酸限制性酶切位点、基元(Motif)及开放阅读框(ORF),设计并评估PCR、测序引物。
查找蛋白质解蛋白位点(Proteolytic Sites)、基元、二级结构等。
查寻结果可以以图谱及表格的显示,表格设有多种分类显示形式。
利用Mange快捷键,用户可以向限制性内切酶、蛋白质或核酸基元、开放阅读框及蛋白位点等数据库中添加或移去某些信息。
每一数据库中都设有多种查寻参数,可供选择使用。
用户也可以添加、编辑或自定义某些查寻参数。
可从MacVectorTM、Wisconsin PackageTM等数据库中输入或输出序列。
另外,该软件还提供了一个很有特色的类似于核酸限制酶分析的蛋白分析,对蛋白进行有关的多肽酶处理后产生多肽片段。
DS gene : Omiga 2.0的换代产品,accelrys公司Discovery studio系列,accelrys公司的insight II,GCG是业内蛋白分析和核酸分析的权威软件,DS gene 是GCG的个人机简版,功能强大,而且可以直接与GCG服务器相连。
由于受到vector NTI的界面影响,DS gene 与Omiga 2.0相比界面有了很大的改变。
DNASIS for Windows 2.5版是日立软件公司(Hitachi Sofeware Engineering Co.,Ltd.)97年推出的一个功能强大的序列分析软件。
包含有大部分分子生物学软件的常用功能,可进行DNA,RNA,蛋白质序列的编辑和分析,甚至还能进行质粒作图、数据库查询等功能,足可满足一般实验室的要求。
在DOS时代,DNASIS 7等版本便是流传甚广并曾给过许多人以帮助的分子生物学软件,因此我们有理由期待Win版的DNASIS 会带给我们惊喜。
DNASIS MAX 1.0 DNASIS 2.5的更新换代产品。
综合序列分析软件,体积比上一个版本一下膨胀了许多。
界面风格也改变了很多。
DNATools 5.1 与Omiga, DNAsis, PCgene等软件属于同一类的综合性软件,操作简单功能多。
DNATools设计的用户友好、强壮,以便快速、方便地获取、贮藏和分析序列及数据库查询获得的序列相关信息。
DNATools包容性很好,能把几乎所有文本文件打开作为序列。
当程序不能辨别序列的格式时(通过寻找常用序列格式的特征),会显示这个文件的文本形式,以便你编辑生成正确的蛋白质或DNA序列,编辑后可以再被载入程序。
若你的序列是DNATools格式时(DNA或寡核苷酸序列),程序不加注解的载入序列,程序模式调整成可以接受载入的数据类型(蛋白质、DNA和寡核苷酸引物序列)。
在一个项目中可以加入几千个序列或引物,并在整个项目中分析这些序列及标题。
这个程序的一个特点是给每个序列或引物添加文本标题。
这样就可以用自定义的标题识别序列,而不必通过它们的文件名。
Bioedit一个具有序列简单分析和序列对比功能的软件。
该软件有一个简单亲切的界面,集成其他已经很有效果的序列比对软件。
另外该软件还有很多有用的相关站点连接。
虽然该软件看起来结构简单,但却又很强的可充性,可以自由整合许多软件,例如viewtree. Jellyfish 2.1 只水母不简单,可以用来进行DNA翻译,序列排队比较,限制酶消化,提交序列进行BLAST,研究项目管理等。
操作十分简单,只需拖动与点击便可。
常用分子生物学软件的入门介绍Genetools Genebio公司的核酸序列分析软件,虽然不及vect NTI 和DS gene 强大,它具有repeat /vect find 使其他分析软件所不具有的,值得一提的是该软件具有的CpG island分析。
DNAMAN 限制酶分析,引物设计,对排(aligment),翻译,数据库操作,Blast,序列装配(Sequence assembly).易学易用,操作方便。
四、限制酶切位点分析:DNAssist2.0大多软件只对线性序列进行分析,那么cNNNNN…NNNgaatt环状的序列就找不到EcoR I 的位点。
DNAssist 1.0能很容易把这个EcoR I位点找出来。
另外DNAssist在输出上非常完美,除了图形、线性显示外,还有类似DNASIS的列表方式,列出有的位点(按酶排列,按碱基顺序排列)。
五、质粒绘图:Gene Construction Kit 2.0这一个非常好的质粒构建软件包。