考研英语二图表作文写作方法和模板非常全有作用
- 格式:docx
- 大小:32.51 KB
- 文档页数:42
考研外语二作文万能模板一、图表作文。
开头段,描述图表内容,引出主题。
According to the chart/table, we can see that…。
As is shown in the diagram…。
The chart/table provides some interesting data/statistics about…。
The diagram illustrates the changes in…over the period from…to…。
The table shows the comparison between…in terms of…。
主体段1,分析数据变化原因。
There are several reasons accounting for this phenomenon. First and foremost,…。
Another contributing factor is that…。
Moreover, the rapid development of…also plays a significant role in…。
In addition, the change in…can be attributed to…。
主体段2,进一步分析数据变化原因。
Furthermore, it should be noted that…。
In addition, the improvement in…is another factor that leads to…。
Besides, the increase/decrease in…can be explained by the fact that…。
结尾段,总结图表内容,提出建议或展望未来。
In conclusion, from the above analysis, we can draw the conclusion that…。
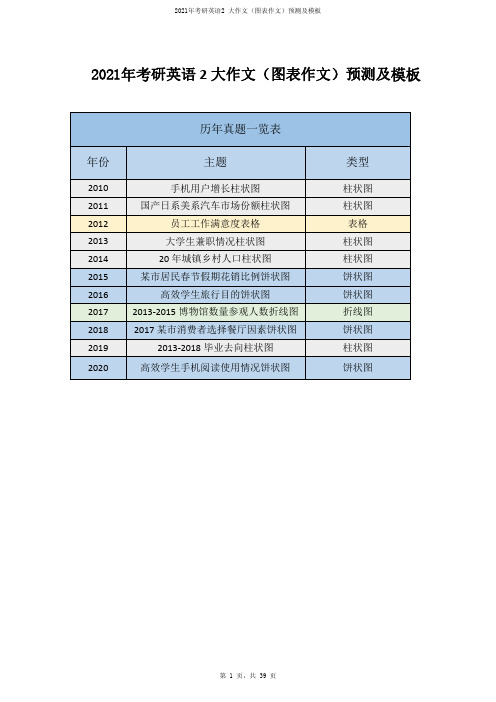
2021年考研英语2大作文(图表作文)预测及模板国产品牌日系品牌美系品牌2008年2009年40%35%30%25%20%15%10%5%0%..................................... 4 bilion 3 bilion2 bilion1 bilion 0Mobile-phone-subscriptions(2000-2008)满意不清楚不满意≤40岁16.7%50.0%33.3%41-50岁0.0%36.0%64.0%>50岁40.0%50.0%10.0%年龄组满意度2010年真题2012年真题某公司员工工作满意度调查2008年、2009年国内轿车市场部分品牌市场份额示意图2011年真题200020012002200320042005200620072008(year)百分比(%)1009080706050403020102013年真题20年间中国城镇人口、乡村人口变化图单位.(百万)城镇人口乡村人口9008007006005004003002001002014年真题2015年真题春节花销聚会吃饭20%其它20%交通20%新年礼物40%欣赏风景缓解压力交朋友培养独立能力其它某高校学生旅行目的调查2016年真题2013-2015年我国博物馆数量和参观人数1000080006000400020000博物馆数量(家)参观人数(十万人次)2017年真题2017年某市消费者选择餐厅关注的因素其它因素4.7%价格2018年真题某高校2013年、2018年毕业生去向80.0%70.0%60.0%50.0%40.0%30.3%20.0%10.0%0.0%2013年2018年某高校学生使用手机阅读目的学习打发时间浏览信息其它2019年真题2020年真题一、解题步骤:审题-->读图-->草稿-->写作-->检查step1:审题1)段落结构的要求?Describe the chart描述图表Interpret the meaning阐释意义Give your comments个人评论2)特殊要求与陷阱?example(s)/reason(s)give a specific example论证方式的要求/论证数量的要求Step2:读图1)图中文字说明:中文、英文2)图表分类:静态图?动态图?柱状图?饼状图?折线图?表格3)不同的图表本身就暗示了应该关注的分析点。

审题三事项:英文指令、数字信息、文字说明1.图表数据本质透析图表归类:折线图——curve/line graph本质变化:趋势柱状图——bar chart/column chart饼图——pie chart表格——table本质排序:对比组合图对比+趋势透析:固定时间段内,相同事物写变化;固定时间点,不同事物写对比或排序2.变化类词汇与句式1.数量单位Dozen/hundred/thousand/million/billion/trillion300——three hundred——hundreds of2.时间点/段In 1990/from 1990 to 1992/since 1990(has been)/after 1992/between 1990 and 1998/during the period from...to.../ten years=a decade3.上升:动词increase,rise(rose),climb,jump,go up,grow,ascend快速上升:surge,shoot(shot)up,boom,soar,leap上升:名词an increase to/by...,a rise,a growth,a jump,a surge,a boom,an upward trend inFrom 1977 to 1980,there was an upward trend in the number of birds.from120 million to the highest point/peak at approximately/about/some 127million.4.下降V.decrease,decline,descend,go down,fall,be reduced,drop,sink(sank),dip,shrink,diminish逐渐变小:dwindle剧烈下降:slump,plungen.a decrease,a decline,a fall,a drop,a slump in,a reduction in,a downward trend in变化程度:原则:形容词修饰名词副词修饰动词、形容词、副词、句子表快速剧烈/明显:sharp/sharply,rapidly,dramatically,drastic/drastically,considerably,remarkably,extremely,strikingly,substantially,enormously,exponentially,significantly,greatly,steeply。
2024考研英二作文万能模板一、图表作文。
Nowadays, with the rapid development of economy, the issue of X has aroused wide concern in the public. According to the chart/ graph/ table, it can be observed that X has been on the rise/ decline in recent years. Specifically, in 20XX, the number/ percentage of X reached the highest/ lowest point, which was X. However, in the following years, there was a sharp increase/ decrease, leading to a new figure of X. The reasons for this phenomenon can be explained as follows.To begin with, the primary cause of X is that X. For example, X. In addition, X. Furthermore, X. As a result, X. What's more, X. Last but not least, X. Therefore, X. Consequently, X.In conclusion, based on the above analysis, we can draw a conclusion that X. Therefore, it is of great importance to take effective measures to solve this problem. Only in this way can we X. As far as I am concerned, I believe that X. In this case, X. Only by doing so can we X.二、观点对比类作文。

考研英语二作文模板万能背诵在考研英语二作文中,模板是考生备考的重要工具之一。
良好的模板可以帮助考生在有限的时间内快速构思和完成一篇高质量的作文。
因此,许多考生都会花费大量的时间和精力来背诵各种作文模板。
下面将为大家介绍一些常用的考研英语二作文模板,供大家参考和背诵。
一、图表作文模板。
1. 开头段。
The bar chart provides the information about the changes in the percentage of something from 2000 to 2010.2. 主体段。
As is shown in the chart, the percentage of something increased/decreased steadily from 2000 to 2010. For example, in 2000, the percentage of something was 20%, and it rose to 40% in 2010.3. 结尾段。
In conclusion, the chart clearly demonstrates the changes in the percentage of something from 2000 to 2010. It is evident that the percentage of something has been on the rise/decline over the past decade.二、观点对比作文模板。
1. 开头段。
When it comes to the issue of something, people's opinions vary from person to person. Some people believe that something is beneficial, while others hold the opposite view.2. 主体段。

01考研英语作文概述Chapter考研英语作文的重要性考研英语作文的分数占比考察综合能力考研英语作文的评分标准内容切题表达清晰结构合理创新性和独特性历年考研英语作文真题回顾2022年考研英语作文题目2021年考研英语作文题目2020年考研英语作文题目2019年考研英语作文题目02折线图在考研英语作文中的应用Chapter折线图的基本构成和解读折线图的基本构成折线图的解读01020304分析图表谋篇布局确定主题语言表达折线图作文的写作步骤折线图作文的常用句型和词汇常用词汇upward trend 上升趋势downward trend 下降趋势fluctuations 波动peak 峰值trough 谷值03表格在考研英语作文中的应用Chapter表格的基本构成和解读01020304表格的标题表头数据注释和说明01020304认真阅读题目要求,明确写作目的和要点。
仔细审题仔细观察和分析表格中的数据和信息,找出变化和趋势。
分析表格根据题目要求和表格内容,构思文章的主题和结构。
构思文章按照构思好的框架,逐步展开论述,注意逻辑性和条理性。
撰写文章表格作文的写作步骤表示数据对比的句型In contrast, the number of...was much higher/lower than that of...By comparison, the percentage of...was significantly greater/lesser than...In conclusion, Overall,04写信在考研英语作文中的应用Chapter书信的基本格式和写作规范书信的格式写作规范在写作书信作文前,首先要明确写信的目的和对象,以便选择合适的语言和表达方式。
确定写信的目的和对象构思书信的内容撰写书信的正文检查和修改根据写信的目的和对象,构思书信的主题和内容,包括要传达的信息、表达的情感或观点等。
在撰写书信正文时,要注意段落的组织和语言的运用,确保内容清晰、连贯、有逻辑性。
考研英语(二)图表作文经典模板
来源:文都图书
考研英语(二)的大作文图表作文相对考研英语(一)来说是比较简单的,它有一些固定的用语和格式是考生们在考前可以进行速记和运用的。
在此给大家推荐全国知名考研英语辅导老师谭剑波的《考研英语(二)写作考前冲刺万用魔板》,相信会对大家有很大的帮助。
1.Crucial a.关键的;重要的
【单词记忆】词根cruc-来自cross(元音互换,c=s发音相同),-ial 形容词后缀。
Cross本意为“穿过”,也可表示“十字路口”,十字路口是一个很重要的转折点,因此用cross创造出crucial表示“重要”。
【同义替换】critical
【写作例句】doing sth. is crucial to doing sth.如Reading more books is crucial to accumulating knowledge.多读书对知识积累很重要。
2.Significant a.重要的
【单词记忆】sign“记号”,i无意,词根-fic“作”,-ant形容词后缀。
我们在读书的时候,总在重要的地方做记号,因此“做记号”表示“重要的”。
【同义替换】important
【写作例句】sth. is significant 或sth. is of great significance /importance某事想当重要
这本书针对图表作文进行了概述、题型讲解、万用魔板、范文点评和命题预测等五大方面的详细叙述,帮助考生一举拿下图表作文,除此之外,为了在短时间内提高大家的知识储备量,书中还附有图表作文高频核心100词、低端词汇的高端替换和图表作文的常用表达等,非常有用。
最后预祝大家考研顺利,加油!。
英语二大作文模板(图表)第一段:描述图表:第一句:简述图表;第二句:详细描述第一类:趋势类图表(如柱状图)As can be seen from the chart, there have been dramatic change in _________(关键词) for ___(A1人) over the past period from ______(开始年) to ______(终止年). To be concrete, for ______(A1人) there was a noticeable jump of ______(差值) from _______(数值1) to _______(数值2) between ________(具体年1) and _______(具体年2). By contrast, a remarkable decline occurred in the _____(A2人) by ______(差值)from _______(数值1) to _______(数值2) during the same period.第二类:饼状图The pie chart above vividly illustrates the percentage of _______(主题辞) in a certain ______(题干). From the statistics given we may draw the conclusion that the percentage of ____(A) is highest among all the ___(板块总数) categories,at nearly ______(数A%),whereas the data of B、C、D as well as others accounts for about _____(数B%)、_______(数C%)、_______(数D%)______(数其他%) respectively.第三类:表格——只描述极值Sticking to(=according to)the data given above, we may conclude that the percentage of people___(A) is highest among these h3, at about_______(数值). Meanwhile, the proportions of the personnel B are the same between h1 and h3, at about 50%. In contrast, the figure of C is about _____(数值), among those h2, the highest among all the these categories.第二段:描述缘故:1. 固定一句话:以下是缘故2. 缘故1+说明;缘故2+说明;缘故3+说明The fundamental factors that contribute to the aforementioned tendency may be summarized as blow. (以下是缘故)To start with, with the rapid development of economy and society. An army of individual/college students are becoming increasingly richer which presents the consequence of the phenomenon above. (缘故1+说明)In addition, the tendency has a tremendous relationship with the turning of folk‘s outlook and perspective on _________(主题类词1), that is to say, __________________(描述人们内心的具体转变),__________(主题类词2:人们以为没有以前重要的) is no longer as essential it used to be.(缘故2+说明)Last but not least, the changes are enhanced and promoted by the superior policy of the government in the ___________(主题辞) field. For instance, the government calls for attaching vital significance to _________(主题辞), bringing about the harmony of economic returns andsocial contribution.(缘故3+说明)第三段:总结+展望以后(方法)Judging from what are depicted above, a conclusion that (increasing) sign will be promoted can be drawn, due to the fact that it can be benefits and merits not only to characters but to the prosperity of the country.。
考研英语二作文第一篇:考研英语二作文考研英语二图表作文模板第一段(一升一降一不变,一缓慢)What a thought-provoking and illuminating chart it is!As is apparently depicted in the chart, it is obvious that(内容)soared from(数据)in(年份)to(数据)in(年份), While, as a sharp contrast,(内容)decreased from(数据)in(年份)to(数据)in (年份).In addition ,(内容)was almost the same in(年份)and (年份)./(there was only a slow increase from(数据)in(年份)to(数据)in(年份))第二段(解释具体原因)Why does this phenomenon revealed in the chart above appear? Several reasons accounting for the situation can be what follows.T o begin with ,I am strongly convinced that this is partly duo to the fact that(原因一), In addition, this is partly because,(原因二), Last but not least,this is partly because(原因三).Maybe there are some other reasons bring about this phenomenon.But it is generally believed that the above mentioned reasons are commonly acceptable.第三段(发表个人观点)From the analyses made above , we may come to the conclusion that(结论).I am sure my opinion is both sound and well-grounded.邀请信例一Dear________,There will a________________(内容)at/in________________(地点)on___________(时间).We would be honored to have you there with us.The occasion will start at___________(具体时间).This will be followed by a_______(进一步的安排).At around______(时间),____________________________(另一个安排).I really hope you can make it.RSVP before____________(通知你的最后期限).Yours sincerely Li Ming例二Dear_____________,①_____________(开门见山提出事件/活动、地点、时间).②It would be pleasant/honored to have you here.③Duringthepa rty/conference,wewillhavelotsofactivitiesyou willbeinterestedin.④First,____________(要举行的活动内容一).⑤Second,__________(要举行的活动内容二).⑥I know/believe that you will be very interested in_____________.⑦First/For one thing,_____________(受邀请人参加的理由一).⑧Second/For another,_____________(受邀请人参加的理由二).⑨The conference/party would not be complete without you!⑩The party/conference will begin at时间and we do hope you can come.Yours sincerelyLi Ming考研英语小作文模板之请求信例一Dear___________,I am writing to formally request to___________(请求的内容)There a son for______________ is that______________________________(给出原因).I________ ,so I___________________________________(给出细节)I would also like to request________________________(提出进一步的要求).I am sorry for any in convenience I have caused.Thankyouforyourattentiontotheserequests.Ifyouhaveany questions,donothesitatetocontactmeat____________(电话号码).I look forward to a favorable reply.YourssincerelyLiMing例二Dear_____________,①Iam_____________(介绍自己的身份).②Iwill/am_____________(与请求有关的自身现状).③I''dliketo_____________(阐明自己的请求).④Iwillappreciateyour_____________(有关该请求的详细信息).⑤I''mgoingto_____________(对方如能帮助实现请求,自己将要做些什么).⑥Herearethereasonswhy_____________(承上启下,开始解释原因)⑦Foronething,_____________(请求的原因一);Foranother,_____________(原因二).⑧Therefore,_____________(总结写信的目的).⑨Ishallbemuchobligedtoyouifyou_____________(对收信人的期望).⑩ThanksforyourkingconsiderationandIlookforwardtoreceivi ngyourearliestreply.YourssincerelyLiMing考研英语小作文模板之投诉信Dear_______,Iam_______________________.(自我介绍)IfeelbadtotroubleyoubutIamafraidthatIhavetomakeacomplainta bout_______.Thereasonformydissatisfactionis______________(总体介绍).Inthefirstplace,_________________________(抱怨的第一个方面).Inaddition,____________________________(抱怨的第二个方面).Underthesecircumstances,Ifindit___(感觉)to____________________________(抱怨的方面给你带来的后果).Iappreciateitverymuchifyoucould_______________________(提出建议和请求),preferably__________(进一步的要求),andIwouldliketohavethismattersettledby______(设定解决事情最后期限).ThankyouforyourconsiderationandIwillbelookingforwardto yourreply.YourssincerelyLiMing考研英语作文指之感谢信范文Directions:Whileyourfamilywasonvacation,yourfriend,Cathyl ookedafteryourdog,smart.Nowyoucameback,writealettertoherto showyourgratitude.Yourlettershouldbenolessthan100words.You don'tneedtowritetheaddress.Don'tsignyourownnameattheendof theletter,useEmilyinstead.DearCathy,Iamwritingtoexpressourheartfeltthanksfortakinggoodcareofsma rtwhilewewereonholiday.Hewassuchahappydogwhenwegothom e;weknewhemusthavehadlotsoflovingattention.Whenweusedtop ickupfromthekennelhewouldwhimperandcarryonforhours.Youno tonlysavedussomemoney,youalsosparedustheworryofhowhewas doingwhilewewereaway.Yourkindhelpisverymuchappreciated,no tonlybysmart,butalsobyourwholefamilyaswell.Yourstruly,Emily 译文我写信是要谢谢在我们度假期间你帮助我们照顾小狗。
2023考研英语二小作文解析及范文1500字2023年考研英语二小作文预计为图表作文或者提纲作文。
下面我将为你解析一下这两种作文的写作方法,并附上一篇范文供参考。
1. 图表作文图表作文通常包括柱状图、折线图、饼图等,考察学生对图表的理解和描述能力。
写作时,首先要仔细阅读图表,并梳理出其中的关键信息。
接下来,可以按照以下步骤进行写作:a. 描述图表的基本信息:包括图表的类型、主题、时间跨度等。
b. 突出重要数据:选择图表中的关键数据进行描述,可以使用比较级、绝对值、百分比等表达方式。
c. 分析数据之间的关系:分析数据之间的趋势、相对大小、相互关联等。
d. 提出结论或观点:根据图表的信息,总结出结论或者发表自己的观点。
2. 提纲作文提纲作文通常以一篇文章的主题为基础,要求学生根据提供的提纲写作。
写作时,首先要理解提纲的要求,确定文章的结构和内容。
接下来,可以按照以下步骤进行写作:a. 确定主题:根据提纲确定主题,并将其明确表达出来。
b. 展开论述:按照提纲的要求逐条展开论述,注意论点的逻辑性和连贯性。
c. 举例或者论证:可以使用事例、数据、引用名人观点等方式进行论证和举例。
d. 给出结论:在文章的结尾给出自己的总结和观点。
以下是一篇范文,供参考:Direction: Write an essay based on the outline below. Your essay should be about 150 words.Outline:1. 一方面,手机应用带来了许多便利;2. 另一方面,手机应用也引发了一些社会问题;3. 我的观点。
Mobile Applications: Convenience and Social ProblemsWith the development of mobile technology, mobile applications have become an indispensable part of our daily life. On one hand, mobile applications have brought us great convenience. We can use them to book flight tickets or hotels, order food online, and even pay for our purchases. With just a few taps on our smartphones, we can complete tasks that used to take us much more time and effort.On the other hand, the popularity of mobile applications has also brought about some social problems. For example, some people have become addicted to mobile games and spend too much time on them, neglecting their work and relationships. Also, the security of personal information has become a concern, as some applications may collect users' personal data without their knowledge or consent.In my opinion, while mobile applications provide us with great convenience, we should also be aware of their potential negative impacts. We need to use mobile applications in a responsible and balanced way, so that we can make the best use of them without being overwhelmed by their drawbacks.以上就是2023年考研英语二小作文解析和范文,希望对你有所帮助。
考研英语二_图表作文写作方法和模板图表作文一第一节图表作文的类型图表作文可分为两大类:表作文和图作文;表作文表格Table可以使大量数据系统化,便于阅读、比较;表格常由标题Title、表头Boxhead表格的第一行、侧目Stub表格左边的第一列和主体Body 部分表格的其余部分等部分组成;如下表:用表格表达的信息具体准确,而且表格中的各项均按一定规律排列;阅读表格时要注意找出表格中各个项目的相互关系,表格中各个项目的变化规律;例如,上面的表格中的数字说明,和1978年相比,1983年大学入学的人数在增加,而小学的入学人数在减少;搞清楚这些变化规律也就读懂了表格的内容;图作文图作文又可分为三种:圆形图作文、曲线图作文和条状图作文;1 圆形图作文圆形图Pie chart也称为饼状图或圆面分割图;圆形图因为比较形象和直观,各部分空间大小差别容易分辨,所以常用来表示总量和各分量之间的百分比关系;整个圆表示总量,楔形块表示分量;有时圆形图还有数值表,两者结合可把各分量表示得更准确、清楚;例如:This is a pie chart of the average weekly expenditure of a family in Great Britain. As can be see from the chart, the main expenditureof an average British family is spent on food, which accounts for 25% of its total expenditure. The next two significant expending items are transport and housing, which are 15% and 12% respectively. If we take into account clothing and footwear, which makes up 10%, the four essentials of life, that is, food, transport, housing, and clothing and footwear, amount to 62% of the total expenditure.2 曲线图作文曲线图Line graph也称为线性图或坐标图;曲线图最适合表示两个变量之间关系的发展过程和趋势;一般来说,曲线所呈现的形状比某一点所代表的变量的值更有意义;曲线图有横轴和纵轴;一般先看横轴所代表的数量或时间等,然后再看纵轴所显示的意义;同时必须找出线条所反映的最高或最低的变化;例如:这个曲线图的横轴代表1990年的不同的月份,纵轴代表交通事故的数量;从交通事故曲线图上可知,前八个月的交通事故的数量有升有降;曲线图在八月份升到了最高点39,此后一直呈下降的趋势,十二月份降到了最低点16;可见,1990年的交通事故的数量总体上呈下降的趋势;3 条形图作文条形图Bar graph也称为立柱图或圆柱图;条形图由宽度相同但长度不同的条块代表不同的量;当要比较几个项目或量时,常用不同颜色来区分;条形图主要用来表示:1同一项目在不同时间的量;2同一时间不同项目的量;阅读条形图时,要先看图例,再看横轴、纵横各代表什么量,每一个刻度所代表的值是多少,最后找出图中各长条所表示的数据及各长条间的相互关系;例如:左边的条形图的横轴代表时间,纵轴代表期望寿命Life Expectancy,这一条形图想要体现的是同一项目期望寿命在不同时间的量;右边的条形图的横轴也是代表时间,纵轴是代表婴儿的死亡率Infant Mortality,这一条形图想要体现的也是同一项目婴儿的死亡率在不同时间的量;左边的条形图表明1990年的人均期望寿命比1960年的人均期望寿命长20岁,而1990年的婴儿死亡率比1960年的婴儿死亡率下降了50%;第二节图表作文的出题形式例1 题目:Changes in People’s DietStudy the following table carefully and your composition must be based on the information given in the table. Write three paragraphs to :1. state the changes in people’s diet 饮食in the past five years;2. give possible reasons for the changes;3. draw your own conclusions.You should quote as few figures as possible.例2 题目:Car Accidents Declining in Walton CityRemember that your composition must be written according to the following outline;1. Rise and fall of the rate of car accidents as indicated by the graph;2. Possible reasons for the decline of car accidents in the city;3. Your predictions of what will happen this year.Your composition should be no less than 120 words and you should quote as few figures as possible.例3 For this part, you are allowed 30 minutes to write a composition on the topic Health Gain in Developing Countries. Your composition must be no less than 120 words and you should base your composition on the following instructions given in Chinese:1. 以下图为依据描述发展中国家的期望寿命life expectancy和婴儿死亡率infant mortality的变化情况2. 说明引起变化的各种原因从以上例子可见,图表作文一般在题目中给出作文的标题和一个或几个统计表格、圆形图、曲线图或条形图,有时还用英文或中文提纲的形式给出提示,要求我们:1用文字描述图表,客观解释图表中所传递的信息,并找出某种规律或趋势;2就图表中所反映的某种趋势或问题分析其原因或后果;第三节图表作文的写作要领图表作文着重说明事实,常常是通过对图表中所反映的具体数据的说明、分析、比较,对某种事物或现象的事实或变化情况等加以说明,并提出结论或看法;因此,图表作文常常采用议论文体的写作方法;写好图表作文,关键在于能否读懂图表中所提供的信息,把握各信息间的联系,用准确流畅的语言把这一信息表达出来,并就这一信息发表自己的看法;图表作文的写作步骤写图表作文时,要注意遵循以下步骤:1认真分析图表的含义,弄清图表中所含的信息及不同信息间的关系;2确定文章的主题思想,构思出文章的基本框架,筛选出能说明图表主题思想的典型数据;3编列文章的提纲;4根据文章的提纲,将各段的提纲内容扩展成段落,然后将各个段落组成文章,注意段与段之间的衔接与过渡;5检查与修改;图表作文的篇章结构写图表作文时,常采用三段式的谋篇方式;文章的第一段往往分析图表中的数据变化反映什么问题或趋势,概述图表所揭示的信息;第二段分析造成这一问题或趋势的原因;第三段则展望未来的情况或提出解决问题的办法或建议;这一结构可以简单地表述为:第一段:概述图表反映的主题思想第二段:分析产生的原因第三段:展望未来或提出方法或建议图表作文常用的句型1常用的开篇句型即概述图表内容时常用的表达法①According to the table/pie chart/line graph/bar graph, we can see/conclude that …根据该表/图,我们可知……②The table/graph reveals shows/indicates/illustrates/ represents/points out that …该表/图表明……③As we can see from the table …As can be seen from the line/bar graph …As is shown illustrated/indicated in the pie chart …如表/图所示,……2 描述增减变化常用的句型①Compared with …is still increased by …②The number of …grew/rose from …to …③An increase is shown in …; then came a sharp increase of …④In …the number remains the same/drops to …⑤There was a very slight small/slow/gradual rise/increase in 1990.⑥There was a very steady marked/sharp/rapid/sudden/ dramatic drop decrease/ decline/ fall/ reduction in 1998/ compared with that of last year.下面是根据例2的题目要求写的范文;⑴From the graph, we can see that the number of car accidents in Walton city fluctuated during the year of 1990. ⑵The first two months of 1990 showed an increasing trend. ⑶The rate rose to 32 in March but fell to 26 in June. ⑷From June on, the rate was rising again and reached the peak point 39 in August. ⑸After August the rate began to decline remarkably, and eventually dropped to the lowest poin t 16 at the end of the year. ⑹Therefore, it’s obvious thatcar accident in Walton city declined in 1990.⑴主题句/概述表格反映的内容⑵—5反映交通事故的变化情况6小结:总结表格数据反映的总趋势⑺There are several reasons for the decline. ⑻First, a new traffic law was made and came into force. ⑼It provided that in summer every car must be air-conditioned. ⑽As a result, the highest rate in August, when humidity and high temperature make drivers impatient and easily lead to car accidents, dropped steadily. ⑾Second, new roads were built and some narrow streets were widened, which quickened the flow of traffic. ⑿Finally, the city administration made great efforts to heighten people’s awareness of observing traffic rules.⑺主题句⑻原因/措施一⑼解释措施一/次要辅助⑽采取措施一后的结果⑾原因/措施二⑿原因/措施三⒀With all these new measures, I’m sure the rate of car accidents in Walton city will go on falling this year.⒀总结:展望未来的情况第四节、图表作文练习及其参考范文下面是写作练习,在写作的过程中注意审题,考虑文章的结构、采用的扩展方法、开头的结尾的方法以及文章中的过渡等;练习1:Directions: For this part, you are allowed thirty minutes to write a composition of no less than 120 words on Changes in People’s Diet. Study the following table carefully and your composition must be based on the information given in the table. Write three paragraphs to:1. state the changes in people’s diet 饮食in the past five years;2. give possible reasons for the changes;3. draw your own conclusions.You should quote as few figures as possible.⑴As is shown in the table, there have been great changes in people's diet between 1986 and 1990. ⑵From the table, we can find that grain, formerly the main food of most Chinese people, is now playing a less important role in people's diet. ⑶And the same goes for fruit and vegetables. ⑷On the other hand, the consumption of high-nutrition food such milk and meat has increased rapidly.⑸What has caused these changes There are mainly three reasons 主题句. 6 First, people are much wealthier than before. 7 With higher income, they can afford to buy nutritious foods. 8 Second, people have realized the importance of a balanced diet to their health. 9 Lack of certain amount of meat or milk, for example, will result in poor health. 10 Finally, owing to the economic reform, meat and milk, which were scarce in the past, are produced in large quantities.11 Although milk and meat are important to one's health, eating too much rich food may result in obesity and may other diseases. 12Therefore, people should not only eat a lot of milk and meat, but also enough grain, fruit and vegetable for the sake of their health.图表作文二一、图表作文写作常识1、图形种类及概述法:泛指一份数据图表:a data graph/chart/diagram/illustration/table 饼图:pie chart直方图或柱形图:bar chart / histogram趋势曲线图:line chart / curve diagram表格图:table流程图或过程图:flow chart / sequence diagram程序图:processing/procedures diagram2、常用的描述用法The table/chart diagram/graph shows thatAccording to the table/chart diagram/graphAs is shown in the table/chart diagram/graphAs can be seen from the table/chart/diagram/graph/figures,figures/statistics shows that……It can be seen from the figures/statisticsWe can see from the figures/statisticsIt is clear from the figures/statisticsIt is apparent from the figures/statisticstable/chart/diagram/graph figures that ……table/chart/diagram/graph shows/describes/illustrates how……3、图表中的数据Data具体表达法数据Data在某一个时间段固定不变:fixed in time在一系列的时间段中转变:changes over time持续变化的data在不同情况下:增加:increase / raise / rise / go up ……减少:decrease / grow down / drop / fall ……波动:fluctuate / rebound / undulate / wave ……稳定:remain stable / stabilize / level off ……最常用的两种表达法:动词+副词形式Verb+Adverb form形容词+名词形式Adjective+Noun form二、相关常用词组1、主章开头图表类型:table、chart、diagramgraph、column chart、pie graph描述:show、describe、illustrate、can be seen from、clear、apparent、reveal、represent内容:figure、statistic、number、percentage、proportion2、表示数据变化的单词或者词组rapid/rapidly 迅速的,飞快的,险峻的dramatic/dramatically 戏剧性的,生动的significant/significantly 有意义的,重大的,重要的sharp/sharply 锐利的,明显的,急剧的steep/steeply 急剧升降的steady/steadily 稳固的,坚定不移的gradual/gradually 渐进的,逐渐的slow/slowly 缓慢的,不活跃的slight/slightly 轻微的、略微地stable/stably 稳定的3、其它在描述中的常用到的词significant changes 图中一些较大变化noticeable trend 明显趋势during the same period 在同一时期grow/grew 增长distribute 分布,区别unequally 不相等地in the case of adv. 在……的情况下in terms of / in respect of / regarding 在……方面in contrast 相反,大不相同government policy 政府政策market forces 市场规率measure n.尺寸,方法,措施v.估量,调节forecast n.先见,预见v.预测三、英语图表写作套句精选table shows the changes in the number of……over the periodfrom……to……该表格描述了在……年之……年间……数量的变化;bar chart illustrates that……该柱状图展示了……graph provides some interesting data regarding……该图为我们提供了有关……有趣数据;diagram shows that……该图向我们展示了……pie graph depicts that……该圆形图揭示了……is a cure graph which describes the trend of……这个曲线图描述了……的趋势;figures/statistics show that……数据字表明……tree diagram reveals how……该树型图向我们揭示了如何……data/statistics show that……该数据字可以这样理解……data/statistics/figures lead us to the conclusion that……这些数据资料令我们得出结论……is shown/demonstrated/exhibited in the diagram/graph/chart/table…如图所示…to the chart/figures……根据这些表数字……is shown in the table……如表格所示……can be seen from the diagram,great changes have taken place in……从图中可以看出,……发生了巨大变化;the table/chart/diagram/figure,we can see clearly that……or it isclear/apparent from the chart that……从图表我们可以很清楚明显看到……is a graph which illustrates……这个图表向我们展示了……table shows the changing proportion of a & b from……to……该表格描述了……年到……年间a与b的比例关系;graph,presented in a pie chart, shows the general trend in……该图以圆形图形式描述了……总的趋势;is a column chart showing……这是个柱型图,描述了……can be seen from the graph,the two curves show the fluctuation of……如图所示,两条曲线描述了……的波动情况;the period from…to…the…remained level. 在…至…期间,…基本不变;the year between……and……在……年到……期间……the 3 years spanning from 1995 through 1998……1995年至1998三年里……then on/from this time onwards……从那时起……number of……remained steady/stable from month/year to month/year;……月年至……月年……的数量基本不变;number sharply went up to……数字急剧上升至……percentage of…stayed the same between…and……至…期间…的比率维持不变;figures peaked at……inmonth/year……的数目在……月年达到顶点,为……percentage remained steady at……比率维持在……percentage of…is slightly larger/smaller than that of比例比…的比例略高低;is not a great deal of difference between……and………与……的区别不大;graphs show a threefold increase in the number of……该图表表明……的数目增长了三倍;33……decreased year by year while……increased steadily.……逐年减少,而……逐步上升;situation reached a peaka high point at of%.……的情况局势到达顶高点,为……百分点;figures/situation bottomed out in……数字情况在……达到底部;figures reached the bottom/a low point/hit a trough.数字情况达到底部低谷;is ……times as much/many as b. a是b的……倍;increased by……a增长了……increased to……a增长到……low/great/small/ percentage. 比低高低is an upward trend in the number of…………数字呈上升趋势;considerable increase/decrease occurred from……to………到……发生急剧上升;……to……the rate of decrease slow down. 从……到……,下降速率减慢;this year on,there was a gradual declinel reduction in the……,reaching a figure of……从这年起,……逐渐下降至……similar to……与……相似the same as……与……相同are a lot similarities/differences between……and…………与……之间有许多相似不同之处has something in common with b a于b有共同之处;difference between a and b lies in……a与b之间的差别在于……50……yearwitnessed/saw a sharp rise in…………年……急剧上升开头段转述题目常用句型The line graph describes/ illustrates/ demonstrates/ summarizes/ outlines/ shows…后面跟名词或者从句开头段或者主体段引出数据或者趋势常用句型According to/ As shown in/ As can be seen from…后面跟图表的类型It can be seen from …后面跟图表的类型…thatIt is manifest from…后面跟图表的类型…that表示上升的动词Go upwent up /riserose/ growgrew/ increaseincreased/ ascendascended , 其中rise和increase 也经常作名词, grow-growth表示急剧上升的动词Jumpjumped/ surgesurged/shoot up shot up/ soarsoared 其中surge 也可以做名词表示下降的动词Decline/ fall/ drop/ sink/ dip/ decrease/ descend, 其中decline/ fall/ drop/ decrease也经常做名词表示急剧下降的动词Plummet/ plunge表示速度快的形容词Sharp/ dramatic/ drastic/ rapid/precipitous/steep 副词加-ly表示幅度大的形容词Marked/ substantial / significant, 副词加-ly表示缓慢,逐渐的形容词Gradual/ steady/ gentle / slow, 副词加-ly表示小幅度的形容词Modest/ moderate/ slight, 副词加-ly表示波动的动词Fluctuate, 不及物动词,名词fluctuation表示稳定在一个水平上的动词Level off at/ level out at/ hover at/ stabilize at/ reached a plateau at 表示达到最高的动词Peak at/ reach the highest point at , peak 也可以做名词表示达到最低的动词Reach the bottom at/ the lowest point at/ bottom out at, bottom 也可以做名词表示经历了某种变化的及物动词Experience/ witness/ see表示达到了多少数量的及物动词或词组Reach/arrive at/ amount to / hit/ register/ stand at表示占…后面跟百分数或数字的及物动词或词组Account for/ represent / constitute / make up表示数据由某几个部分组成的既无动词或者词组A is composed of/comprise/ is made up of/ consists of B,C and D. 注意和include 区别表示对未来数字的预测的及物动词Project/ predict / forecast表示"分别"的副词Respectively—in the 2004 Olympics, China and Russia won X and Ygold medalsrespectively.表示"大约"的副词或者词组About, around, approximately, roughly, just over, just under图表作文三作文1DIRECTIONS: A. Study the following graphs carefully and write an essay in at least 150 words. B. Your essay must be written clearly on the ANSWER SHEET II. C. Your essay should cover these three points:1. effect of the country’s growing human population on its wildlife2. possible reason for the effect3. your suggestion for wildlife protection段落类型分析第一段第二段第三段图画/图表描述段原因阐释段建议措施段参考范文一From these graphs, we can draw a conclusion that, with the growth of human population, the number of species has decreased rapidly in America, and some species have even vanished from our planet. There are numerous reasons accounting for the phenomenon and I would like to explore a few of the most important ones here. Above all, as the human population grows rapidly, a growing number ofpeople came to live where some wild species have been living. Then these species have to move to other places. Some of them probably can not adapt to the new environment and die. In addition, although many people look on the wildlife as their friends, some people may not think so. They catch a lot of wild animals and sell them in order to get more money. Consequently, the natural balance and the ecologic environment are destroyed. The clear cutting has become increasingly serious. So some of the wildlife become homeless and extinct.In order to protect the wildlife, I have some suggestions. First, the governments should make laws to prevent them from being caught and killed. Second, the governments should educate people to love nature and protect it. Third, as for ourselves, we should take practical actions to protect our living environment. 210 words参考范文二The two charts show that the increase in the . population has been accompanied by a corresponding decline in the number of wildlife species. Far too many species have been lost already. This poses a danger to the ecological balance.As the human population expands, wild animals in mounting numbers are hunted for food, or because they are thought to present a threat to man. But studies show that one of the primary causes ofthe disappearance of wildlife is pollution, which is one of the consequences of population growth and economic development. This makes us wonder if men are able to share this planet in harmony with other life forms.In my opinion, it is imperative for us to take steps to reverse the disturbing trend illustrated in the charts. One measure would be to forbid the building of cities in areas where wild life is threatened with extinction. But, more importantly, men must learn to stop polluting the environment, or he himself will be extinct. 167 words参考范文三As is seen from the two graphs, it is clear that with the rapid growth of . population from 1800 to 1990, the number of its wildlife species no longer existing soared during the same period. Naturally, we can draw the conclusion that the sharp decline of wildlife species resulted from the population growth.Several reasons may account for this phenomenon. To begin with, as the population grows, people consume much more natural resources. Second, with the increase of human activities, modern people take up more and more space which exerts a great influence on other species. Finally, the problem of pollution becomes more and more serious with the development of modern industry. More and more animals have to adapt themselves to the decaying environment ormove to a totally different place, but not all of them are fortunate enough to survive the changes.Solving this problem calls for, above all, the government’s efforts to control population growth, to decrease industrial pollution and to enhance the laws to forbid wildlife hunting. Moreover, common citizens should be aware of this ecological crisis and take on the responsibility of wildlife protection. In a word, only when the government and the common people make joint efforts can we hope to find a satisfactory solution to this problem. 216 words作文2图略The line graph illustrates how the number of people using a London underground station fluctuates over the course of 16 hours 6am to 10pm. As we can see from the graph, at 6am the number of people at the station stands at only 100. The number shoots up over the next two hours, peaking at 400 at 8am. Then the number descends drastically for two hours, bottoming out at 180 at 10am. The period between 10o'clock and 12o'clock witnesses a moderate growth in the number of people in the station, with the number reaching 280 at midday. Numbers in the following two hours stabilize at just under 300 people. Then the number plummets to only 100 from 2pm to 4pm. Then the next two hours see a dramatic rise again, with 6pm registering 380 people. After 6pm, the number dips again,reaching the lowest point of 130 at 8pm. The period from 8pm to 10pm experiences a slight rise, but then the number of people declines again from 180 at 9pm to 135 at 10pm. This line graph clearly demonstrates that rush hours in the early morning and the early evening are periods when the station is used by the most people.作文3The diagram illustrates in four stages the recovery of the forests in Yellowstone National Park after a devastating forest fire. In the first picture, while the old forests still exist, they drop bad wood to the soil under them, which renders the soil more fertile. Then lightning and fire strike, destroying the forests completely. And the growth of new forests starts right at this point. The second picture demonstrates that in the first 50 years after the devastating fire, saplings grow in build while descend in overall number. In the next two centuries, the young trees continue to thrive in Yellowstone, because of the fertile soil and the ample sunlight. Then, three hundred years after the fire, the number of trees decline to roughly the same as the old forests. These five pictures show us that it takes as long as three centuries for a destroyed forest to fully recover. Further, they vividly explain to us the natural law of "survival of the fittest". The number of trees that a region can support is not limitless, which means the forests on earthwill not be an inexhaustible resource.作文4The table below gives information about changes in modes of travel in England between 1985 and the information by selecting and reporting the main features, and make comparisons where relevant.范文1The table indicates the number of miles by the average English person in 1985 and 2000, using various means of transport.The number of miles walked, cycled and travelled by local bus all decreased. Of these, the number of miles travelled by local bus decreased the most, from 429 miles in 1985 to 274 miles in 2000. The number of miles travelled by car, long distance bus, train and taxi all increased. The number of miles driven by car was 3,199 in 1985 and rose by 50% to 4,806 in 2000. The number of miles travelled by long distance bus more than doubled from 54 miles 1985to 124 miles 2000. The number of miles driven by taxi trebled from 13 miles 1985 to 42 miles 2000. The use of other, unspecified, forms of transport also increased.Overall, the number of miles travelled by the average English person rose from 4,740 miles in 1985 to 6,475 miles in 2000, with the increase of cars accounting for almost all of that increase. 173 words范文2The table demonstrates how different modes of travel changed in England in 15 years spanning from 1985 to 2000. In general, the modes are classified into two kinds in terms of average miles travelled per person per year: one enjoyed rising popularity while the other decreasing.The travel modes which gained popularity in the period included cars, long distance buses, trains, taxis and others. Cars remained top among the modes in the 15 years, with its average miles increasing considerably from 3,199 in 1985 to 4,806 in 2000. Long distance buses and taxis seemed to be warmly welcomed by travelers, so average miles travelled in the two modes almost tripled.Travels by walking, bicycles and local buses lost travelers’favor in the one and a half decade. Average travelling distance by local buses suffered the biggest decrease, dropping from 429 to 274, whilst the number of miles by walking and bikes fell mildly from 255 to 237 and from 51 to 41 respectively. Despite the decreases, however, the total miles travelled grew from 4,740 to 6,475.In brief, the total travelling distance in the country grew in 15 years when cars, long distance buses, trains, taxis and other modes of travel were more popular and walking, bicycling and localtransportation less popular. 212 words作文5Directions: For this part, you are allowed 30 minutes to write a composition of no less than 100 words on Income Sources between Chinese and American Students. Study the following table carefully and your composition must be based on the in formation given in the table. Write three paragraphs to:1. Describe the differences of the income sources between Chinese and American students.2. Analyze possible reasons for these differences.3. Predicate future tendency.Source of income Percentage of Total Income_________________________________________________________________________ _____Parents Part-time job Fellowship or ScholarshipAmerican students 50% 35% 15%Chinese students 90% 5% 5%_________________________________________________________________________ ______范文: Income Sources Between Chinese Students and American StudentsIncome sources of Chinese students are quite different from those of American students. In China, students get 90% of their money from their parents while in America, only 50% of students` money is provided by parents. In addition, Chinese students earn only 5% of their money from part time jobs and 5% from fellowship or scholarship while income from these two resources for American students takes up 35% and 15% respectively of their total income.I think there are probably three reasons for their differences. First, because of the influence of different social and family values, Chinese students have formed the habit of asking for money from their parents while American students have developed more sense of being financially independent. Second, most Chinese parents devote too much care to their children and they would rather save up to afford their children’s education rather than encourage them to take part-time jobs. But in America, many parents pay more attention to developing the students ability of self-reliance, so they encourage their children to find part-time job to earn some money by themselves. Third, since America is more developed than China, it is relatively easy for students to find part-time jobs. In China, such opportunities are rather rare.I believe with the development of China, more and more Chinese students will realize and pay more attention to the necessity of self-dependence. In addition, more and more opportunities will be provided for them to take part-time jobs. So more students will go out of the ivory tower to broaden their knowledge and to become the master of their own lives.作文6For this part, you are allowed thirty minutes to write a composition on the topic: Student Use of Computers. You should write at least 120 words, and base your composition on the chart and the outline given below:1.上图所示为1990年、1995年、2000年某大学生使用计算机的情况,请描述其变化;2.请说明发生这些变化的原因可从计算机的用途、价格或社会发展等方面加以说明;3.你认为目前大学生在计算机使用中有什么困难或问题;范文: Student Use of Computer Since 1990, there has been tremendous growth in the use of computers by students. While in 1990, the average number of hours a student spent on the computer was about one hour per week, this number grew to nearly four hours per week by 1995, and to approximately 20 hours per week by the year 2000.This significant growth in the use of computers by students in the 1990’s can be attributed to several factors, including widespread usage, lower prices, and technological and social developments. Nowadays, computers are widely used by students for word processing, book keeping, multimedia presentations, and access to the Internet for both research and communications. Additionally, since 1990, due to competition and technological advances, computer hardware and software prices, as well as Internet usage charges have dropped significantly. Finally, technological developments and changes in social habits in the 1990’s have played a major role in this tremendous growth in the use of computers. Today’s society relies heavily on computers for immediate access to the news and for entertainment, including, listening to music, watching movies and sport events, and playing computer games. While computers are of great assistance to the students, and therefore, are indispensable tools, they also pose some challenges. The biggest challenge that many students face is discipline in the use of this powerful device. That is, students need to have the discipline of not allowing themselves to be lured by the entertaining aspects of this wonderful tool—aspects that can result in addiction to computer games or viewing of undesirable material on the Internet. That is to say, students need to use this powerful tool with great wisdom作文7The graphs below show the age structure of a European country from 1901 to 1981 and a prediction for 2021. Summarize the information by selecting and reporting the main features, and make comparisons where relevant. You should write at least 150 words. Sample AnswerThe graphs compare the population makeup of one European country every forty years from 1901 to 1981, and the estimated number in 2021. There was a huge increase in the number of people in this country from 38,225,000 in 1901 to 67,180,000 eighty years later, and this upward trend is expected to last through to the year 2021, when the population is estimated at 87,658,000, more than double the 1901 figure.In 1901 and 1941, the population structure in this country was completely the same, with an overwhelming majority of its population 95% below 65, 4% between65 and 85 and only 1% over 85 years old.However, the year 1981 sawa sharp increase in the percentage of the elderly. Altogether, they made up 17% of the total population, whereas the projection for the year 2021 shows that they will continue to grow but less dramatically to 20% of the total population 15% for 65-85-year-olds and 5% for over-85-year-olds. In summary, changes are taking place not only in the number of people but also in the ages of the people who make up the population in this European country, indicating it is advancing。