ipmitool工具常用命令汇总
- 格式:doc
- 大小:35.02 KB
- 文档页数:21

ipmitool用法
ipmitool是一款用于管理IPMI(智能平台管理接口)设备的命令行工具,它支持多种操作,下面是部分常用用法:
- raw:发送一个原始的IPMI请求,并且打印回复信息。
- lan:配置网络(lan)信道。
- chassis:查看底盘的状态和配置电源。
- event:向BMC发送一个已定义的事件,可用于测试配置的SNMP是否成功。
- mc:查看MC(Management Contollor)状态和各种允许的项。
- sdr:打印传感器仓库中的任何监控项和从传感器读取到的值。
- sensor:打印周详的传感器信息。
- fru:打印内建的Field Replaceable Unit (FRU)信息。
- sel:打印 System Event Log (SEL)。
- pef:配置 Platform Event Filtering (PEF),事件过滤平台用于在监控系统发现有event时候,用PEF中的策略进行事件过滤,然后看是否需要报警。
- sol/isol:用于配置通过串口的Lan进行监控。
- user:配置BMC中用户的信息。
你可以根据实际需求选择相应的命令参数并根据提示输入相关参数,以实现对IPMI设备的管理和维护。
如果你还需要了解其他用法,可以继续向我提问。
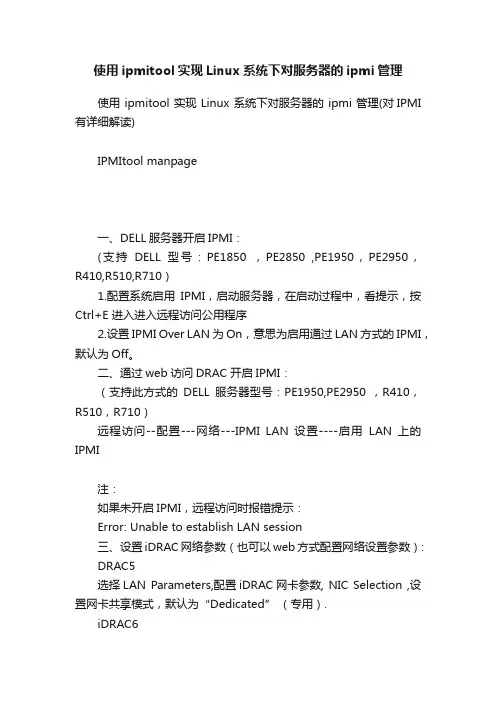
使用ipmitool实现Linux系统下对服务器的ipmi管理使用 ipmitool 实现 Linux 系统下对服务器的 ipmi 管理(对IPMI 有详细解读)IPMItool manpage一、DELL服务器开启IPMI:(支持DELL型号:PE1850 ,PE2850 ,PE1950,PE2950,R410,R510,R710)1.配置系统启用IPMI,启动服务器,在启动过程中,看提示,按Ctrl+E 进入进入远程访问公用程序2.设置IPMI Over LAN为On,意思为启用通过LAN方式的IPMI,默认为Off。
二、通过web访问DRAC 开启IPMI:(支持此方式的DELL服务器型号:PE1950,PE2950 ,R410,R510,R710)远程访问--配置---网络---IPMI LAN 设置----启用LAN 上的IPMI注:如果未开启IPMI,远程访问时报错提示:Error: Unable to establish LAN session三、设置iDRAC网络参数(也可以web方式配置网络设置参数):DRAC5选择LAN Parameters,配置iDRAC网卡参数, NIC Selection ,设置网卡共享模式,默认为“Dedicated” (专用).iDRAC6选择LAN Parameters, 可以配置iDRAC网络参数与NIC Selection, 默认为“Dedicated” (专用).注:LAN 共享依赖于“NIC Selection”(NIC 选择)配置选项。
可用选项有“Shared”(共享)和“Failover”(故障转移),如果存在Remote Access Controller (RAC)卡,则还有一个选项“Dedicated” (专用)。
显示配置选项。
* “Shared”(共享)选择此选项与主机操作系统共享网络接口。
当主机操作系统配置为 NIC 组时,远程访问设备网络接口具有全部功能。
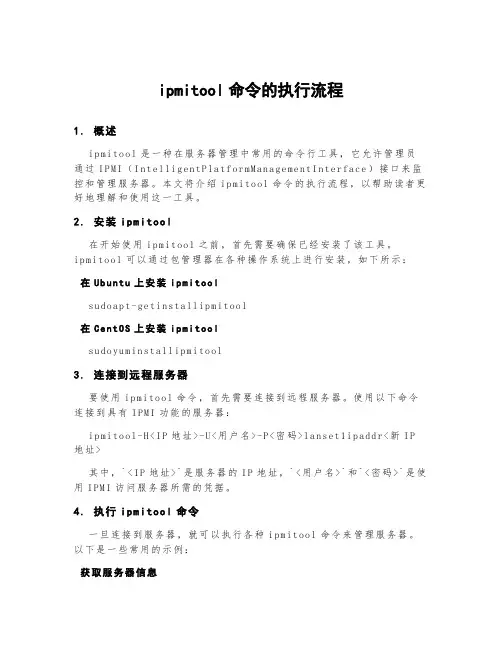
ipmitool命令的执行流程1.概述i p mi to ol是一种在服务器管理中常用的命令行工具,它允许管理员通过IP MI(I nt el li g en tP la tf or mM ana g em en tI nt er fa ce)接口来监控和管理服务器。
本文将介绍ip mi to ol命令的执行流程,以帮助读者更好地理解和使用这一工具。
2.安装ipm itool在开始使用i pm it oo l之前,首先需要确保已经安装了该工具。
i p mi to ol可以通过包管理器在各种操作系统上进行安装,如下所示:在U b u n t u上安装i p m i t o o ls u do ap t-ge ti ns tal l ip mi to ol在C e n t O S上安装i p m i t o o ls u do yu mi ns ta ll ipm i to ol3.连接到远程服务器要使用i pm it oo l命令,首先需要连接到远程服务器。
使用以下命令连接到具有I PM I功能的服务器:i p mi to ol-H<I P地址>-U<用户名>-P<密码>l an se t1ip add r<新IP地址>其中,`<I P地址>`是服务器的I P地址,`<用户名>`和`<密码>`是使用I PM I访问服务器所需的凭据。
4.执行ipm itool命令一旦连接到服务器,就可以执行各种i pmi t oo l命令来管理服务器。
以下是一些常用的示例:获取服务器信息i p mi to ol fr u此命令将显示服务器的F RU(F ie ld Re pla c ea bl eU ni t)信息,包括制造商、型号和序列号等。
重启服务器i p mi to ol po we rr ese t此命令将重新启动服务器。
监控传感器数据i p mi to ol se ns or此命令将显示服务器上各种传感器的当前状态,如温度、电压、风扇速度等。

ipmitool 中文帮助文档Name(名字)Ipmitool ——对于控制支持IPMI的设备有效.Synopsis(概要)ipmitool [-c|-h|-v|-V] -I open <command>ipmitool [-c|-h|-v|-V] -I lan -H <hostname>[-p <port>][-U <username>][-A <authtype>][-L <privlvl>][-a|-E|-P|-f <password>][-o <oemtype>]<command>ipmitool [-c|-h|-v|-V] -I lanplus -H <hostname>[-p <port>][-U <username>][-L <privlvl>][-a|-E|-P|-f <password>][-o <oemtype>][-C <ciphersuite>]<command>Description(描述)这个程序能够使你通过一个kernel设备驱动或者一个远程系统,利用IPMI v1.5或IPMIv2.0 来管理本地系统的任何一个智能平台管理接口(IPMI)功能。
这些功能包括打印FRU(现场可替换装置)信息、LAN 配置、传感器读数、以及远程机架电源控制。
一个本地系统接口的IPMI管理功能需要一个兼容IPMI的kernel驱动程序被安装以及配置。
在linux中,这个驱动叫做OpenIPMI,他被包括在了标准化分配中。
在Solaris系统中,这个驱动叫做BMC,他被包括在了Solaris 10中。
远程控制的管理需要授权以及配置IPMI-over-LAN接口。
根据每个系统独特的需要,它可以通过系统接口来使LAN接口使用ipmitool。
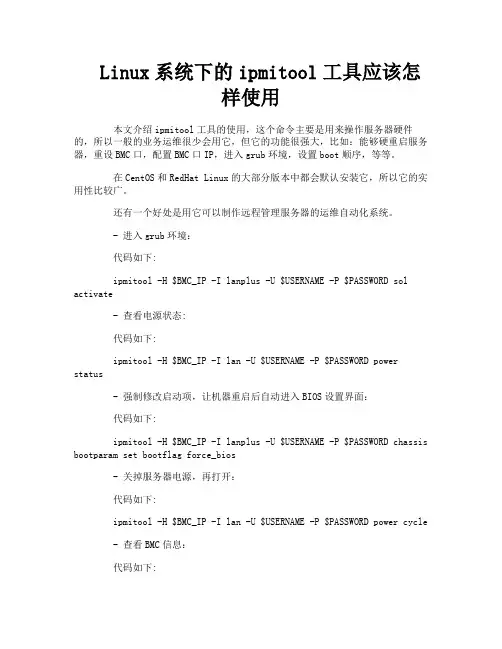
Linux系统下的ipmitool工具应该怎样使用本文介绍ipmitool工具的使用,这个命令主要是用来操作服务器硬件的,所以一般的业务运维很少会用它,但它的功能很强大,比如:能够硬重启服务器,重设BMC口,配置BMC口IP,进入grub环境,设置boot顺序,等等。
在CentOS和RedHat Linux的大部分版本中都会默认安装它,所以它的实用性比较广。
还有一个好处是用它可以制作远程管理服务器的运维自动化系统。
- 进入grub环境:代码如下:ipmitool -H $BMC_IP -I lanplus -U $USERNAME -P $PASSWORD sol activate- 查看电源状态:代码如下:ipmitool -H $BMC_IP -I lan -U $USERNAME -P $PASSWORD power status- 强制修改启动项,让机器重启后自动进入BIOS设置界面:代码如下:ipmitool -H $BMC_IP -I lanplus -U $USERNAME -P $PASSWORD chassis bootparam set bootflag force_bios- 关掉服务器电源,再打开:代码如下:ipmitool -H $BMC_IP -I lan -U $USERNAME -P $PASSWORD power cycle- 查看BMC信息:代码如下:ipmitool -H $BMC_IP -I lan -U $USERNAME -P $PASSWORD mc info- 显示lan的信息:代码如下:ipmitool -H $BMC_IP -I lan -U $USERNAME -P $PASSWORD lan printIpmitool �CI open sensor list命令可以获取传感器中的各种监测值和该值的监测阈值,包括(CPU温度,电压,风扇转速,电源调制模块温度,电源电压等信息)Ipmitool �CI open sensor get “CPU0Temp”可以获取ID为CPU0Temp 监测值,CPU0Temp是sensor的ID,服务器不同,ID表示也不同。

ipmitool bmc reset和mc reset摘要:1.IPMItool 和bmc reset 的介绍2.mc reset 的功能和应用3.IPMItool bmc reset 和mc reset 的异同正文:一、IPMItool 和bmc reset 的介绍IPMItool 是一个用于管理和配置基于IPMI(Intelligent Platform Management Interface)的服务器的开源工具。
它可以实现远程开关机、读取传感器数据、配置事件日志等功能,为数据中心管理员提供了便捷的管理手段。
bmc reset(基板管理控制器重置)是一种通过IPMItool 发送的命令,用于重置服务器的基板管理控制器(BMC)。
当服务器出现故障时,可以通过bmc reset 命令恢复BMC 的正常工作。
二、mc reset 的功能和应用mc reset(内存控制器重置)是IPMItool 提供的另一个命令,用于重置服务器的内存控制器。
在服务器运行过程中,内存控制器可能出现故障,导致系统崩溃或无法正常启动。
此时,可以使用mc reset 命令来恢复内存控制器的正常工作。
mc reset 命令的应用场景包括:服务器启动时出现内存错误、服务器运行过程中出现内存故障等。
通过使用mc reset 命令,可以快速地解决内存控制器相关的问题,提高服务器的稳定性和可靠性。
三、IPMItool bmc reset 和mc reset 的异同1.相同点:- 都是基于IPMItool 的命令,用于管理和配置服务器。
- 都可以用于恢复服务器硬件设备的正常工作,提高服务器的稳定性和可靠性。
2.不同点:- bmc reset 命令用于重置服务器的基板管理控制器(BMC),而mc reset 命令用于重置服务器的内存控制器。
- bmc reset 命令主要解决BMC 相关的问题,如BMC 失去响应、BMC 设置错误等;而mc reset 命令主要解决内存控制器相关的问题,如内存错误、内存故障等。
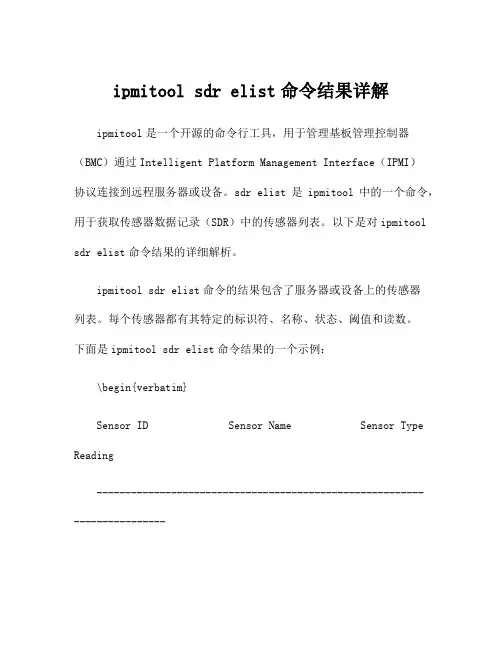
ipmitool sdr elist命令结果详解ipmitool是一个开源的命令行工具,用于管理基板管理控制器(BMC)通过Intelligent Platform Management Interface(IPMI)协议连接到远程服务器或设备。
sdr elist是ipmitool中的一个命令,用于获取传感器数据记录(SDR)中的传感器列表。
以下是对ipmitoolsdr elist命令结果的详细解析。
ipmitool sdr elist命令的结果包含了服务器或设备上的传感器列表。
每个传感器都有其特定的标识符、名称、状态、阈值和读数。
下面是ipmitool sdr elist命令结果的一个示例:\begin{verbatim}Sensor ID Sensor Name Sensor Type Reading-------------------------------------------------------------------------01 XX Sensor 1 Temperature 40 degrees C02 XX Sensor 2 Voltage 1.2 Volts03 XX Sensor 3 Current 5.0 Amps\end{verbatim}在这个示例中,命令结果的第一列是传感器的标识符(SensorID),它用于唯一标识每个传感器。
第二列是传感器的名称(Sensor Name),它描述了传感器所监测的物理量或参数。
第三列是传感器的类型(Sensor Type),它指示了传感器所监测的是温度、电压、电流等。
第四列是传感器的读数(Reading),它显示了传感器当前的测量值。
对于每个传感器,命令结果还可以包括状态信息和阈值信息。
状态信息描述了传感器是否正常工作,是否出现异常或错误。
阈值信息定义了传感器的上限和下限,用于设置警告或报警。
除了基本的传感器信息,ipmitool sdr elist命令的结果还可能包含其他信息,如设备的序列号、版本号、制造商等。

ipmitool工具常用命令汇总目录1、工具得安装 (2)2、命令得help (2)3、查瞧管理口得IP地址 (5)4、管理底盘chassis配置 (6)4、1查瞧底盘配置汇总 (6)4、2管理电源 (7)4、3管理时间间隔 (7)4、4管理电源恢复策略 (8)4、5查瞧上次重启原因 (8)4、6查询上电时间 (8)4、7管理启动项 (8)4、8设置启动项得参数 (9)5、使用delloem进行管理 (10)5、1配置lcd (10)5、2查瞧MAC地址 (11)5、3设置lan得模式 (12)5、4设置背板led得状态 (13)5、5管理电源监控 (13)6、查瞧传感器数据sensor (14)6、1查瞧当前系统所有得传感器数据 (14)6、2设置传感器得告警阈值 (14)6、3查瞧某一传感器得状态信息 (15)6、4查瞧某一个传感器得当前值 (16)7、管理传感器仓库sdr (16)7、1查瞧传感器仓库中得信息列表 (17)7、2查瞧传感器得类型与指定类型得数据 (18)7、3查瞧指定传感器得配置信息 (20)7、4查瞧传感器仓库sdr得配置信息 (21)8、查瞧系统事件sel日志 (22)8、1查瞧sel得状态信息 (22)8、2查瞧sel得中得日志信息 (22)1、工具得安装yum install -y OpenIPMI ipmitool开启服务/etc/init、d/ipmi status/etc/init、d/ipmi start[root@cell83 ~]# ipmitool -Vipmitool version 1、8、182、命令得help明细得命令参考man ipmitool或者附件ipmitool、help[root@cell83 ~]# ipmitool -hipmitool version 1、8、18usage: ipmitool [options、、、] <mand>-h This help-V Show version information-v Verbose (can use multiple times)-c Display output in ma separated format-d N Specify a /dev/ipmiN device to use (default=0) -I intf Interface to use-H hostname Remote host name for LAN interface-p port Remote RMCP port [default=623]-U username Remote session username-f file Read remote session password from file-z size Change Size of munication Channel (OEM)-S sdr Use local remote SDR cache-D tty:b[:s] Specify the serial device, baud rate to useand, optionally, specify that interface is the system one -4 Use only IPv4-6 Use only IPv6-a Prompt for remote password-Y Prompt for the Kg key for IPMIv2 authentication-e char Set SOL escape character-C ciphersuite Cipher suite to be used by lanplus interface-k key Use Kg key for IPMIv2 authentication-y hex_key Use hexadecimal-encoded Kg key for IPMIv2 authentication -L level Remote session privilege level [default=ADMINISTRATOR] Append a '+' to use name/privilege lookup in RAKP1-A authtype Force use of auth type NONE, PASSWORD, MD2, MD5 or OEM -P password Remote session password-E Read password from IPMI_PASSWORD environment variable -K Read kgkey from IPMI_KGKEY environment variable-m address Set local IPMB address-b channel Set destination channel for bridged request-t address Bridge request to remote target address-B channel Set transit channel for bridged request (dual bridge) -T address Set transit address for bridge request (dual bridge) -l lun Set destination lun for raw mands-o oemtype Setup for OEM (use 'list' to see available OEM types) -O seloem Use OEM SEL event descriptions-N seconds Specify timeout for lan [default=2] / lanplus [default=1] interface-R retry Set the number of retries for lan/lanplus interface [default=4]Interfaces:open Linux OpenIPMI Interface [default]imb Intel IMB Interfacelan IPMI v1、5 LAN Interfacelanplus IPMI v2、0 RMCP+ LAN Interfaceserial-terminal Serial Interface, Terminal Modeserial-basic Serial Interface, Basic Modeusb IPMI USB Interface(OEM Interface for AMI Devices)mands:raw Send a RAW IPMI request and print responsei2c Send an I2C Master Write-Read mand and print responsespd Print SPD info from remote I2C devicelan Configure LAN Channelschassis Get chassis status and set power statepower Shortcut to chassis power mandsevent Send pre-defined events to MCmc Management Controller status and global enablessdr Print Sensor Data Repository entries and readingssensor Print detailed sensor informationfru Print built-in FRU and scan SDR for FRU locatorsgendev Read/Write Device associated with Generic Device locators sdrsel Print System Event Log (SEL)pef Configure Platform Event Filtering (PEF)sol Configure and connect IPMIv2、0 Serial-over-LANtsol Configure and connect with Tyan IPMIv1、5 Serial-over-LANisol Configure IPMIv1、5 Serial-over-LANuser Configure Management Controller userschannel Configure Management Controller channelssession Print session informationdcmi Data Center Management Interfacenm Node Manager Interfacesunoem OEM mands for Sun serverskontronoem OEM mands for Kontron devicespicmg Run a PICMG/ATCA extended cmdfwum Update IPMC using Kontron OEM Firmware Update Manager firewall Configure Firmware Firewalldelloem OEM mands for Dell systemsshell Launch interactive IPMI shellexec Run list of mands from fileset Set runtime variable for shell and exechpm Update HPM ponents using PICMG HPM、1 fileekanalyzer run FRU-Ekeying analyzer using FRU filesime Update Intel Manageability Engine Firmwarevita Run a VITA 46、11 extended cmdlan6 Configure IPv6 LAN Channels3、查瞧管理口得IP地址[root@cell83 ~]# ipmitool -I open lan print[root@cell83 ~]# ipmitool -I open lan print | grep IPIP Address Source : Static AddressIP Address : 192、168、0、133IP Header : TTL=0x40 Flags=0x40 Precedence=0x00 TOS=0x10 Default Gateway IP : 192、168、0、1Backup Gateway IP : 0、0、0、04、管理底盘chassis配置[root@cell83 ~]# ipmitool -I open chassis helpChassis mands: status, power, identify, policy, restart_cause, poh, bootdev, bootparam, selftest4、1查瞧底盘配置汇总[root@cell83 ~]# ipmitool -I open chassis statusSystem Power : onPower Overload : falsePower Interlock : inactiveMain Power Fault : falsePower Control Fault : falsePower Restore Policy : previousLast Power Event :Chassis Intrusion : inactiveFront-Panel Lockout : inactiveDrive Fault : falseCooling/Fan Fault : falseSleep Button Disable : not allowedDiag Button Disable : allowedReset Button Disable : not allowedPower Button Disable : allowedSleep Button Disabled: falseDiag Button Disabled : trueReset Button Disabled: falsePower Button Disabled: false4、2管理电源查瞧当前电源状态[root@cell83 ~]# ipmitool -I open chassis power status Chassis Power is on打开电源ipmitool -I open chassis power on关闭电源ipmitool -I open chassis power off重启电源ipmitool -I open chassis power cycle重置电源ipmitool -I open chassis power reset其她配置ipmitool -I open chassis power diagipmitool -I open chassis power soft4、3管理时间间隔查询时间间隔:[root@cell83 ~]# ipmitool -I open chassis identify Chassis identify interval: default (15 seconds)设置时间间隔:[root@cell83 ~]# ipmitool -I open chassis identify help chassis identify <interval>default is 15 seconds0 to turn offforce to turn on indefinitely4、4管理电源恢复策略[root@cell83 ~]# ipmitool -I open chassis policy helpchassis policy <state>list : return supported policiesalways-on : turn on when power is restoredprevious : return to previous state when power is restored always-off : stay off after power is restored4、5查瞧上次重启原因[root@cell83 ~]# ipmitool -I open chassis restart_causeSystem restart cause: unknown4、6查询上电时间[root@cell83 ~]# ipmitool -I open chassis pohGet Chassis Power-On-Hours failed: Invalid mand4、7管理启动项[root@cell83 ~]# ipmitool -I open chassis bootdev helpbootdev <device> [clear-cmos=yes|no]bootdev <device> [options=help,、、、]none : Do not change boot device orderpxe : Force PXE bootdisk : Force boot from default Hard-drivesafe : Force boot from default Hard-drive, request Safe Modediag : Force boot from Diagnostic Partitioncdrom : Force boot from CD/DVDbios : Force boot into BIOS Setupfloppy: Force boot from Floppy/primary removable media4、8设置启动项得参数[root@cell83 ~]# ipmitool -I open chassis bootparam helpbootparam get <param #>bootparam set bootflag <device> [options=、、、]Legal devices are:none : No overrideforce_pxe : Force PXE bootforce_disk : Force boot from default Hard-driveforce_safe : Force boot from default Hard-drive, request Safe Modeforce_diag : Force boot from Diagnostic Partitionforce_cdrom : Force boot from CD/DVDforce_bios : Force boot into BIOS SetupLegal options are:help : print this messagePEF : Clear valid bit on reset/power cycle cause by PEFtimeout : Automatically clear boot flag valid bit on timeoutwatchdog: Clear valid bit on reset/power cycle cause by watchdogreset : Clear valid bit on push button reset/soft resetpower : Clear valid bit on power up via power push button or wake event Any Option may be prepended with no- to invert sense of operation5、使用delloem进行管理查瞧帮助[root@cell83 ~]# ipmitool -I open delloem helpusage: delloem <mand> [option、、、]mands:lcdmaclansetledpowermonitorvFlashFor help on individual mands type:delloem <mand> help5、1配置lcd[root@cell83 ~]# ipmitool -I open delloem lcd helpGeneric DELL HW:lcd set {none}|{default}|{custom <text>}Set LCD text displayed during non-fault conditionsiDRAC 11g or iDRAC 12g or iDRAC 13g :lcd set {mode}|{lcdqualifier}|{errordisplay}Allows you to set the LCD mode and user-defined string、lcd set mode {none}|{modelname}|{ipv4address}|{macaddress}|{systemname}|{servicetag}|{ipv6address}|{ambienttemp}{systemwatt }|{assettag}|{userdefined}<text>Allows you to set the LCD display mode to any of the precedingparameterslcd set lcdqualifier {watt}|{btuphr}|{celsius}|{fahrenheit}Allows you to set the unit for the system ambient temperature mode、lcd set errordisplay {sel}|{simple}Allows you to set the error display、lcd infoShow LCD text that is displayed during non-fault conditionslcd set vkvm{active}|{inactive}Set vKVM active and inactive, message will be displayed on lcdwhen vKVM is active and vKVM session is in progresslcd set frontpanelaccess {viewandmodify}|{viewonly}|{disabled}Set LCD mode to view and modify, view only or disabledlcd statusShow LCD Status for vKVM display<active|inactive>and Front Panel access mode {viewandmodify}|{viewonly}|{disabled}5、2查瞧MAC地址[root@cell83 ~]# ipmitool -I open delloem mac helpmac listLists the MAC address of LOMsmac get <NIC number>Shows the MAC address of specified LOM、 0-7 System LOM, 8- DRAC/iDRAC、[root@cell83 ~]# ipmitool -I open delloem mac listSystem LOMsNIC Number MAC Address Status0 b8:2a:72:db:56:2a Enabled1 b8:2a:72:db:56:2b Enabled2 b8:2a:72:db:56:28 Enabled3 b8:2a:72:db:56:29 EnablediDRAC7 MAC Address b0:83:fe:c9:6d:315、3设置lan得模式[root@cell83 ~]# ipmitool -I open delloem lan helplan set <Mode>sets the NIC Selection Mode :on iDRAC12g OR iDRAC13g :dedicated, shared with lom1, shared with lom2,shared with lom3,sharedwith lom4,shared with failover lom1,shared with failover lom2,sharedwith failover lom3,shared with failover lom4,shared with Failover allloms, shared with Failover None)、on other systems :dedicated, shared, shared with failover lom2,shared with Failover all loms、lan geton iDRAC12g or iDRAC13g :returns the current NIC Selection Mode (dedicated, shared with lom1, sharedwith lom2, shared with lom3, shared with lom4,shared with failover lom1,shared with failover lom2,shared with failover lom3,shared with failoverlom4,shared with Failover all loms,shared with Failover None)、on other systems :dedicated, shared, shared with failover,lom2, shared with Failover all loms、lan get activereturns the current active NIC (dedicated, LOM1, LOM2, LOM3, LOM4)、5、4设置背板led得状态[root@cell83 ~]# ipmitool -I open delloem setled helpsetled <b:d、f> <state、、>Set backplane LED stateb:d、f = PCI Bus:Device、Function of drive (lspci format)state = present|online|hotspare|identify|rebuilding|fault|predict|critical|failed5、5管理电源监控[root@cell83 ~]# ipmitool -I open delloem powermonitor helppowermonitorShows power tracking statisticspowermonitor clear cumulativepowerReset cumulative power readingpowermonitor clear peakpowerReset peak power readingpowermonitor powerconsumptionDisplays power consumption in <watt|btuphr>powermonitor powerconsumptionhistory <watt|btuphr>Displays power consumption historypowermonitor getpowerbudgetDisplays power cap in <watt|btuphr>powermonitor setpowerbudget <val><watt|btuphr|percent>Allows user to set the power cap in <watt|BTU/hr|percentage> powermonitor enablepowercapTo enable set power cappowermonitor disablepowercapTo disable set power cap6、查瞧传感器数据sensor[root@cell83 ~]# ipmitool -I open sensor helpSensor mands: list thresh get reading6、1查瞧当前系统所有得传感器数据[root@cell83 ~]# ipmitool -I open sensor list6、2设置传感器得告警阈值[root@cell83 ~]# ipmitool -I open sensor thresh helpsensor thresh <id> <threshold> <setting>id : name of the sensor for which threshold is to be set threshold : which threshold to setunr = upper non-recoverableucr = upper criticalunc = upper non-criticallnc = lower non-criticallcr = lower criticallnr = lower non-recoverablesetting : the value to set the threshold tosensor thresh <id> lower <lnr> <lcr> <lnc>Set all lower thresholds at the same time sensor thresh <id> upper <unc> <ucr> <unr>Set all upper thresholds at the same time6、3查瞧某一传感器得状态信息[root@cell83 ~]# ipmitool -I open sensor get help sensor get <id> 、、、 [id]id : name of desired sensor查瞧温度传感器[root@cell83 ~]# ipmitool -I open sensor get Temp Locating sensor record、、、Sensor ID : Temp (0xe)Entity ID : 3、1Sensor Type (Threshold) : TemperatureSensor Reading : 48 (+/- 1) degrees CStatus : okLower Non-Recoverable : naLower Critical : 3、000Lower Non-Critical : 8、000Upper Non-Critical : 79、000Upper Critical : 84、000Upper Non-Recoverable : naPositive Hysteresis : 1、000Negative Hysteresis : 1、000Assertion Events :Assertions Enabled :6、4查瞧某一个传感器得当前值[root@cell83 ~]# ipmitool -I open sensor reading helpsensor reading <id> 、、、 [id]id : name of desired sensor查瞧温度传感器[root@cell83 ~]# ipmitool -I open sensor reading TempTemp | 477、管理传感器仓库sdr[root@cell83 ~]# ipmitool -I open sdr helpusage: sdr <mand> [options]list | elist [option]all All SDR Recordsfull Full Sensor Recordpact pact Sensor Recordevent Event-Only Sensor Recordmcloc Management Controller Locator Recordfru FRU Locator Recordgeneric Generic Device Locator Recordtype [option]<Sensor_Type> Retrieve the state of specified sensor、 Sensor_Type can be specified either asa string or a hex value、list Get a list of available sensor typesget <Sensor_ID>Retrieve state of the first sensor matched by Sensor_IDinfoDisplay information about the repository itselfentity <Entity_ID>[、<Instance_ID>]Display all sensors associated with an entitydump <file>Dump raw SDR data to a filefill <option>sensors Creates the SDR repository for the current configurationnosat Creates the SDR repository for the current configuration, without satellite scanfile <file> Load SDR repository from a filerange <range> Load SDR repository from a provided list or range、 Use ',' for list or '-' forrange, eg、 0x28,0x32,0x40-0x447、1查瞧传感器仓库中得信息列表[root@cell83 ~]# ipmitool -I open sdr elist helpusage: sdr elist [all|full|pact|event|mcloc|fru|generic]=>查瞧仓库中所有得信息:elist与list得格式内容上略有不同[root@cell83 ~]# ipmitool -I open sdr elist all[root@cell83 ~]# ipmitool -I open sdr list all=>查瞧传感器得数据[root@cell83 ~]# ipmitool -I open sdr elist fullFan1 RPM | 30h | ok | 7、1 | 6240 RPMFan2 RPM | 31h | ok | 7、1 | 6240 RPMFan3 RPM | 32h | ok | 7、1 | 6240 RPMFan4 RPM | 33h | ok | 7、1 | 6120 RPMFan5 RPM | 34h | ok | 7、1 | 6240 RPMFan6 RPM | 35h | ok | 7、1 | 6240 RPMInlet Temp | 04h | ok | 7、1 | 35 degrees CExhaust Temp | 01h | ok | 7、1 | 40 degrees CTemp | 0Eh | ok | 3、1 | 47 degrees CTemp | 0Fh | ok | 3、2 | 46 degrees CCurrent 1 | 6Ah | ok | 10、1 | 0、80 AmpsCurrent 2 | 6Bh | ns | 10、2 | No ReadingVoltage 1 | 6Ch | ok | 10、1 | 236 VoltsVoltage 2 | 6Dh | ns | 10、2 | No ReadingPwr Consumption | 77h | ok | 7、1 | 168 Watts说明:Fan ----表示风扇Inlet Temp ----进口温度Exhaust Temp ----出口温度Temp ----CPU得温度Current --电流Voltage ---电压Pwr Consumption ----功率7、2查瞧传感器得类型与指定类型得数据查瞧传感器有哪些类型[root@cell83 ~]# ipmitool -I open sdr type listSensor Types:Temperature (0x01) Voltage (0x02) Current (0x03) Fan (0x04)Physical Security (0x05) Platform Security (0x06) Processor (0x07) Power Supply (0x08) Power Unit (0x09) Cooling Device (0x0a) Other (0x0b) Memory (0x0c) Drive Slot / Bay (0x0d) POST Memory Resize (0x0e) System Firmwares (0x0f) Event Logging Disabled (0x10) Watchdog1 (0x11) System Event (0x12) Critical Interrupt (0x13) Button (0x14) Module / Board (0x15) Microcontroller (0x16) Add-in Card (0x17) Chassis (0x18) Chip Set (0x19) Other FRU (0x1a) Cable / Interconnect (0x1b) Terminator (0x1c) System Boot Initiated (0x1d) Boot Error (0x1e) OS Boot (0x1f) OS Critical Stop (0x20) Slot / Connector (0x21) System ACPI Power State (0x22) Watchdog2 (0x23) Platform Alert (0x24) Entity Presence (0x25) Monitor ASIC (0x26) LAN (0x27) Management Subsys Health (0x28) Battery (0x29) Session Audit (0x2a) Version Change (0x2b) FRU State (0x2c) 查瞧指定传感器得数据如查瞧温度:[root@cell83 ~]# ipmitool -I open sdr type TemperatureInlet Temp | 04h | ok | 7、1 | 35 degrees CExhaust Temp | 01h | ok | 7、1 | 40 degrees CTemp | 0Eh | ok | 3、1 | 46 degrees CTemp | 0Fh | ok | 3、2 | 47 degrees C如查瞧电源得个数1:有一个电源[root@cell83 dvd]# ipmitool -I open sdr type "Power Supply"PS Redundancy | 74h | ns | 7、1 | No ReadingStatus | 62h | ok | 10、1 | Presence detectedStatus | 63h | ns | 10、2 | Disabled如查瞧电源得个数2:有四个电源[root@db04 ~]# ipmitool -I open sdr type "Power Supply"PS Redundancy | 74h | ok | 7、1 | Redundancy LostStatus | 62h | ok | 10、1 | Presence detectedStatus | 63h | ok | 10、2 | Presence detected, Power Supply AC lostStatus | 52h | ok | 10、3 | Presence detected, Config Error, Power Supply InactiveStatus | 53h | ok | 10、4 | Presence detected, Config Error, Power Supply Inactive7、3查瞧指定传感器得配置信息[root@cell83 ~]# ipmitool -I open sdr get TempSensor ID : Temp (0xe)Entity ID : 3、1 (Processor)Sensor Type (Threshold) : Temperature (0x01)Sensor Reading : 47 (+/- 1) degrees CStatus : okNominal Reading : 23、000Normal Minimum : 11、000Normal Maximum : 69、000Upper critical : 83、000Upper non-critical : 77、000Lower critical : 3、000Lower non-critical : 8、000Positive Hysteresis : 1、000Negative Hysteresis : 1、000Minimum sensor range : UnspecifiedMaximum sensor range : UnspecifiedEvent Message Control : Per-thresholdReadable Thresholds : No ThresholdsSettable Thresholds : No ThresholdsAssertion Events :Assertions Enabled :7、4查瞧传感器仓库sdr得配置信息[root@cell83 ~]# ipmitool -I open sdr infoSDR Version : 0x51Record Count : 170Free Space : 1836 bytesMost recent Addition : 02/07/2106 06:28:15 Most recent Erase : 02/07/2106 06:28:15 SDR overflow : noSDR Repository Update Support : modalDelete SDR supported : noPartial Add SDR supported : noReserve SDR repository supported : yesSDR Repository Alloc info supported : no8、查瞧系统事件sel日志[root@cell83 ~]# ipmitool -I open sel helpSEL mands: info clear delete list elist get add time save readraw writeraw interpret8、1查瞧sel得状态信息[root@cell83 ~]# ipmitool -I open sel info helpSEL InformationVersion : 1、5 (v1、5, v2 pliant)Entries : 740Free Space : 4544 bytesPercent Used : 72%Last Add Time : 08/27/2018 08:48:29Last Del Time : 09/13/2014 11:16:12Overflow : falseSupported Cmds : 'Reserve'8、2查瞧sel得中得日志信息ipmitool -I open sel list | elistWhen this mand is invoked without arguments, the entire contents of the System Event Log are displayed、 If invoked as elist (extended list) it will also use the Sensor Data Record entries to display the sensor ID for the sensor that caused each event、 Note this can take a long time over the system interface、<count> | first <count>Displays the first count (least-recent) entries in the SEL、 If count is zero, all entries are displayed、last <count>Displays the last count (most-recent) entries in the SEL、 If count is zero, all entries are displayed、查瞧前5条[root@cell83 ~]# ipmitool -I open sel elist first 51 | 09/13/2014 | 11:16:12 | Event Logging Disabled SEL | Log area reset/cleared | Asserted2 | 10/15/2014 | 13:42:04 | Physical Security Intrusion | General Chassis intrusion () | Asserted3 | 10/15/2014 | 13:42:09 | Physical Security Intrusion | General Chassis intrusion () | Deasserted4 | 10/16/2014 | 12:08:20 | Physical Security Intrusion | General Chassis intrusion () | Asserted5 | 10/16/2014 | 12:08:49 | Physical Security Intrusion | General Chassis intrusion () | Deasserted查瞧后5条[root@cell83 ~]# ipmitool -I open sel elist last 52e0 | 08/02/2018 | 01:45:10 | Physical Security Intrusion | General Chassis intrusion () | Deasserted2e1 | 08/04/2018 | 04:11:34 | OS Boot | Installation started | Asserted2e2 | 08/04/2018 | 04:21:03 | OS Boot | Installation pleted | Asserted2e3 | 08/27/2018 | 08:48:24 | Physical Security Intrusion | General Chassis intrusion () | Asserted2e4 | 08/27/2018 | 08:48:29 | Physical Security Intrusion | General Chassis intrusion () | Deasserted。

IPMItoolCommand-line Management of Intelligent Devices()Duncan LaurieSun MicrosystemsLinux Software Engineeringduncan@Intelligent Platform Management InterfacePlatform Management refers to the monitoring,logging,recovery and inventory control features implemented in hardware andfirmware.The key differentiator of Intelligent Platform Management is that these functions are independent of the main CPU,BIOS,and OS.There are two major components of platform management:the Service Processor or Baseboard Management Controller(BMC)and System Management Software(SMS).The service processor is the brain behind platform management and its primary purpose is to provide autonomous sensor monitoring and event logging features.Typical sensor-related events are out-of-range temperature or voltage and fan failure.When an event occurs it is noted in the system event log and made available to SMS.The service processor can even be wired to a standby power source and function when the server is powered down or the operating system has crashed.This allows platform status to be obtained and recovery initiated under situations where in-band delivery mechanisms are unavailable.In modern systems,the Intelligent Platform Management Interface provides a hardware level interface specification for monitoring and control functions.It defines a standard,abstract,message-based interface between the BMC and SMS and a common set of commands for operations such as accessing sensor values,setting thresholds,logging events,and controlling a watchdog timer.IPMI messages can be used to communicate with the BMC over serial and LAN interfaces,so software designed for in-band(local)management can be re-used for out-of-band(remote) management simply by changing the low-level communications layer.Introduction to IPMItoolIPMItool is a simple command-line interface to systems that support the Intelligent Platform Management Interface v1.5specification.It provides the ability to read the sensor data repository and print sensor values,display the contents of the system event log,printfield replaceable unit information,read and set LAN configuration parameters, and perform remote chassis power control.It was originally written to take advantage of IPMI-over-LAN interfaces but is also capable of using the system interface as provided by a kernel device driver such as OpenIPMI.IPMItool is available under a BSD-compatible license.System Management Software is generally complex and makes platform management only part of a much larger management picture.However,many system administrators and developers rely on command-line tools that can bescripted and systems that can be micro-managed.IPMItool takes a different approach to SMS and provides a completely command-line oriented tool.Therefore,it is not designed to replace the OpenIPMI library.Where possible,it suports printing comma-separated-values for output to facilitate parsing by other scripts or programs.It is designed to run quick command-response functions that can be as simple as turning the system on or off or as complex as reading in the sensor data records and extracting and printing detailed sensor information for each record. InterfacesIPMItool supports dynamic loading of interfaces that correspond to low-level communication methods for accessing IPMI systems.The most common of these are the System Interface provided by the OpenIPMI Linux kernel driver and IPMI-over-LAN interfaces.System InterfaceThere are multiple types of system interfaces,but they are all similar enough to enable a single driver like OpenIPMI to support them all.They can be connected to any system bus such as ISA or X-bus that allows the main processor to access I/O mapped locations and meet the timing specifications.The varieties of system interfaces include Keyboard Controller Style(KCS),System Management Interface Chip(SMIC),and Block Transfer(BT).All of these are supported in recent versions of the OpenIPMI driver for the Linux kernel.IPMItool uses this driver to access the system interface through a character device node at/dev/ipmi0.To use this interface with IPMItool provide the“-I open”parameter on the command-line.LAN InterfaceThis is often reffered to as“IPMI-over-LAN”and defines how IPMI messages can be sent to and from the BMC encapsulated in Remote Management Control Protocol(RMCP)packets when are then trasferred as UDP ing the RMCP packet format increases the compatibility between management applications in heterogeneous environments.IPMI-over-LAN is only supported with version1.5and higher of the IPMIspecification,and IPMItool was written specificatlly to take advantage of this interface.To use it provide the“-I lan”option to IPMItool and specify a hostname and password.FeaturesSensorsInstead of directly accessing the monitoring hardware,IPMI provides access to sensor data through abstracted messaging commands.Some common types of sensors that can be found in the system include baseboard and processor temperature sensors,processor and DIMM presence sensors,fan speed and failure monitoring,and baseboard,processor,and SCSI termination voltage sensors.The amount of data available for each sensor can be overwhelming,so by default IPMItool only displays the sensor name,reading,and status.Considerably more output can be seen by enabling the verbose output option.To facilitate discovery of features,IPMI includes a set of records called Sensor Data Records(SDR)that are kept in a single centralized non-volatile storage area.These records include software information such as how many sensors are present,what type they are,their events,threshold info and more.This allows software to interpret and present sensor data without any prior knowledge about the platform.There is also support for writing your own SDR recordsfor OEM extensions,however any non-standard sensor records will not be able to be parsed by IPMI compliant software without specific knowledge of the data format.Example1.Output from the sdr list commandBaseboard 1.25V| 1.245Volts|okBaseboard 2.5V| 2.489Volts|okBaseboard 3.3V| 3.320Volts|okBaseboard Temp|40degrees C|okFntPnl Amb Temp|25degrees C|okProcessor1Temp|46degrees C|okProcessor2Temp|45degrees C|okExample2.Verbose output from the sdr list commandSensor ID:Baseboard 1.25V(0x11)Entity ID:7.1(System Board)Sensor Type(Analog):VoltageSensor Reading: 1.245Volts(+/-0.039)Status:okNominal Reading: 1.245Normal Minimum: 1.078Normal Maximum: 1.411Upper critical: 1.490Upper non-critical: 1.450Lower critical: 1.019Lower non-critical: 1.049EventsEvents are special messages sent by management controller when they detect system management events.Some examples of events are“temperature threshold exceeded”,“voltage threshold exceeded”,“correctable ECC memory error”,etc.These events are processed and usually logged in the System Event Log or SEL.This is similar to the SDR in that it provides a centralized non-volatile storage area for platform events that are logged autonomously by the BMC or directly with event messages sent from the host.There is an abundance of information available from an event log entry.By default IPMItool displays only the basic data for the event and the sensor that triggered it.Detailed information is available with the verbose option. Example3.Output from the sel list command123|12/09/2003|19:36:03|Fan#0x41|Lower Critical-going low124|12/09/2003|20:17:38|Memory#0x08|Correctable ECC125|12/14/2003|06:04:03|Physical Security#0x05|System unplugged from LAN126|01/06/2004|09:44:07|Button#0x84|Power Button pressedInventoryIPMI supports multiple sets of non-volatile Field Replaceable Unit(FRU)information for different parts in the system.This provides access to data such as serial number,part number,asset tag,and other info for major modules in the system including the baseboard,chassis,processors,memory,power supplies,and even the management controller itself.This information is even available when the system is powered down or non-operational,facilitating the creation of automated remote inventory and service applications.IPMItool can read and display full FRU information for the system as well as detailed descriptions of power supplies and full DIMM SPD data.Example4.Output from the fru print commandChassis Type:Rack Mount ChassisChassis Part:F540-5746-01Chassis Serial:AZCW3110041Board Mfg:Sun MicrosystemsBoard Product:SE7501WV2Board Serial:0007E905C1AA103IMWEBoard Part:A99386-109Product Mfg:Sun MicrosystemsProduct Name:Sun Fire(tm)V60Chassis ManagementThis feature provides standardized chassis status and control functions that allow a remote system to be turned on/off or rebooted without manual intervention.It also provides commands for causing the chassis to physically identify itself with an implementation-dependant mechanism such as turning on visible lights,displaying message on an LCD,emitting beeps through a speaker,etc.IPMItool fully supports the available chassis management commands and can eliminate trips to the data center or server room to reset a frozen machine or help identify the single system in a rack that must be removed.Example5.Sample chassis power commands$ipmitool-I lan-H sunfire-P password chassis power statusChasiss Power is on$ipmitool-I lan-H sunfire-P password chassis power offChassis Power Control:Down/OffConclusionThis document highlights some of the more interesting features of IPMItool,but in reality it barely scratches the surface of what can be done.In all of the above examples only a portion of the available output has been shown,the full output is much richer and tells a full story about the system health and status.IPMItool is an actively developed project with multiple contributing developers who are working to increase its usefulness and functionality.Please refer to the IPMItool homepage()for more information about this program and to download source or pre-built binaries.。
一、开关机,重启1. 查看开关机状态:ipmitool –H (BMC的管理IP地址) –I lanplus –U (BMC登录用户名) –P (BMC 登录用户名的密码) power status2. 开机:ipmitool –H (BMC的管理IP地址) –I lanplus –U (BMC登录用户名) –P (BMC 登录用户名的密码) power on3. 关机:ipmitool –H (BMC的管理IP地址) –I lanplus –U (BMC登录用户名) –P (BMC 登录用户名的密码) power off4. 重启:ipmitool –H (BMC的管理IP地址) –I lanplus –U (BMC登录用户名) –P (BMC 登录用户名的密码) power reset二、用户管理说明:[ChannelNo] 字段是可选的,ChannoNo为1或者8;BMC默认有2个用户:user id 为1的匿名用户,user id为2的ADMIN用户;<>字段为必选内容;<privilege level>:2为user权限,3为Operator权限,4为Administrator权限;1. 查看用户信息:ipmitool –H (BMC的管理IP地址) –I lanplus –U (BMC登录用户名) –P (BMC 登录用户名的密码) user list [ChannelNo]2. 增加用户:ipmitool –H (BMC的管理IP地址) –I lanplus –U (BMC登录用户名) –P (BMC 登录用户名的密码) user set name <user id> <username>3. 设置密码:ipmitool –H (BMC的管理IP地址) –I lanplus –U (BMC登录用户名) –P (BMC 登录用户名的密码) user set password <user id> <password>4. 设置用户权限:ipmitool –H (BMC的管理IP地址) –I lanplus –U (BMC登录用户名) –P (BMC 登录用户名的密码) user priv <user id> <privilege level> [ChannelNo]5. 启用/禁用用户:ipmitool –H (BMC的管理IP地址) –I lanplus –U (BMC登录用户名) –P (BMC 登录用户名的密码) user enable/disable <user id>三、IP网络设置说明:[ChannelNo] 字段是可选的,ChannoNo为1(Share Nic网络)或者8(BMC独立管理网络);设置网络参数,必须首先设置IP为静态,然后再进行其他设置;1. 查看网络信息:ipmitool –H (BMC的管理IP地址) –I lanplus –U (BMC登录用户名) –P (BMC 登录用户名的密码) lan print [ChannelNo]2. 修改IP为静态还是DHCP模式:ipmitool –H (BMC的管理IP地址) –I lanplus –U (BMC登录用户名) –P (BMC 登录用户名的密码) lan set <ChannelNo> ipsrc <static/dhcp>3. 修改IP地址:ipmitool –H (BMC的管理IP地址) –I lanplus –U (BMC登录用户名) –P (BMC 登录用户名的密码) lan set <ChannelNo> ipaddr <IPAddress>4. 修改子网掩码:ipmitool –H (BMC的管理IP地址) –I lanplus –U (BMC登录用户名) –P (BMC 登录用户名的密码) lan set <ChannelNo> netmask <NetMask>5. 修改默认网关:ipmitool –H (BMC的管理IP地址) –I lanplus –U (BMC登录用户名) –P (BMC 登录用户名的密码) lan set <ChannelNo> defgw ipaddr <默认网关>四、SOL功能说明:<9.6/19.2/38.4/57.6/115.2>其中115.2代表115200,即*1000是表示的波特率。
ipmi命令Ipmitool -I open lan set 1 ipaddr 192.168.32.195设置channel 1 的地址为192.168.32.195Ipmitool -I open lan print 1 查看channel 1的网络配置Ipmitool –I open chassis status查看底盘状态,其中包括了底盘电源信息,底盘工作状态等Ipmitool –I open chassis power status查看电源状态Ipmitool –I open chassis power on启动底盘,用此命令可以远程开机Ipmitool –I open chassis power off关闭底盘,用此命令可以远程关机Ipmitool –I open chassis power reset实现硬重启,用此命令可以远程开机Ipmitool –I open chassis power cycle 关机重启Ipmitool –I open chassis restart_cause查看上次系统重启的原因Ipmitool –I open chassis policy list 查看支持的底盘电源相关策略。
Ipmitool –I open mc reset 使BMC重新硬启动Ipmitool –I open mc info 查看BMC硬件信息Ipmitool –I open mc getenables 列出BMC所有允许的选项ipmitool -I lanplus -H 192.168.32.195 -U root -P opendoor123 sol activateipmitool -I lanplus -H 192.168.32.195 -U root -P opendoor123 power cycle1.远程控制:将被控制机器的IP增加eth0:12.然后查找本机的IPMI的IP命令:ipmitool -I open lan print 19 ipmitool -I lanplus -H 172.16.32.195 -U root -P opendoor sol activate10 ipmitool -I lanplus -H 172.16.32.195 -U root -P opendoor123 sol activate11 ipmitool -I lanplus -H 172.16.32.195 -U root -P opendoor123 power status12 ipmitool -I lanplus -H 172.16.32.195 -U root -P opendoor123 power status。
ipmitool⼯具操作指南IPMITOOL操作指南1.ipmitool 常⽤命令介绍利⽤ipmitool 实现对服务器的ipmi 管理有两种⽅式:①通过操作系统监控本地服务器;②通过⽹络监控远程服务器。
ipmitool命令包含的Interface有open、lan、lanplus。
Open端⼝⽤于本地监控系统使⽤的;Lan/lanplus通过⽹络进⾏远程监控。
其中open是指的是OpenIPMI 和BMC通信,Lan是通过Ethernet LAN⽤IPV4的UDP协议和BMC通信。
UDP 的数据段包含了IPMI request/resoponse消息,消息具备⼀个IPMI session 头和RMCP 头。
IPMI使⽤Remote Management Control Protocol (RMCP) 版本1⽀持操作系统关闭(pre-OS和OS-absent),RMCP把把数据发送到UDP的623端⼝。
与LAN接⼝相同,lanplus同样使⽤Ethernet LAN 的UDP协议和BMC通信,但是lanplus使⽤RMCP+协议(在IPMIV2.0中描述)来通信,RMCP+允许使⽤改进的认证⽅式和数据完整性检查。
2.1 ipmitool命令格式本地监控命令:ipmitool [-c|-h|-v|-V]-I open远程监控命令:ipmitool [-c|-h|-v|-V]-I lan/lanplus -H [-p ][-U ][-A ][-L ][-a|-E|-P|-f ][-o ]命令选项说明:-c使输出格式为CSV(逗号分隔的变量)格式。
但是不是针对所有命令都有效。
-h获取基本帮助-v 提⾼详细输出的级别。
这个操作可以指定多次⽤来提⾼调试输出的级别。
如果指定三次,那么你将会得到所有传⼊和传出的数据包。
-V列出版本信息。
-I 选择使⽤的IPMI接⼝。
编译⽀持的接⼝都在使⽤帮助输出中可见。
-H远程服务地址,可以为ip地址或者是主机名。
IPMITOOL自动化测试一。
系统环境:ubuntu 15.04 (2)二。
准备工作 (2)1. 在ubuntu上安装python 2.7 (2)2. yaml文件夹,IPMI_automation.py,IPMI_data。
yaml,ipmitools需要放置在同一目录下 (3)三. 测试ipmitool (3)四。
单元测试补充内容 (1)一.系统环境:ubuntu 15.04二.准备工作:1.在ubuntu上安装python2.7在ubuntu linux的发布版本中有预先安装好的python,可按照如下步骤安装python 2。
7.1)在边条上选择“unbuntu软件中心",它看上去像一个橘色的袋子,如果你没有看到它,可以点击“Dash主页”图标,然后在对话框中输入Software;2)在软件中心右上角的搜索框中输入Python;3)在出现的软件列表中选择Python 2。
7,并点击安装。
2.yaml文件夹,IPMI_automation。
py,IPMI_data。
yaml,ipmitools需要放置在同一目录下:1)ipmitools可以通过shell命令来进行安装:apt—get install ipmitool;2)ipmitools可以通过shell命令来获取安装路径:whereis ipmitool;3)按照ipmitools的所在路径找到ipmitools相关文件,拷贝相关文件,放置与yaml文件夹,IPMI_automation.py,IPMI_data。
yaml同一目录下即可。
三.测试ipmitool:测试步骤如下:1)将需要测试的ipmitool command 作为Parmeters写进IPMI_data。
yaml,每条命令对应的Returncode一律写成0(0代表该条命令执行成功);2)修改好IPMI_data.yaml后保存并关闭,打开python 2.7,打开IPMI_automation.py:3)运行该自动化测试脚本:窗口中打印的结果中,如果Expected returncode=Excecute returncode=0,则代表该条命令执行成功,否则代表执行失败;同时程序运行完毕后会在同一目录下生成两个日志,一个详细日志,一个样例日志:4)打开详细日志日志如下,可以检查shell具体的返回结果:5)打开样例日志,可以检查每条命令是否pass,总体pass多少命令,fail多少命令:四.单元测试补充内容:单元测试的重要性就不多说了,可恶的是python中有太多的单元测试框架和工具,什么unittest, testtools, subunit, coverage, testrepository,nose, mox, mock, fixtures, discover,再加上setuptools, distutils 等等这些,先不说如何写单元测试,光是怎么运行单元测试就有N多种方法,再因为它是测试而非功能,是很多人没兴趣触及的东西。
bmcLinuxipmi远程管理⼝配置查询及密码重置前⾔最近有台服务器⼀直宕机,虽然也配置了管理⼝的IP,可以web访问管理页⾯,但是管理⼝的账号密码不知道,所以还是不能远程上下电。
⽹上查询到这篇⽂章,亲⾃试了下,管⽤,所以把它转载过来,以备后续查询。
⼀、安装ipmitool驱动及⼯具系统环境:Centos 7.3_x64 Centos 7.5_x64由于是redhat系的操作系统,安装ipmi有2种⽅式,源码包安装和rpm安装,⽽这两种⽅式在7.3下源码可以成功,7.5下./configure运⾏就报错了,由于时间紧没找原因改⽤rpm安装的⽅式安装成功,分别整理如下:1.1、源码安装⽅式1.1.1、下载源码安装包源码包可以上GitHub上下载:下载的源码包名为ipmitool-1.8.18.tar.bz2,将下载的源码包上传到需要查询的linux服务器,执⾏如下操作安装。
1.1.2、解压并编译安装IPMI# tar -xvf ipmitool-1.8.18.tar.bz2# cd ipmitool-1.8.18# ./configure# make# make install1.2、rpm包的安装⽅式1.2.1、下载IPMI的rpm安装包rpm安装需要ipmitool-1.8.18-9.el7_7.x86_64.rpm与OpenIPMI-modalias-2.0.27-1.el7.x86_64.rpm2个包,该包可以在下⾯的连接页⾯搜索下载,如当前版本的⽬录中不存在,根据url的拼接,找到最新版本下的Packages/⽬录即可。
如果直接是互联⽹环境,则直接执⾏如下操作下载即可。
# 下载安装包1.2.2、将下载IPMI的rpm包进⾏安装# 两个rpm包同时安装rpm -ivh ipmitool-1.8.18-9.el7_7.x86_64.rpm OpenIPMI-modalias-2.0.27-1.el7.x86_64.rpm# 如果上述命令提⽰依赖的问题则执⾏如下命令rpm -ivh ipmitool-1.8.18-9.el7_7.x86_64.rpm OpenIPMI-modalias-2.0.27-1.el7.x86_64.rpm⼆、载⼊ipmitool的功能模块不论是源码的安装⽅式还是rpm的安装⽅式,安装后都需要载⼊ipmi的功能模块后才能使⽤ipmitool⼯具,相关操作执⾏如下命令:modprobe ipmi_devintfmodprobe ipmi_watchdogmodprobe ipmi_poweroffmodprobe ipmi_simodprobe ipmi_msghandler三、查询IPMI iBMC的相关配置安装和载⼊模块之后,如正常这时候ipmitool这个命令⼯具就可以⽤了,这个时候只是单独的执⾏ipmitool会回显改⼯具的使⽤帮助,相关设置和查询的功能基本都有,本次处理使⽤相关的命令如下:3.1、查询当前BMC管理⼝的⽹络配置查询当前配置的命令如下:# ipmitool lan print 13.2、查询当前BMC的⽤户查询当前⽤户的命令如下,执⾏命令后第⼀列会显⽰⽤户的id,第⼆列则显⽰当前的⽤户名称,如需要重置密码则需要记住⽤户的id.# ipmitool user list 13.3、修改⽤户名密码(个⼈修改了⼀次,就直接可以登录web也⾯了,不存在下⾯说的这种情况)修改⽤户密码的命令格式如下,password后的2即为⽤户id,pass_str修改为要修改的密码即可,需要注意的是修改密码后请使⽤web的⽅式,会提⽰使⽤的密码为默认密码根据提⽰在次修改⼀次即可登录管理页⾯了.# ipmitool user set password 2 pass_str四、其他常⽤命令汇总4.1、读取系统状态类#显⽰系统所有传感器列表Ipmitool sensor list#显⽰系统所有现场可替代器件的列表Ipmitool fru list#显⽰系统所有SDRRepository设备列表Ipmitool sdr list#显⽰系统平台时间过滤的列表Ipmitool pef list4.2、系统相关的命令#显⽰BMC版本信息Ipmitool mc info#BMC 热启动Ipmitool bmc reset warm# BMC冷启动Ipmitool bmc reset cold4.3、⽹络接⼝相关的命令# 显⽰channel1的⽹络配置信息Ipmitool lan print 1# 设置channel1的IP地址Ipmitool lan set 1 ipaddr 10.32.2.2# 设置channel1的netmaskIpmitool lan set 1 netmask 255.255.0.0# 设置channel4的⽹关Ipmitool lan set 4 defgw ipaddr255.255.0.254# 设置channel2的⽹关mac addressIpmitool lan set 2 defgw macaddr# 设置channel2的ip 源在DHCPIpmitool lan set 2 ipsrc dhcp# 设置channel2的ip是静态获得的Ipmitool lan set 3 ipsrc static4.4、⽤户相关的命令# 显⽰某通道上的所有⽤户Ipmitool user list chan-id# 修改某⽤户的密码Ipmitool set password [user_id passwd_str]# 禁⽌掉某⽤户Ipmitool disable# 使能某⽤户ipmitool enable# 修改某⽤户在某通道上的权限ipmitool priv []# 测试⽤户ipmitool test <16|20>[4.5、读取⽇志相关的命令# 显⽰所有系统事件⽇志Ipmitool sel elist# 删除所有系统时间⽇志Ipmitool sel clear# 删除第ID条SELIpmitool sel delete ID# 显⽰当前BMC的时间Ipmitool sel time get# 设置当前BMC的时间Ipmitool sel time set XXX4.6、远程电源控制类# 电源关Ipmitool -I lanplus –H 192.168.200.101 –U username –P Passwordchassis power off # 电源开Ipmitool -I lanplus –H 192.168.200.101 –U username –P Passwordchassis power on# 电源复位Ipmitool -I lanplus –H 192.168.200.101 –U username –P Passwordchassis power resetIpmitool -I lanplus –H 192.168.200.101 –U username –P Passwordchassis power cycle# 注意:power cycle 和power reset的区别在于前者从掉电到上电有1秒钟的间隔,⽽后者是很快上电.。
ipmitool sel list 返回的格式ipmitool sel list命令是用于显示系统事件日志(SEL)的内容列表。
SEL记录了系统中发生的各种硬件事件,如电源状态变化、故障警报、温度变化等。
在执行ipmitool sel list命令后,会返回一个文本格式的列表,其中包含了事件的一些关键信息。
以下是ipmitool sel list命令返回的格式及相关参考内容:1. 事件编号(ID):每个事件都有一个唯一的编号,用于标识事件的顺序和唯一性。
参考内容:- IPMIv2.0规范中的章节25 "Sensor Event/Reading Type Codes"(IPMI规范中的传感器事件/读取类型代码)可以了解不同类型的事件编号及其含义。
2. 时间戳(Timestamp):记录事件发生的日期和时间。
参考内容:- 日期和时间的格式可能有所不同,具体格式可以参考操作系统的文档或手册。
3. 传感器名称(Sensor Name):事件所涉及的传感器的名称,用于标识触发事件的硬件部件。
参考内容:- IPMIv2.0规范中的章节33 "Sensor Device Capabilities and Commands"(传感器设备能力和命令)描述了传感器的各种类型和名称。
4. 状态(Status):记录事件的状态,可能包括“ok”、“critical”、“non-critical”、“unrecoverable”等。
参考内容:- IPMIv2.0规范中的章节33 "Sensor Device Capabilities and Commands"(传感器设备能力和命令)描述了事件状态的不同类型及其含义。
5. 事件类型(Event Type):标识事件的具体类型,如“Threshold”(阈值)、“Discrete”(离散)、“Digital Discrete”(数字离散)等。
ipmitool工具常用命令汇总目录1.工具的安装 (3)2.命令的help (3)3.查看管理口的IP地址 (5)4.管理底盘chassis配置 (6)4.1查看底盘配置汇总 (6)4.2管理电源 (6)4.3管理时间间隔 (7)4.4管理电源恢复策略 (7)4.5查看上次重启原因 (7)4.6查询上电时间 (8)4.7管理启动项 (8)4.8设置启动项的参数 (8)5.使用delloem进行管理 (9)5.1配置lcd (9)5.2查看MAC地址 (10)5.3设置lan的模式 (11)5.4设置背板led的状态 (11)5.5管理电源监控 (12)6.查看传感器数据sensor (12)6.1查看当前系统所有的传感器数据 (13)6.2设置传感器的告警阈值 (13)6.3查看某一传感器的状态信息 (13)6.4查看某一个传感器的当前值 (14)7.管理传感器仓库sdr (14)7.1查看传感器仓库中的信息列表 (15)7.2查看传感器的类型和指定类型的数据 (16)7.3查看指定传感器的配置信息 (17)7.4查看传感器仓库sdr的配置信息 (18)8.查看系统事件sel日志 (18)8.1查看sel的状态信息 (18)8.2查看sel的中的日志信息 (19)1.工具的安装yum install -y OpenIPMI ipmitool开启服务/etc/init.d/ipmi status/etc/init.d/ipmi start[root@cell83 ~]# ipmitool -Vipmitool version 1.8.182.命令的help明细的命令参考man ipmitool或者附件ipmitool.help[root@cell83 ~]# ipmitool -hipmitool version 1.8.18usage: ipmitool [options...] <command>-h This help-V Show version information-v Verbose (can use multiple times)-c Display output in comma separated format-d N Specify a /dev/ipmiN device to use (default=0)-I intf Interface to use-H hostname Remote host name for LAN interface-p port Remote RMCP port [default=623]-U username Remote session username-f file Read remote session password from file-z size Change Size of Communication Channel (OEM)-S sdr Use local file for remote SDR cache-D tty:b[:s] Specify the serial device, baud rate to useand, optionally, specify that interface is the system one-4 Use only IPv4-6 Use only IPv6-a Prompt for remote password-Y Prompt for the Kg key for IPMIv2 authentication-e char Set SOL escape character-C ciphersuite Cipher suite to be used by lanplus interface-k key Use Kg key for IPMIv2 authentication-y hex_key Use hexadecimal-encoded Kg key for IPMIv2 authentication-L level Remote session privilege level [default=ADMINISTRATOR] Append a '+' to use name/privilege lookup in RAKP1-A authtype Force use of auth type NONE, PASSWORD, MD2, MD5 or OEM -P password Remote session password-E Read password from IPMI_PASSWORD environment variable -K Read kgkey from IPMI_KGKEY environment variable-m address Set local IPMB address-b channel Set destination channel for bridged request-t address Bridge request to remote target address-B channel Set transit channel for bridged request (dual bridge) -T address Set transit address for bridge request (dual bridge) -l lun Set destination lun for raw commands-o oemtype Setup for OEM (use 'list' to see available OEM types) -O seloem Use file for OEM SEL event descriptions-N seconds Specify timeout for lan [default=2] / lanplus [default=1] interface-R retry Set the number of retries for lan/lanplus interface [default=4]Interfaces:open Linux OpenIPMI Interface [default]imb Intel IMB Interfacelan IPMI v1.5 LAN Interfacelanplus IPMI v2.0 RMCP+ LAN Interfaceserial-terminal Serial Interface, Terminal Modeserial-basic Serial Interface, Basic Modeusb IPMI USB Interface(OEM Interface for AMI Devices)Commands:raw Send a RAW IPMI request and print responsei2c Send an I2C Master Write-Read command and print response spd Print SPD info from remote I2C devicelan Configure LAN Channelschassis Get chassis status and set power statepower Shortcut to chassis power commandsevent Send pre-defined events to MCmc Management Controller status and global enablessdr Print Sensor Data Repository entries and readingssensor Print detailed sensor informationfru Print built-in FRU and scan SDR for FRU locatorsgendev Read/Write Device associated with Generic Device locators sdrsel Print System Event Log (SEL)pef Configure Platform Event Filtering (PEF)sol Configure and connect IPMIv2.0 Serial-over-LANtsol Configure and connect with Tyan IPMIv1.5 Serial-over-LAN isol Configure IPMIv1.5 Serial-over-LANuser Configure Management Controller userschannel Configure Management Controller channelssession Print session informationdcmi Data Center Management Interfacenm Node Manager Interfacesunoem OEM Commands for Sun serverskontronoem OEM Commands for Kontron devicespicmg Run a PICMG/ATCA extended cmdfwum Update IPMC using Kontron OEM Firmware Update Managerfirewall Configure Firmware Firewalldelloem OEM Commands for Dell systemsshell Launch interactive IPMI shellexec Run list of commands from fileset Set runtime variable for shell and exechpm Update HPM components using PICMG HPM.1 fileekanalyzer run FRU-Ekeying analyzer using FRU filesime Update Intel Manageability Engine Firmwarevita Run a VITA 46.11 extended cmdlan6 Configure IPv6 LAN Channels3.查看管理口的IP地址[root@cell83 ~]# ipmitool -I open lan print[root@cell83 ~]# ipmitool -I open lan print | grep IPIP Address Source : Static AddressIP Address : 192.168.0.133IP Header : TTL=0x40 Flags=0x40 Precedence=0x00 TOS=0x10 Default Gateway IP : 192.168.0.1Backup Gateway IP : 0.0.0.04.管理底盘chassis配置[root@cell83 ~]# ipmitool -I open chassis helpChassis Commands: status, power, identify, policy, restart_cause, poh, bootdev, bootparam, selftest4.1查看底盘配置汇总[root@cell83 ~]# ipmitool -I open chassis statusSystem Power : onPower Overload : falsePower Interlock : inactiveMain Power Fault : falsePower Control Fault : falsePower Restore Policy : previousLast Power Event :Chassis Intrusion : inactiveFront-Panel Lockout : inactiveDrive Fault : falseCooling/Fan Fault : falseSleep Button Disable : not allowedDiag Button Disable : allowedReset Button Disable : not allowedPower Button Disable : allowedSleep Button Disabled: falseDiag Button Disabled : trueReset Button Disabled: falsePower Button Disabled: false4.2管理电源查看当前电源状态[root@cell83 ~]# ipmitool -I open chassis power statusChassis Power is on打开电源ipmitool -I open chassis power on关闭电源ipmitool -I open chassis power off重启电源ipmitool -I open chassis power cycle重置电源ipmitool -I open chassis power reset其他配置ipmitool -I open chassis power diagipmitool -I open chassis power soft4.3管理时间间隔查询时间间隔:[root@cell83 ~]# ipmitool -I open chassis identifyChassis identify interval: default (15 seconds)设置时间间隔:[root@cell83 ~]# ipmitool -I open chassis identify helpchassis identify <interval>default is 15 seconds0 to turn offforce to turn on indefinitely4.4管理电源恢复策略[root@cell83 ~]# ipmitool -I open chassis policy helpchassis policy <state>list : return supported policiesalways-on : turn on when power is restoredprevious : return to previous state when power is restored always-off : stay off after power is restored4.5查看上次重启原因[root@cell83 ~]# ipmitool -I open chassis restart_causeSystem restart cause: unknown4.6查询上电时间[root@cell83 ~]# ipmitool -I open chassis pohGet Chassis Power-On-Hours failed: Invalid command4.7管理启动项[root@cell83 ~]# ipmitool -I open chassis bootdev helpbootdev <device> [clear-cmos=yes|no]bootdev <device> [options=help,...]none : Do not change boot device orderpxe : Force PXE bootdisk : Force boot from default Hard-drivesafe : Force boot from default Hard-drive, request Safe Modediag : Force boot from Diagnostic Partitioncdrom : Force boot from CD/DVDbios : Force boot into BIOS Setupfloppy: Force boot from Floppy/primary removable media4.8设置启动项的参数[root@cell83 ~]# ipmitool -I open chassis bootparam helpbootparam get <param #>bootparam set bootflag <device> [options=...]Legal devices are:none : No overrideforce_pxe : Force PXE bootforce_disk : Force boot from default Hard-driveforce_safe : Force boot from default Hard-drive, request Safe Modeforce_diag : Force boot from Diagnostic Partitionforce_cdrom : Force boot from CD/DVDforce_bios : Force boot into BIOS SetupLegal options are:help : print this messagePEF : Clear valid bit on reset/power cycle cause by PEFtimeout : Automatically clear boot flag valid bit on timeoutwatchdog: Clear valid bit on reset/power cycle cause by watchdogreset : Clear valid bit on push button reset/soft resetpower : Clear valid bit on power up via power push button or wake event Any Option may be prepended with no- to invert sense of operation5.使用delloem进行管理查看帮助[root@cell83 ~]# ipmitool -I open delloem helpusage: delloem <command> [option...]commands:lcdmaclansetledpowermonitorvFlashFor help on individual commands type:delloem <command> help5.1配置lcd[root@cell83 ~]# ipmitool -I open delloem lcd helpGeneric DELL HW:lcd set {none}|{default}|{custom <text>}Set LCD text displayed during non-fault conditionsiDRAC 11g or iDRAC 12g or iDRAC 13g :lcd set {mode}|{lcdqualifier}|{errordisplay}Allows you to set the LCD mode and user-defined string.lcd set mode {none}|{modelname}|{ipv4address}|{macaddress}|{systemname}|{servicetag}|{ipv6address}|{ambienttemp}{systemwatt }|{assettag}|{userdefined}<text>Allows you to set the LCD display mode to any of the precedingparameterslcd set lcdqualifier {watt}|{btuphr}|{celsius}|{fahrenheit}Allows you to set the unit for the system ambient temperature mode.lcd set errordisplay {sel}|{simple}Allows you to set the error display.lcd infoShow LCD text that is displayed during non-fault conditionslcd set vkvm{active}|{inactive}Set vKVM active and inactive, message will be displayed on lcdwhen vKVM is active and vKVM session is in progresslcd set frontpanelaccess {viewandmodify}|{viewonly}|{disabled}Set LCD mode to view and modify, view only or disabledlcd statusShow LCD Status for vKVM display<active|inactive>and Front Panel access mode {viewandmodify}|{viewonly}|{disabled}5.2查看MAC地址[root@cell83 ~]# ipmitool -I open delloem mac helpmac listLists the MAC address of LOMsmac get <NIC number>Shows the MAC address of specified LOM. 0-7 System LOM, 8- DRAC/iDRAC. [root@cell83 ~]# ipmitool -I open delloem mac listSystem LOMsNIC Number MAC Address Status0 b8:2a:72:db:56:2a Enabled1 b8:2a:72:db:56:2b Enabled2 b8:2a:72:db:56:28 Enabled3 b8:2a:72:db:56:29 EnablediDRAC7 MAC Address b0:83:fe:c9:6d:315.3设置lan的模式[root@cell83 ~]# ipmitool -I open delloem lan helplan set <Mode>sets the NIC Selection Mode :on iDRAC12g OR iDRAC13g :dedicated, shared with lom1, shared with lom2,shared with lom3,sharedwith lom4,shared with failover lom1,shared with failover lom2,sharedwith failover lom3,shared with failover lom4,shared with Failover allloms, shared with Failover None).on other systems :dedicated, shared, shared with failover lom2,shared with Failover all loms.lan geton iDRAC12g or iDRAC13g :returns the current NIC Selection Mode (dedicated, shared with lom1, sharedwith lom2, shared with lom3, shared with lom4,shared with failover lom1,shared with failover lom2,shared with failover lom3,shared with failoverlom4,shared with Failover all loms,shared with Failover None). on other systems :dedicated, shared, shared with failover,lom2, shared with Failover all loms.lan get activereturns the current active NIC (dedicated, LOM1, LOM2, LOM3, LOM4). 5.4设置背板led的状态[root@cell83 ~]# ipmitool -I open delloem setled helpsetled <b:d.f> <state..>Set backplane LED stateb:d.f = PCI Bus:Device.Function of drive (lspci format)state = present|online|hotspare|identify|rebuilding|fault|predict|critical|failed5.5管理电源监控[root@cell83 ~]# ipmitool -I open delloem powermonitor helppowermonitorShows power tracking statisticspowermonitor clear cumulativepowerReset cumulative power readingpowermonitor clear peakpowerReset peak power readingpowermonitor powerconsumptionDisplays power consumption in <watt|btuphr>powermonitor powerconsumptionhistory <watt|btuphr>Displays power consumption historypowermonitor getpowerbudgetDisplays power cap in <watt|btuphr>powermonitor setpowerbudget <val><watt|btuphr|percent>Allows user to set the power cap in <watt|BTU/hr|percentage>powermonitor enablepowercapTo enable set power cappowermonitor disablepowercapTo disable set power cap6.查看传感器数据sensor[root@cell83 ~]# ipmitool -I open sensor helpSensor Commands: list thresh get reading6.1查看当前系统所有的传感器数据[root@cell83 ~]# ipmitool -I open sensor list6.2设置传感器的告警阈值[root@cell83 ~]# ipmitool -I open sensor thresh helpsensor thresh <id> <threshold> <setting>id : name of the sensor for which threshold is to be set threshold : which threshold to setunr = upper non-recoverableucr = upper criticalunc = upper non-criticallnc = lower non-criticallcr = lower criticallnr = lower non-recoverablesetting : the value to set the threshold tosensor thresh <id> lower <lnr> <lcr> <lnc>Set all lower thresholds at the same timesensor thresh <id> upper <unc> <ucr> <unr>Set all upper thresholds at the same time6.3查看某一传感器的状态信息[root@cell83 ~]# ipmitool -I open sensor get helpsensor get <id> ... [id]id : name of desired sensor查看温度传感器[root@cell83 ~]# ipmitool -I open sensor get TempLocating sensor record...Sensor ID : Temp (0xe)Entity ID : 3.1Sensor Type (Threshold) : TemperatureSensor Reading : 48 (+/- 1) degrees CStatus : okLower Non-Recoverable : naLower Critical : 3.000Lower Non-Critical : 8.000Upper Non-Critical : 79.000Upper Critical : 84.000Upper Non-Recoverable : naPositive Hysteresis : 1.000Negative Hysteresis : 1.000Assertion Events :Assertions Enabled :6.4查看某一个传感器的当前值[root@cell83 ~]# ipmitool -I open sensor reading helpsensor reading <id> ... [id]id : name of desired sensor查看温度传感器[root@cell83 ~]# ipmitool -I open sensor reading TempTemp | 477.管理传感器仓库sdr[root@cell83 ~]# ipmitool -I open sdr helpusage: sdr <command> [options]list | elist [option]all All SDR Recordsfull Full Sensor Recordcompact Compact Sensor Recordevent Event-Only Sensor Recordmcloc Management Controller Locator Recordfru FRU Locator Recordgeneric Generic Device Locator Recordtype [option]<Sensor_Type> Retrieve the state of specified sensor. Sensor_Type can be specified either asa string or a hex value.list Get a list of available sensor typesget <Sensor_ID>Retrieve state of the first sensor matched by Sensor_IDinfoDisplay information about the repository itselfentity <Entity_ID>[.<Instance_ID>]Display all sensors associated with an entitydump <file>Dump raw SDR data to a filefill <option>sensors Creates the SDR repository for the current configurationnosat Creates the SDR repository for the currentconfiguration, without satellite scanfile <file> Load SDR repository from a filerange <range> Load SDR repository from a provided list or range. Use ',' for list or '-' forrange, eg. 0x28,0x32,0x40-0x447.1查看传感器仓库中的信息列表[root@cell83 ~]# ipmitool -I open sdr elist helpusage: sdr elist [all|full|compact|event|mcloc|fru|generic]=>查看仓库中所有的信息:elist和list的格式内容上略有不同[root@cell83 ~]# ipmitool -I open sdr elist all[root@cell83 ~]# ipmitool -I open sdr list all=>查看传感器的数据[root@cell83 ~]# ipmitool -I open sdr elist fullFan1 RPM | 30h | ok | 7.1 | 6240 RPMFan2 RPM | 31h | ok | 7.1 | 6240 RPMFan3 RPM | 32h | ok | 7.1 | 6240 RPMFan4 RPM | 33h | ok | 7.1 | 6120 RPMFan5 RPM | 34h | ok | 7.1 | 6240 RPMFan6 RPM | 35h | ok | 7.1 | 6240 RPMInlet Temp | 04h | ok | 7.1 | 35 degrees CExhaust Temp | 01h | ok | 7.1 | 40 degrees CTemp | 0Eh | ok | 3.1 | 47 degrees CTemp | 0Fh | ok | 3.2 | 46 degrees CCurrent 1 | 6Ah | ok | 10.1 | 0.80 AmpsCurrent 2 | 6Bh | ns | 10.2 | No ReadingVoltage 1 | 6Ch | ok | 10.1 | 236 VoltsVoltage 2 | 6Dh | ns | 10.2 | No ReadingPwr Consumption | 77h | ok | 7.1 | 168 Watts说明:Fan ----表示风扇Inlet Temp ----进口温度Exhaust Temp ----出口温度Temp ----CPU的温度Current --电流Voltage ---电压Pwr Consumption ----功率7.2查看传感器的类型和指定类型的数据查看传感器有哪些类型[root@cell83 ~]# ipmitool -I open sdr type listSensor Types:Temperature (0x01) Voltage (0x02) Current (0x03) Fan (0x04) Physical Security (0x05) Platform Security (0x06) Processor (0x07) Power Supply (0x08) Power Unit (0x09) Cooling Device (0x0a) Other (0x0b) Memory (0x0c) Drive Slot / Bay (0x0d) POST Memory Resize (0x0e) System Firmwares (0x0f) Event Logging Disabled (0x10) Watchdog1 (0x11) System Event (0x12) Critical Interrupt (0x13) Button (0x14) Module / Board (0x15) Microcontroller (0x16) Add-in Card (0x17) Chassis (0x18) Chip Set (0x19) Other FRU (0x1a) Cable / Interconnect (0x1b) Terminator (0x1c) System Boot Initiated (0x1d) Boot Error (0x1e) OS Boot (0x1f) OS Critical Stop (0x20) Slot / Connector (0x21) System ACPI Power State (0x22) Watchdog2 (0x23) Platform Alert (0x24) Entity Presence (0x25) Monitor ASIC (0x26) LAN (0x27) Management Subsys Health (0x28) Battery (0x29) Session Audit (0x2a) Version Change (0x2b) FRU State (0x2c)查看指定传感器的数据如查看温度:[root@cell83 ~]# ipmitool -I open sdr type TemperatureInlet Temp | 04h | ok | 7.1 | 35 degrees CExhaust Temp | 01h | ok | 7.1 | 40 degrees CTemp | 0Eh | ok | 3.1 | 46 degrees CTemp | 0Fh | ok | 3.2 | 47 degrees C如查看电源的个数1:有一个电源[root@cell83 dvd]# ipmitool -I open sdr type "Power Supply"PS Redundancy | 74h | ns | 7.1 | No ReadingStatus | 62h | ok | 10.1 | Presence detectedStatus | 63h | ns | 10.2 | Disabled如查看电源的个数2:有四个电源[root@db04 ~]# ipmitool -I open sdr type "Power Supply"PS Redundancy | 74h | ok | 7.1 | Redundancy LostStatus | 62h | ok | 10.1 | Presence detectedStatus | 63h | ok | 10.2 | Presence detected, Power Supply AC lostStatus | 52h | ok | 10.3 | Presence detected, Config Error, Power Supply InactiveStatus | 53h | ok | 10.4 | Presence detected, Config Error, Power Supply Inactive7.3查看指定传感器的配置信息[root@cell83 ~]# ipmitool -I open sdr get TempSensor ID : Temp (0xe)Entity ID : 3.1 (Processor)Sensor Type (Threshold) : Temperature (0x01)Sensor Reading : 47 (+/- 1) degrees CStatus : okNominal Reading : 23.000Normal Minimum : 11.000Normal Maximum : 69.000Upper critical : 83.000Upper non-critical : 77.000Lower critical : 3.000Lower non-critical : 8.000Positive Hysteresis : 1.000Negative Hysteresis : 1.000Minimum sensor range : UnspecifiedMaximum sensor range : UnspecifiedEvent Message Control : Per-thresholdReadable Thresholds : No ThresholdsSettable Thresholds : No ThresholdsAssertion Events :Assertions Enabled :7.4查看传感器仓库sdr的配置信息[root@cell83 ~]# ipmitool -I open sdr infoSDR Version : 0x51Record Count : 170Free Space : 1836 bytesMost recent Addition : 02/07/2106 06:28:15Most recent Erase : 02/07/2106 06:28:15SDR overflow : noSDR Repository Update Support : modalDelete SDR supported : noPartial Add SDR supported : noReserve SDR repository supported : yesSDR Repository Alloc info supported : no8.查看系统事件sel日志[root@cell83 ~]# ipmitool -I open sel helpSEL Commands: info clear delete list elist get add time save readraw writeraw interpret8.1查看sel的状态信息[root@cell83 ~]# ipmitool -I open sel info helpSEL InformationVersion : 1.5 (v1.5, v2 compliant)Entries : 740Free Space : 4544 bytesPercent Used : 72%Last Add Time : 08/27/2018 08:48:29Last Del Time : 09/13/2014 11:16:12Overflow : falseSupported Cmds : 'Reserve'8.2查看sel的中的日志信息ipmitool -I open sel list | elistWhen this command is invoked without arguments, the entire contents of the System Event Log are displayed. If invoked as elist (extended list) it will also use the Sensor Data Record entries to display the sensor ID for the sensor that caused each event. Note this can take a long time over the system interface.<count> | first <count>Displays the first count (least-recent) entries in the SEL. If count is zero, all entries are displayed.last <count>Displays the last count (most-recent) entries in the SEL. If count is zero, all entries are displayed.查看前5条[root@cell83 ~]# ipmitool -I open sel elist first 51 | 09/13/2014 | 11:16:12 | Event Logging Disabled SEL | Log area reset/cleared | Asserted2 | 10/15/2014 | 13:42:04 | Physical Security Intrusion | General Chassis intrusion () | Asserted3 | 10/15/2014 | 13:42:09 | Physical Security Intrusion | General Chassis intrusion () | Deasserted4 | 10/16/2014 | 12:08:20 | Physical Security Intrusion | General Chassis intrusion () | Asserted5 | 10/16/2014 | 12:08:49 | Physical Security Intrusion | General Chassis intrusion () | Deasserted查看后5条[root@cell83 ~]# ipmitool -I open sel elist last 52e0 | 08/02/2018 | 01:45:10 | Physical Security Intrusion | General Chassis intrusion () | Deasserted2e1 | 08/04/2018 | 04:11:34 | OS Boot | Installation started | Asserted2e2 | 08/04/2018 | 04:21:03 | OS Boot | Installation completed | Asserted 2e3 | 08/27/2018 | 08:48:24 | Physical Security Intrusion | General Chassisintrusion () | Asserted2e4 | 08/27/2018 | 08:48:29 | Physical Security Intrusion | General Chassis intrusion () | Deasserted精品文档。