锆石协和图和加权平均年龄制作方法
- 格式:doc
- 大小:440.50 KB
- 文档页数:5

SIMS锆石U-Pb定年方法用于U-Pb年龄测定的样品(号码)用常规的重选和磁选技术分选出锆石。
将锆石样品颗粒和锆石标样Plésovice (Sláma et al., 2008) (或TEMORA, Black et al., 2004)和Qinghu (Li et al., 2009)粘贴在环氧树脂靶上,然后抛光使其曝露一半晶面。
对锆石进行透射光和反射光显微照相以及阴极发光图象分析,以检查锆石的内部结构、帮助选择适宜的测试点位。
样品靶在真空下镀金以备分析。
U、Th、Pb的测定在中国科学院地质与地球物理研究所CAMECA IMS-1280二次离子质谱仪(SIMS)上进行,详细分析方法见Li et al. (2009)。
锆石标样与锆石样品以1:3比例交替测定。
U-Th-Pb同位素比值用标准锆石Plésovice (337Ma, Sláma et al., 2008(或TEMORA (417Ma, Black et al., 2004))校正获得,U含量采用标准锆石91500 (81 ppm, Wiedenbeck et al., 1995) 校正获得,以长期监测标准样品获得的标准偏差(1SD = 1.5%, Li et al., 2010)和单点测试内部精度共同传递得到样品单点误差,以标准样品Qinghu (159.5 Ma, Li et al., 2009) 作为未知样监测数据的精确度。
普通Pb校正采用实测204Pb值。
由于测得的普通Pb含量非常低,假定普通Pb主要来源于制样过程中带入的表面Pb污染,以现代地壳的平均Pb同位素组成(Stacey and Kramers, 1975)作为普通Pb组成进行校正。
同位素比值及年龄误差均为1σ。
数据结果处理采用ISOPLOT软件(文献)。
参考文献Black, L.P., Kamo, S.L., Allen, C.M., Davis, D.W., Aleinikoff, J.N., Valley, J.W., Mundil, R., Campbel, I.H., Korsch, R.J., Williams, I.S., Foudoulis, Chris., 2004.Improved 206Pb/238U microprobe geochronology by the monitoring of atrace-element-related matrix effect; SHRIMP, ID-TIMS, ELA-ICP-MS andoxygen isotope documentation for a series of zircon standards. Chem. Geol.,205: 115-140.Jiří Sláma, Jan Košler, Daniel J. Condon, James L. Crowley, Axel Gerdes, John M.Hanchar, Matthew S.A. Horstwood, George A. Morris, Lutz Nasdala, Nicholas Norberg, Urs Schaltegger, Blair Schoene, Michael N. Tubrett , Martin J.Whitehouse, 2008. Plešovice z ircon —A new natural reference material for U–Pb and Hf isotopic microanalysis. Chemical Geology 249, 1–35Li, Q.L., Li, X.H., Liu, Y., Tang, G.Q., Yang, J.H., Zhu, W.G., 2010. Precise U-Pb and Pb-Pb dating of Phanerozoic baddeleyite by SIMS with oxygen floodingtechnique. Journal of Analytical Atomic Spectrometry 25, 1107-1113.Li, X.-H., Y. Liu, Q.-L. Li, C.-H. Guo, and K. R. Chamberlain (2009), Precise determination of Phanerozoic zircon Pb/Pb ageby multicollector SIMS without external standardization, Geochem. Geophys. Geosyst., 10, Q04010,doi:10.1029/2009GC002400.Ludwig, K.R., 2001. Users manual for Isoplot/Ex rev. 2.49. Berkeley Geochronology Centre Special Publication. No. 1a, 56 pp.Stacey, J.S., Kramers, J.D., 1975. Approximation of terrestrial lead isotope evolution by a two-stage model. Earth Planet. Sci. Lett., 26, 207-221.Wiedenbeck, M., Alle, P., Corfu, F., Griffin, W.L., Meier, M., Oberli, F., V onquadt, A., Roddick, J.C., Speigel, W., 1995. Three natural zircon standards for U-Th-Pb,Lu-Hf, trace-element and REE analyses. Geostand. Newsl. 19: 1-23.SIMS U-Pb dating methodsSamples XXX for U-Pb analysis were processed by conventional magnetic and density techniques to concentrate non-magnetic, heavy fractions. Zircon grains, together with zircon standard 91500 were mounted in epoxy mounts which were then polished to section the crystals in half for analysis. All zircons were documented with transmitted and reflected light micrographs as well as cathodoluminescence (CL) images to reveal their internal structures, and the mount was vacuum-coated with high-purity gold prior to secondary ion mass spectrometry (SIMS) analysis.Measurements of U, Th and Pb were conducted using the Cameca IMS-1280 SIMS at the Institute of Geology and Geophysics, Chinese Academy of Sciences in Beijing. U-Th-Pb ratios and absolute abundances were determined relative to the standard zircon 91500 (Wiedenbeck et al., 1995), analyses of which were interspersed with those of unknown grains, using operating and data processing procedures similar to those described by Li et al. (2009). A long-term uncertainty of 1.5% (1 RSD) for 206Pb/238U measurements of the standard zircons was propagated to the unknowns (Li et al., 2010), despite that the measured 206Pb/238U error in a specific session is generally around 1% (1 RSD) or less. Measured compositions were corrected for common Pb using non-radiogenic 204Pb. Corrections are sufficiently small to be insensitive to the choice of common Pb composition, and an average of present-day crustal composition (Stacey and Kramers, 1975) is used for the common Pb assuming that the common Pb is largely surface contamination introduced during sample preparation. Uncertainties on individual analyses in data tables are reported at a 1 level; mean ages for pooled U/Pb (and Pb/Pb) analyses are quoted with 95% confidence interval. Data reduction was carried out using the Isoplot/Ex v. 2.49 program (Ludwig, 2001).。
锆石SHRIMP定年原理和方法锆石分选采用常规重力分选和显微镜下手工挑选的方法进行,具体是将岩石样品粉碎成60目左右,通过淘洗和使用重液等物理方法分离锆石,然后在双目镜下精选、剔除杂质。
然后将其与标准锆石(TEM,417 Ma)一起粘贴,制成环氧树脂样品靶,打磨抛光并使其露出中心部位,进行反射光透射光和阴极发光显微照相,阴极发光图像用以确定单颗粒锆石晶体的形态、结构特征以及标定测年点。
最后,用超声波在去离子水中清洗约10分钟后,镀金膜并上机测年。
在分析中,采用跳峰扫描记录Zr2O+、204Pb+、背景值、206Pb+、207Pb+、208Pb+、U+、ThO+和UO+等9个离子束峰值,每5次扫描记录一次平均值:一次离子为4.5nA,10kV的O-2,离子束直径约25~30um:质量分辨率约5400(1%峰高):应用SL13(572Ma,U=238×10-6)标定样品的U、Th及Pb含量,用TEM(417Ma)标定样品的年龄。
为了尽量降低锆石表面普通Pb和镀金过程中的污染,测定过程中先将束斑在120um 范围内扫描 5 分钟,具体测试条件及流程见Compston等(1992)、Williams(1998)、宋彪(2002)等。
数据处理采用SQUID1.0和ISOPLOT 程序,普通Pb一般根据实测204Pb及Cumming等(1975)模式铅成分校正:单个测试数据误差和206Pb/238U 年龄的加权平均值误差均为95%置信度误差(1σ),对年轻的岩浆锆石,采用206Pb/238U 年龄;对较老的继承锆石,采用207Pb/206Pb 年龄。
206Pb/238U 年龄的加权平均值,即谐和年龄,用谐和图表示,谐和图是锆石同位素地质年代学最常用的图解,它是以207Pb/235U 和206Pb/238U 为坐标,t为参数的超越方程(207Pb/235U=te*λ-1和206Pb/238U =t eλ-1,其中λ*和λ分别是235U 和238U的衰变常数)的轨迹――谐和线。

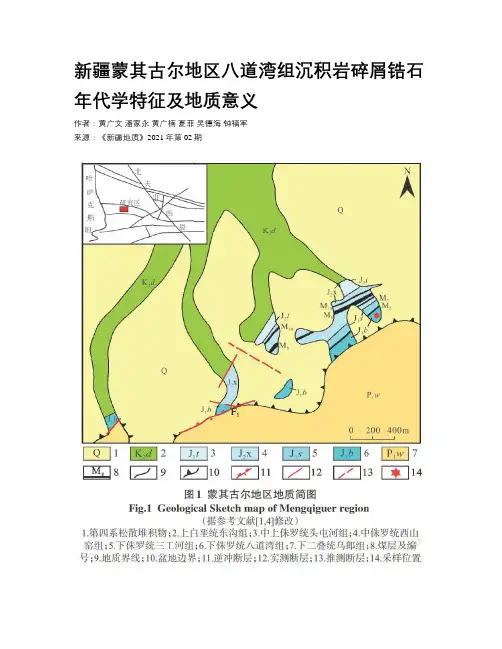
新疆蒙其古尔地区八道湾组沉积岩碎屑锆石年代学特征及地质意义作者:黄广文潘家永黄广楠夏菲吴德海钟福军来源:《新疆地质》2021年第02期摘要:在详细观察描述含砾砂岩宏观特征基础上,利用偏光显微镜和LA-ICP-MS对蒙其古尔地区八道湾组出露的含砾砂岩开展碎屑骨架组分及碎屑锆石U-Pb定年分析,初步解析岩石学、年代学及物源特征等信息。
结果表明:碎屑锆石多具良好的振荡韵律环带,Th/U值大于0.1,为岩浆成因锆石;样品中最年轻的碎屑锆石年龄为(289±4) Ma,可限定八道湾组砂岩沉积下限为早二叠世;初步将碎屑锆石年龄分为3组,分别为1588~807 Ma、603~410 Ma、350~289 Ma,该年龄区间与已知构造-岩浆事件时间(晋宁期、加里东期和印支-海西期)基本对应,表明研究区构造岩浆活动与中国大地构造运动基本一致。
据QFL与QmFLt图解,结合构造背景及盆地演化过程,认为八道湾组砂岩物源经历了由相对稳定的石英再旋回造山带区向过渡再旋回造山带,再向岩屑再旋回造山带区演变的过程。
碎屑物源可能主要来源于南部乌孙山、那拉提山出露的石炭—奥陶纪火山岩及中酸性侵入岩。
关键词:蒙其古尔;碎屑锆石U-Pb定年;砂岩;物源;八道湾组物源分析是确定源区母岩性质的重要依据之一,是沉积盆地分析的重要组成部分[1-2]。
碎屑锆石具较高稳定性,能全面记录和反映源区所经历的相关地质事件[3-4]。
前人利用碎屑锆石同位素测年方法,判别碎屑物源、源区母岩性质及对应的大地构造背景等特征,进一步推动了构造沉积学等多学科发展[3-10]。
伊犁盆地是我国重要产煤、石油及天然气盆地之一,同时也是可地浸砂岩型铀矿的重要产铀盆地[1]。
目前盆地内已探明多个铀矿床,如蒙其古尔、扎吉斯坦、乌库尔其、库捷尔太、洪海沟等[1,11-15],其中蒙其古尔位于伊犁盆地南缘,是目前盆地内规模最大的铀矿床,也是我国首个建设千吨级可地浸砂岩型产铀基地[4]。
锆石协和图和加权平均年龄制作方法
做协和图
首先,加载宏Isoplot 3,工具-加载宏-浏览- Isoplot 3-确定-确定
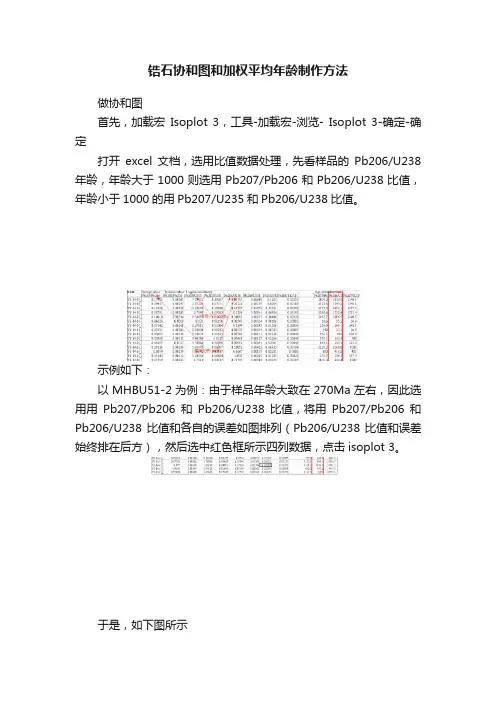
打开excel文档,选用比值数据处理,先看样品的Pb206/U238年龄,年龄大于1000则选用Pb207/Pb206和Pb206/U238比值,年龄小于1000的用Pb207/U235和Pb206/U238比值。
示例如下:
以MHBU51-2为例:由于样品年龄大致在270Ma左右,因此选用用Pb207/Pb206和Pb206/U238比值,将用Pb207/Pb206和Pb206/U238比值和各自的误差如图排列(Pb206/U238比值和误差始终排在后方),然后选中红色框所示四列数据,点击isoplot 3。
于是,如下图所示
点击OK之后,
继续OK之后
点击确定
点击是
选择要显示数据,点击OK,完成。
加权平均年龄
选用Pb206/U238年龄和其误差,放在一起。
点击Isoplot 3
点击OK
选择需要的显示方式,点击OK即可。

同位素稀释-热电离质谱U-Pb 测年方法简介
同位素稀释-热电离质谱(简称ID-TIMS)法是对锆石、斜锆石、金红石、独居石、磷灰石和锡石等含铀矿物进行U-Pb同位素年龄测定的经典方法。
自二十世纪八十年代以来,天津地质矿产研究所同位素实验室李惠民研究员从澳大利亚国立大学引进这一方法,成功建立了单颗粒锆石U-Pb年龄的ID-TIMS分析方法。
近年来,这一方法陆续被应用于斜锆石、金红石、独居石、磷灰石和锡石等含铀矿物的U-Pb同位素年龄测定。
其方法要点是:用化学方法(通常用氢氟酸、盐酸和硝酸等化学试剂)将待测矿物在适当的温压条件下溶解。
溶解前通常需加入定量的205Pb-235U混合稀释剂或208Pb-235U混合稀释剂。
矿物溶解后,需用离子交换柱将U和Pb分别从样品溶液中分离出来,然后在TRITON热电离质谱上进行U和Pb同位素测定,经计算得到矿物的U-Pb同位素年龄。
利用ID-TIMS法进行含铀矿物U-Pb同位素年龄测定的优点是单次测定的精度较高,可测定的矿物年龄范围较广(从中新生代到太古代),而且不需要相应的标准矿物作校正,避免了寻找和制备标准矿物的困难。
因此,ID-TIMS法被称为矿物U-Pb同位素年龄测定的“标准方法”。
这一经典方法在精确测定关键地层时代和定标具有重要的科学意义,目前国内只有本实验室具备这样的实验条件,国内地质学家应用这一技术准确测定了我国许多重要地质体的U-Pb同位素年龄,为我国地学基础理论研究和区域地质调查工作提供了扎实的基础资料,为精确厘定变质作用、沉积作用、成岩成矿作用时代提供了较好的技术支持。
锆石u-pb同位素定年的原理,方法及应用
锆石U-Pb同位素定年是一种广泛使用的放射性同位素定年方法,应用于地质科学中,用于测定岩石、矿物的年龄。
以下是其原理、方法和应用:
原理
锆石晶体中自然存在的微量铀和钍,通过自然放射性衰变过程,最终分别转变为稳定的铅同位素。
锆石U-Pb同位素定年,即利用锆石中铀和铅之间的放射性衰变关系,测定锆石的年龄。
具体来说,是利用锆石晶体中铀(^238U)自然放射性衰变成铅(^206Pb),以及钍(^232Th)自然放射性衰变成铅(^208Pb)的过程中释放出的α粒子造成的连锁反应计算锆石形成的时间。
方法
锆石U-Pb同位素定年的方法通常有两种:碰撞法和非碰撞法。
碰撞法利用离子束将样品表面剥蚀,将离子轰击区域的同位素进行测量。
非碰撞法则是利用激光将样品表面打在一个小点上,使表面物质的离子化并被聚焦和加速,最终进行同位素测量。
应用
锆石U-Pb同位素定年可用于测定岩石和矿物的年龄、形成时期等,并广泛应用于地质学、矿床学、构造地质学等领域。
例如,在岩石学中,可以通过锆石U-Pb同位素定年来了解岩石的形成历史和演化过程;在矿床学中,可以通过锆石U-Pb同位素定年来确定矿床形成的年龄和矿床类型;在构造地质学中,可以通过同位素定年来研究大地构造演化过程等方面。
同时,锆石U-Pb同位素定年也可以与其他定年方法相结合,以提高年代学的精度和可靠性。
做协和图
首先,加载宏Isoplot 3,工具-加载宏-浏览- Isoplot 3-确定-确定
打开excel文档,选用比值数据处理,先看样品的Pb206/U238年龄,年龄大于1000则选用Pb207/Pb206和Pb206/U238比值,年龄小于1000的用Pb207/U235和Pb206/U238比值。
示例如下:
以MHBU51-2为例:由于样品年龄大致在270Ma左右,因此选用用Pb207/Pb206和Pb206/U238比值,将用Pb207/Pb206和Pb206/U238比值和各自的误差如图排列(Pb206/U238比值和误差始终排在后方),然后选中红色框所示四列数据,点击isoplot 3。
于是,如下图所示
点击OK之后,继续OK之后
点击确定点击是
选择要显示数据,点击OK,完成。
加权平均年龄
选用Pb206/U238年龄和其误差,放在一起。
点击Isoplot 3
点击OK
选择需要的显示方式,点击OK即可。