雅思写作Task1柱状图考官范文(7)
- 格式:doc
- 大小:24.00 KB
- 文档页数:2
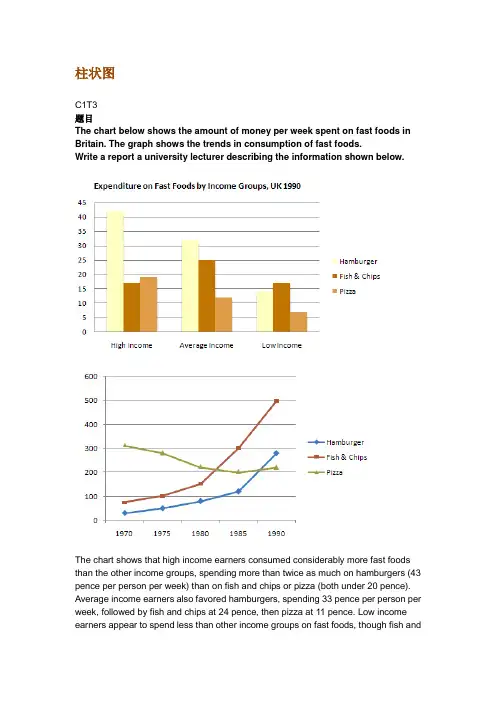
柱状图C1T3题目The chart below shows the amount of money per week spent on fast foods in Britain. The graph shows the trends in consumption of fast foods.Write a report a university lecturer describing the information shown below.The chart shows that high income earners consumed considerably more fast foods than the other income groups, spending more than twice as much on hamburgers (43 pence per person per week) than on fish and chips or pizza (both under 20 pence). Average income earners also favored hamburgers, spending 33 pence per person per week, followed by fish and chips at 24 pence, then pizza at 11 pence. Low income earners appear to spend less than other income groups on fast foods, though fish andchip remains their most popular fast food, followed by hamburgers and then pizza. From the graph we can see that in 1970, fish and chips were twice as popular as burgers, pizza being at that time the least popular fast food. The consumption of hamburgers and pizza has risen steadily over the 20 year period to 1990 while the consumption of fish and chips has been in decline over that same period with a slight increase in popularity since 1985.分析:题目The chart below shows the amount of money per week spent on fast foods in Britain. The graph shows the trends in consumption of fast foods.两句话,两个图第一段The chart shows that high income earners consumed considerably more fast foods than the other income groups, spending more than twice as much on hamburgers (43 pence per person per week) than on fish and chips or pizza (both under 20 pence).•说明了高收入人群的两个特点,第一是消耗快餐最多,第二是人群中hamburger, fish and chips, pizza的特点•spending more than twice as much on hamburgers than on fish and chip and chips or pizza 这是一句令人费解的句子,含义应为“消耗的汉堡是薯片或匹萨的两倍多”,应用的句型应当为典型的表示倍数关系的句型“n times as…as”,比如✓This airplane flies two times as fast as that one. 这家飞机的飞行速度是那架的两倍。
雅思英语柱状图作文Title: Analyzing the Trends in [Your Topic] Through a Bar Chart.In this essay, we will delve into the intricacies of [Your Topic], examining the patterns and trends revealed through a bar chart. The chart presents valuable insights into the distribution and comparison of various categories, highlighting significant differences and similarities across the dataset.Firstly, let's take a moment to appreciate the simplicity yet effectiveness of the bar chart. It's a popular visualization tool that enables quickidentification of patterns and trends. In this case, the chart effectively illustrates the distribution of [specific data points] across [different categories or time periods]. The vertical bars represent the quantitative values, while the horizontal axis labels provide context and categorization.At first glance, the chart reveals some intriguing patterns. The tallest bar, representing [specific category or data point], stands out as the most prominent,indicating a significant concentration of [specific value or trend]. This is particularly noteworthy given the significant gap between this bar and the others, suggesting a clear leader in the dataset.Contrastingly, the shorter bars towards the left of the chart indicate lower concentrations or values in those categories. It's interesting to note that even though these categories may not be as dominant, they still play an important role in the overall distribution. They contribute to the diversity and balance of the dataset, providing valuable insights into the nuances of [Your Topic].When comparing the bars side by side, we can observe patterns and trends across categories. For instance, the steady increase in the heights of bars from left to right suggests a gradual growth or increase in [specific value or trend] over time. Conversely, a sudden dip in the barheights might indicate a sudden change or event that affected the distribution.The spacing between the bars also provides valuable insights. Wider gaps suggest larger disparities between categories, indicating that certain categories are more distinct and separate from others. Narrower gaps, on the other hand, suggest closer relationships or similarities between categories, indicating a more uniform distribution across the dataset.The color scheme chosen for the chart further enhances its readability and visual appeal. The contrasting colors make it easy to distinguish between different categories, while the neutral background does not distract from the main focus of the chart. This attention to detail ensures that the chart is both visually appealing and functionally effective.In conclusion, the bar chart presents a comprehensive overview of [Your Topic], revealing patterns and trendsthat would be difficult to discern from raw data. It allowsus to quickly identify the most prominent categories and values, while also providing insights into the relationships and similarities between different datasets. This analysis is crucial for understanding the nuances of [Your Topic] and making informed decisions based on empirical evidence.Moreover, the chart encourages further exploration and analysis. It acts as a starting point for deeper investigations into the factors that influence the distribution and trends observed. By examining the chart closely and asking pertinent questions, we can gain a deeper understanding of the underlying mechanisms and factors that shape [Your Topic].In summary, the bar chart is a powerful tool for visualizing and analyzing data. It enables us to identify patterns and trends, compare categories, and make informed decisions based on empirical evidence. By leveraging this tool effectively, we can gain a deeper understanding of [Your Topic] and use this knowledge to guide our future actions and decisions.。
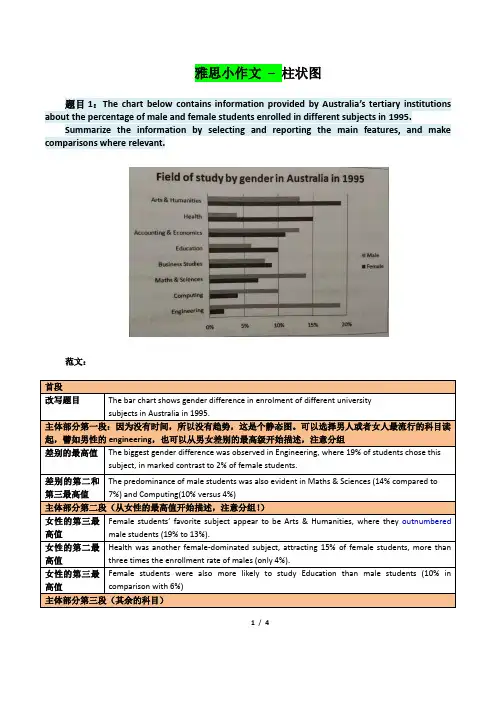
雅思小作文–柱状图题目1:The chart below contains information provided by Australia’s tertiary institutions about the percentage of male and female students enrolled in different subjects in 1995.Summarize the information by selecting and reporting the main features, and make comparisons where relevant.范文:1/ 4题目2:The chart below contains information about USA marriage and divorce rates between 1970 and 2000, and the marital status of adult Americans in two of the years.Summarize the information by selecting and reporting the main features, and make comparisons where relevant.2/ 4读图:动态图【因为有时间】,需要描述变化趋势These two graphs illustrate the change of marital status of American between 1970 and 2000.【改写题目】According to the first graph,there were 2.5m marriages in both 1970 and 1980, and then this figure decreased gradually during the next two decades, reaching to 2m in 2000. By comparison, the number of divorces first increased from 1m in 1970 to around 1.4 in 1980 and then slowly declined back to 1m in 2000.【分类描述第一幅柱状图,时态:一般过去时】As can be seen from the second bar chart,the percentage of married American adults dropped by more than 10% , from 70% in 1970 to less than 60% in 2000. Meanwhile, the percentage of adult Americans who were never married increased from about 15% in 1970 to20% in 2000, and despite still less than 10% , the proportion of divorced adults significantly went up from 1970 to 2000. Moreover, the percentages of the widowed in 1970 and 2000 accounted for less than 10% respectively, and showed a slight drop.【分类描述第二幅柱状图,时态:一般过去时】In conclusion, marital status of Americans in 2000 was not as optimistic as that of three decades ago. (1781.如果有两幅图表,则分成2段分别一一描述2.表示数值上升下降的常用句式有:•The number of …dropped from … to …•The percentage of …increased from about … to less than…•The proportion of … significantly went up from … to …3.切忌没有结论。
雅思写作小作文范文雅思写作柱状图bar chart 影响工作表现的因素今天我们雅思写作小作文范文的文章来研究下柱状图bar chart。
该图表展示的内容为某大型公司人力资源部门所进行的调查研究的结果,即影响工人表现的因素有哪些。
该研究的对象为两组工人,一组年龄分布在18到30岁,另一组年龄位于45到60岁之间。
小编搜集了一篇高分范文,以供大家参考。
雅思写作小作文题目The bar chart below shows the results of a survey conducted by a personnel department at a major company.Summarise the information by selecting and reporting the main features, and make comparisons where relevant.雅思写作小作文范文The bar graph shows the results of a survey which was conducted by a company and gives data on the important factors that determine the work performance of employees. As is observed, chances for personal development, relaxed working environment, opportunities for promotion and salary are the main motivating factors for young people for their work performance while comparatively aged people’s work performance is affected by the factors like money, competent boss and team spirit.该柱状图展示了某公司进行的调查研究的结果,并给出了决定员工工作表现的重要因素。
英语考试作文8日雅思写作考试小作文范文:柱状图The chart below shows the heath spending among five different countries in 2002本题属于静态柱图。
柱子的数目比较多,且每个国家类别中柱子的分布特征也大同小异。
因此考生在处理数据时,务必对比分析不同国家对于同一个项目支出比例的差别。
此外还需多多观察不同项目支出之间的关系,以便突出强调图形最大的特征(数值重点)经典传送门:考官simon 9分写作大小范文共80篇大赏真题传送门:2017全年雅思写作真题范文大汇总(第一时间更新)范文:The bar chart compares the proportion for health expenditure of GDP in five nations in the year 2002.Overall, it is obvious that apart from USA, the percentage of public funding was higher than that of theprivate one among other four countries. And the distinction between these two categories in France was the biggest.Compared with people living in other nations, American themselves paid more for medical bills, reaching 12%; on the contrary, Japanese and French only had to shoulder about 2% of medical cost. As for Germany, they spent a little more than Italian.Referring to public spending, it is interesting to notice that USA also allocated the most proportion for healthcare, at approximately 10%, almost tripled that in Japan whose public spending was the least. German’s public spending ranked the second place ( 9%), which was the same as its ranking in terms of private funding.According to the data illustrated above, we can clearly see that the total spending in USA was the highest, while in Japan was the lowest. Besides, France and German stood at the same ranking.原创来自小站范钰红老师 183 words。
雅思小作文柱形图真题英文回答:The bar chart illustrates the percentage of people in different age groups who participated in various leisure activities in a particular country. Overall, it can be observed that younger people tend to engage in more physical activities, while older individuals prefer more sedentary leisure activities.Looking at the data in more detail, it is evident that the highest percentage of individuals participating in physical activities is in the 18-24 age group, with approximately 80% of them engaging in sports. This could be attributed to the fact that younger people are generally more energetic and physically active. For instance, many young adults enjoy playing football, basketball, or going to the gym to stay fit.In contrast, the percentage of people participating inphysical activities decreases as age increases. In the 45-54 age group, only around 50% of individuals are involved in sports. This decline could be due to various factors, such as physical limitations or work commitments. For example, middle-aged adults often have demanding jobs and less free time to dedicate to sports activities.Moving on to sedentary leisure activities, the highest percentage of individuals engaged in reading can be observed in the 55-64 age group, with approximately 70% of them reading books or magazines. This could be because older individuals have more leisure time and enjoy the relaxation and mental stimulation that reading provides. For instance, many retirees find pleasure in reading novels or keeping up with current affairs through newspapers.In conclusion, the bar chart demonstrates that younger people are more likely to participate in physical activities, while older individuals prefer sedentaryleisure activities such as reading. These findings can be attributed to factors such as age-related physical limitations, work commitments, and personal preferences. Itis important to note that these trends may vary across different countries and cultures.中文回答:这个柱状图展示了不同年龄段的人参与各种休闲活动的百分比。
雅思柱状图小作文写作模板雅思小作文柱状图是考试中最常见的一类图形,柱状图如何描述写成为大家棘手的问题。
下面为大家分享雅思柱状图小作文写作模板。
大家可以参考学习。
雅思柱状图写作模板1The bar chart compares the proportion of employees of both genders employed in executive positions in ACNE Oil Company within a one-year period between July 1993 and June 1994.As can be seen from the chart, the percentage of male employees generally increased with the rise of the job categories from Grade E to Grade A while the opposite was true with that of women.Grade A, which was reported as the highest position, was a male dominated one in which only one-tenth of the staff were female while male employees accounted for the rest.When it comes to Grade B and C, men also took up over half of the employees, accounting for 80% and 60%, which are 50% and 10% higher than that of women respectively.However, the situation in the other two jobs categories, which were relatively lower in rank, was totally reversed, with women taking up relatively larger proportion. Men constituted roughly 40% in Grade D, 20% less than that if women and most of the working staff in Grade E were women (over 70%) , twice the percentage of men.To sum up, on the rank ladder of ACME Oil Company, male employees took up a higher and higher proportion than the weaker sex as it gradually went up to the peak -------- Grade A.雅思柱状图写作模板2The chart below shows the amount of money per week spenton fast foods in Britain. The graph shows the trends in consumption of fast foods.Write a report for a university lecturer describing the information shown below.柱状图显示的是1970-1990二十年间英国人每周在快餐上花费了多少钱;曲线图展示的是这二十年间快餐消费的趋势。

雅思写作Task1柱状图考官范文(7)(最新版)编制人:__________________审核人:__________________审批人:__________________编制学校:__________________编制时间:____年____月____日序言作文(composition)是经过人的思想考虑和语言组织,通过文字来表达一个主题意义的记叙方法。
作文分为小学作文,中学作文,大学作文(论文)。
作文体裁包括:记叙文、说明文、应用文、议论文。
作文并不神秘,要想写好一篇文章,首先要多看,多想,勤于观察,积累素材。
只有细致的观察生活,积累素材才是写好作文的基础。
首先要明确你要写的主题,认真的审题,列出大纲,不要只注意题目中要求的字有多少,要多注意题目的本身,要多读多想,准确的用好词语和修饰语。
这是审题的关键,要确立好主题的依据,要精心的选材,布局列题,有的材料,还要分析整理。
这就要对材料进行分类,比较,概括,筛选。
我们不要象盖房子那样的把所有的材料都堆砌起来,要合理恰当的组合,具体的说开头和结尾要略写,那么经过就要仔细的推敲,修辞,润色,写好以后不要急于交稿,反复检查认真的修改。
古人说:书读百遍,其义自见。
熟读唐诗三百首,不会作诗也会吟。
这些都说明一个道理,只要你多看书,多读书对你的写作文有一定的好处。
只要你明白这样的一个道理,作文就是要你把生活中喜,怒,哀,乐用文字经过加工,修饰。
整理,也就是我们说的作文。
作文内容英语作文啦 雅思频道特为大家收集整理了雅思写作Task1柱状图考官范文(7)。
认真研读一定的雅思范文及作文模板可以帮助我们检验自己的写作水平,并能很好地吸收和应用优秀范文里的优秀内容~The chart below shows estimated world illiteracy rates by region and by gender for the year 2000.Write a report for a university lecturer describing the information below.Sample Answer:The given bar chart shows the approximate world illiteracy rates by gender and region for the year 2000. As is observed in the given column graph, in all cased, the illiteracy rate among women is higher than men. Developed countries have almost ignorable illiteracy rate and in the contrary, about half of the population in south Asia, Arab states and Africa are illiterate.The illiteracy rate in Latin America / Caribbean and East Asia / Oceania is only 1 percent (approximately), 10 percent and 14 percent (approximately) respectivelyconsidering both male and female. Sub-Saharan Africa, the Arab States and South Asia had rates of approximately 40%, 41% and 45%. Illiterate women are higher than the illiterate men in all the given countries.In the developed countries, the proportion of literacy among men and female is almost similar but the differences increased for Asia, Arab states and Africa. Among the given 6 countries, South Asian population are far more illiterate than any other country.(Approximately 163 words)(This model answer can be followed as an example of a very good answer. However, please note that this is just one example out of many possible approaches.)。
雅思写作小作文范文雅思写作柱状图bar chart 学习背后的原因今天我们雅思写作小作文范文的文章来研究下柱状图bar chart。
第一张图展示了不同年龄段的人们选择进一步学习的理由,对比究竟是出于兴趣多一些还是出于职业考虑多一些。
第二张图给出了其资金来源的信息,比较是自费的多一些还是雇主支持的多一些。
小编搜集了一篇相应的考官范文,以供大家参考。
雅思写作小作文题目The charts below show the main reasons for study among students of different age groups and the amount of support they received from employers.Summarise the information by selecting and reporting the main features, and make comparisons where relevant.雅思写作小作文范文The bar charts compare students of different ages in terms of why they are studying and whether they are supported by an employer.柱状图比较了不同年龄学生学习的原因,以及他们是否被其雇主所资助。
It is clear that the proportion of students who study for career purposes is far higher among the younger age groups, while the oldest students are more likely to study for interest. Employer support is more commonly given to younger students.很明显,因为职业目的学习的学生比例在年轻人中远高于其他类别,而年纪最大的学生更多的是出于兴趣去学习。
雅思写作小作文范文雅思写作柱状图bar chart 通话时间今天我们雅思写作小作文范文的相关文章来研究下柱状图。
题目为剑桥雅思9上的一道原题,但书籍后面并没有给出参考范文。
因此我们找到了一篇考官写的文章,以供大家参考,看看考官是怎么在不同数据中进行取舍并分组的。
雅思写作小作文题目The chart below shows the total number of minutes (in billions) of telephone calls in the UK, divided into three categories, from 1995-2002.Summarise the information by selecting and reporting the main features, and make comparisons where relevant.雅思写作小作文范文The bar chart compares the amount of time spent by people in the UK on three different types of phone call between 1995 and 2002.这个柱状图比较了从1995年到2002年英国人在三种不同类型的通话方式上花费的时间。
It is clear that calls made via local, fixed lines were the most popular type, in terms of overall usage, throughout the period shown. This article is from Laokaoya website. Do not copy or repost it. The lowest figures on the chart are for mobile calls, but this category also saw the most dramatic increase in user minutes.很显然,在图中所展示的时期内,通过本地固话拨打电话是最受欢迎的类型。

雅思4类图表作文范文
一、柱状图。
哇塞,看这柱状图,某城市的私家车数量可是像火箭一样往上
冲啊!五年前才5万辆,现在直接飙到15万辆了,涨得比房价还快!不过话说回来,公共交通那边就不太好过了,以前每天80万人次,
现在只剩下60万了,看来大家都更喜欢自己开车出门啊。
二、折线图。
话说这折线图,看得我心情都跟着起伏了。
那国家失业率啊,
前几年涨得跟股票似的,从4%一路飙升到6%,让人看了都捏把汗。
不过好在后来稳住了,还往下掉了点,虽然没回到从前,但好歹也
算个好兆头吧。
雅思考试 复习TASK 1- 2 -柱状图1.The chart below shows the total number of minutes (in billions) of telephone calls in theUK, divided into three categories, from 1995—2002.The chart shows the time spent by UK residents on different types of telephone calls between 1995 and 2002.Local fixed line calls were the highest throughout the period, rising from 72 billionminutes in 1995 to just under 90 billion in 1998. After peaking at 90 billion the following year, these calls had fallen back to the 1995 figure by 2002.National and international fixed line calls grew steadily from 38 billion to 61 billion at the end of the period in question, though the growth slowed over the last two years.There was a dramatic increase in mobile calls from 2 billion to 46 billion minutes. This rise was particularly noticeable between 1999 and 2002, during which time the use of mobile phones tripled.To sum up, although local fixed line calls were still the most popular in 2002, the gap between the three categories had narrowed considerably over the second half of the period in question.- 3 -2.The chart below shows the percentage of male and female teachers in six differenttypes of educational setting in the UK in 2010.Summarise the information by selecting and reporting the main features, and make comparisons where relevant.The bar chart gives information about the gender of teachers in six types ofeducational institutions in the UK in 2010. It shows what percentage of teachers was male and what percentage was female.Women dominated the teaching profession in primary education, but less so at lower and upper secondary education. It was particularly true of nursery school, where the share of female teachers was above 95%. Similarly one-sided was the situation inprimary school, where over 90% of teachers were also female.At secondary and upper secondary level this pattern was less pronounced, wherethere were nearly equal proportions of male and female teachers. On the other hand,male teachers outnumbered female teachers in high-level education, where theproportion of men was twice that for women.Overall, the higher the level of education, the more male teachers dominated, and the reverse occurred with respect to female teachers.- 4 -曲线图1.Write a report for a university lecturer describing the information in the graph.●You should write at least 150 words.●You should spend about 20 minutes on this task.Consumption of Fast Food in the UKThe graph shows changes in the amount of fast food consumed in the UK between 1970 and 1990. Several trends are apparent. First, Britons are eating more and more fast food. Secondly, the type of fast food has changed.In 1970, the most popular fast food was fish and chips. Over 300g were consumed each week. By 1990, however, this had fallen to just over 200g - a 50% drop. Consumption of other fast foods such as pizza and hamburgers increased, however. The amount of pizza eaten shot up from about 20g a week to more than 270g, overtaking fish and chips in the late 1980s. Hamburger consumption also increased, rising from about 80g in 1970 to almost 300g in 1990.Accompanying this change in the choice of foods was an increase in the amount of fast food consumed. In 1970, British consumers ate about 450g a week of fast food. In 1990, on the other hand, this had more than doubled, to 1000g.- 5 -2.The line graph below gives information on cinema attendance in the UK.Write a report for a university lecturer describing the information given.●You should write at least 150 words.●You should spend about 20 minutes on this task.The given line graph illustrates information on the percentage of people who went to the movies in the United Kingdom between 1990 and 2010. The people's attendance is divided into four different age groups.Overall, younger people seemed to, and are predicted to, be more active in movie going than their older counterparts. However, all four age groups showed a gradual increase in attendance numbers during the given period, except for a slight drop between 1995 and 2000.To be specific, a larger percentage of people between the ages of 24 and 34 went to, and are expected to, go to the cinema than those in any other age group. Approximately 51% of the respondents from this age group are expected to attend movies in 2010 compared with only 38% in 1990. Even in the group that had the smallest number of movie goers, those between the ages of 44 and 54, there was an increase of 6% in their attendance.- 6 -表格图1.The table below shows the proportion of different categories of families living in povertyin Australia in 1999. Summarise the information by selecting and reporting the main features, and make comparisons where relevant.●You should write at least 150 words.●Allow yourself 20 minutes for this task.Family type Proportion of people from each household type living in povertysingle aged person aged couple single, no children couple, no children sole parentcouple with children all households6% (54,000) 4% (48,000) 19% (359,000) 7% (211,000) 21% (232,000) 12% (933,000) 11% (1,837,000)The table gives a breakdown of the different type of family who were living in poverty in Australia in 1999.On average, 11% of all households, comprising almost two million people, were in this position. However, those consisting of only one parent or a single adult had almost doubt this proportion of poor people, with 21% and 19% respectively.Couples generally tended to be better off, with lower poverty levels for couples without children (7%) than those with children (12%). It is noticeable that for both types of household with children, a higher than average proportion were living in poverty at this time.Older people were generally less likely to be poor, though once again the trend favoured eldery couples (only 4%) rather than single eldery people (6%).Overall the table suggests that households of single adults and those with children were more likely to be living in poverty than those consisting of couples.- 7 -2.The table below shows the average band scores for students from different languagegroups taking the IELTS General Test in 2010.Summarise the information by selecting and reporting the main features, and make comparisons where relevant.●You should write at least 150 words.●Allow yourself 20 minutes for this task.Listening Reading Writing Speaking OverallGerman 6.8 6.3 6.6 6.9 6.7French 6.3 6.1 6.5 6.6 6.5Indonesian 6.3 6.1 6.1 6.7 6.3Malay 6.2 6.4 6.0 6.6 6.4The table illustrates the breakdown of scores for the IELTS General Test in 2010. It shows separate scores for all four sections (Listening, Reading, Writing and Speaking), together with the overall score for students from four different language groups around the world.From an overall perspective, German speakers achieved the highest grades with an average score of 6.7 across all four sections. Moreover, they scored the highest of all four language groups in three sections of the four sections (Listening, Writing, Speaking).French speakers scored the second highest scores overall, closely followed by Malay and Indonesian speakers. Although French speakers did not do so well in the Reading, Speaking and Listening sections compared to Indonesian and Malay speakers, there was a significant difference in their grades for the Writing section. These grades were high relative to Indonesian and Malay candidates. Surprisingly, Malay speakers, who achieved the second lowest results overall, achieved the highest results of all four language groups for the Reading section.As a final point, it is interesting to note that the scores for each section show that all students on average scored the highest marks for the Speaking section and the lowest marks for the Reading section.- 8 -- 9 -饼状图1. The two graphs show the main sources of energy in the USA in the 1980s and the 1990s.Write a report for a university lecturer describing the changes which occurred. ● You should write at least 150 words. ● Allow yourself 20 minutes for this task.The two graphs show that oil was the major energy source in the USA in both 1980 and 1990 and that coal, natural gas and hydroelectric power remained in much the same proportions. On the other hand, there was a dramatic rise in nuclear power, which doubled its percentage over the ten years.Oil supplied the largest percentage of energy, although the percentage decreased from 42% in 1980 to 33% in 1990. Coal in 1990 was the second largest source of energy,increasing its proportion to 27% from 22% in the previous decade. Natural gas, the second largest source in 1980 at 26%, decreased its share very slightly to provide 25% of America’s energy ten years later. There was no change in the percentage supplied by hydroelectric power which remained at 5% of the total energy used. Nuclear power the greatest change: in 1990 it was 10%, twice that of the 1980s.2.The pie charts below show the online sales retail sectors in New Zealand.The two pie charts compare the percentage of online sales across different retailsectors in New Zealand in the years 2003 and 2013.For three of the sectors, it is evident that over this time frame there was significant change in their proportion of online transactions.At 36% we can see that the travel sector accounted for the majority of online sales in 2003, but this percentage had dropped to 29% by 2013.Across the same ten-year period, as an increasing number of people chose topurchase films and music online, we can see that transactions went from just 21% to 33%, making it the retail sector with the highest overall share of the online market.In 2003, the clothing industry boasted an impressive 24% of total online sales in New Zealand. However, by 2013, the figure had fallen considerably to 16%.Interestingly, online sales of books eventually overtook sales of clothes, although books still represented only 22% of the market.- 10 -地图题1.The map below is of the town of Garlsdon. A new supermarket (S) is planned for thetown. The map shows two possible sites for the supermarket.The map shows two proposed locations for a new supermarket for the town ofGarlsdon.The first potential location (S1) is outside the town itself, and is sited just off the main road to the town of Hindon, lying 12 kms to the north-west.This site is in the countryside and so would be able to accommodate a lot of carparking. This would make it accessible to shoppers form both Hindon and Garlsdon who could travel by car. As it is also close to the railway line linking the two towns to Cransdon (25 km to the south-east), a potentially large number of shoppers would also be able to travel by train.In contrast, the suggested location, S2, is right in the town center, which would be good for local residents. Theoretically the store could be accessed by road or rail from the surrounding towns, including Bransdon, but as the central area is a no-traffic zone, cars would be unable to park and access would be difficult.Overall, neither site is appropriate for all the towns, but for customers in Cransdon, Hindon and Garlsdon, the out-of-town site (S1) would probably offer moreadvantages.2.The diagram below shows the development of the village of Kelsby between 1780 and2000.The maps describe the development of the village of Kelsby from 1780 to 2000.In 1780, Kelsby had only 100 homes. There were a large expanse of woods in theeastern part of the village and four plots of farmland in the centre. A river was in the west which flowed from north to south.The year 1860 saw a doubling of the number of homes, but the size of farmland and woods was halved. In the same year, a bridge was constructed over the river and a road was paved linking the river to the residences.140 years later, the number of homes more than doubled to 500, but farms and woods were replaced by several school buildings and sports facilities, which were linked with the residential areas in the north via a newly-built road. Some shops opened up along the river bank and a large stretch of wetland for birds was established at the southern end of the river.流程图1.The diagram below shows the process by which bricks are manufactured for thebuilding industry.The process by which bricks are manufactured for the building industry can be outlined in seven consecutive steps. First the raw material, clay, which was just below thesurface of soil in certain clay-rich areas has to be dug up by a digger.Then the lumps of clay are placed on a metal grid in order to break up the big chunks of clay into much smaller areas, which fall through the metal grid onto a roller, whose motion further segregates the bits of clay. Sand and water are added to make ahomogenous mixture, which is then either formed in moulds or cut into brick-shaped pieces by means of a wire cutter.Those fresh bricks are then kept in a drying oven for at least 24 and a maximum of 48 hours, several dozens if not hundreds of bricks at a time. The dried bricks are thentransferred to a so-called kiln, another type of high temperature oven. First they are kept at a moderate temperature of 200 ℃-1300 ℃ . This process is followed bycooling down the finished bricks for 48 to 72 hours in a cooling chamber.Once the bricks have cooled down and have become hard, they get packaged and delivered to their final destination, be it a building site or storage.2.The flowchart below shows the process involved in completing the work experiencerequirement for university students.Fulfilling the Work Experience RequirementCredits will be awarded when the final report issubmitted.ApplicationChoose potential workplaces from approved listand arrange interviews. Submit applications toplaces of interest.ApprovalWhen acceptance letter is received, submit it toprofessor for approval.ScheduleArrange schedule to work a minimum of 10hours/ week over 20 weeks.ReportsComplete weekly Report Form and submit toprofessor every Friday.EvaluationDuring final workweek, participate in evaluationmeeting with work supervisor. Supervisor submitsEvaluation Form.Final ReportSubmit Final Report before last week of springterm.Gaining work experience prior to graduation helps university students to succeed in getting their first job. For this reason, some universities insist that all students must complete a Work Experience Requirement. Completing the following six stages results in the requirements’ fulfillment.The process begins with the Application stage. A student reviews an approved list of workplaces and submits applications to places where he would like to work. Next is the Approval stage. When a student receives an acceptance letter, he gives it to the professor for approval. The third stage, Schedule, requires a student to arrange his work schedule. The student should work at least 10 hours/week over 20 weeks. Reports are next. The student must complete a Weekly Report Form and turn it in to the professor every Friday.The fifth stage, Evaluation, takes place during the final work week. A student participates in an evaluation meeting with his work supervisor, who submits an Evaluation Form. The last stage requires that a student submit a Final Report before the last week of spring semester.By following these stages and subsequently submitting the final report, the student receives credit from the university.组合图1.Write a report for a university lecturer describing the information below.●You should write at least 150 words.●You should spend about 20 minutes on this task.The graphs show health and education spending and changes in life expectancy and infant mortality in the UAE. Overall, as the percentage spent on health and education increases, infant mortality and life expectancy improve.Graph 1 shows the percentage of GDP spent on health and education between 1985 and 1993. There were big increases in both areas. Health spending stood at about 8% in 1985 but rose to 9% in 1990 and 10% in 1993. Spending on education was even higher. It was 10% in 1985, and shot up to 14% in 1990 and 15% in 1993, a 50% increase in just 8 years.Graph 2 shows improvements in life expectancy and infant mortality between 1970 and 1992. Life expectancy was just 60 in 1970 but rose to almost 72 in 1992. In contrast, the number of babies dying dropped dramatically, from 60 per 1000 in 1970 to only 22 in 1992. In conclusion, people in the UAE are living longer and healthier lives because of the government's spending on education and medical facilities.2.The chart below shows the amount of money per week spent on fast foods in Britain.The graph shows the trends in consumption of fast foods.Write a report for a university lecturer describing the information shown below.●You should write at least 150 words.●You should spend about 20 minutes on this task.The chart shows that high income earners consumed considerably more fast foods than the other income groups, spending more than twice as much on hamburgers (43 pence per person per week) than on fish and chips or pizza (both under 20 pence). Average income earners also favoured hamburgers, spending 33 pence per person per week, followed by fish and chips at 24 pence, then pizza at 11 pence. Low income earners appear to spend less than other income groups on fast foods, though fish and chips remains their most popular fast food, followed by hamburgers and then pizza.From the graph we can see that in 1970, fish and chips were twice as popular as burgers, pizza being at that time the least popular fast food. The consumption of hamburgers and pizza has risen steadily over the 20 year period to 1990 while the consumption of fish and chips has been in decline over that same period with a slight increase in popularity since 1985.TASK 2TASK 2 必备议论文——政府1.Most writers of fiction do not earn enough money to live from their writing.Do you think the government should give them financial assistance to help encourage good literature?●You should write at least 250 words.●You should spend about 40 minutes on this task.●You should give reasons for your answer using your own ideas and experience. There are some conditions under which a novelist could reasonably expect some government support. In general terms, if the writer has already proved that he or she can write well, and if the stories produced are stimulating and interesting, then I consider that some financial help might be given.Language quality is difficult to define, but if the writing shows, for example, good grammar, a wide vocabulary, and elegance and imagination, then I can see a valid reason for assisting an author to spend some time free from money problems. Such as writing needs to be encouraged. The entertainment value of a book would be also a factor in deciding whether to provide assistance to an author. Further consideration would include social and educational values expressed in the author's work.However, if the ideas were socially irresponsible, or if the stories contain unnecessary violence or pornography for its own sake, then I would not want to see the author sponsored to write stories which do not benefit society. Other exceptions are the many writers of good books who do not require financial help. Books which proved to be extremely popular, such as the Harry Potter stories, clearly need no subsidy at all because the authors have become rich through their writing.Views on what good quality writing means will vary widely, and so if any author is to be given money for writing, then the decision would have to be made by a committee or panel of judge. An individual opinion would certainly cause disagreement among the reading public.2.Some governments say how many children a family can hare in their country. Theymay control the number of children someone has through taxes. It is sometimesnecessary and right for a government to control the population in this way.Do you agree or disagree?Give reasons for your answer.●You should write at least 250 words.●Allow yourself 40 minutes for this task.It is certainly very understandable that some governments should start looking at ways of limiting their populations to a sustainable figure. In the past, populations were partly regulated by frequent war and widespread disease, but in recent years the effects of those factors have been diminished. Countries can be faced with a population that is growing much faster than she nation's food resources or employment opportunities and whose members can be condemned to poverty by the need to feed extra mouths. They identify population control as a mean to raising living standards.But how should it be achieved? Clearly, this whole area is a very delicate personal and cultural issue. Many people feel that this is not a matter for the state. They feel this is one area of life where they have the right to make decisions for themselves. For that reason, it would seem that the best approach would be to work by persuasion rather than compulsion. This could be done by a process of education that points out the way a smaller family can mean an improved quality of life for the family members, as well as less strain on the country's perhaps very limited, resources.This is the preferred way. Of course if this does not succeed within a reasonable time scale, it may be necessary to consider other measures, such as tax incentives or child-benefit payments for small families only. These are midway between persuasion and compulsion. So. yes, it is sometimes necessary, but governments should try very hard to persuade first. They should also remember that this is a very delicate area indeed, and that social engineering can create as many problems as it solvesTASK 2 必备议论文——生态1.Write about the following topic:The earth is being filled with waste material such as plastic bags and other rubbish. Is this really happening? What are some solutions to this problem?●Write at least 250 words.●You should spend about 40 minutes on this task.●Gives reasons for your answer and include any relevant examples from your ownknowledge or experience.Over the past few decades, the increasing amount of industrial wastes and household garbage has become a major problem in many countries. People have questioned what caused this problem and what can be done to improve the situation. In my opinion, two of the most critical causes of this waste material problem are the increased consumption and a shortage of space for landfill.To begin with, modern lifestyle has contributed greatly to the increasing amount of waste and garbage we produce everyday. In other words, we have turned into a materialistic and mass-consumption society where we use more and throw away more than ever before. Moreover, countries are running out of space to store garbage and waste material. In fact, securing land for waste disposal raises controversies in many countries.To solve this intractable problem, every citizen needs to participate in producing less garbage. For example, we can bring our own personal shopping bags instead of using plastic bags provided by stores and shops. Besides, the government can enforce stricter laws on companies to use biodegradable packaging or use recycled material. Indeed, this alone can eliminate much of the waste which is sent to at landfills. Companies can also contribute by developing new raw material which is recyclable and will ultimately lead to less garbage. One good example of this is that tire companies develop new tires for cars which are not made of rubber but of new biodegradable material.As discussed above, individuals, business and the government can share the responsibility to reduce the amount of waste material and to save the earth. I hope that in the future our offspring will be better off with the well-preserved environment.2.Many parts of the world are losing important natural resources, such as forests, animals,or clean water.Choose one resource that is disappearing and explain why it needs to be saved.Use specific reasons and examples to support your opinion.●You should write at least 250 words.●You should spend about 40 minutes on this task.As human's population is dramatically rising every year, people's requirements are increasing too. We need more food, more fresh water, more places to live. As a result of this many parts of the world are losing essential and sometimes irreplaceable resources, such as forest, animals, or fresh water. In this essay I will focus on the threat of disappearing many wild animals.The reason why I think that animals should be preserved is that all living creatures on this planet are connected with each other. So, the disappearance of only one species can cause dramatic changes in the planet and even death of many other living creatures. For example, the disappearance of bats will cause the huge increasing of insect population and this will reflect on all animals and plants. Another example is that if the population of bats increases, the population of insects will decrease significantly, and this will cause the disappearance of many plants because insects are the main pollinators. So, I think it is very important to preserve all species on our planet and live in harmony with our environment.Another important reason why I think that animals should be saved is that I, personally, do not want my child to learn about different animals from books and not be able to see them alive. I think it is shameful for humankind to explain our children that we are the reason why those animals disappeared.In conclusion, I would like to say that the issue about losing important natural resources is topical and open for debate nowadays. I believe that together people can make a difference. From my point of view, the first problem we should find a solution for is human's overpopulation. As I mentioned above people's demands are growing and this means we consume more and more natural resources. The second question, which is on the list of most important issues, is pollution including the air pollution, water pollution, etc.TASK 2 必备议论文——社会1.Some people think that it is important to use leisure time for activities that improve themind, such as reading and doing word puzzles.Other people feel that it is important to rest the mind during leisure time.●You should write at least 250 words.●You should spend about 40 minutes on this task.It is generally accepted that we all need leisure time to recover from the stresses of work and everyday life.Personally, I prefer to be active during this time, as I think this suits me better. However, what we do with our leisure time is up to us and no one can say that any particular activity is the best.Some people relax by watching movies, reading or surfing the internet. People who have physically demanding jobs may choose these types of activities. If you are a nurse or builder, you may feel that you don't want to do a five-kilometre run after work, because you are already physically tired.Other people do very sedentary jobs. Computer analysts, for example, may spend all day sitting in front of a computer screen. At the end of the working day, they may be keen to stretch their limbs and improve their health by swimming or going to the gym.Another factor that influences our choice of leisure pursuit is where we work. People who work indoors often prefer outdoor hobbies, whereas for people who work outdoors, the reverse may be true. I am a student myself and this involves a lot of sitting in lectures, so I need to get out into the fresh air afterwards.In any situation, the important thing is that people need to stay healthy by choosing what is best for them. The only wrong way to spend free time, in my view, is to have a sedentary job and then go home and watch television.。
柱状图C1T3题目The chart below shows the amount of money per week spent on fast foods in Britain. The graph shows the trends in consumption of fast foods.Write a report a university lecturer describing the information shown below.The chart shows that high income earners consumed considerably more fast foods than the other income groups, spending more than twice as much on hamburgers (43 pence per person per week) than on fish and chips or pizza (both under 20 pence). Average income earners also favored hamburgers, spending 33 pence per person per week, followed by fish and chips at 24 pence, then pizza at 11 pence. Low income earners appear to spend less than other income groups on fast foods, thoughfish and chip remains their most popular fast food, followed by hamburgers and then pizza.From the graph we can see that in 1970, fish and chips were twice as popular as burgers, pizza being at that time the least popular fast food. The consumption of hamburgers and pizza has risen steadily over the 20 year period to 1990 while the consumption of fish and chips has been in decline over that same period with a slight increase in popularity since 1985.分析:题目The chart below shows the amount of money per week spent on fast foods in Britain. The graph shows the trends in consumption of fast foods.两句话,两个图第一段The chart shows that high income earners consumed considerably more fast foods than the other income groups, spending more than twice as much on hamburgers (43 pence per person per week) than on fish and chips or pizza (both under 20 pence).•说明了高收入人群的两个特点,第一是消耗快餐最多,第二是人群中hamburger, fish and chips, pizza的特点•spending more than twice as much on hamburgers than on fish and chip and chips or pizza 这是一句令人费解的句子,含义应为“消耗的汉堡是薯片或匹萨的两倍多”,应用的句型应当为典型的表示倍数关系的句型“n times as…as”,比如✓ This airplane flies two times as fast as that one. 这家飞机的飞行速度是那架的两倍。
雅思写作小作文范文雅思写作柱状图离婚与结婚数量今天我们雅思写作小作文范文的相关文章来研究下柱状图。
所谓柱状图即bar chart,是用柱子高低来表示数据多少的一种题型,在雅思写作小作文中非常常见。
我们以美国离婚与结婚数量为主题,给大家准备了一篇考官范文,以供大家学习和参考。
The ?rst bar chart shows changes in the number of marriages and divorces in the USA, and the second chart shows ?gures for the marital status of American adults in 1970 and 2000.第一张柱状图展示了美国结婚与离婚的数量变化,而第二张图则展示了在1970年和2000年这两年里美国成人婚姻状态的相关数据。
It is clear that there was a fall in the number of marriages in the USA between 1970 and 2000. The majority of adult Americans were married in both years. this article is from Laokaoya website, do not copy or repost it. But the proportion of single adults was higher in 2000.很明显,1970和2000年间美国的婚姻数量有所下降。
这两年里,大多数成年美国人都处于婚姻状态,而单身成人的比例在2000年则要高一些。
In 1970, there were 2.5 million marriages in the USA and 1 million divorces. The marriage rate remained stable in 1980, but fell to 2 million by the year 2000. In contrast, the divorce rate peaked in 1980, at nearly 1.5 million divorces, before falling back to 1 million at the end of the period.1970年,美国有二百五十万例的结婚和一百万例的离婚。
The charts below show the levels of participation in education and science in developing and industrialised countries in 1980 and 1990.范文:The three bar charts show average years of schooling, numbers of scientists and technicians, and research and development spending in developing and developed countries. Figures are given for 1980 and 1990.It is clear from the charts that the figures for developed countries are much higher than those for developing nations. Also, the charts show an overall increase in participation in education and science from 1980 to 1990.People in developing nations attended school for an average of around 3 years, withonly a slight increase in years of schooling from 1980 to 1990. On the other hand, the figure for industrialised countries rose from nearly 9 years of schooling in 1980 to nearly 11 years in 1990.From 1980 to 1990, the number of scientists and technicians in industrialised countries almost doubled to about 70 per 1000 people. Spending on research and development also saw rapid growth in these countries, reaching $350 billion in 1990. By contrast, the number of science workers in developing countries remained below 20 per 1000 people, and research spending fell from about $50 billion to only $25 billion.(187 words)。
雅思作文柱状图雅思作文柱状图范文雅思柱状图是动态图表,作文切入点是描述趋势。
下面是店铺整理的'柱状图作文范文,希望能帮到大家!预期寿命This bar chart compares how long people can expect to live in seven different countries.We can see that in each of the seven countries people have a life expectancy of between63 years and 83 years. People will live longest in Canada at 83 years and the United States (81 years), while Bangladesh has the lowest life expectancy at just 63 years. Of the other countries, Turkey, Vietnam, Iran and India all have a similar level close to the average of 73 years.We should also note that women are expected to live longer than men in all these countries. On average, females will live approximately 4 years longer than men, although there are differences here. The greatest difference is in the United States (about 5 years),while in Iran females are expected to live only 2 years longer than men. However, the major exception is Bangladesh where both genders have the same life expectancy.Thus, we can see there are comparisons to be made in life expectancy both in geographical location and gender.澳大利亚的通话The chart shows the time spent by Australian resident on different types of telephone calls between 2001 and 2008.Local fixed line calls were the highest throughout the period,rising from 72 billion minutes in 2001 to just under 90 billion in 2003. After peaking at 90 billion the following year, these calls had fallen back to the 2001 figure by 2008.National and international fixed line calls grew steadily from 38 billion to 61 billion at end of the period in question, though the growth slowed over the last two years.There was a dramatic increase in mobile calls from 2 billion to 46 billion minutes. This rise was particularly noticeable between 2005 and 2008, during which time the use of mobile phones tripled.To sum up, although local fixed line calls were still most popular in 2008, the gap between the three categories had narrowed considerably over the second half of the period in question.人口和财富The chart compares population shares in various regions of the world with the distribution of wealth in these same regions. It can be seen that population shares in almost all cases do not relate to the distribution of wealth.Even though North America has only approximately 6% of the world’s population, it boasts nearly 34% of global wealth. A similar situation can be seen in Europe, which has 15% of the global population but 30% of global wealth, and the rich (high income) Asia-Pa cific countries with 5% of the world’s population but 24% of its wealth.On the other hand, the total wealth of people in China, India, Africa, Latin America and Caribbean, and the other poor (lower income) countries in Asia-Pacific is far less than their shares of the world population. This is most striking in India, where 16% of the world’s population own only 1% of the world’s wealth andin China, which has the highest percentage of global population (24%) but only 3% of the world’s wealth.数码产品销量The bar chart compares the turnover in dollars from sales of video games for four different platforms, namely mobile phones, online, consoles and handheld devices, from 2000 to 2006.It is clear that sales of games for three out of the four platforms rose each year, leading to a significant rise in total global turnover over the 7-year period. Sales figures for handheld games were at least twice as high as those for any other platform in almost every year.In 2000, worldwide sales of handheld games stood at around $11 billion, while console games earned just under $6 billion. No figures are given for mobile or online games in that year. Over the next 3 years, sales of handheld video games rose by about $4 billion, but the figure for consoles decreased by $2 billion. Mobile phone and online games started to become popular, with sales reaching around $3 billion in 2003.In 2006, sales of handheld, online and mobile games reached peaks of 17, 9 and 7 billion dollars respectively. By contrast, turnover from console games dropped to its lowest point, at around $2.5 billion.。
雅思小作文柱状图范文和写法介绍对于柱状图出现的高频情况,每一个烤鸭都十分清楚,bar chart有那么的重要。
那么今天的干货就是告诉你,逐段讲解每一段要写什么!还有怎么写!先来一个例子:The chart shows the expenditure of two conturies on consumer goods in .★首先标题很重要,这是要我们明白这个图的含义。
接下来就要看xy横坐标和纵坐标。
然后有哪些内容今天我们就省略介绍横纵坐标的内容,因为我相信你们都会看,也都知道左边是钱,右边是5种具体的工程。
还有这是两个国家的比拟。
先来看看大体结构:Introduction:改写图的标题“The chart shows the expenditure of two conturies on consumer goods in .〞OverviewBody paragraph 1Body paragraph 2Introduction:The chart illustrates the amount of money spent on 5 consumer goods〔cars、computers、books、perfume and cameras〕in France and the UK in .分析一下:我并没有把标题中的所有的单词都同意替换,因为不是每个词都可以被改写的,例如“ The chart〞,还有两个国家和时间。
这是介绍段,所以你要具体介绍到底有哪些消费品,所以我不但给出了具体的数字5种并且把这五种罗列了出来。
而且我用了括号,这个括号在写task1的时候很好用。
你可以把很多信息集合写在括号里,罗列出来就行,不涉及写句子和语法。
不过不能只改写标题,还要看看有哪些图中有但是标题中没有的信息,比方“Pounds Sterling〞所以要再加上一句。
The chart illustrates the amount of money spent on 5 consumer goods〔cars、computers、books、perfume and cameras〕in France and the UK in . Units are measured in pounds sterling.★接下来我们要说的是Overview段,这一段很重要。
雅思写作Task1柱状图考官范文(7)
英语作文啦 雅思频道特为大家收集整理了雅思写作Task1柱状图考官范文(7)。
认真研读一定的雅思范文及作文模板可以帮助我们检验自己的写作水平,并能很好地吸收和应用优秀范文里的优秀内容~
The chart below shows estimated world illiteracy rates by region and by gender for the year 2000.
Write a report for a university lecturer describing the information below.
Sample Answer:
The given bar chart shows the approximate world illiteracy rates by gender and region for the year 2000. As is observed in the given column graph, in all cased, the illiteracy rate among women is higher than men. Developed countries have almost ignorable illiteracy rate and in the contrary, about half of the population in south Asia, Arab states and Africa are illiterate.
The illiteracy rate in Latin America / Caribbean and East Asia /
Oceania is only 1 percent (approximately), 10 percent and 14 percent (approximately) respectively considering both male and female. Sub-Saharan Africa, the Arab States and South Asia had rates of approximately 40%, 41% and 45%. Illiterate women are higher than the illiterate men in all the given countries.
In the developed countries, the proportion of literacy among men and female is almost similar but the differences increased for Asia, Arab states and Africa. Among the given 6 countries, South Asian population are far more illiterate than any other country.
(Approximately 163 words)
(This model answer can be followed as an example of a very good answer. However, please note that this is just one example out of many possible approaches.)。