培训资料Juniper网络安全防火墙设备售前培训v
- 格式:ppt
- 大小:12.68 MB
- 文档页数:58


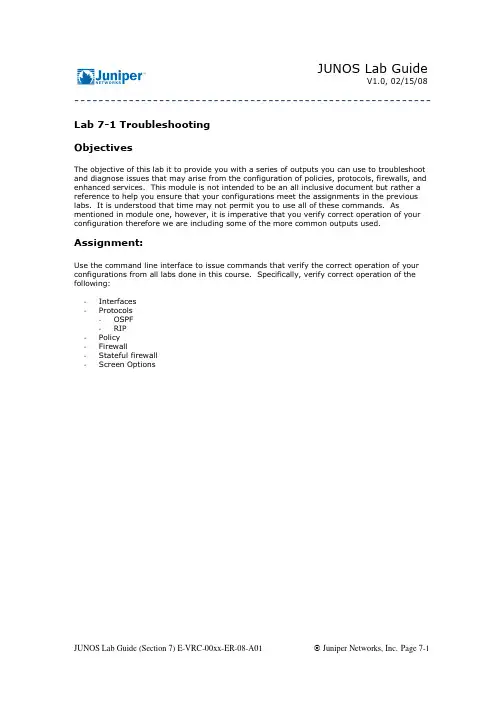
V1.0, 02/15/08 -----------------------------------------------------------Lab 7-1 TroubleshootingObjectivesThe objective of this lab it to provide you with a series of outputs you can use to troubleshoot and diagnose issues that may arise from the configuration of policies, protocols, firewalls, and enhanced services. This module is not intended to be an all inclusive document but rather a reference to help you ensure that your configurations meet the assignments in the previous labs. It is understood that time may not permit you to use all of these commands. As mentioned in module one, however, it is imperative that you verify correct operation of your configuration therefore we are including some of the more common outputs used. Assignment:Use the command line interface to issue commands that verify the correct operation of your configurations from all labs done in this course. Specifically, verify correct operation of the following:-Interfaces-Protocols-OSPF-RIP-Policy-Firewall-Stateful firewall-Screen OptionsV1.0, 02/15/08 -----------------------------------------------------------Lab 7-2 InterfacesUse the show interfaces terse command to display a terse listing of all interfaces installed in the router along with their administrative and link-layer status.Above we can see the status of all the interfaces on our router. It helps to have an understanding of what the different Admin and Link status may indicate.When an interface is administratively disabled, the physical interface has an Admin status of down and a Link status of up, and the logical interface has an admin status of up and a link status of down. The physical interface has a link status of up because the physical link is healthy (no alarms). The logical interface has a link status of down because the data link layer cannot be established end to end.V1.0, 02/15/08 -----------------------------------------------------------When an interface is not administratively disabled and the data-link layer between the local router and the remote router is not functioning, the physical interface has an Admin status of up and a Link status of up while the logical interface has an admin status of up and a link status of down. The physical interface has a link status of up because the physical link is healthy (no alarms). The logical interface has a link status of down because the data-link layer cannot be established end to end.If we see that our interface is not listed as UP/UP, but rather Admin Up but Link down, we can troubleshoot inconsistencies in the configuration or settings on both sides of the link. The show interfaces (interface name) <extensive, brief, detail, statistics> output will show us specific information about settings on the interface as well as drops, errors, alarms, flags, and hardware specific media alarms. The following are some examples of these outputs.V1.0, 02/15/08 -----------------------------------------------------------The output of a show interfaces command displays the device-level configuration and provides additional information about the device’s operation through various flags. These flags include the following:-Down: Device was administratively disabled.-Hear-Own-Xmit: Device will hear its own transmissions.-Link-Layer-Down: The link-layer protocol failed to successfully connect with the remote endpoint.-Loopback: Device is in physical loopback.-Loop-Detected: The link layer received frames that it sent and suspects a physical loopback.-No-Carrier: Where the media supports carrier recognition, this indicates that no carrier is currently seen.-No-Multicast: Device does not support multicast traffic.-Present: Device is physically present and recognized.-Promiscuous: Device is in promiscuous mode and sees frames addressed to all physical addresses on the medium.V1.0, 02/15/08 ------------------------------------------------------------Quench: Device is quenched because it overran its output buffer.-Recv-All-Multicasts: No multicast filtering (multicast promiscuous).-Running: Device is active and enabled.The status of the interface is communicated with one or more flags. These flags include the following:-Admin-Test: Interface is in test mode, which means that some sanity checking, such as loop detection, is disabled.-Disabled: Interface is administratively disabled.-Hardware-Down: Interface is nonfunctional or incorrectly connected.-Link-Layer-Down: Interface keepalives indicate that the link is incomplete.-No-Multicast: Interface does not support multicast traffic.-Point-To-Point: Interface is point to point.-Promiscuous: Interface is in promiscuous mode and sees frames addressed to all physical addresses.-Recv-All-Multicasts: No multicast filtering (multicast promiscuous).-SNMP-Traps: SNMP traps are enabled.-Up: Interface is enabled and operational.The operational status of the device’s link layer protocol is also indicated with flags. These flags include the following:-Give-Up: Link protocol does not continue to retry to connect after repeated failures.-Keepalives: Link protocol keepalives are enabled.-Loose-LCP: PPP does not use LCP to indicate whether the link protocol is up.-Loose-LMI: Frame Relay will not use LMI to indicate whether the link protocol is up.-Loose-NCP: PPP does not use NCP to indicate whether the device is up.-No-Keepalives: Link protocol keepalives are disabled.The output also summarizes the device-level traffic load, which is displayed in both bits and packets per second, as well as any alarms that might be active. The final portion of the command output displays the configuration and status of each logical unit defined on that deviceV1.0, 02/15/08 -----------------------------------------------------------V1.0, 02/15/08 -----------------------------------------------------------V1.0, 02/15/08 -----------------------------------------------------------Now we look at the show interfaces extensive command. In the output above we have narrowed our output to show the section for traffic statistics, and input and output errors. The following is a list of some of the fields displayed here and a brief explanation of what some of the non-obvious ones mean.Input-Errors: Displays the sum of the incoming frame aborts and frame check sequence (FCS) errors.-Policed discards: Displays the frames that the incoming packet match code discarded because they were not recognized or of interest. Usually, this field reports protocolsthat JUNOS software does not handle, such as Cisco Discovery Protocol(CDP)/Spanning Tree Protocol (STP), or any protocol type JUNOS software does notunderstand. (On an Ethernet network, numerous possibilities exist.) -L3 incompletes: This counter increments when the incoming packet fails Layer 3 (usually IPv4) checks of the header. For example, a frame with less than 20 bytes ofavailable IP header would be discarded, and this counter would increment.-L2 channel errors: This counter increments when the software cannot find a valid logical interface (such as e3-1/2/3.0) for an incoming frame.-L2 mismatch timeouts: Displays the count of malformed or short packets that cause the incoming packet handler to discard the frame as unreadable.-SRAM errors: This counter increments when a hardware error occurs in the SRAM on the PIC. The value in this field should always be 0. If it increments, the PIC ismalfunctioning.Output-HS link CRC errors: Displays the count of errors on the high-speed links between the ASICs responsible for handling the router interfaces.-Carrier transitions: Displays the number of times the interface has gone from down to up. This number should not increment quickly, increasing only when the cable isunplugged, the far-end system is powered down and up, or a similar problem occurs.If it does increment quickly (perhaps every 10 seconds), then either the transmission line, the far-end system, or the PIC is broken.-Errors: Displays the sum of the outgoing frame aborts and FCS errors.-Drops: Displays the number of packets dropped by the output queue of the I/O Manager ASIC. If the interface is saturated, this number increments once for everypacket that is dropped by the ASIC’s RED mechanism.-Aged packets: Displays the number of packets that remained in shared packet SDRAM for so long that the system automatically purged them. The value in this field shouldnever increment. If it does, it is most likely a software bug or possibly malfunctioning hardware.V1.0, 02/15/08 -----------------------------------------------------------Lab 7-3 ProtocolsThe first protocol that we configured in our labs was OSPF. Lets take a look at some outputs that will help us determine the overall health of OSPF. In doing this we will look to see if the interfaces are configured for OSPF, if we are seeing adjacencies, and if we are learning our routes.V1.0, 02/15/08 -----------------------------------------------------------The show ospf route command display those routes in the unicast routing table, inet.0, that were installed by OSPF. The use of additional keywords allows you to display only OSPF routes learned by specific LSA types. The output fields of the show ospf route command are the following:-Prefix: Displays the destination of the route.-Route/Path Type: Displays how the route was learned:-ABR: Route to area border router;-ASBR: Route to AS border router;-Ext: External router;-Inter: Interarea route;-Intra: Intra-area route; or-Network: Network router.-Metric: Displays the route's metric value.-Next hop i/f: Displays the interface through which the route's next hop is reachable.-Next hop addr: Displays the address of the next hop.-area: (detail output only) Displays the area ID of the route.-options: (detail output only) Displays the option bits from the LSA.-origin: (detail output only) Displays the router from which the route was learned.V1.0, 02/15/08 -----------------------------------------------------------The show ospf interface command displays information relating to the interfaces on which the respective protocol is configured to run. In the case of OSPF, the output fields are the following:-Interface: Displays the name of the interface running OSPF.-State: Displays the state of the interface. It can be BDR, Down, DR, DRother, Loop, PtToPt, or Waiting.-Area: Displays the number of the area in which the interface is located.-DR ID: Displays the address of the area's DR.-BDR ID: Displays the BDR for a particular subnet.-Nbrs: Displays the number of neighbors on this interface.V1.0, 02/15/08 ------------------------------------------------------------Type (detail and extensive output only): Displays the type of interface. It can be LAN, NBMA, P2MP, P2P, or Virtual.-Address (detail and extensive output only): Displays the IP address of the neighbor.-Mask (detail and extensive output only): Displays the mask of the interface.-MTU (detail and extensive output only): Displays the interface's MTU.-Cost (detail and extensive output only): Displays the interface's cost (metric).-DR addr (detail and extensive output only): Displays the address of the DR.-BDR addr: Displays the address of the BDR.-Adj count (detail and extensive output only): Displays the number of adjacent neighbors.-Flood list (extensive output only): Displays the list of LSAs pending flood on this interface.-Ack list (extensive output only): Displays the list of pending acknowledgments on this interface.-Descriptor list (extensive output only): Displays the list of packet descriptors.-Dead (detail and extensive output only): Displays the configured value for the dead timer.-Hello (detail and extensive output only): Displays the configured value for the hello timer.-ReXmit (detail and extensive output only): Displays the configured value for the retransmit timer.-OSPF area type (detail and extensive output only): Displays the type of OSPF area, which can be Stub, Not Stub, or NSSA.V1.0, 02/15/08 -----------------------------------------------------------Next we can check to see if the interfaces we have configured for OSPF are forming adjacencies. The show ospf neighbor command displays adjacency status for their respective protocols. In the case of OSPF, the output fields include the following: -Address: Displays the address of the neighbor.-Intf: Displays the interface through which the neighbor is reachable.-State: Displays the state of the neighbor, which can be Attempt, Down, Exchange, ExStart, Full, Init, Loading, or 2Way.-ID: Displays the RID of the neighbor.-Pri: Displays the priority of the neighbor to become the DR.-Dead: Displays the number of seconds until the neighbor becomes unreachable.-area (detail and extensive output only): Displays the area in which the neighbor is located.-opt (detail and extensive output only): Displays the option bits from the neighbor.-DR (detail and extensive output only): Displays the address of the DR.-BDR (detail and extensive output only): Displays the address of the BDR.-Up (detail and extensive output only): Displays the length of time since the neighbor came up.-adjacent (detail and extensive output only): Displays the length of time since the adjacency with the neighbor was established.V1.0, 02/15/08 -----------------------------------------------------------Now that we have taken a look at OSPF, let’s take a brief look at some of the commands we can use to verify operation of the RIP protocol.This output displays information about RIP neighbors. This is a list of the fields and what they mean.-Neighbor: Name of RIP neighbor.-State: State of the connection: Up or Dn (Down).-Source Address: Source Address.-Destination Address: Destination Address.-Send Mode: Send options: broadcast, multicast, none, or version 1.-Receive Mode: Type of packets to accept: both, none, version1 or version2.-In Met: Metric added to incoming routes when advertising into RIP routes that were learned from other protocols.V1.0, 02/15/08 -----------------------------------------------------------This output above displays the route entries in the routing table that were learned from protocols RIP. A description of some of the fields follows.-active: Number of routes that are active.-holddown: Number of routes that are in the hold-down state prior to being declared inactive.-hidden: Number of routes not used because of routing policy.-+: A plus sign before [protocol/preference] indicates the active route, which is the route installed from the routing table into the forwarding table.--: A hyphen before [protocol/preference] indicates the last active route.-*: An asterisk before [protocol/preference] indicates that the route is both the active and the last active route. An asterisk before a ‘to’ line indicates the best subpath to the route.V1.0, 02/15/08 -----------------------------------------------------------To see what RIP routes are being sent or received on the router issue the show route advertising-protocol rip<egress interface address> and show route receive-protocol rip<remote advertising interface address> commands. The field definitions follow:-active: Number of routes that are active.-holddown: Number of routes that are in the hold-down state prior to being declared inactive.-hidden: Number of routes not used because of routing policy.-+: A plus sign before [protocol/preference] indicates the active route, which is the route installed from the routing table into the forwarding table.--: A hyphen before [protocol/preference] indicates the last active route.-*: An asterisk before [protocol/preference] indicates that the route is both the active and the last active route. An asterisk before a ‘to’ line indicates the best subpath to theroute.V1.0, 02/15/08 -----------------------------------------------------------Lab 7-4 PolicyWhen troubleshooting policy two of the most common commands are show route receive-protocol and show route advertising-protocol. When issuing these commands it’s important to understand where we are getting the outputs from. The commands on the slide show routing updates received before import policy processing and the routing updates sent after export policy processing.Use the show route receive-protocol protocol neighbor command to show the specified protocol-type route advertisements that a particular neighbor is advertising to your router before import policy is applied. Use the show route advertising-protocol protocolneighbor command to show the protocol-type route advertisements that you are advertising to a particular neighbor after export policy is applied.The use of route filters marks an exception to the behavior documented previously. JUNOS software evaluates route filters before the output of a show route receive-protocol command is generated. Thus, you must specify the hidden switch to the show routereceive-protocol command to display received routes filtered by your import policy.If you want to monitor the effects of an import policy, use the show route protocol protocol command to monitor the effects of your import policy. This command shows all routes from the protocol type specified that are installed in the routing table.Another way we can troubleshoot policy is to use the function test policy <policy name><prefix>. By using this command you can test policies that are created (and committed) on the router for a specific prefix to see if the policy will have the desired effect on the prefix being tested.V1.0, 02/15/08 -----------------------------------------------------------V1.0, 02/15/08 -----------------------------------------------------------It is important to keep in mind that the default action of ‘test’ is to accept. Note the difference in behavior once we add a second term catch-all to reject any remaining routes.V1.0, 02/15/08 -----------------------------------------------------------Lab 7-5 Stateless Firewall Filters (Packet Filters)One of the more common ways to test firewall filters is to set up counters to capture discarded and accepted packets. If we see packets increment in the discard counter then we can at least be assured that our filter is applied and that packets are matching. Please recall that in a previous lab we used a firewall filter to match on ICMP and a counter to show that it was working correctly. The following command, show firewall, shows the counter we created and the amount of traffic that has been matched it.-----------------------------------------------------------V1.0, 02/15/08 -----------------------------------------------------------Another method for troubleshooting is to look at the firewall log created specially for dropped packets due to firewall match criteria. The log modifier writes packet header information to a memory resident buffer in the PFEV1.0, 02/15/08 -----------------------------------------------------------The following chart shows the output field definitions:Time of Log Time that the event occurred. to be providedFilter Name of a filter that has been configured with the filterstatement at the [edit firewall] hierarchy level.• A hyphen (-) indicates that the packet was handled bythe Packet Forwarding Engine.• A space (no hyphen) indicates the packet was handledby the Routing Engine.•The notation pfe indicates packets logged by thePacket Forwarding Engine hardware filters.to beprovidedFilter Action Filter action:•A—Accept•D—Discard•R—Rejectto beprovidedName of Interface Ingress interface for the packet.to beprovidedName of protocol Packet's protocol name: egp, gre, ipip, ospf, pim, rsvp, tcp, orudp.to beprovidedPacket length Length of the packet. to be providedSource address Packet's source address. to be providedDestination address Packet's destination address and port.to beprovidedV1.0, 02/15/08 -----------------------------------------------------------Finally one more way to look at the results of our firewall filters is to create a system log file that matches on the packets that have been dropped as a result of the firewall applied to the router. First of all, take a look at the system syslog settings that allow us to analyze the log filesThen as part of the firewall filter, we include the action of syslog:V1.0, 02/15/08 -----------------------------------------------------------Finally, we can now take a look at the log files created as a result of our work:In this section we will see a couple outputs that give us useful information on stateful firewalls, zones, and interfaces that participate. One thing to keep in mind is that the output for flows shows up only if traffic has passed within a certain amount of time. This means that even though your configuration may be correct, the output may not show incrementing valueswithout traffic.V1.0, 02/15/08 -----------------------------------------------------------This output is shown to let you see that with JES configured on your router, a showinterfaces output references the zones assigned to the logical portion of your interface. This can be helpful when determining if your zones have been applied correctly and give you some basic information as to the amount and type of traffic being allowed to traverse your interface.V1.0, 02/15/08 -----------------------------------------------------------Conversely, if you would rather take a look at the zones configured on your router, the show security zones output will show you the zones configured as well as the interfaces associated with these zones. Additional information can be found here that let’s us know any settings we have for the return traffic. For instance, if we have decided to send a reset for non-SYN session TCP packets, this information would be shown under the security zone section of this output.V1.0, 02/15/08 -----------------------------------------------------------The output above summarizes all of the active sessions that have been created.V1.0, 02/15/08 -----------------------------------------------------------From time to time it may become necessary to clear flows on your router, the output above shows this. You also have the ability to clear specific sessions with the session identifier.V1.0, 02/15/08 -----------------------------------------------------------Lab 7-7 Screen OptionsFor the lab and objective assignments, sending ping packets that are obviously too large and then monitoring the command show security screen statistics zone <zone name> should give us an indication of whether or not our configuration will account for the specific type of attack we are mitigating. Because this output has all ready been seen in module 6, the output above may look a bit familiar. ☺。

Juniper防火墙培训黄卓超Boscohuang@培训日程▪Juniper防火墙产品型号介绍▪Juniper防火墙优势与卖点▪产品更新情况▪防火墙概念▪Troubleshooting▪日常维护企业核心网/运营商/数据中心性能Juniper防火墙产品线一览中小企业/远程办公室大中型企业/分支机构价格Juniper防火墙产品市场定位▪中低端防火墙针对中小型企业•购买成本及维护成本是首要的需求•安全功能All in one•统一的配置界面•Juniper SSG产品具备无可比拟的优势•购买成本较低•无需管理多台设备•性能可接受(出口带宽<100M)▪高端防火墙针对运营商及大型企业•性能与稳定性是用户首要的需求•防火墙不能因为开启新业务成为网络处理能力的瓶颈•防火墙需具备高稳定性,不能影响业务的正常开展•往往使用独立硬件完成病毒防护,入侵检测防御,垃圾邮件过滤等功能,专物专用•Juniper ISG/NS5000的目标客户Secure Services Gateway 5▪160Mbps防火墙处理能力▪40Mbps VPN处理能力▪16K并发会话,5.5K新建会话▪深度检测能力▪病毒扫描能力▪反垃圾邮件, Web 过滤▪支持Security zones, VLANs, Virtual Routers 以灵活地把网络分段灵活的接口选项▪固化7个10M/100MEtherne以太网接口+ 1低速广域网接口interface•ISDN BRI S/T•V.92•RS-232 Serial/Aux▪可选配无线接入802.11a/b/g▪共6个具体型号Secure Services Gateway 20灵活的接口选项▪固化5个10M/100MEtherne 以太网接口+ 2个Mini-PIM 扩展槽•ISDN BRI S/T •V.92•ADSL2+•E1/T1•千兆以太网•同步串口▪可选配无线接入802.11a/b/g ▪共6个具体型号▪160Mbps 防火墙处理能力▪40Mbps VPN 处理能力▪16K 并发会话,5.5K 新建会话▪深度检测能力▪病毒扫描能力▪反垃圾邮件, Web 过滤▪支持Security zones, VLANs, Virtual Routers 以灵活地把网络分段Secure Services Gateway 140前面板▪前面板8个10/100M 以太网接口+ 2 个10/100/1000M 接口扩展槽▪后面板4个PIM 扩展槽•2* T1/E1•2*Serial •2*SHDSL •1*E3/T3•1*ADSL•1*ISDN BRI S/T •16口GE •8口GE •6口GE •1口GE▪350 Mbps 防火墙处理能力▪100 Mbps VPN 处理能力▪48K 并发会话数,8K 新建会话数▪深度检测能力▪病毒扫描能力▪反垃圾邮件, Web 过滤▪支持Security zones, VLANs, Virtual Routers 以灵活地把网络分段后面板Secure Services Gateway 300M Series▪Juniper Networks SSG 350M•550Mbps FW •225 Mbps VPN •深度检测能力•病毒扫描能力• 5 I/O Slots•单电源, AC or DC•128K 并发会话, 12.5K 新建会话数•350 VPN tunnels •1.5U▪Juniper Networks SSG 320M •450Mbps FW •175Mbps VPN •深度检测能力•病毒扫描能力)• 3 I/O slots •单电源, AC or DC•64K 并发会话,10K 新建会话数•250 VPN tunnels •1U▪共同特点•固化4个10M/100M/1000M 以太网接口•2个RJ45 Console/AUX 接口•2 个USB可外接存储设备以导出日志或其他系统信息Secure Services Gateway 500 Series▪Juniper Networks SSG 550•4Gbps FW •500 Mbps VPN •深度检测能力•病毒扫描能力• 6 I/O Slots•冗余电源, AC or DC•256K 并发会话, 32K 新建会话数•1,000 VPN tunnels▪Juniper Networks SSG 520•2Gbps FW•300 Mbps VPN •深度检测能力•病毒扫描能力• 6 I/O slots •单电源, AC or DC•128K 并发回话, 23k 新建会话数•500 VPN tunnels▪共同特点•2U 高,固化4个10M/100M/1000M 以太网接口•2个RJ45 Console/AUX 接口•2 个USB可外接存储设备以导出日志或其他系统信息丰富的SSG接口模块:PIMs8口10M/100M/1000M电口16口10M/100M/1000M电口6口1000M光口2口E1/T12口同步串口1口ISDN BRI S/TJuniper ISG防火墙概览•ISG2000•集中转发架构,系统性能为设计值•整机4Gbps防火墙处理能力(大包)•2Gbps防火墙处理能力(64bytes小包)•整机2Gbps 3DES或AES VPN能力•整机1百万并发连接•最多支持10000 IPSec VPN tunnels •最多支持16个千兆接口或28个百兆接口•最多支持250个虚拟防火墙系统•最多支持4094个VLANs •ISG1000•集中转发架构,系统性能为设计值•最大2Gbps防火墙处理能力(大包)整机1Gbps防火墙处理能力(64bytes小包)•最大1Gbps 3DES或AES VPN能力•整机50万并发连接•最多支持2000 IPSec VPN tunnels•最多支持12个千兆接口或20个百兆接口•最多支持50个虚拟防火墙系统•最多支持4094个VLANsISG 2000 升级为带硬件IDP 的防火墙IDP LicenseKey1-3 块安全模块++=ISG System+ISG System w/ IDPJuniper NS5000防火墙概览•NS5400•分布式处理,随着板卡数量增加性能线性递增•最大30Gbps 防火墙处理能力(256bytes)•12Gbps 防火墙处理能力(64bytes 小包)•最大15 Gbps 3DES 或AES VPN 能力•整机2 百万并发连接•支持25,000 IPSec VPN tunnels •支持24个千兆接口或6个万兆接口•支持500个虚拟防火墙系统•支持4094个VLANs •NS52000•分布式处理,随着板卡数量增加性能线性递增•最大10Gbps 防火墙处理能力(256bytes)整机4Gbps 防火墙处理能力(64bytes 小包)•最大5Gbps 3DES 或AES VPN 能力•整机1百万并发连接•支持25,000 IPSec VPN tunnels •支持8个千兆接口或2个万兆接口•支持500个虚拟防火墙系统•支持4094个VLANsJuniper NS5000接口板卡系列▪NetScreen-5000 8G2接口模块•8口千兆mini-GBIC 接口•8Gbps 防火墙/4Gbps 3DES/AES VPN性能•支持最多4口聚合▪NetScreen-5000 2XGE接口模块•2口万兆XFP接口•10Gbps防火墙/4Gbps 3DES/AES VPN性能•支持短距或长距Transceivers▪共同点•每块接口卡内置2块GigaScreen3ASIC•支持9.6K帧长的Jumbo Frames•跟5000-MGT2管理模块兼容培训日程▪Juniper防火墙产品型号介绍▪Juniper防火墙优势与卖点▪产品更新情况▪防火墙概念▪Troubleshooting▪日常维护防火墙操作系统SreenOSRISC CPUSecurity -Specific, Real -Time OS •Dynamic Routing •Virtualization •High Availability•Centralized Management•VPN•Denial of Service •Firewall•Traffic management Purpose Built Hardware Platform CPU MemoryASICInterfacesSecurity –Specific, Real-Time OS▪Dynamic Routing ▪Virtualization▪High Availability ▪Centralized Management Integrated Security Applications ▪Denial of Service ▪VPN ▪Firewall ▪Traffic management 转为安全业务而设计的软件系统-▪电信级路由能力:RIP/OSPF/BGP4/PBR ▪高可用性:Redundant Interface/Track IP/NSRP ▪虚拟化能力:虚拟防火墙▪UTM 功能:AV/IPS/Anti-SPAM/URL Filtering…▪支持:RADIUS, LDAP , PKI, internal DB,SecurID,MS AD 等认证手段▪超过10年行业经验累积▪支持大量的企业应用如H323/SIP/MGCP/Skinny 等▪安全域/全状态检测/深度检测▪VPN 特性:IPsec/XAuth/L2TP/GRE防火墙安全业务引擎GigaScreen3ASIC•Juniper/Netscreen第4代安全业务处理芯片(2003 年发布)•3Mpps状态检测/NAT性能• 1.5Mpps 加解密性能( IPsec VPN)•集成16种常见攻击的防护能力(Syn-flood/ICMP flood//UDP Flood等)•集成6*Packet Processing Units (PPU)加速单元:•VPN 加/解密(AES, 3DES, DES,SHA-1, MD5)•TCP 4 Way close•IP 分段重组•IKE协商加速•流量计数•支持微代码编程,可通过软件版本升级更新ASIC芯片的功能•用于ISG/NS5000产品系列全状态防火墙检测机制▪支持对TCP协议进行状态检测▪支持IP/ICMP/UDP等无状态协议进行状态检测▪支持对复杂协议进行状态检测•H.323(Cisco/Avaya/Polycom/NEC…)•SIP•MGCP•Skinny•FTP/TFTP•RTSP/Real•Microsoft RPC/Sun RPC•SQL•PPTP•SCTP•GTP/GPRS完善的VPN特性支持▪支持IETF IPsec VPN标准•可与所有兼容RFC标准的IPsec网关互联互通•支持IPsec VPN NAT Traversal•支持Remote-Access w/ Xauth•支持透明模式下的IPsec VPN•独特的ACVPN特性,可简化大规模full-mesh VPN部署▪支持L2TP VPN,支持L2TP over IPsec,方便Windows用户VPN远程接入▪支持GRE Tunnel,支持GRE over IPsec;方便通过VPN隧道透传组播应用统一威胁管理(UTM)来自入方向的威胁来自出方向的威胁SurfControl to block to Spyware /Phishing / Unapproved Site Access Web过滤Kaspersky Lab AV stops Viruses, file-based Trojans, Spyware, Adware,KeyloggersKaspersky Lab AV stops Viruses, file-based Trojans or spread of Spyware,Adware, Keyloggers防病毒Symantec stops Spam / Phishing防垃圾邮件Juniper IPS detects/stopsWorms, TrojansJuniper IPS detects/stops Worms,Trojans, DoS, Recon, Scans入侵检测防护Juniper Stateful Firewall, VPN, AccessControl核心安全Juniper Stateful Firewall, VPN,Access Control经济灵活的虚拟系统(Virtual Systems)IEEE 802.1Q VLAN Trunk业务流量按照VLANs 映射至虚拟防火墙客户区域物理分割到客户A 的VLAN虚拟防火墙逻辑分割每个客户独立管理自己的设备: 分离的路由表/安全策略/地址本/管理员账号到客户C 的VLAN到客户B 的VLAN灵活的部署方式▪路由模式:电信级路由能力•RIP•OSPF•BGP•策略路由•ECMP▪透明模式(桥模式)•无需更改现有网络拓扑,即插即用•支持透明模式下的NAT(ScreenOS 6.2)/IPsec VPN ▪支持丰富的广域网接口卡类型,适应各种网络连接▪虚拟路由器/虚拟防火墙提高业务灵活性▪IPv6 Ready•支持IPv4/IPv6双栈•支持NAT-PT•支持6to4 Tunnel•支持6in4,4in6 Tunnel•支持RIPng,即将支持OSPFv3高可用性▪主要特性•支持A/P、A/A、A/A fullmesh的高可用部署•同步FW/VPN的所有信息,切换时包括•Active sessions•NAT•VPN tunnels•Security Associations▪优点•业务无中断,切换对用户透明•改进了业务的弹性▪Juniper HA防火墙结构解决的问题•防多点故障•链路故障或周边设备故障,用接口切换屏蔽,设备不用切换,无丢包•双HA心跳线冗余•Track IP机制检测全路径健康状况•配置自动同步,维护简单友好的人机管理界面集成管理平台Telnet SSHHTTP HTTPSDMISNMPSyslogJuniper 防火墙开放,基于标准的管理框架ScreenOS CLI▪Telnet ▪SSHWeb▪Quick Setup with Templates ▪Dashboard View▪Performance MonitoringJuniper NSM▪Discovery & Configuration ▪Policy Management ▪Inventory Management ▪Log ManagementDevice ManagementNetwork & Security ManagementThird party NMSJuniper STRM▪Threat Detection▪Event Log Management ▪Compliance & IT Efficiency培训日程▪Juniper防火墙产品型号介绍▪Juniper防火墙优势与卖点▪产品更新情况▪防火墙概念▪Troubleshooting▪日常维护新一代安全操作系统JUNOS-ES JUUNOS Enhanced Service▪电信级路由操作系统JUNOS和安全操作系统ScreenOS的完美融合•来自JUNOS的MPLS/NSF/NSR等高级功能•来自JUNOS的层次化CLI配置风格•来自ScreenOS的安全特性: 安全域/NAT/IPsec VPN/Screen/深度检测/UTM •Commit/JUNOS Scripts等高级管理特性▪集成的统一安全平台•状态检测•IPsec VPN•入侵检测与防御•病毒防御/垃圾邮件过滤(Roadmap)•DDoS攻击防护▪分布式体系架构•控制/转发平面清晰分离•全冗余分布式系统架构,性能随着安全业务板数量增加而线性递增•满足性能按需增长的要求▪Only for SRX and J系列路由器▪SRX5600▪管理引擎/安全服务引擎/交换矩阵/电源/风扇组全冗余▪8U/8槽位▪防火墙性能–60 Gbps ▪VPN –18 Gbps ▪IDP –18 Gbps▪Concurrent sessions –4M▪New and sustained cps –300k ▪Concurrent VPN tunnels –100kJuniper 新一代防火墙产品SRX5000系列▪SRX5800▪管理引擎/安全服务引擎/交换矩阵/电源/风扇组全冗余▪16U/14槽位▪防火墙性能–120 Gbps ▪VPN –36Gbps ▪IDP –36Gbps▪Concurrent sessions –8M ▪New and sustained cps –300k ▪Concurrent VPN tunnels –100k▪SRX3400▪关键部件冗余▪3U/7扩展槽位▪防火墙性能–10 Gbps ▪VPN –8 Gbps▪IDP –6Gbps▪Concurrent sessions –1M ▪New and sustained cps –120k ▪Concurrent VPN tunnels –10kJuniper 新一代防火墙产品SRX3000系列▪SRX3600▪关键部件冗余▪5U/12扩展槽位▪防火墙性能–30 Gbps ▪VPN –14Gbps ▪IDP –10Gbps▪Concurrent sessions –2M ▪New and sustained cps –120k ▪Concurrent VPN tunnels –30kSRX竞争优势▪支持关键部件全冗余,相比传统防火墙的双机部署成本更低且冗余设计更简单▪突破传统防火墙没有真正的交换矩阵的设计缺陷,采用Juniper骨干网路由器的Switch Farbric(960Gbps),易于容量扩展▪融合来自Juniper骨干网路由器的路由特性,更好的支持ISIS, BGP,NSF/NSR等高级路由特性▪完全集成来自ScreenOS的安全特性,是可以信赖的安全解决方案培训日程▪Juniper防火墙产品型号介绍▪Juniper防火墙优势与卖点▪产品更新情况▪防火墙概念▪Troubleshooting▪日常维护安全区(Security Zone):Juniper 防火墙增加了全新的安全区域(Security Zone)的概念,安全区域是一个逻辑的结构,是多个处于相同属性区域的物理接口的集合。


Juniper配置文档二零一三年二月目录JUNOS配置简介 (2)JUNOS软件简介 (2)JUNOS软件安装 (3)JUNOS命令行简介 (5)初始化配置 (6)路由器的调试 (6)端口配置 (7)系统整体配置 (10)IS-IS配置 (12)OSPF配置 (14)BGP配置 (15)Routing Policy (17)JUNOS配置简介JUNOS软件简介JUNOS软件的三大功能:1)ROUTING2)ENHANCED ROUTING SERVICES3)MPLSTRAFFIC ENGINEERINGVPNS它所支持的特性有:1)模块化设计2)EGP:BGP4Route reflectorsConfederationsCommunitiesRoute flap dampingTCP MD5 authenticationREGEX3)IGP:Integrated IS-ISOSPFRIPv24)Juniper policy engine5)MulticastDVMRP PIM DIM PIM SM MSDP(Multicast Source Discovery Protocol)6)MPLSTraffic engineeringVPNs7)Class of Service在传统VPN方面,JUNIPER路由器需加插一块Tunnel PIC板来支持。
它支持PIM SM隧道模式和GRE封装。
JUNOS软件安装1、启动设备和媒介启动顺序1、可移动媒介:a)用于安装和升级,通常为空b)M40使用120MB软驱c)M20/160使用110MB PCMCIA FLASH卡2、FLASH驱动器a)在一个新的Juniper路由器中,JUNOS软件预先安装在FLASH驱动器中3、硬盘a)在一个新的Juniper路由器中,与安装一个备份JUNOS软件,还用于存储系统log文件和诊断文件2、软件安装1、出厂预安装软件a)FLASH驱动器b)硬盘(备份)c)可移动媒介(用于系统恢复)2、存储媒介使用下列设备名,在路由器启动的时候显示出来a)FLASH驱动器-wd0b)硬盘-wd2c)可移动媒介-wfd03、可以从各种拷贝启动a)如果FLASH驱动器坏了,还可以从硬盘或者软驱启动4、升级a)可以从可移动媒介或者从Internet上升级3、完全安装-准备阶段1、记录下基本信息a)路由器名b)管理接口IP地址c)缺省路由器IP地址d)域名和DNS服务器IP地址2、将已存在的配置文件COPY到安全的地方a)配置文件位于/config/juniper.conf3、确定你要安装的媒介4、完全安装-重新安装1、插入安装媒介a)M40 LS-120软盘b)M20 PCMCIA FLASH卡2、重新启动路由器a)从console口使用命令:root @ lab2 >system haltb)重新启动电源3、输入安装前保存的一些信息4、系统安装完后自动重新启动5、升级软件1、JUNOS软件包含三个包a)jkernel-操作系统b)jroute-路由引擎软件c)jpfe-包转发引擎软件d)jbundle-所有的三个软件包2、下列是软件包的名字举例:a)jroute-4.0R1.tgzb)jkernel-4.0R1.tgzc)jpfe-4.0R1.tgz3、每个包可以个别的单独升级4、CLI命令模式下使用show system software显示安装的软件信息5、命名规范:package-m.n.Znumber.tgza)m.n是主版本号b)number是release号码c)Z是大写字母i.A-Alphaii.B-Betaiii.R-Releaseiv.I-Internal6、例如:jbundle-3.4R1.2.tgz6、升级软件包root@lab2> request system software add new-package-nameroot@lab2> request system reboot7、备份已存在的软件系统软件和配置可以备份到硬盘中,最好在稳定的时候进行使用request system snapshot命令备份软件到/altroot和/altconfig文件系统中,通常情况下,root文件系统/备份到/altroot中,/config备份到/altconfig中。