哈维罗森财政学全英笔记Chapter1
- 格式:docx
- 大小:18.32 KB
- 文档页数:3
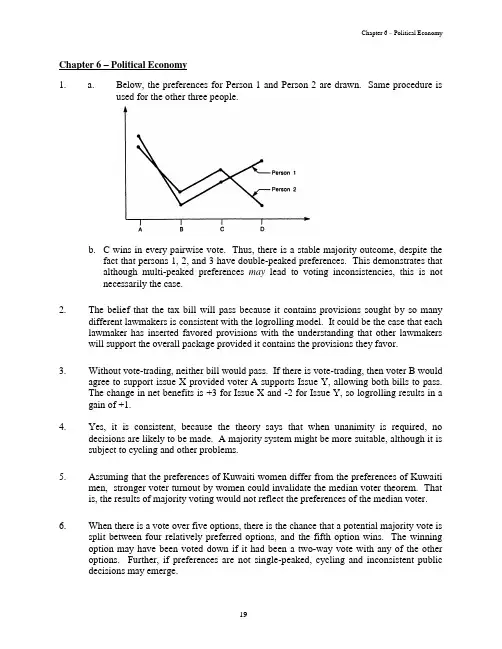
Chapter 6 – Political Economy19Chapter 6 – Political Economy1. a. Below, the preferences for Person 1 and Person 2 are drawn. Same procedure isused for the other three people.b. C wins in every pairwise vote. Thus, there is a stable majority outcome, despite thefact that persons 1, 2, and 3 have double-peaked preferences. This demonstrates thatalthough multi-peaked preferences may lead to voting inconsistencies, this is notnecessarily the case.2. The belief that the tax bill will pass because it contains provisions sought by so manydifferent lawmakers is consistent with the logrolling model. It could be the case that each lawmaker has inserted favored provisions with the understanding that other lawmakers will support the overall package provided it contains the provisions they favor.3. Without vote-trading, neither bill would pass. If there is vote-trading, then voter B would agree to support issue X provided voter A supports Issue Y, allowing both bills to pass. The change in net benefits is +3 for Issue X and -2 for Issue Y, so logrolling results in a gain of +1.4. Yes, it is consistent, because the theory says that when unanimity is required, no decisions are likely to be made. A majority system might be more suitable, although it is subject to cycling and other problems.5. Assuming that the preferences of Kuwaiti women differ from the preferences of Kuwaiti men, stronger voter turnout by women could invalidate the median voter theorem. That is, the results of majority voting would not reflect the preferences of the median voter.6.When there is a vote over five options, there is the chance that a potential majority vote is split between four relatively preferred options, and the fifth option wins. The winning option may have been voted down if it had been a two-way vote with any of the other options. Further, if preferences are not single-peaked, cycling and inconsistent public decisions may emerge.Part 2 – Public Expenditure: Public Goods and Externalities7. Given the U.S. experience with the Budget Enforcement Act of 1990, we would expectthe EU deficit li mits to be ineffective. We would expect “accounting tricks” to mask the size of the deficits (such as itemizing various budget items as “unexpected emergencies”), and if that didn’t work, we would expect the deficit rules to be ignored. This is apparently what is happening. When Germany exceeded the deficit target, no moves were taken to levy the required fines.8. Since rents, by definition, are the returns above a normal return, then when the licensesare put on the market, their price will be the value of the rents. Hence, the owner of the peanut license, whoever he or she is, only makes a normal return. Put another way, the license is an asset that earns a normal rate of return. If the peanut license system were eliminated, efficiency would be enhanced. But the elimination would, in effect, confiscate the value of this asset. It is not clear that this is fair. One could also argue that when someone buys this asset, the purchase is with the understanding that there is some probability that its value will be reduced by elimination of the program; hence, it is not unfair to do so.9. a. With the demand curve of Q=100-10P and a perfectly elastic supply curve at P=2,then the milk is sold at a price of $2, and a quantity of 80 units is sold.b. The marginal revenue curve associated with the inverse demand curve P=10-(1/10)Q is MR=10-(1/5)Q, while the marginal cost curve is MC=2. The cartelwould ideally produce a quantity where MR=MC, or 10-(1/5)Q=2, or Q=40. Theprice associated with a cartel quantity of 40 units is P=10-(1/10)*40, or P=6.c. The rent associated with the cartel is the product of the marginal profit per unitand the number of units produced. The marginal profit per unit of milk is $4 (=$6price - $2 marginal cost), while 40 units are produced. Thus, the rents equal $160.d. The most the cartel would be willing to contribute to politicians is the fulleconomic rent of $160. The cartel situation, the quantity of milk produced is toolow from society’s point of view. The deadweig ht loss triangle is computed usingthe difference between the cartel output and competitive output as the “base” ofthe triangle, and the difference between the cartel price and competitive price asthe “height.” Thus, the triangle is equal to (1/2)*(80-40)*($6-$2)=$40.e. As Figure 6.5 in the textbook shows, the deadweight loss could now go as high asthe sum of the conventional deadweight loss and the rents, or $160 rents + $80DWL = $240. This is because, as noted in the text, “rent-seeking can use upresources – lobbyists spend their time influencing legislators, consultants testifybefore regulatory panels, and advertisers conduct public relations campaigns.Such resources, which could have been used to produce new goods and services,are instead consumed in a struggle over the distribution of existing goods andservices. Hence, the rents do not represent a mere lump-sum transfer; it is ameasure of real resources used up to maintain a position of market power.”20Chapter 6 – Political Economy 10. Niskanen’s model of bureaucracy is illustrated in Figure 6.4 of the textbook. In theaftermath of September 11th, the new concerns over food safety would likely shift the V curve upward (that is, the value placed on each level of Q). Assuming that C curve (costs per unit of Q) does not change, then this shift increases the actual number of food inspectors hired. It is also likely that the slope of the V curve changes, with each marginal unit of Q becoming more valuable. Thus, the V curve not only “shifts” upward, but becomes steeper as well. Both of these effects – the shifting of the V curve and the change in the slope –lead to greater values of Q under the bureaucracy model. The change in the slope leads to a greater value of Q*, the efficient level of output. Thus, the optimal number of FDA employees and the actual number of FDA employees are likely to rise.11. a. The outcome of the first election (M vs. H) is M. The outcome of the secondelection (H vs. L) is L. The outcome of the third election (L vs. M) is M.Majority rule leads to a stable outcome since M defeats both H and L. Giving oneperson the ability to set the agenda would not affect the outcome in this case.b. With the change in Eleanor’s preference ordering, majority rule no longergenerates a stable outcome. In a vote between M and H, the outcome is H. In avote between H and L, the outcome is L. In a vote between L and M, the outcomeis M. So, giving one person the ability to set the agenda affects the outcome. Forexample, Abigail prefers H, so she might pit L against M first in order toeliminate L and avoid having L defeat H.21。
简述税收支出及其主要形式(税收豁免、纳税扣除、税收抵免、优惠税率、延期纳税、盈亏相抵、加速折旧、退税)年工商税制改革的指导思想和主要内容)
简述财政赤字的弥补方式(债务化融资、货币化融资)及其经济效应(通货膨胀税、铸币税)
低竞争性
高排他性(拥挤产品)
公园、
图书馆
停车位、路桥
(公共产品)
晚霞、国防
湖、河
(公共地悲剧)
(私人产品)(带有外部性的产品)
★CPA真题:某商场
以下购销业务,
万元,进项税额
40万元;计算
①进项税额
②销项税额
③应纳税额
★CPA真题:某商品。
罗森财政学复习资料(双语版)第一篇:罗森财政学复习资料(双语版)罗森财政学复习资料(双语版)Unified budget: The document which itemizes all the federal government’s expenditures and revenues.统一预算:联邦政府在一种文件中将其支出逐项列出的文件Regulatory budget: an annual statement of the costs imposed on the economy by government regulations 管制预算:政府管制对经济产生的成本Entitlement programs: programs whose expenditures are determined by the number of people who qualify ,rather than preset budget allocations.公民权利性计划:(是指有关社会保障、公共福利计划、农产品价格维持等法律规定受益人和收益数额的政府支出项目)项目的成本不是由固定的美元数额来决定,而是由符合条件的人的数量决定。
Substitution effect :the tendency of an individual to consume more of one good and less of another because of a decrease in the price of the former relative to the latter.替代效应:是指一种商品价格的变化所引起的使消费者调整该种商品与其他商品需求量比例的效应。
Income effect : the effect of a price change the quantity demanded due exclusively to the fact that the consmer’s income has changed 收入效应:收入效应指由商品的价格变动所引起的实际收入水平变动,进而由实际收入水平变动所引起的商品需求量的变动。

Chapter One IntroductionThis book is about the taxing and spending activities of government, a subject usually called public finance.This term is something of a misnomer, because the fundamental issues are not financial (that is, relating to money). Rather, the key problems relate to the use of real resources. For this reason, some authors prefer the label public sector economics or simply public economics.We focus on the microeconomic function of government- the way government affects the allocation of resources and the distribution of income.This book follows tradition by focusing on governmental spending and revenue-raising activities.Public Finance and IdeologyOpinions on how government should function in the economic sphere are influenced by ideological views concerning the relationship between the individual and the state. Political philosophers have distinguished two major approaches.1. Organic View of GovernmentSociety is conceived of as a natural organism. Each individual is a part of this organism, and the government can be thought of as its heart. The individual has significance only as part of the community, and the good of the individual is defined with respect to the good of the whole. Thus, the community is stressed above the individual.The goals of the society are set by the state, which attempts to lead society toward their realization. The choice of goals differs considerably.Because societal goals can differ, a crucial question is how they are to be selected. Proponents of the organic view usually argue that certain goals are natural for the societal organism.2. Mechanistic View of GovernmentGovernment is not an organic part of society. Rather, it is a contrivance created by individuals to better achieve their individual goals.Virtually everyone agrees that it is good for individuals when government protects them from violence. To do so government must have a monopoly on coercive power.Opinions within the mechanistic tradition diverge. Libertarians, who believe in a very limited government, argue against any further economic role for the government. Libertarians are extremely skeptical about the ability of governments to improve social welfare.Social democrats believe that substantial government intervention is required for the good of individuals.3. Viewpoint of This BookThe mechanistic view of government has come to dominate Anglo-American political thought. Not surprisingly, Anglo-American economic thought has alsodeveloped along individual lines. Within the individualistic tradition there is much controversy with respect to how active government should be.Economic policy is not based on economic analysis alone. The desirability of a given course of government action inevitably depends in part on ethical and political judgments.Government at a Glance1. The Legal Framework2. The Size of GovernmentA more sensible (and common) approach is to measure the size of government by the volume of its annual expenditures, of which there are basically three types:(1) Purchase of goods and services.(2) Transfers of income to people, businesses, or other governments.(3) Interest payments.The federal government itemizes its expenditures in a document referred to a as the unified budget. However, some government activities have substantial effects on resource allocation even though they involve minimal explicit outlays. For example, issuing regulations per se is not very expensive, but compliance with the rules can be very costly. Some have suggested that the costs imposed on the economy by government regulations be published in an annual regulatory budget. Unfortunately, computing such costs is exceedingly difficult so it is unlikely there will ever be an official regulatory budget.The figure is a misleading indicator of the growth of government for several reasons:(1) Because of inflation, the dollars decreased in value over time.(2) The population has also grown over time. An increasing population by itself creates demands for a larger public sector.(3) It is sometimes useful to examine government expenditure compared to the size of the economy. If government doubles in size but at the same time the economy triples, then government has relatively shrunk.Government expenditures have increased in both nominal and real absolute terms, in per capita terms, and as a percentage of GDP.3. ExpendituresNational defense and Social Security are the largest spending items in the federal budget.Much of the government budget consists of so-called entitlement programs-programs determined by the number of people who qualify which are out of hands of the current government. The fast-growing areas such as Social Security and interest payments are relatively fixed in the sense that they are determined by the previous decisions.The share of national defense spending in federal expenditure has fallen over time, while Social Security, public welfare, and payments on outstanding debt have increased in importance. The combination of entitlement programs and interestof the payments reduces yearly control over the level of expenditures. About 34federal budget is relatively uncontrollable.It is useful to break down total expenditures by level of government. State and local governments are clearly important players.4. RevenuesAt the federal level, personal income taxation is currently the single most important source of revenue, accounting for about 45% of the tax collections. Socialof federal revenue collections, which are payroll tax Insurance accounting for 13collections used to finance Social Security and Medicare. The federal corporate income tax decreases. In the state and local sector, the property tax decreases and individual income taxes increase.Changes in the Real Value of Debt When the government is a debtor and prices increase, changes in the real value of the debt may be an important source of revenue.。
第一章P.164.a.政府对经济的影响增加了。
如果政府规模是由其直接支出来衡量,这项法规不会直接导致政府支出的增加。
然而,这可能会导致较高的遵从成本,并在“规制预算”中得到体现。
b.这项法律可能不会增加政府支出,但遵从这些管制的高昂代价将会增加管制预算。
c.很难说政府对经济的影响是增加了还是减少了,因为难以确定这一现象是反映了政府规模的扩大还是缩小。
一种可能是,GDP保持不变,而政府对商品和服务的购买减少;另一种可能是,政府对商品和服务的购买增加,但增长的比率低于GDP同期增加的比率。
同时还应考虑同期联邦政府的信贷、规制活动以及州和地方的预算等。
d.政府对经济的影响总体上可能并不改变。
如果联邦减少向州和地方政府的补助,联邦预算将要缩减。
然而,如果州和地方政府通过增加税收来抵消这一影响,把各级政府作为一个整体来看,其规模并不会以想象的幅度缩减。
第二章P.327.利用相关软件可以得出结论:赤字和利率之间存在着微弱的负相关关系。
但仅仅5年的数据得到的检验结果并不可靠。
因为货币政策、经济活动的水平等因素都会影响利率。
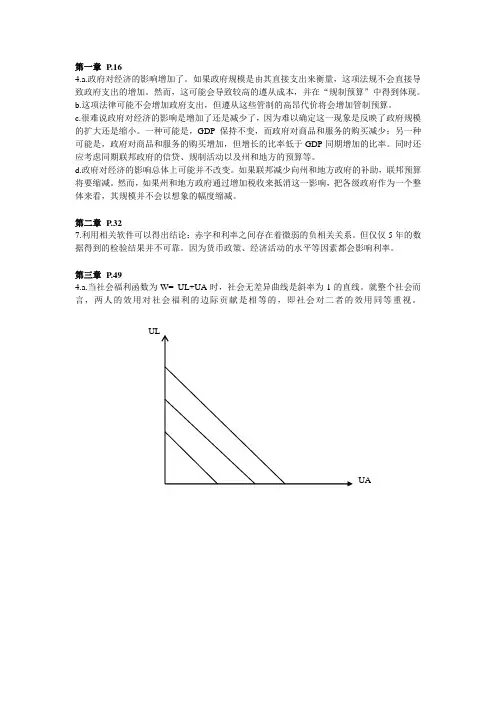
第三章P.494.a.当社会福利函数为W= UL+UA时,社会无差异曲线是斜率为-1的直线。
就整个社会而言,两人的效用对社会福利的边际贡献是相等的,即社会对二者的效用同等重视。
b. 当社会福利函数为W= UL+2UA时,社会无差异曲线是斜率为-2的直线。
这表明,与利维亚相比,社会两倍重视于奥古斯塔斯的效用。
c.结合效用可能性边界与社会无差异曲线,该种社会福利函数下的两种可能的最优解如下图所示。
ULUL8.当马克的收入的边际效用等于朱迪收入的边际效用时,社会福利最大化。
对已知条件中的两个效用函数求一阶导数,使MU M=MU J,则最大化条件为I J=4I M,因为固定收入是300美元,这意味着马克应该有60美元,朱迪应该有240美元,此时社会福利达到最大化。
10.a.错误。
帕累托效率的必要条件是,两种商品的边际替代率要等于其边际转换率。

罗森财政学第七版(英文版)配套习题及答案Chap007CHAPTER 7 - Income Redistribution: Conceptual IssuesMultiple Choice Questions1. An in-kind transfer is aa) transfer made by people to be kind to others.b) transfer of wealth.c) transfer of goods and services instead of cash.d) system of clearing checks by local banks.2. For the additive social welfare function to yield results, we must assumea) individuals have identical utility functions.b) individu als’ utility functions have diminishing marginal utility of income.c) the total amount of income available is fixed.d) all of the above.e) none of the above.3. The poverty rate in the United States has __________ over the last 30 years.a) remained the sameb) increasedc) decreasedd) not been accurately measurede) done none of the above4. Generally, official poverty measures ignorea) the impact of taxes.b) the value of in-kind transfers.c) the value of medical expenses that are paid by the government.d) all of the above.5. Taking into account the utility of all persons in society is referred to asa) a utilitarian social welfare function.b) equalizing social welfare function.c) an in-kind transfer.d) a Pareto equilibrium.e) all of the above.6. A notion that supports the idea that some items should be distributed equally to all isknown asa) Pareto efficiency.b) the Hoover Principle.c) poverty gap closing.d) commodity egalitarianism.e) none of the above.7. The middle class in the United States has _______ since the late 1960s.a) stayed the sameb) decreasedc) increased a great deal but then declinedd) increased slightly8. The _________ of whites in poverty in the U.S. is greater than that of blacks andHispanics.a) percentageb) total numberc) fractiond) none of the above9. In a public goods context, it is difficult to measure its impact on real income becausea) public goods are generally free to the public.b) they make up a small percentage of total GDP.c) people do not reveal how they value public goods.d) inflation decreases the value of the good.10. In-kind transfers have increased in popularity because ofa) paternalism.b) commodity egalitarianism.c) administrative feasibility.d) political attractiveness.e) all of the above.11. Maximizing the utility of the person with the minimum utility is known asa) the minimax criterion.b) the maximin criterion.c) the Hicks-Kaldor criterion.d) the Corlett-Hague Rule.e) none of the above.12. An additive social welfare function woulda) add the incomes of the lowest ten percent of income earners.b) subtract out the utility functions of all people who are unemployed.c) sum all individual utilities.d) maximize the utility of the person with the minimum utility.13. Changing the price of good Y willa) only affect the demand for that good.b) have effects across some markets.c) keep prices down in all markets.d) have no effect.e) do none of the above.14. Giving poor people food instead of cash for fooda) is an in-kind transfer.b) will benefit some more than others, depending on their utility function.c) is politically popular.d) is all of the above.15. The scope of the EITC program changed dramatically ina) 1963.b) 1983.c) 1993.d) 1996.e) 2003.Discussion Questions1. Suppose there are only two people, Mr. Mullinax and Ms. Fleming, who must split afixed income of $500. For Mr. Mullinax, the marginal utility of income is MU m=600-2I m, while for Ms. Fleming, marginal utility is MU f=600-3I f , where I m, I f are the amounts of income to Mr. Mullinax and Ms. Fleming, respectively.a) What is the optimal distribution of income if the social welfare function isadditive?b) What is the optimal distribution if society values only the utility of Ms. Fleming?What if the reverse is true? Comment on your answer.c) Finally, comment on how your answers change if the marginal utility of incomefor both Mr. Mullinax and Ms. Fleming is constant such that MU m=250= MU f.(This one is subtle.)2. Suppose that in a certain society $10,000 is the official cut-off of income for the poor.This means that any person making less than $10,000 is considered poor. Suppose further that there are three people in this society: Randy, Marlon, and Tito, with incomes of $9,900, $9,900, and $5,000, respectively.a) How many people are in poverty?b) How much income would it take, on average, to lift every poor person out ofpoverty?c) What if some policy caused $200 to be taken from Tito and given to Randy. Howmany people are in poverty now? How much income would it take, on average,to lift every poor person out of poverty?3. Suppose Lefty has utility characterized by the equation: U l = 13I1/2, where I is income. Inaddition, Righty has utility characterized by the equation: U r = 4I2, where I is income.a) If each had $100, which one would have the higher level of utility?b) What equal amount of income could we give to both that would also give themthe same level of utility?True/False/Uncertain Questions1. Giving in-kind transfers will ensure that people get proper amounts of nutrition.2. Ignoring taxes when making redistributive decisions has no impact on equity.3. A redistribution is Pareto efficient if no one is made worseoff afterward.4. Social welfare functions require that a society has at least three people living in it.5. Income is the only accurat e measure that can be used to assess a person’s wealth.6. Ethics play a key role in income redistribution.7. Poverty is relative and not absolute.8. The highest 20% of money earners should only have 20% of all income.9. Refer to Table 7.1 in your textbook. Relative to their starting position, people in thefourth-fifth of the income distribution have seen the greatest decrease in their share of income.10. The poverty rate in the United States has decreased by more than 50% over the last 40years.Essay Questions1. How would poverty be affected in the United States if the measure were changed to amore comprehensive one that included the value of in-kind transfers, medical services, and taxes?2. State whether you agree with the following stat ement and why: “It doesn’t make sense togive poor people cash since they’ll spend it on cigarettes and lottery tickets instead of needed items.”3. How would you feel about a policy that would raise someone else’s income withoutlowering yours? Are you any worse off?Answers to CHAPTER 7 - Income Redistribution: Conceptual IssuesAnswers to Multiple-Choice Questions1. c2. d3. c4. d5. a6. d7. b8. b9. c10. e11. b12. c13. b14. d15. cAnswers to Discussion Questions1. The setup should be I m + I f = 500 and 600-3I f =600-2I m.a) Solving this system of two equations and two unknowns gives I m = 300 and I f =200.b) Since these two lines intersect at 0, the optimal distributions would remain I m =300 and I f = 200.c) Since they are constant horizontal lines at $250, any distribution of the $500 willbe optimal.2. a) Three people are in poverty.b) It would take $1,733.33, on average, to lift them out.c) Two people are in poverty but it would now take $2,650.00, on average, to liftthem out.3. a) Lefty would have 130. Righty would have 40,000.b) The only level that would work for both is 0.Answers to True/False/Uncertain Questions1. U2. F3. T4. F5. F6. T7. T8. U9. F10. TAnswers to Essay Questions1. Estimates have shown that poverty measures that are more comprehensive yield resultsabout the changing face of poverty in the United States that are dramatically different than the ones we are currently using.2. It is difficult to predict what any individual will do without knowing his or herpreferences. Cash for some will allow them to reach higher levels of utility, while for others in-kind transfers may be more effective. Generalized statements are too broad. 3. If total income is fixed, it would be impossible to raise the income of some withoutlowering the income of others. If income is not fixed, those who do not experience an increase in income while others’income increases, will be worse off in a relative sense.。
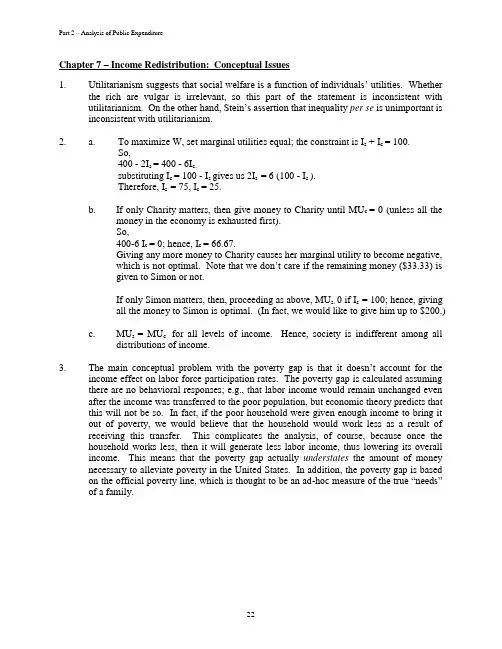
Chapter 7 – Income Redistribution: Conceptual Issues1. Utilitarianism suggests that social welfare is a function of individuals’ utilities. Whetherthe rich are vulgar is irrelevant, so this part of the statement is inconsistent with utilitarianism. O n the other hand, Stein’s assertion that inequality per se is unimportant is inconsistent with utilitarianism.2. a. To maximize W, set marginal utilities equal; the constraint is I s + I c = 100.So,400 - 2I s = 400 - 6I c.substituting I c = 100 - I s gives us 2I s = 6 (100 - I s ).Therefore, I s = 75, I c = 25.b.If only Charity matters, then give money to Charity until MU c = 0 (unless all themoney in the economy is exhausted first).So,400-6 I c = 0; hence, I c = 66.67.Giving any more money to Charity causes her marginal utility to become negative,which is not optimal. Note that we don’t care if the remaining money ($33.33) isgiven to Simon or not.If only Simon matters, then, proceeding as above, MU s. 0 if I s = 100; hence, givingall the money to Simon is optimal. (In fact, we would like to give him up to $200.)c.MU s = MU c for all levels of income. Hence, society is indifferent among alldistributions of income.3. The main conceptual problem with the poverty gap is that it doesn’t account fo r theincome effect on labor force participation rates. The poverty gap is calculated assuming there are no behavioral responses; e.g., that labor income would remain unchanged even after the income was transferred to the poor population, but economic theory predicts that this will not be so. In fact, if the poor household were given enough income to bring it out of poverty, we would believe that the household would work less as a result of receiving this transfer. This complicates the analysis, of course, because once the household works less, then it will generate less labor income, thus lowering its overall income. This means that the poverty gap actually understates the amount of money necessary to alleviate poverty in the United States. In addition, the poverty gap is based on the official poverty line, which is thought to be an ad-hoc measure of the true “needs”of a family.4. A day care center is an example of an in-kind compensation. The figure below is similarto Figure 8.2 in the text. The original budget line is G1 H1 If the employee received $5,000 cash, the budget line moves to G2 H2 . An employee who uses the day care center may not be $5,000 better off. The employee consumes at point A, but would be better off at point B, which represents consumption after a cash transfer of $5,000.5. a. This would increase the incomes of the providers of computer equipment and theindividuals who maintain the equipment. In the long run, this might also increasethe incomes of the students who use the equipment. Moreover, giving a laptop toall seventh graders (rather than poor seventh graders) may simply “crowd-out”computer transfers from parents to children. One could imagine that nowadaysmany children do have a computer at home, paid for by the parents. Thisgovernment transfer may simply result in less parental transfer to the child.b.Providing free after-school programs for children in impoverished families largelyacts as an in-kind transfer for poor, working households. The program is of littlevalue for unemployed households, as the alternative would be childcare at home.For those who are employed, and paying for childcare, this program provides analternative and effectively changes the after-tax, after-working-cost wage. Thisalso may affect work behavior on the extensive margin. The likely “losers” fromsuch a program are childcare providers, who see a reduction in demand for theirservices. In principle, this reduction in demand could lower the hourly childcarecost for all workers with children, though this effect is likely to be modest becausemost impoverished families do not have a very large labor force attachment and,thus, their effect on the childcare market as a whole is likely to be small.6. a. False. Society is indifferent between a util to each individual, not a dollar to eachindividual. Imagine that U L=I and U J=2I. Then each dollar given to Jonathanraises welfare more than the same dollar given to Lynne.b. True. The social welfare function assumes a cardinal interpretation of utility sothat comparisons across people are valid.c. False. Departures from complete equality raise social welfare to the extent thatthey raise the welfare of the person with the minimum level of utility. Forexample, with the utility functions U L=I and U J=2I, the social welfare functionW=min[U L,U J] would allocate twice as much income to Lynne than Jonathan.7. Initially the price of food was $2 and the price of other goods was $1. The black marketfor food stamps changes the price of food sold to $1. In Figure 7.2 of the textbook, as one moves to the “northwest” from point F, the segment will now have a slope (in absolute value) of 1 rather than 2. The black market may make the individual better off if the best point on her budget constraint AFD was initially at the corner solution of point F, and the black market certainly does not make her worse off. It is important to note that the black market does not always make the recipient better off. If the (absolute value) of the marginal rate of substitution (MRS) were between 1 and 2, the indifference curve would not “cut” into the new part of the budget constraint with the black market.If the MRS were less than (or equal to) 1 in absolute value, the person would be made better off and would reduce food consumption by selling the food stamps on the black market.Food StampGuarantee Food8. Pareto efficient redistribution is a reallocation of income that increases (or does notdecrease) the utility of all consumers. With these two consumers, Marsha’s utility increases as Sherry’s utility increases. Thus, it may be possible to reallocate income from Marsha to Sherry and raise both of their utility. With Sherry’s initial utility function of U S=100Y S1/2, her utility with $100 of income is U S=100($100)1/2, or U S=1,000. With Marsha’s initial utility function of U M=100Y M1/2+0.8U S, her utility with $100 of income is U M=100($100)1/2+0.8(1,000), or U M=1,800. If the social welfare function is additive, then initial welfare is W=U S+U M=1,000+1,800=2,800. If $36 is reallocated from Marsha to Sherry, then Sherry’s income is now $136 and Marsha’s is now $64. With Sherry’s utility function, her utility with $136 of income is U S=100($136)1/2, or U S=1,166.190.With Marsha’s utility function, her utility with $64 of income is U M=100($64)1/2+0.8(1,166.190), or U M=800+932.952=1,732.952. In this case, Sherry’s utility increases from 1,000 to 1,166.190, while Marsha’s utility falls from 1,800 to 1,732.952. Social welfare increases with this redistribution, going from 2,800 to 2,899.142. Thus, this redistribution increases social welfare, but is not Pareto efficient redistribution.Chapter 8 – Expenditure Programs for the Poor1. a. Note that the figure below shows the correct shape of the budget constraint, butthe numbers themselves are outdated. With a wage rate of $10 per hour,Elizabeth earns $100. Because the deduction in California is $225, none of herearnings are counted against the $645 welfare benefit. Thus, her total income is$745 (=$100+$645).b.The actual welfare benefits collected by a person equals B=G-t(Earnings-D),where B=actual benefits, G=welfare grant, t=tax rate on earned income, andD=standard deduction. Thus, (Earnings-D) is the net earnings that are taxed awayin the form of reduced benefits. When benefits equal zero (B=0), the expressionbecomes 0=G-t(Earnings-D), which collapses to: Earnings=G/t+D. This is knownas the “breakeven formula.” In the California context here, the expressionbecomes Earnings=$645/0.5 + 225, or Earnings=$1,515. With a wage rate of $10per hour, this corresponds to 151.5 hours of work per month.c.The diagram shows the correct shape of the budget constraint, but the “577” figureshould be r eplaced with “645” and the “9” hours should be replaced with “22.5”.d.The diagram above shows one possibility – in this case, Elizabeth is both workingand on welfare – but she collects a reduced welfare benefit in this case.2. One could gather data on the earnings of those in the program, as well as earnings datafrom nonparticipants. Regress the earnings variable on demographic variables and other factors that determine earnings (such as education and experience), and a variable that indicates whether the individual participated in the training program. Factors that affect local employment conditions, such as unemployment levels, may help explain earnings, but they may also explain participation in the program. The econometric strategy should be chosen carefully to account for this.3. If the quantity of leisure consumed by X appears as an argument in the utility function ofY, then X’s consumption of leisure creates an externality. If the externality is negative(i.e., Y likes X to work), then a wage subsidy of X might induce him to work the efficientnumber of hours. Alternatively, a workfare program might achieve the same goal by simply forcing X to work. However, to the extent that the feasible quantity of labor supply is determined less through market incentives now, workfare would be less efficient.4. He participates in the public housing program as long as P1P2ca cef.5. As illustrated below, the budget constraint with food stamps has a “notch” in it, similar tothe analysis of Medicaid in Figure 8.9 of the textbook. At the notch, the marginal tax rate is greater than 100%. One key difference from the figure in the textbook is that the marginal tax rate on earned income for Medicaid is 0% until the “Medicaid notch,” while the marginal tax rate on earned income for food stamps is 24% until the “food stamp notch.” The reason the food stamp notch exists at all is that there is a “gross income test,” where a recipient is ineligible if income is higher than the limit. The characterization in the Rosen textbook on page 189 that “at some point near the poverty line, food stamps worth about $1,250 are suddenly lost” implicitly assumes that childcare costs are quite high. This is likely to be true for many households. In the year 2004, this monthly (annual) gross income limit was $1,994 per month ($23,928 per year) for a family of four, while the monthly guarantee was $471 ($5,652 per year). Assuming the family had earnings at the limit of $1,994 of earnings during the month, and after applying a 20% earnings deduction and a $134 monthly standard deduction, the household would receive a monthly (annual) benefit of $32 ($384). We arrive at this number using the equation B=G-t(E-.2E-D)=471-.3(.8*1994-134)=$471-$438.36=$32.64, which is then rounded down to $32. In this case, B=actual benefits received, G=food stamp guarantee, t=tax rate, E=earnings, and D=standard deduction. Increasing annualearnings by $1 from $23,928 to $23,929 would reduce food stamp benefits from $384 to $0; hence the “food stamp notch.” This notch would be even higher if the household qualified for a childcare deduction, child support deduction, or shelter deduction. The childcare deduction ranges between $175 and $200 per child per month. Assuming this family of four consisted of a mother and three children, each with $175 of monthly childcare costs, then B=G-t(E-.2E-D-C)=471-.3(.8*1994-134-525)=$471-$280.86=$190.14, which is then rounded down to $190. The modification here is that C=childcare costs. This amount corresponds to an annual food stamp benefit of $2,280. Figure 8.5 below draws the budget constraint using annual levels for the food stamp program, using 2004 rules and assumes no childcare expenses.6. For an individual who is not working while on welfare, in this case the highestindifference curve touches the budget constraint on the right vertical axis. Note that the marginal rate of substitution (MRS) does not necessarily equal the after-tax wage rate at the time endowment – rather, it is possible that the person would want to consume more leisure than the time endowment but is obviously constrained from doing so.Leisure$23,928Leisure7.In all cases, the demand curve for housing slopes downward. a. If the price of low income housing gets bid up but there is no increase in the stock of housing, then the supply curve is perfectly inelastic, e.g., vertical.Q 0Q HOUSINGFIGURE 8.7a – Demand curve shiftsb.If there is no increase in the price of housing, but there is an increase in the stockof housing, then the supply curve is perfectly elastic, e.g., horizontal.Q 0Q HOUSINGFIGURE 8.7b – Demand curve shifts Q 1c.If there is an increase in both the price and quantity of housing, then the supplycurve slopes upward.According to Sinai and Waldfogel, there is partial crowding out, consistent with case cabove. Although the underlying housing stock itself is probably quite inelastic in the short-run, the number of rental homes can be more elastic as (potential) landlords convert vacation homes or vacant homes into rental units.8. a.When Eleanor’s hours (earnings) go from 0 to 1,000 ($0 to $8,000), she qualifiesfor an additional earned income tax credit (EITC) worth $3,200 (=0.4*8,000).Thus, her income goes up from $0 to $11,200. Note to instructors – thedistinction between earnings and income may cause confusion in the students’answers. b.When Eleanor’s hours (earnings) go from 1,000 to 1,500 ($8,000 to $12,000), shequalifies for the maximum EITC (according to Figure 8.8 in the textbook). Shereceives the full EITC when her earnings exceed $10,510, at which time the creditequals $4,204 (=0.4*$10,510). The earnings between $10,510 and $12,000 face neither a subsidy nor phase-out from the EITC. Thus, her income goes up from $11,200 to $16,204.c. When Eleanor’s hours (earnings) go from 1,500 to 2,000 ($12,000 to $16,000),she moves into the range where the EITC is phased out. According to Figure 8.8 Q 0Q HOUSINGFIGURE 8.7c – Demand curve shifts outward,Q 1in the textbook, she receives the maximum subsidy of $4,204 until her earningsexceed $14,730. For the marginal earnings between $14,730 and $16,000, theEITC is reduced at a 21.06% tax rate. Thus, her EITC falls by $267.46 from$4,204 to $3,936.54 (=4,204-0.2106*(16,000-14,730)). Her income rises from$16,204 to $19,936.54.Chapter 9 – Social Insurance I: Social Security and Unemployment Insurance1. With adverse selection, insurance contracts with more comprehensive coverage arechosen by people with higher unobserved accident probabilities. To make up for the fact that a benefit is more likely to be paid to such individuals, the insurer charges a higher premium per unit of insurance coverage.2. There are many possible implications of a voluntary Social Security system. Onepossibility is that people would save less for retirement, betting that society would not put up with having great numbers of elderly poor. Part of the effect of the Friedman program, then, would depend on the government's credibility when it promises not to bail out people who do not save enough to survive during retirement.3. Use the basic formula for balance in a pay-as-you-go social security system:t =(N b/N w)*(B/w).Call 1990 year 1 and 2050 year 2. Thent1 = .267*(B/w)1t2 = .458*(B/w)2It follows that to keep (B/w)1=(B/w)2 we require t2/t1=.458/.267=1.71. That is, tax rates would have to increase by 71 percent. Similarly, to keep the initial tax rate constant, we would require (B/w)2/(B/w)1=.267/.458=0.58. Benefits would have to fall almost by half.4. If Social Security benefits are partially taxed for those who have other income over acertain level, then there is an implicit means test in receiving full, untaxed benefits.However, there is no explicit means test for eligibility for the program. Everyone receives benefits, though some recipients must pay some tax on them. Thus, the two statements are somewhat inconsistent with each other.5. Austen’s quote seems like it could relate adverse selection, but perhaps more likely, tomoral hazard. The q uote “If you observe, people always live forever when there is any annuity to be paid them” in a sense sounds like they act differently (e.g., better diet, more exercise, etc.) when an annuity is to be paid –the idea of moral hazard. In contrast, adverse selection suggests that people who expect to live a long time to be the ones who purchase annuities. A recent paper by Finkelstein and Poterba (NBER working paper, December 2000) found that “mortality patterns are consistent with models of asymmetric inf ormation” and that annuity “insurance markets may be characterized by adverse selection.”6. Equation (9.1) relates taxes paid into the Social Security system to the dependency ratioand the replacement ratio, that is, t=(N b/ N w)*(B/w). If the goal of public policy is to maintain a constant level of benefits, B, rather than a constant replacement ratio, (B/w), then taxes may not need to be raised. If there is wage growth (through productivity), then it is possible to maintain B at a constant level, even if the dependency ratio is growing.By rearranging the equation, we can see that B=t*w*(N b/ N w)-1. That is, increases in wage rates (the second term) offset increases in the dependency ratio (the third term).Thus, constant benefits do not necessarily imply higher tax rates.7. The statement about how the different rates of return in the stock market and governmentbond market affect the solvency of the trust fund is false. If the trust fund buys stocks, someone else has to buy the government bonds that it was holding. So, there is no new saving and no new capacity to take care of future retirees.8. Diamond and Gruber’s calculations suggest that the additional year of work (and delayedretirement) lowers the present discounted value of expected Social Security wealth by $4,833. If the adjustment were actuarially fair, Social Security wealth would neither rise nor fall. Since wealth falls, the adjustment is actuarially unfair.9. For those who argue that the scheme for financing Social Security is unfair becausepeople with low earnings are taxed at a higher rate than those with high earnings, the key issue is that the cumulative payroll tax of 12.4 percent is capped for each person, after which the payroll tax is zero (this ignores the 2.9 percent uncapped Medicare tax, however). The earnings ceiling in 2004 is $87,900. Hence, Social Security payroll taxes as a share of earnings fall after the ceiling is passed – thus, the Social Security payroll tax may be thought of as regressive. The opponents to this view note that the above analysis only focuses on taxes paid, not benefits received. As shown in Table 9.3, Social Security redistributes from high earners to low earners, and the formula for the primary insurance amount offers extremely high replacement rates to very low earners, and much lower replacement rates to high earners. Thus, the net tax payment(taxes minus benefits) is likely to be progressive, not regressive. One critical assumption in this kind of analysis is how one computes lifetime benefits –e.g., do we assume that low earners and high earners live the same number of years?10. Let G stand for the individual’s gross earnings. The question assumes that the personfaces a marginal tax rate of 15% and a payroll tax of 7.45%. Thus, the person’s after-tax earnings (denoted by N) are N=(1-t earn-t payroll)G, or N=(1-0.15-0.0745)G, or N=0.7755G.It is assumed that the gross unemployment benefits, U, are equal to 50 percent of before-tax earnings, or U=0.5G. Net unemployment benefits, B, take out income taxes, so B=(1-t earn)U=(1-t earn)0.5G=(1-0.15)0.5G=0.425G. The percentage of the individual’s after-tax income that is replaced by UI is therefore equal to B/N, or 0.425G/0.7755G, which is approximately 54.8%.Unemployment benefits are about 55% of the individual’s previous after-tax income. The effects of unemployment insurance on unemployment area matter of considerable debate. While the high replacement rates from UI may increasethe duration of unemployment, the longer search time may reduce recurrence of unemployment by allowing time for a worker to find a better job match. Empiricalstudies seem to show that the hazard rate into employment spikes up around the time that benefits run out – perhaps suggesting that job matches are not really improving.Chapter 10 – Social Insurance II: Health Care1. The quotation contains several serious errors. First, concern with health care costs doesnot mean that health care is not a “good.” Economists do not care about the cost of health care per se. Rather, the issue is whether there are distortions in the market that lead to more than an efficient amount being consumed. Second, it makes a lot of difference how money is spent. One can create employment by hiring people to dig ditches and then fill them up, but this produces nothing useful in the way of goods and services. Thus, employment in the health care sector is not desirable in itself. It is desirable to the extent that it is associated with the production of an efficient quantity of health care services.2. a. Those who have a relatively high probability of needing the insurance are the oneswho are most likely to buy it. This raises the premium, which in turn, leads toselection by people who have an even higher probability of using it. The cyclecontinues until the price is so high that virtually no one purchases the policy.b.Employer-provided health insurance is deductible to the employer and not taxed tothe employee.c.Because of the tax subsidy, individuals may purchase more than the efficientamount of health insurance. That is, they “over-insure.” An interesting exampleof how the tax system leads to overinsurance is given in a recent Wall StreetJournal (January 19, 2004) article by Martin Feldstein. He gives an example oftwo different California Blue Cross health plans – identical in all respects exceptfor the deductible and annual premiums. The low-deductible plan (the “generous”plan) has a deductible of $500 per family member, up to a maximum of two andan annual premium of $8,460. Thus, the maximum out-of-pocket expense is$1,000. The high-deductible plan (the “less generous” plan) has a deductible of$2,500 per family member, up to a maximum of two, and an annual premium of$3,936. Thus, the maximum out-of-pocket expense is $5,000. Note that thepremium savings of $4,524 actually exceeds the maximum incremental deductiblepayment of $4,000 (which would only occur if the family had very high healthexpenses). In principle, the high deductible plan is unambiguously better. But thetraditional tax rules could lead an employer to choose the low deductible policy.If the employee faced a marginal tax rate of 45% (the sum of federal, state, andpayroll tax rates), then if the $4,524 premium saving was turned into taxablesalary, the individual’s net income would only rise by $2,488. Thus, families withhigh expected medical expenses do better with the “generous” plan, even though itis more costly in terms of premiums.3. a. D d=4.22–(0.044)(50)=2 visits per year.Total expenditure =(2)(50)=$100b.Now the individual pays only $5 per visit.D d = 4.22 – (0.044)(5) = 4 visits, with out-of-pocket costs of $20.Insurance company pays ($45)(4) = $180Total expenditure = $200, double its previous level.4. Examining Figure 10.1, we can see why health care costs increased for the state ofTennessee. As insurance coverage increases, this lowers the cost of medical expenses for those who were previously did not have insurance, which increases the overall amount of medical services they consume. Before receiving insurance, these people demand M o units of medical services, and the amount they pay is represented by the area OP o aM o.But after receiving insurance coverage, they demand M1amounts of medical services, paying only OjhM1, while their insurance pays jP o bh. The increase in insurance payments is sizable for two reasons – first, by providing coverage, it pays for the majority of the already sizable medical expenses incurred by this group, and second, the introduction of insurance makes the group consume even more medical services. In short, if the people who designed the Tennessee program had realized that the demand curve for medical services is downward sloping, they would not have been surprised at the consequences of their program.To explain why HMOs have been unable to contain long-run health care costs, it is necessary to consider the effect of technology on health care costs in the long-term. The inherent problem is that the market for medical care places a large premium on using the latest and most-developed medicines and machinery for treating patients. These technologies tend to be expensive. Hence, while introducing HMOs can lead to a once and for all decrease in the rate of change in health care costs, there is nothing that an HMO can do to lower the cost of continually providing the latest in medical treatments. 5. The goal of making the Medicare prescription drug benefit a one-time, permanentdecision is to reduce the adverse selection problem (no te: the current “Medigap”program operates in this manner to some extent – a senior citizen has choice over all 10 of the Medigap plans for only a short period of time after they turn 65, after which they may be denied based on their health). Imagine a cohort of people turning age 65 and becoming eligible for the Medicare drug benefit. If the decision to enter (or exit) could be made every year, then healthy senior citizens would have a strong incentive to wait until they became unhealthy and needed drugs, and then enter the prescription drug program (presumably resulting in economic losses for the program). Similarly, when people who were collecting the prescription drug benefit became healthy, they would have a strong incentive to “opt-out” of the prog ram. By making the decision opt-in at the beginning or not at all, the healthy younger seniors are likely initially cross-subsidizing the older seniors. Note that this “opt-in at the beginning” works because bad health and older age are positively correlated with each other. If, for example, younger seniors used more drugs (and perhaps older seniors used more inpatient care, etc.), then older seniors could simply stop paying annual premiums and give up their option of being in the program. If this scenario held empirically, this would exacerbate the adverse selection problem and the opt-in scenario would not completely solve the adverse selection problem.6. The budget constraint initially has units of Medigap on the x-axis, and other goods on they-axis. Given initial prices of $1 per unit for each good, and $30,000 of income, the budget constraint has a slope of -1, and the intercepts on both axes are at 30,000 units. It is assumed that the initial utility maximizing bundle consumes 5,000 units of Medigap, hence the indifference curve is tangent at (5000,25000). All of this is illustrated in the figure below.Medigapefficiency units30,000 5,000After the “minimum Medigap” mandate, the consumer can either choose 0 units of Medigap or 8,000 or more units of Medigap. Thus, part of the budget constraint is eliminated (though the overall shape remains the same as before). After the mandate, the point (0,30000) is available, as well as all of the points to the southeast of the point (8000,22000). Clearly, the person’s utility must fall since the preferred choice, (5000,25000) is no longer available. If the person attains a higher level of utility as (0,30000) compared with (8000,22000), the person chooses to not purchase Medigap. In this case, the marginal rate of substitution is no longer equal to the price ratio. This is illustrated below.Medigapefficiency units30,000 5,000 8,000。
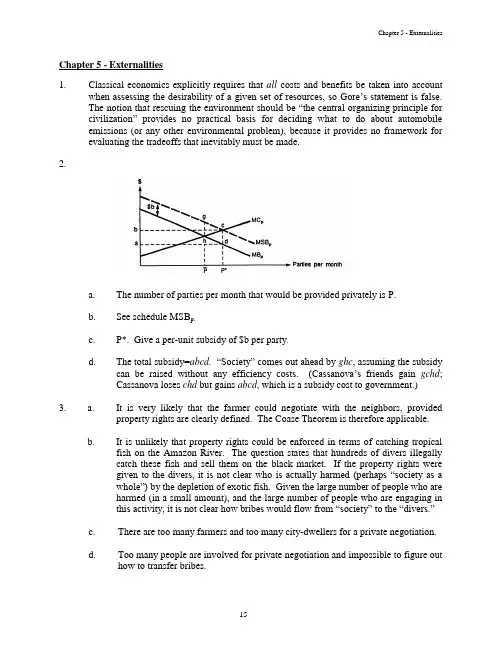
Chapter 5 - Externalities1. Classical economics explicitly requires that all costs and benefits be taken into accountwhen assessing the desirability of a given set of resources, so Gore’s statement is false.The notion that rescuing the environment sho uld be “the central organizing principle for civilization” provides no practical basis for deciding what to do about automobile emissions (or any other environmental problem), because it provides no framework for evaluating the tradeoffs that inevitably must be made.2.a.The number of parties per month that would be provided privately is P.b.See schedule MSB p.c.P*. Give a per-unit subsidy of $b per party.d.The total subsidy=abcd. “Society” comes out ahead by ghc, assuming the subsidycan be raised w ithout any efficiency costs. (Cassanova’s friends gain gchd;Cassanova loses chd but gains abcd, which is a subsidy cost to government.)3. a. It is very likely that the farmer could negotiate with the neighbors, providedproperty rights are clearly defined. The Coase Theorem is therefore applicable.b. It is unlikely that property rights could be enforced in terms of catching tropicalfish on the Amazon River. The question states that hundreds of divers illegallycatch these fish and sell them on the black market. If the property rights weregiven to the divers, it is not clear who is actually harmed (perhaps “society as awhole”) by the depletion of exotic fish. Given the large number of people who areharmed (in a small amount), and the large number of people who are engaging inthis activity, it is not clear how bribes would flow from “society” to the “divers.”c. There are too many farmers and too many city-dwellers for a private negotiation.d. Too many people are involved for private negotiation and impossible to figure outhow to transfer bribes.4.a. The price of imported oil does not reflect the increased political risk byeffectively subsidizing authoritarian regimes like those in Saudi Arabia. b. The tax would estimate the marginal damage (e.g., the increased instability in theMiddle East, etc.) by importing oil from Saudi Arabia.c.The supply of TGRs is vertical at 104.5 billion if government seeks to reduceconsumption of gasoline to 104.5 billion. Consumers must have one TGR inorder to buy one gallon of gasoline, plus they must pay the price at the pump.Limiting TGRs effectively limits the demand for gasoline, so the price per gallonwill fall, but consumers must have TGRs in order to purchase gasoline. If themarket price of one TGR is $0.75, this means that supply and demand intersect at$0.75, as shown in the graph. This kind of program curbs consumption withoutgiving government more revenue because consumers are purchasing the TGRsfrom each other. However, the total amount of TGRs is limited by government.Those consumers seeking to purchase more gasoline than allowed by the initialallocation of TGRs can purchase additional TGRs from other consumers at themarket price of $0.75. By choosing to use a TGR to purchase gasoline, aconsumer incurs an opportunity cost equal to $0.75 since they cannot sell theTGR once it has been used.5. The use of the drug to treat sick cows leads to a positive externality (the benefit enjoyedby air travelers) as well as a negative externality (the costs created by a larger number of rats and feral dogs). Banning the drug might raise or lower efficiency, depending on whether the positive externality is larger or whether the negative externality is larger.TGRs$ 104.5 billion Supply of TGRsDemand for TGRs$0.75There are many ways to design incentive-based regulations. Policymakers could determine the efficient level of drug usage and then either allocate or sell the right to use the drug for sick cows.6. There are many policy alternatives for addressing problems with traffic congestion. Mostof these focus on reducing the number of vehicles on the road during high-traffic times, whether through regulation or through incentive-based programs.7. a. When the Little Pigs hog farm produces on its own, it sets marginal benefitequal to marginal cost. This occurs at 4 units.b. The efficient number of hogs sets marginal benefit equal to marginal social cost,which is the sum of MC and MD. At 2 units, MB=MSC=13.c. The merger internalizes the externality. The combined firm worries about thejoint profit maximization problem, not the profit maximization problem at eitherfirm alone. Thus, the LP farm produces 2 units, the socially efficient amount.d. Before the merger, the LP farm produced 4 units. By cutting back to 2 units, itloses marginal profit of $3. On the other hand, the Tipsy Vineyard’s profitsincrease by $20. Thus, profits increase by $17 altogether.8. Private Marginal Benefit = 10 - XPrivate Marginal Cost = $5External Cost = $2Without government intervention, PMB = PMC; X = 5 units.Social efficiency implies PMB = Social Marginal Costs = $5 + $2 = $7; X = 3 units.Gain to society is the area of the triangle whose base is the distance between the efficient and actual output levels, and whose height is the difference between private and social marginal cost. Hence, the efficiency gain is ½ (5 - 3)(7 - 5) = 2.A Pigouvian tax adds to the private marginal cost the amount of the external cost at thesocially optimal level of production. Here a simple tax of $2 per unit will lead to efficient production. This tax would raise ($2) (3 units) = $6 in revenue.9. In the absence of persuasive evidence on positive externalities for higher education, thereis no efficiency reason for the government to provide a free university education. Society may decide that a more equitable distribution of income is achieved by subsidizing higher education, but this is a debate involving value judgments.10. a. The total cost of emissions reduction is minimized only when the marginal costsare equal across all polluters, therefore a cost-effective solution requires that MC1= MC2 or that 300e1 = 100e2. Substituting 3e1 for e2 in the formula e1 + e2 = 40(since the policy goal is to reduce emissions by 40 units) yields the solution. It iscost-effective for Firm 1 to reduce emissions by 10 units and for Firm 2 to reduceemissions by 30 units.b. In order to achieve cost-effective emission reductions, the emissions fee should beset equal to $3,000. With this emissions fee, Firm 1 reduces 10 units and Firm 2reduces 30 units, but Firm 1 has to pay $3,000 for each unit of pollution theycontinue to produce, which gives them a tax burden of $3,000 x 90 (Firm 1generated 100 units in the absence of government intervention) or $270,000.Firm 2 has a lower tax burden because it is reducing emissions from 80 units to 50units. Firm 2 pays $3,000 x 50 = $150,000. As the text concludes, the firm thatcuts back poll ution less isn’t really getting away with anything because it has alarger tax liability than if it were to cut back more.c. From an efficiency standpoint, the initial allocation of permits does not matter. Ifthe two firms could not trade permits, then Firm 2 would have to undertake all ofthe emissions reduction. Initially, Firm 1’s MC is zero, while Firm 2’s MC is$4,000, so there is a strong incentive for Firm 2 to purchase permits from Firm 1.Trading should continue until MC1 = MC2, which is the cost-effective solution.This means that the market price for permits will equal $3,000, the same as theemissions fee. At this price, Firm 2 will purchase 10 permits from Firm 2,allowing Firm 2 to reduce emissions by 30 rather than 40 and requiring Firm 1 toreduce emissions by 10. This solution is the same as the solution achieved withthe emissions fee. However, Firm 1 is better off because instead of having to paytaxes, it will receive a payment of $30,000 for its permits. Firm 2 must pay$30,000 for the extra permits, but it also avoids the payment of taxes. Thegovernment lost $420,000 in tax revenue. The firms must still pay the cost ofemissions reduction, plus Firm 2 must pay for the permits purchased from Firm 1.11. If marginal costs turn out to be lower than anticipated, cap-and-trade achieves too littlepollution reduction and an emissions fee achieves too much pollution reduction. With an inelastic marginal social benefit function, cap-and-trade is not too bad from an efficiency standpoint, while an emissions fee causes pollution reduction to be much greater than the efficient level when marginal cost is lower than anticipated. When marginal social benefits are elastic, the opposite is true.。
罗森财政学知识点
以下是一些可能的罗森财政学的知识点:
1. 罗森财政学的概念和基本原理:罗森财政学是由美国经济学家罗森于1956年首次提出的,主要研究政府在经济中的角色
和功能,以及公共财政的理论与实践。
2. 政府支出和税收:罗森财政学强调政府支出和税收的决策应基于经济效益分析,即政府应考虑公共财政项目的社会成本与社会收益。
3. 公共财政项目选择:罗森财政学认为,政府应选择那些能够提供最大社会效益的公共财政项目,而不仅仅是通过政府开支来满足需求。
4. 税收原则:罗森财政学提出了一些税收原则,如效率原则(税制应避免对经济行为造成扭曲)、公平原则(税收应按照个人或企业的能力来分摊)和简单易行原则(税制应简化且易于执行)。
5. 财政分权与分权理论:罗森财政学关注政府间的财政关系和权力分配,认为不同层级的政府应适应各自的财政能力和责任,以实现财政资源的合理配置和公共服务的优化。
6. 市场失灵与政府干预:罗森财政学研究了市场失灵的情况,即市场在提供公共产品和解决外部性等问题上存在局限。
在这些情况下,政府需要进行干预和调整,以修正市场的不完美。
这些只是一些罗森财政学的知识点示例,而实际上,罗森财政学的范围非常广泛,涉及诸多方面的理论和实践问题。
深入学习罗森财政学需要详细了解其相关的理论和研究领域。
CHAPTER 5 - ExternalitiesMultiple-Choice Questions1.Reducing output from the privately optimal level to the socially optimal level willa)cause a loss of consumption to consumers.b)reduce marginal damages.c)reduce the production costs.d)cause all of the above.2.Marginal damages are hard to measure becausea)they can be generated from multiple sources.b)they are hard to graph.c)they happen over time.d)no one cares about them.3.In Figure 5.4, if the marginal damages line did not originate at 0,a)it would mean that marginal damages did not exist.b)there is no way to find MSC.c)MSC would not originate at the same intercept as MPC.d)then all of the above.4.Externalities can be positive becausea)marginal damages do not last over time.b)utility can be impacted positively as well as negatively.c)there is no concept for marginal benefit.d)positive externalities are subsidies.5.Refer to the graphs below. Which graph(s) represent(s) an externality?a)graph Ab)graphs A and Bc)graph Bd)neither graph A nor graph BA B6.Refer to Figure 5.7 in the textbook. What does it mean if all firms have to reduce to a point ?2*)*(X Z a)Firm X will reduce more than optimal.b)Firm Z will reduce less than optimal.c)The new point is between X* and Z*.d)All of the above.7.The Coase theorem has problems becausea)generally, bargaining costs are not zero.b)individuals are not concerned with others.c)markets always exist.d)all of the above.8.Pollution rights may be traded ifa)polluters try to hide pollution.b)administrators are uncertain about Pigouvian taxes.c)there is no market for pollution.d)pollution is harmless.9.Externalities can be produced by ____________, as well as ____________.a)individuals; firmsb)market prices; market incomesc)oceans; streamsd)none of the above10. A Pigouvian tax corrects fora)market congestion.b)market losses.c)inefficient sales.d)low market prices.11.Which of the following is correct?a)SMC = PMC - MDb)MPB = MSB + MEBc)SMC = PMC + MDd)MSC = MPBe)MSB =MSC + MPB12.Marginal benefits are downward sloping whena)there are no total benefits.b)the slope of the marginal benefits curve is negative.c)total benefits are increasing at a decreasing rate.d)marginal costs are upward sloping.13. A Pigouvian subsidya)can not exist with externalities.b)is the same thing as a Pigouvian tax.c)is measured in terms of Pigouvian dollars.d)moves production to the socially optimal level of output.14.As a general rule, zero pollution is not socially desirable becausea)there would be no production.b)the Environmental Protection Agency (EPA) needs to have something to do.c)no pollution would lead to global warming.d)all of the above.15.Externalities require government intervention whena)violence will result between disputing parties.b)there are only a few sellers in the market.c)property rights are not clearly established.d)the government imposes sales taxes.e)all of the above.16.Which method helps in obtaining the socially optimal level of output?a)Pigouvian taxesb)regulationc)property rights and bargainingd)all of the above17.Marginal damagesa)must always be considered in social marginal costs.b)must not be considered in social marginal costs.c)must sometimes be considered in social marginal costs.d)have nothing to do with social marginal costs.Discussion Questions1.Suppose the factory Afro-Puffs Inc. produces wigs. As a by-product of this wigproduction, they also produce dangerous emissions of toxic gases (as a result of the strong glue used to hold the hair in place). The De-Lite car factory, down the road, experiences a negative externality from this production process. Suppose that the supply curve (private marginal costs) for the wig factory is X=(2/5)P- 2, and it faces a market demand of X d=15 - P/2. The marginal damages caused by the production of wigs can be written as X=P – 1/2.a.Find the equilibrium price and quantity in the market for wigs.b.Find the socially optimal level of wigs and the corresponding price.c.How much should the wig factory be taxed per wig?2. A steel factory has the right to discharge waste into a river. The waste reduces thenumber of fish, causing damage for swimmers. Let X denote the quantity of waste dumped. The marginal damage, denoted MD, is given by the equation MD = 2 + 5X.The marginal benefit (MB) of dumping waste is given by the equation MB = 34 – 3X.a.Calculate the efficient quantity of waste.b.What is the efficient fee, in dollars per unit of waste, that would cause the firm todump only an efficient quantity of waste?c.What would be the quantity dumped if the firm did not care about the fishery?3.The private marginal benefit for commodity X is given by 15 – X, where X is the numberof units consumed. The private marginal cost of producing X is constant at 10. In the absence of any government intervention, how much X is produced? What is the gain to society involved in moving from the inefficient to the efficient level of production?4.Consider the case of two farmers, Tony and Hakim, depicted in the figure below. Bothuse DDT (a chemical pesticide) for their crops. The use of DDT causes an externality for swimmers down river from the farms.a.Show the amount of pesticides used if each uses the privately optimal level ofpesticides.b.Show the amount of pesticides used if they are socially concerned.c.Why is a reduction back to X H = H T not socially desired?T H SMC(PMC+MB)PMCMB HMB/MCPesticidesMB T5.Redo discussion question 10, part a, from Chapter 5 in your book. Suppose emissions arelimited to 25 units per year instead of 50. How does your answer change?True/False/Uncertain Questions1.Externalities always work themselves out.2.Negative externalities cause loss of welfare not transmitted by market factors.3.Externalities can be positive, as well as negative.4. A subsidy for pollution not produced can induce producers to pollute at the efficientlevel.5.Pollution rights can be traded and are always efficient.6.Regulation helps to correct for externalities.7.Any commodity market has the potential to have an externality.8.Market-oriented solutions to externalities rarely work.9.For market efficiency, MSC must be equated to MSB.10.College education is an example of a positive externality.Essay Questions1.How do social conventions help in alleviating externalities without governmentintervention?2.How do you feel the U.S. has fared in its attempt to impose market forces to correctexternalities?3.List and discuss three problems that might arise when using the Coase theorem.。
有资产效应,所以国债在经济增长中具有稳定功能。
国债的资产效应和“国债错觉”的概念相联系。
“国债错觉”是指国债持有者在持有国债时认为自己的财富增加了,由此可能增加自己的消费需求,因而国债的积累和增加相联系。
承认国债的资产效应,也就是否定李嘉图的等价原理。
②国债的需求效应:根据凯恩斯主义的观点,国债融资,增加支付支出,并通过支出的乘数效应增加总需求,或通过将储蓄转化为投资,并通过投资的乘数效应,推动经济增长。
国债对总需求的影响有两种不同的情形:一种情形是叠加在原有总需求之上,增加总需求;另一种情形是在原有总需求内部只改变总需求结构,而不增加总需求。
中央银行购买国债相当于过去传统体制下的财政向中央银行透支或借款,也就是现在所谓的债务货币化。
它将导致银行准备金增加从而增加基础货币,对总需求发挥扩张作用,构成通货膨胀因素。
商业银行或居民个人购买国债,一般说只是购买力的转移或替代,不会产生增加货币供给从而扩张总需求的效应。
③国债的供给效应:发行国债主要注重于它的短期需求效应,刺激需求,拉动经济增长。
但实际上国债不仅具有需求效应而且同时具有供给效应,即增加供给总量和改善供给结构。
各国实施财政政策的实践证明,国债是具有经济效应的,而其在财政政策实施中具有重要的功能。
国债的政策功能主要有三点:①弥补财政赤字,这是国债产生主要原因,也是当今各国家的普遍做法。
②筹集建设资金。
③调节经济,国债是对GDP的再分配,反映了社会资源的重新配置,是财政调节的一种重要手段。
5)国债市场:国债是一种财政收入,国债券是一种有价证券。
证券市场是有价证券交易的场所,政府通过证券市场发行和偿还国债,意味着国债进入了交易过程,而在证券市场中进行的国债交易即为国债市场。
国债市场按照国债交易过程可分为发行市场和流通市场。
国债发行市场指国债发行场所,又称国债一级市场。
一般是政府与证券承销机构如银行、金融机构之间的交易,通常由证券承销机构一次全部买下发行的国债。
Chapter One IntroductionThis book is about the taxing and spending activities of government, a subject usually called public finance.This term is something of a misnomer, because the fundamental issues are not financial (that is, relating to money). Rather, the key problems relate to the use of real resources. For this reason, some authors prefer the label public sector economics or simply public economics.We focus on the microeconomic function of government- the way government affects the allocation of resources and the distribution of income.This book follows tradition by focusing on governmental spending and revenue-raising activities.Public Finance and IdeologyOpinions on how government should function in the economic sphere are influenced by ideological views concerning the relationship between the individual and the state. Political philosophers have distinguished two major approaches.1. Organic View of GovernmentSociety is conceived of as a natural organism. Each individual is a part of this organism, and the government can be thought of as its heart. The individual has significance only as part of the community, and the good of the individual is defined with respect to the good of the whole. Thus, the community is stressed above the individual.The goals of the society are set by the state, which attempts to lead society toward their realization. The choice of goals differs considerably.Because societal goals can differ, a crucial question is how they are to be selected. Proponents of the organic view usually argue that certain goals are natural for the societal organism.2. Mechanistic View of GovernmentGovernment is not an organic part of society. Rather, it is a contrivance created by individuals to better achieve their individual goals.Virtually everyone agrees that it is good for individuals when government protects them from violence. To do so government must have a monopoly on coercive power.Opinions within the mechanistic tradition diverge. Libertarians, who believe in a very limited government, argue against any further economic role for the government. Libertarians are extremely skeptical about the ability of governments to improve social welfare.Social democrats believe that substantial government intervention is required for the good of individuals.3. Viewpoint of This BookThe mechanistic view of government has come to dominate Anglo-American political thought. Not surprisingly, Anglo-American economic thought has alsodeveloped along individual lines. Within the individualistic tradition there is much controversy with respect to how active government should be.Economic policy is not based on economic analysis alone. The desirability of a given course of government action inevitably depends in part on ethical and political judgments.Government at a Glance1. The Legal Framework2. The Size of GovernmentA more sensible (and common) approach is to measure the size of government by the volume of its annual expenditures, of which there are basically three types:(1) Purchase of goods and services.(2) Transfers of income to people, businesses, or other governments.(3) Interest payments.The federal government itemizes its expenditures in a document referred to a as the unified budget. However, some government activities have substantial effects on resource allocation even though they involve minimal explicit outlays. For example, issuing regulations per se is not very expensive, but compliance with the rules can be very costly. Some have suggested that the costs imposed on the economy by government regulations be published in an annual regulatory budget. Unfortunately, computing such costs is exceedingly difficult so it is unlikely there will ever be an official regulatory budget.The figure is a misleading indicator of the growth of government for several reasons:(1) Because of inflation, the dollars decreased in value over time.(2) The population has also grown over time. An increasing population by itself creates demands for a larger public sector.(3) It is sometimes useful to examine government expenditure compared to the size of the economy. If government doubles in size but at the same time the economy triples, then government has relatively shrunk.Government expenditures have increased in both nominal and real absolute terms, in per capita terms, and as a percentage of GDP.3. ExpendituresNational defense and Social Security are the largest spending items in the federal budget.Much of the government budget consists of so-called entitlement programs-programs determined by the number of people who qualify which are out of hands of the current government. The fast-growing areas such as Social Security and interest payments are relatively fixed in the sense that they are determined by the previous decisions.The share of national defense spending in federal expenditure has fallen over time, while Social Security, public welfare, and payments on outstanding debt have increased in importance. The combination of entitlement programs and interestof the payments reduces yearly control over the level of expenditures. About 34federal budget is relatively uncontrollable.It is useful to break down total expenditures by level of government. State and local governments are clearly important players.4. RevenuesAt the federal level, personal income taxation is currently the single most important source of revenue, accounting for about 45% of the tax collections. Socialof federal revenue collections, which are payroll tax Insurance accounting for 13collections used to finance Social Security and Medicare. The federal corporate income tax decreases. In the state and local sector, the property tax decreases and individual income taxes increase.Changes in the Real Value of Debt When the government is a debtor and prices increase, changes in the real value of the debt may be an important source of revenue.。