图像拼接根据harris检测matlab代码
- 格式:doc
- 大小:24.51 KB
- 文档页数:14
基于Harris角点特征提取的MATLAB全景拼接程序马飞龙计算机系媒体所2014210854[摘要] 基于Harris角点特征提取的MATLAB图像拼接程序,根据Harris角点法,提取2张图像的特征点,然后匹配2图像特征点,找到正确位移量,进行图像拼接。
[关键词] Harris角点,图像拼接一、Harris角点1、不同类型的角点在现实世界中,角点对应于物体的拐角,道路的十字路口、丁字路口等。
从图像分析的角度来定义角点可以有以下两种定义:i) 角点可以是两个边缘的角点;ii)角点是邻域内具有两个主方向的特征点;前者往往需要对图像边缘进行编码,这在很大程度上依赖于图像的分割与边缘提取,具有相当大的难度和计算量,且一旦待检测目标局部发生变化,很可能导致操作的失败。
早期主要有Rosenfeld和Freeman等人的方法,后期有CSS等方法。
基于图像灰度的方法通过计算点的曲率及梯度来检测角点,避免了第一类方法存在的缺陷,此类方法主要有Moravec算子、Forstner算子、Harris算子、SUSAN 算子等。
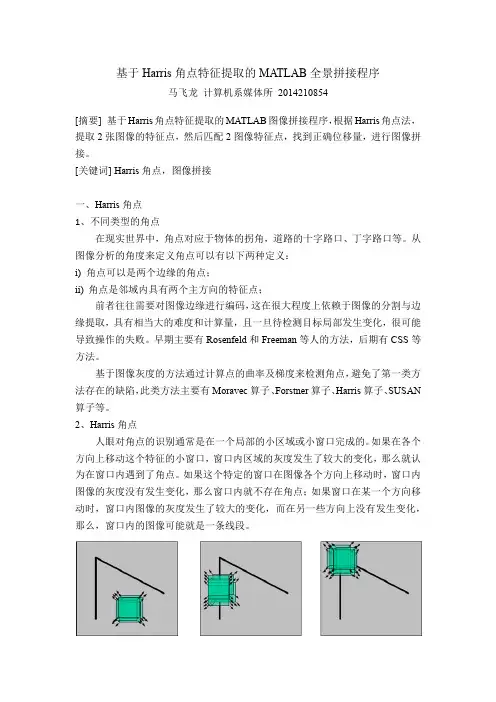
2、Harris角点人眼对角点的识别通常是在一个局部的小区域或小窗口完成的。
如果在各个方向上移动这个特征的小窗口,窗口内区域的灰度发生了较大的变化,那么就认为在窗口内遇到了角点。
如果这个特定的窗口在图像各个方向上移动时,窗口内图像的灰度没有发生变化,那么窗口内就不存在角点;如果窗口在某一个方向移动时,窗口内图像的灰度发生了较大的变化,而在另一些方向上没有发生变化,那么,窗口内的图像可能就是一条线段。
3、算法的实现:将Harris 图像角点检测算法归纳如下,共分以下五步:(1)计算图像I(x,y)在X 和Y 两个方向的梯度I x 和I y ;(2)计算图像两个方向梯度的乘积;(3)使用高斯函数对I x 2、I y 2和I xy 进行高斯加权(取σ=1),生成矩阵M 的元素A 、B 和C ;(4)计算每个像素的Harris 响应值R ,并对小于某一阈值t 的R 置为零;(5)在3×3或5×5的邻域内进行非最大值抑制,局部最大值点即为图像中的角点。

Matlab中的图像拼接方法与示例分析图像拼接是数字图像处理领域中的重要任务,它能够将多张局部图像合并为一张完整的图像。
Matlab作为一种强大的工具,提供了多种图像拼接方法,本文将介绍其中常用的方法,并通过具体的示例分析其优劣和适用场景。
一、基于特征点匹配的图像拼接方法特征点匹配是一种常用且有效的图像拼接方法,它通过在图像中提取出稳定且唯一的特征点,然后根据这些特征点之间的相对位置关系进行图像的拼接。
在Matlab中,可以使用SIFT(尺度不变特征变换)算法来提取图像的特征点,然后使用RANSAC(随机一致性采样)算法对特征点进行匹配,并通过Harris角点检测算法来筛选出最佳的匹配点。
示例:将两张风景照片拼接成一张全景照片。
首先,使用SIFT算法提取两张照片的特征点,然后使用RANSAC算法对特征点进行匹配。
接着,通过Harris角点检测算法筛选出最佳的匹配点,并根据匹配点计算出图像间的转换矩阵。
最后,使用Matlab中的imwarp函数对图像进行变换,并使用imfuse函数将两张图像拼接在一起,得到最终的全景照片。
二、基于图像重叠区域的无缝拼接方法无缝拼接是指在图像拼接过程中,将多张图像合成为一张时,保持图像之间的连续性和平滑性,使得拼接后的图像看起来像是一张完整的图像。
在Matlab中,可以使用图像重叠区域的像素平均值或像素加权平均值来实现无缝拼接。
这种方法能够减少拼接过程中产生的明显拼接痕迹,使得拼接后的图像具有更好的视觉效果。
示例:将多张卫星图像拼接成一张地图。
首先,读入多张卫星图像,并确定它们之间的重叠区域。
然后,通过像素平均值或像素加权平均值来实现无缝拼接。
最后,使用Matlab中的imshow函数显示拼接后的地图图像。
三、基于图像内容的自动拼接方法自动拼接方法是指针对无法通过特征点匹配或像素平均值等方式进行拼接的图像,通过分析图像内容来实现图像的自动拼接。
在Matlab中,可以使用深度学习模型(如卷积神经网络)来对图像进行内容分析和特征提取,并根据提取的特征对图像进行拼接。
基于Harris原理的亚像素角点坐标检测Matlab程序★注意:直接运行click_calib .m文件即可获得亚像素级角点坐标,附录Ⅱ中的其它函数文件均会被click_calib .m文件调用。
click_calib .m %%%%%%%%%%%%%%%%%%%%%%%%%%%%%%%%%%%%%%%%% % 测量亚像素角点坐标的主函数var2fix = 'dX_default';fixvariable; % 调用fixvariable.m文件,修正变量var2fix = 'dY_default';fixvariable;var2fix = 'map';fixvariable;if ~exist('n_ima'),data_calib; % 调用data_calib.m文件,输入图像名和格式,%检查文件中的图像并读取标定图像信息end;check_active_images; % 调用check_active_images.m文件,检查是%否已读取到标定图像if ~exist(['I_' num2str(ind_active(1))]),ima_read_calib;if isempty(ind_read),disp('Cannot extract corners without images');return;end;end;fprintf(1,'\nExtraction of the grid corners on the images\n');if (exist('map')~=1), map = gray(256);end;if exist('dX'),dX_default = dX;end;if exist('dY'),dY_default = dY;end;if exist('n_sq_x'),n_sq_x_default = n_sq_x;end;if exist('n_sq_y'),n_sq_y_default = n_sq_y;end;if ~exist('dX_default')|~exist('dY_default');dX_default = 30;dY_default = 30; % 设靶标平面X和Y方向上方格的默认距离%为30mmend;if ~exist('n_sq_x_default')|~exist('n_sq_y_default'),n_sq_x_default = 10;n_sq_y_default = 10; % 设在靶标平面的x和y方向上提取的角点%数的默认值均为10end;if ~exist('wintx_default')|~exist('winty_default'),wintx_default = max(round(nx/128),round(ny/96));winty_default = wintx_default;clear wintx wintyend;if ~exist('wintx') | ~exist('winty'),clear_windows; % 调用clear_windows.m文件,清除窗口end;if ~exist('dont_ask'),dont_ask = 0;end;if ~dont_ask,ima_numbers = input('Number(s) of image(s) to process ([] = all images) = '); elseima_numbers = [];end;if isempty(ima_numbers),ima_proc = 1:n_ima;elseima_proc = ima_numbers;end;kk_first = ima_proc(1); % 输入('Start image number ([]=1=first): '); if exist(['wintx_' num2str(kk_first)]),eval(['wintxkk = wintx_' num2str(kk_first) ';']);if isempty(wintxkk) | isnan(wintxkk),disp('Window size for corner finder (wintx and winty):');wintx = input(['wintx ([] = ' num2str(wintx_default) ') = ']);if isempty(wintx), wintx = wintx_default; end;wintx = round(wintx);winty = input(['winty ([] = ' num2str(winty_default) ') = ']);if isempty(winty), winty = winty_default; end;winty = round(winty);fprintf(1,'Window size = %dx%d\n',2*wintx+1,2*winty+1);end;elsedisp('Window size for corner finder (wintx and winty):');wintx = input(['wintx ([] = ' num2str(wintx_default) ') = ']);if isempty(wintx), wintx = wintx_default; end;wintx = round(wintx);winty = input(['winty ([] = ' num2str(winty_default) ') = ']);if isempty(winty), winty = winty_default; end;winty = round(winty);fprintf(1,'Window size = %dx%d\n',2*wintx+1,2*winty+1);end;if ~dont_ask,fprintf(1,'Do you want to use the automatic square counting mechanism(0=[]=default)\n');manual_squares = input(' or do you always want to enter the number of squares manually (1,other)? ');if isempty(manual_squares),manual_squares = 0;elsemanual_squares = ~~manual_squares;end;elsemanual_squares = 0;end;for kk = ima_proc,if exist(['I_' num2str(kk)]),click_ima_calib; % 调用click_ima_calib.m文件,点击图像边%界的4个顶点,从而划出边线active_images(kk) = 1;elseeval(['dX_' num2str(kk) ' = NaN;']);eval(['dY_' num2str(kk) ' = NaN;']);eval(['wintx_' num2str(kk) ' = NaN;']);eval(['winty_' num2str(kk) ' = NaN;']);eval(['x_' num2str(kk) ' = NaN*ones(2,1);']);eval(['X_' num2str(kk) ' = NaN*ones(3,1);']);eval(['n_sq_x_' num2str(kk) ' = NaN;']);eval(['n_sq_y_' num2str(kk) ' = NaN;']);end;end;check_active_images;for kk = 1:n_ima,if ~exist(['x_' num2str(kk)]),eval(['dX_' num2str(kk) ' = NaN;']);eval(['dY_' num2str(kk) ' = NaN;']);eval(['x_' num2str(kk) ' = NaN*ones(2,1);']);eval(['X_' num2str(kk) ' = NaN*ones(3,1);']);eval(['n_sq_x_' num2str(kk) ' = NaN;']);eval(['n_sq_y_' num2str(kk) ' = NaN;']);end;if ~exist(['wintx_' num2str(kk)]) | ~exist(['winty_' num2str(kk)]),eval(['wintx_' num2str(kk) ' = NaN;']);eval(['winty_' num2str(kk) ' = NaN;']);end;end;string_save = 'save calib_data active_images ind_active wintx winty n_imatype_numbering N_slots first_num image_numbers format_image calib_name Hcal Wcal nx ny map dX_default dY_default dX dY wintx_default winty_default';for kk = 1:n_ima,string_save = [string_save ' X_' num2str(kk) ' x_' num2str(kk) ' n_sq_x_'num2str(kk) ' n_sq_y_' num2str(kk) ' wintx_' num2str(kk) ' winty_' num2str(kk) ' dX_' num2str(kk) ' dY_' num2str(kk)];end;eval(string_save);disp('done');for lamp = 1:Nima_validdog1=['x_' num2str(lamp)];name1=['x' num2str(lamp) '.txt'];save( name1,dog1,'-ascii');dog2=['X_' num2str(lamp)];name2=['M' num2str(lamp) '.txt'];save( name2,dog2,'-ascii');endreturn; %%%%%%%%%%%%%%%%%%%%%%%%%%%%%%%%%%%%%%%%%fixvariable .m %%%%%%%%%%%%%%%%%%%%%%%%%%%%%%%%%%%%%%%%% % 修正变量if exist('var2fix')==1,if eval(['exist(''' var2fix ''') == 1']),if eval(['isempty(' var2fix ')']),eval(['clear ' var2fix ]);elseif eval(['~isstruct(' var2fix ')']),if eval(['~iscell(' var2fix ')']),if eval(['isnan(' var2fix '(1))']),eval(['clear ' var2fix ]);end;end;end;end;end;end; %%%%%%%%%%%%%%%%%%%%%%%%%%%%%%%%%%%%%%% %%data_calib .m %%%%%%%%%%%%%%%%%%%%%%%%%%%%%%%%%%%%%%%%% % 人工输入图像基名和格式,寻找、读取并显示出所有标定图像l_ras = dir('*ras');s_ras = size(l_ras,1);l_bmp = dir('*bmp');s_bmp = size(l_bmp,1);l_tif = dir('*tif');s_tif = size(l_tif,1);l_pgm = dir('*pgm');s_pgm = size(l_pgm,1);l_ppm = dir('*ppm');s_ppm = size(l_ppm,1);l_jpg = dir('*jpg');s_jpg = size(l_jpg,1);s_tot = s_ras + s_bmp + s_tif + s_pgm + s_jpg + s_ppm;if s_tot < 1,fprintf(1,'No image in this directory in either ras, bmp, tif, pgm, ppm or jpg format. Change directory and try again.\n');break;end;dir;Nima_valid = 0;while (Nima_valid==0),fprintf(1,'\n');calib_name = input('Basename camera calibration images (without number nor suffix): ','s'); % 输入图像基名format_image = '0';while format_image == '0',format_image = input('Image format: ([]=''r''=''ras'', ''b''=''bmp'', ''t''=''tif'',''p''=''pgm'', ''j''=''jpg'', ''m''=''ppm'') ','s'); % 输入图像格式if isempty(format_image),format_image = 'ras';end;if lower(format_image(1)) == 'm',format_image = 'ppm';elseif lower(format_image(1)) == 'b',format_image = 'bmp';elseif lower(format_image(1)) == 't',format_image = 'tif';elseif lower(format_image(1)) == 'p',format_image = 'pgm';elseif lower(format_image(1)) == 'j',format_image = 'jpg';elseif lower(format_image(1)) == 'r',format_image = 'ras';elsedisp('Invalid image format');format_image = '0'; % Ask for format once againend;end;end;end;end;end;end;check_directory; % 调用check_directory .m文件,按图像基名%和格式检查文件中的图像end;if (Nima_valid~=0),ima_read_calib; % 调用ima_read_calib .m文件,读取图像if ~isempty(ind_read),mosaic; % 调用mosaic .m文件,显示所有的标定图像end;end; %%%%%%%%%%%%%%%%%%%%%%%%%%%%%%%%%%%%%%%%%check_directory .m %%%%%%%%%%%%%%%%%%%%%%%%%%%%%%%%%%%%%%%%% % 检查文件中是否存在标定图像l = dir([calib_name '*']);% 返回含calib_name的所有文件信息的一个结构数组n*1 Nl = size(l,1); % Nl为图像的幅数Nima_valid = 0;ind_valid = [];loc_extension = [];length_name = size(calib_name,2); % calib_name的长度if Nl > 0,for pp = 1:Nl,filenamepp = l(pp).name; %第pp幅图像的名字if isempty(calib_name),iii = 1;elseiii = findstr(filenamepp,calib_name);end;loc_ext = findstr(filenamepp,format_image);string_num = filenamepp(length_name+1:loc_ext - 2);if isempty(str2num(string_num)),iii = [];end;if ~isempty(iii), %如果iii非空if (iii(1) ~= 1), %又如果iii(1) != 1,则将iii置空iii = [];end;end;if ~isempty(iii) & ~isempty(loc_ext),Nima_valid = Nima_valid + 1;ind_valid = [ind_valid pp]; %第几个文件的下标是正确的loc_extension = [loc_extension loc_ext(1)];end;end;if (Nima_valid==0),format_image = upper(format_image);for pp = 1:Nl,filenamepp = l(pp).name;if isempty(calib_name),iii = 1;elseiii = findstr(filenamepp,calib_name);end;loc_ext = findstr(filenamepp,format_image);string_num = filenamepp(length_name+1:loc_ext - 2);if isempty(str2num(string_num)),iii = [];end;if ~isempty(iii),if (iii(1) ~= 1),iii = [];end;end;if ~isempty(iii) & ~isempty(loc_ext),Nima_valid = Nima_valid + 1;ind_valid = [ind_valid pp];loc_extension = [loc_extension loc_ext(1)];end;end;if (Nima_valid==0),fprintf(1,'No image found. File format may be wrong.\n');elsestring_length = zeros(1,Nima_valid);indices = zeros(1,Nima_valid);for ppp = 1:Nima_valid,name = l(ind_valid(ppp)).name;string_num = name(length_name+1:loc_extension(ppp) - 2);string_length(ppp) = size(string_num,2);%数字的长度indices(ppp) = str2num(string_num);%数字的大小--下标的顺序end;first_num = min(indices);n_ima = max(indices) - first_num + 1;if min(string_length) == max(string_length),N_slots = min(string_length);type_numbering = 1;elseN_slots = 1;type_numbering = 0;end;image_numbers = first_num:n_ima-1+first_num;active_images = ones(1,n_ima);end;elsestring_length = zeros(1,Nima_valid);indices = zeros(1,Nima_valid);for ppp = 1:Nima_valid,name = l(ind_valid(ppp)).name;string_num = name(length_name+1:loc_extension(ppp) - 2);string_length(ppp) = size(string_num,2);indices(ppp) = str2num(string_num);end;first_num = min(indices);n_ima = max(indices) - first_num + 1;if min(string_length) == max(string_length),N_slots = min(string_length);type_numbering = 1;N_slots = 1;type_numbering = 0;end;image_numbers = first_num:n_ima-1+first_num;active_images = ones(1,n_ima);end;elsefprintf(1,'No image found. Basename may be wrong.\n');end; %%%%%%%%%%%%%%%%%%%%%%%%%%%%%%%%%%%%%%%%%ima_read_calib .m %%%%%%%%%%%%%%%%%%%%%%%%%%%%%%%%%%%%%%%%% % 读取标定图像if ~exist('calib_name')|~exist('format_image'),data_calib;return;end;check_directory;if ~exist('n_ima'),data_calib;return;end;check_active_images; % 调用check_active_images .m文件,检查有效的标定图像images_read = active_images;if exist('image_numbers'),first_num = image_numbers(1);end;if ~exist('first_num'),first_num = image_numbers(1); %第一副图像的数字end;image_numbers = first_num:n_ima-1+first_num;no_image_file = 0;i = 1;while (i <= n_ima), % & (~no_image_file),if active_images(i),if ~type_numbering,number_ext = num2str(image_numbers(i));elsenumber_ext = sprintf(['%.' num2str(N_slots) 'd'],image_numbers(i));end;ima_name = [calib_name number_ext '.' format_image];if i == ind_active(1),fprintf(1,'Loading image ');if exist(ima_name),fprintf(1,'%d...',i);if format_image(1) == 'p',if format_image(2) == 'p',Ii = double(loadppm(ima_name));elseIi = double(loadpgm(ima_name));end;elseif format_image(1) == 'r',Ii = readras(ima_name);elseIi = double(imread(ima_name));end;end;if size(Ii,3)>1,Ii = 0.299 * Ii(:,:,1) + 0.5870 * Ii(:,:,2) + 0.114 * Ii(:,:,3);end;eval(['I_' num2str(i) ' = Ii;']);elseimages_read(i) = 0; %如果ima_name不存在,则设images_read(i)=0;end;end;i = i+1;end;ind_read = find(images_read);if isempty(ind_read),fprintf(1,'\nWARNING! No image were read\n');no_image_file = 1;elseif no_image_file,end;fprintf(1,'\n');if size(I_1,1)~=480,small_calib_image = 1;elsesmall_calib_image = 0;end;[Hcal,Wcal] = size(I_1); % size of the calibration image[ny,nx] = size(I_1); %ny为行数,nx为列数clickname = [];map = gray(256);disp('done');end;if ~(exist('map')==1), map = gray(256); end;active_images = images_read; %%%%%%%%%%%%%%%%%%%%%%%%%%%%%%%%%%%%%%%%%Mosaic .m %%%%%%%%%%%%%%%%%%%%%%%%%%%%%%%%%%%%%%%%% % 显示所有查找到的标定图像if ~exist('I_1'),active_images_save = active_images;ima_read_calib;active_images = active_images_save;check_active_images;end;check_active_images;if isempty(ind_read),return;end;n_col = floor(sqrt(n_ima*nx/ny));n_row = ceil(n_ima / n_col);ker2 = 1;for ii = 1:n_col,ker2 = conv(ker2,[1/4 1/2 1/4]);%与[1/4,1/2,1/4]卷积n_col次end;II = I_1(1:n_col:end,1:n_col:end);[ny2,nx2] = size(II);kk_c = 1;II_mosaic = [];for jj = 1:n_row,II_row = [];for ii = 1:n_col,if (exist(['I_' num2str(kk_c)])) & (kk_c <= n_ima),if active_images(kk_c),eval(['I = I_' num2str(kk_c) ';']);I = I(1:n_col:end,1:n_col:end);elseI = zeros(ny2,nx2);end;elseI = zeros(ny2,nx2);end;II_row = [II_row I];if ii ~= n_col,II_row = [II_row zeros(ny2,3)];end;kk_c = kk_c + 1;end;nn2 = size(II_row,2);if jj ~= n_row,II_row = [II_row; zeros(3,nn2)];end;II_mosaic = [II_mosaic ; II_row];end;figure(2);image(II_mosaic);colormap(gray(256));title('Calibration images');set(gca,'Xtick',[])set(gca,'Ytick',[])axis('image'); %%%%%%%%%%%%%%%%%%%%%%%%%%%%%%%%%%%%%%%%%check_active_image .m %%%%%%%%%%%%%%%%%%%%%%%%%%%%%%%%%%%%%%%%% % 检查是否存在有效的标定图像if n_ima ~= 0,if ~exist('active_images'),active_images = ones(1,n_ima);end;n_act = length(active_images);if n_act < n_ima,active_images = [active_images ones(1,n_ima-n_act)];elseif n_act > n_ima,active_images = active_images(1:n_ima);end;end;ind_active = find(active_images);if prod(double(active_images == 0)),disp('Error: There is no active image. Run Add/Suppress images to add images');breakend;if exist('center_optim'),center_optim = double(center_optim);end;if exist('est_alpha'),est_alpha = double(est_alpha);end;if exist('est_dist'),est_dist = double(est_dist);end;if exist('est_fc'),est_fc = double(est_fc);end;if exist('est_aspect_ratio'),est_aspect_ratio = double(est_aspect_ratio);end;end; %%%%%%%%%%%%%%%%%%%%%%%%%%%%%%%%%%%%%%%%%clear_windows .m %%%%%%%%%%%%%%%%%%%%%%%%%%%%%%%%%%%%%%%%% % 清除窗口for kk = 1:n_ima,eval(['clear wintx_' num2str(kk)]);eval(['clear winty_' num2str(kk)]);end; %%%%%%%%%%%%%%%%%%%%%%%%%%%%%%%%%%%%%%%%%click_ima_calib .m %%%%%%%%%%%%%%%%%%%%%%%%%%%%%%%%%%%%%%%%% % 用鼠标点击图像的4个边界点进而划出图像的边界线,检测角点的位置、调用ginput3函数求解像素级角点坐标并使其作为初始值再调用cornerfinder函数求解亚像素角点坐标fprintf(1,'\nProcessing image %d...\n',kk);eval(['I = I_' num2str(kk) ';']);if exist(['wintx_' num2str(kk)]),eval(['wintxkk = wintx_' num2str(kk) ';']);if ~isempty(wintxkk) & ~isnan(wintxkk),eval(['wintx = wintx_' num2str(kk) ';']);eval(['winty = winty_' num2str(kk) ';']);end;end;fprintf(1,'Using (wintx,winty)=(%d,%d) - Window size = %dx%d (Note: To reset the window size, run script clearwin)\n',wintx,winty,2*wintx+1,2*winty+1); figure(2);image(I);colormap(map);set(2,'color',[1 1 1]);title(['Click on the four extreme corners of the rectangular pattern (first corner = origin)... Image ' num2str(kk)]);disp('Click on the four extreme corners of the rectangular complete pattern (the firstclicked corner is the origin)...');x= [];y = [];figure(2); hold on;for count = 1:4,[xi,yi] = ginput3(1);[xxi] = cornerfinder([xi;yi],I,winty,wintx);xi = xxi(1);yi = xxi(2);figure(2);plot(xi,yi,'+','color',[ 1.000 0.314 0.510 ],'linewidth',2);plot(xi + [wintx+.5 -(wintx+.5) -(wintx+.5) wintx+.5 wintx+.5],yi + [winty+.5 winty+.5 -(winty+.5) -(winty+.5) winty+.5],'-','color',[ 1.000 0.3140.510 ],'linewidth',2);x = [x;xi];y = [y;yi];plot(x,y,'-','color',[ 1.000 0.314 0.510 ],'linewidth',2);drawnow;end;plot([x;x(1)],[y;y(1)],'-','color',[ 1.000 0.314 0.510 ],'linewidth',2);drawnow;hold off;[Xc,good,bad,type] = cornerfinder([x';y'],I,winty,wintx); % the four cornersx = Xc(1,:)';y = Xc(2,:)';x_mean = mean(x);y_mean = mean(y);x_v = x - x_mean;y_v = y - y_mean;theta = atan2(-y_v,x_v);[junk,ind] = sort(theta);[junk,ind] = sort(mod(theta-theta(1),2*pi));ind = ind([4 3 2 1]); %-> New: the Z axis is pointing uppwardx = x(ind);y = y(ind);x1= x(1); x2 = x(2); x3 = x(3); x4 = x(4);y1= y(1); y2 = y(2); y3 = y(3); y4 = y(4);p_center = cross(cross([x1;y1;1],[x3;y3;1]),cross([x2;y2;1],[x4;y4;1]));x5 = p_center(1)/p_center(3);y5 = p_center(2)/p_center(3);x6 = (x3 + x4)/2;y6 = (y3 + y4)/2;x7 = (x1 + x4)/2;y7 = (y1 + y4)/2;vX = [x6-x5;y6-y5];vX = vX / norm(vX);vY = [x7-x5;y7-y5];vY = vY / norm(vY);vO = [x4 - x5; y4 - y5];vO = vO / norm(vO);delta = 30;figure(2);image(I);colormap(map);hold on;plot([x;x(1)],[y;y(1)],'g-');plot(x,y,'og');hx=text(x6 + delta * vX(1) ,y6 + delta*vX(2),'X');set(hx,'color','g','Fontsize',14);hy=text(x7 + delta*vY(1), y7 + delta*vY(2),'Y');set(hy,'color','g','Fontsize',14);hO=text(x4 + delta * vO(1) ,y4 + delta*vO(2),'O','color','g','Fontsize',14);hold off;if manual_squares,n_sq_x = input(['Number of squares along the X direction ([]='num2str(n_sq_x_default) ') = ']);if isempty(n_sq_x), n_sq_x = n_sq_x_default; end;n_sq_y = input(['Number of squares along the Y direction ([]='num2str(n_sq_y_default) ') = ']);if isempty(n_sq_y), n_sq_y = n_sq_y_default; end;elsen_sq_x1 = count_squares(I,x1,y1,x2,y2,wintx);n_sq_x2 = count_squares(I,x3,y3,x4,y4,wintx);n_sq_y1 = count_squares(I,x2,y2,x3,y3,wintx);n_sq_y2 = count_squares(I,x4,y4,x1,y1,wintx);if (n_sq_x1~=n_sq_x2)|(n_sq_y1~=n_sq_y2),disp('Could not count the number of squares in the grid. Enter manually.');n_sq_x = input(['Number of squares along the X direction ([]='num2str(n_sq_x_default) ') = ']);if isempty(n_sq_x), n_sq_x = n_sq_x_default; end;n_sq_y = input(['Number of squares along the Y direction ([]='num2str(n_sq_y_default) ') = ']); %6if isempty(n_sq_y), n_sq_y = n_sq_y_default; end;elsen_sq_x = n_sq_x1;n_sq_y = n_sq_y1;end;end;n_sq_x_default = n_sq_x;n_sq_y_default = n_sq_y;if (exist('dX')~=1)|(exist('dY')~=1),dX = input(['Size dX of each square along the X direction ([]='num2str(dX_default) 'mm) = ']);dY = input(['Size dY of each square along the Y direction ([]='num2str(dY_default) 'mm) = ']);if isempty(dX), dX = dX_default; else dX_default = dX; end;if isempty(dY), dY = dY_default; else dY_default = dY; end;elsefprintf(1,['Size of each square along the X direction: dX=' num2str(dX) 'mm\n']);fprintf(1,['Size of each square along the Y direction: dY=' num2str(dY) 'mm (Note: To reset the size of the squares, clear the variables dX and dY)\n']);end;a00 = [x(1);y(1);1];a10 = [x(2);y(2);1];a11 = [x(3);y(3);1];a01 = [x(4);y(4);1];[Homo,Hnorm,inv_Hnorm] = compute_homography([a00 a10 a11 a01],[0 1 1 0;0 0 1 1;1 1 1 1]);x_l = ((0:n_sq_x)'*ones(1,n_sq_y+1))/n_sq_x;y_l = (ones(n_sq_x+1,1)*(0:n_sq_y))/n_sq_y;pts = [x_l(:) y_l(:) ones((n_sq_x+1)*(n_sq_y+1),1)]';XX = Homo*pts;XX = XX(1:2,:) ./ (ones(2,1)*XX(3,:));W = n_sq_x*dX;L = n_sq_y*dY;figure(2);hold on;plot(XX(1,:),XX(2,:),'r+');title('The red crosses should be close to the image corners');hold off;disp('If the guessed grid corners (red crosses on the image) are not close to the actual corners,');disp('it is necessary to enter an initial guess for the radial distortion factor kc (useful for subpixel detection)');quest_distort = input('Need of an initial guess for distortion? ([]=no, other=yes) '); quest_distort = ~isempty(quest_distort);if quest_distort,c_g = [size(I,2);size(I,1)]/2 + .5;f_g = Distor2Calib(0,[[x(1) x(2) x(4) x(3)] - c_g(1);[y(1) y(2) y(4) y(3)] -c_g(2)],1,1,4,W,L,[-W/2 W/2 W/2 -W/2;L/2 L/2 -L/2 -L/2; 0 0 0 0],100,1,1);f_g = mean(f_g);script_fit_distortion;end;Np = (n_sq_x+1)*(n_sq_y+1);disp('Corner extraction...');grid_pts = cornerfinder(XX,I,winty,wintx);grid_pts = grid_pts - 1; % subtract 1 to bring the origin to (0,0) instead of (1,1) in matlab (not necessary in C)ind_corners = [1 n_sq_x+1 (n_sq_x+1)*n_sq_y+1 (n_sq_x+1)*(n_sq_y+1)]; % index of the 4 cornersind_orig = (n_sq_x+1)*n_sq_y + 1;xorig = grid_pts(1,ind_orig);yorig = grid_pts(2,ind_orig);dxpos = mean([grid_pts(:,ind_orig) grid_pts(:,ind_orig+1)]');dypos = mean([grid_pts(:,ind_orig) grid_pts(:,ind_orig-n_sq_x-1)]');x_box_kk =[grid_pts(1,:)-(wintx+.5);grid_pts(1,:)+(wintx+.5);grid_pts(1,:)+(wintx+.5);grid_pts(1 ,:)-(wintx+.5);grid_pts(1,:)-(wintx+.5)];y_box_kk =[grid_pts(2,:)-(winty+.5);grid_pts(2,:)-(winty+.5);grid_pts(2,:)+(winty+.5);grid_pts(2, :)+(winty+.5);grid_pts(2,:)-(winty+.5)];figure(3);image(I); colormap(map); hold on;plot(grid_pts(1,:)+1,grid_pts(2,:)+1,'r+');plot(x_box_kk+1,y_box_kk+1,'-b');plot(grid_pts(1,ind_corners)+1,grid_pts(2,ind_corners)+1,'mo');plot(xorig+1,yorig+1,'*m');h = text(xorig+delta*vO(1),yorig+delta*vO(2),'O');set(h,'Color','m','FontSize',14);h2 = text(dxpos(1)+delta*vX(1),dxpos(2)+delta*vX(2),'dX');set(h2,'Color','g','FontSize',14);h3 = text(dypos(1)+delta*vY(1),dypos(2)+delta*vY(2),'dY');set(h3,'Color','g','FontSize',14);xlabel('Xc (in camera frame)');ylabel('Yc (in camera frame)');title('Extracted corners');zoom on;drawnow;hold off;Xi = reshape(([0:n_sq_x]*dX)'*ones(1,n_sq_y+1),Np,1)';Yi = reshape(ones(n_sq_x+1,1)*[n_sq_y:-1:0]*dY,Np,1)';Zi = zeros(1,Np);Xgrid = [Xi;Yi;Zi];x = grid_pts;X = Xgrid;eval(['dX_' num2str(kk) ' = dX;']);eval(['dY_' num2str(kk) ' = dY;']);eval(['wintx_' num2str(kk) ' = wintx;']);eval(['winty_' num2str(kk) ' = winty;']);eval(['x_' num2str(kk) ' = x;']);eval(['X_' num2str(kk) ' = X;']);eval(['n_sq_x_' num2str(kk) ' = n_sq_x;']);eval(['n_sq_y_' num2str(kk) ' = n_sq_y;']); %%%%%%%%%%%%%%%%%%%%%%%%%%%%%%%%%%%%%%%%%ginput3 .m %%%%%%%%%%%%%%%%%%%%%%%%%%%%%%%%%%%%%%%%% %ginput3函数实现了计算划出图像的边界线,同时计算出像素级角点坐标function [out1,out2,out3] = ginput2(arg1)P = NaN*ones(16,16);P(1:15,1:15) = 2*ones(15,15);P(2:14,2:14) = ones(13,13);P(3:13,3:13) = NaN*ones(11,11);P(6:10,6:10) = 2*ones(5,5);P(7:9,7:9) = 1*ones(3,3);out1 = []; out2 = []; out3 = []; y = [];c = computer;if ~strcmp(c(1:2),'PC') & ~strcmp(c(1:2),'MA')tp = get(0,'TerminalProtocol');elsetp = 'micro';endif ~strcmp(tp,'none') & ~strcmp(tp,'x') & ~strcmp(tp,'micro'),if nargout == 1,if nargin == 1,eval('out1 = trmginput(arg1);');elseeval('out1 = trmginput;');endelseif nargout == 2 | nargout == 0,if nargin == 1,eval('[out1,out2] = trmginput(arg1);');elseeval('[out1,out2] = trmginput;');endif nargout == 0out1 = [ out1 out2 ];endelseif nargout == 3,if nargin == 1,eval('[out1,out2,out3] = trmginput(arg1);');elseeval('[out1,out2,out3] = trmginput;');endendelsefig = gcf;figure(gcf);if nargin == 0how_many = -1;b = [];elsehow_many = arg1;b = [];if isstr(how_many) ...| size(how_many,1) ~= 1 | size(how_many,2) ~= 1 ...| ~(fix(how_many) == how_many) ...| how_many < 0error('Requires a positive integer.')endif how_many == 0ptr_fig = 0;while(ptr_fig ~= fig)ptr_fig = get(0,'PointerWindow');endscrn_pt = get(0,'PointerLocation');loc = get(fig,'Position');pt = [scrn_pt(1) - loc(1), scrn_pt(2) - loc(2)];out1 = pt(1); y = pt(2);elseif how_many < 0error('Argument must be a positive integer.')endendpointer = get(gcf,'pointer');set(gcf,'Pointer','custom','PointerShapeCData',P,'PointerShapeHotSpot',[8,8]);fig_units = get(fig,'units');char = 0;while how_many ~= 0waserr = 0;eval('keydown = wfbp;', 'waserr = 1;');if(waserr == 1)if(ishandle(fig))set(fig,'pointer',pointer,'units',fig_units);error('Interrupted');elseerror('Interrupted by figure deletion');endendptr_fig = get(0,'CurrentFigure');if(ptr_fig == fig)if keydownchar = get(fig, 'CurrentCharacter');button = abs(get(fig, 'CurrentCharacter'));scrn_pt = get(0, 'PointerLocation');set(fig,'units','pixels')loc = get(fig, 'Position');pt = [scrn_pt(1) - loc(1), scrn_pt(2) - loc(2)];set(fig,'CurrentPoint',pt);elsebutton = get(fig, 'SelectionType');if strcmp(button,'open')button = 1; %b(length(b));elseif strcmp(button,'normal')button = 1;elseif strcmp(button,'extend')button = 2;elseif strcmp(button,'alt')button = 3;elseerror('Invalid mouse selection.')endendpt = get(gca, 'CurrentPoint');how_many = how_many - 1;if(char == 13) % & how_many ~= 0)break;endout1 = [out1;pt(1,1)];y = [y;pt(1,2)];b = [b;button];endendset(fig,'pointer',pointer,'units',fig_units);if nargout > 1out2 = y;if nargout > 2out3 = b;endelse。
图像处理matlab及图像融合图像镶嵌图像拼接在实际的对图像处理过程中,由于我们读出的图像是unit8型,⽽在MATLAB的矩阵运算中要求所有的运算变量为double型(双精度型)。
因此读出的图像数据不能直接进⾏相加求平均,因此必须使⽤⼀个函数将图像数据转换成双精度型数据。
MATLAB中提供了这样的函数:im2double函数,其语法格式为:I2 = im2double(I1)其中I1是输⼊的图像数据,它可能是unit8或unit16型数据,通过函数的变化输出I2为⼀个double型数据,这样两图像数据就可以⽅便的进⾏相加等代数运算.要把double的图像(范围是0到1)再次转化为256灰度值的,可以这样Igrey= uint8(I2*255)图像类型转换函数:dither() 通过颜⾊抖动,把真彩图像转换成索引图像或灰度图象转换成⼆值图像gray2ind() 将灰度图像(或⼆值图像)转换成索引图像grayslice() 通过设定的阈值将灰度图象转换成索引图像im2bw() 通过设定亮度阈值将灰度、真彩、索引图象转换成⼆值图像ind2gray() 将索引图象转换成灰度图象ind2rgb() 将索引图象转换成真彩⾊图像mat2gray() 将⼀个数据矩阵转换成⼀幅灰度图象rgb2gray() 将真彩转换成灰度图象rgb2ind() 将真彩转换成索引图象图像类型与类型间的转换1。
索引图像:包括⼀个数据矩阵X和⼀个⾊图阵MAP。
矩阵元素值指向MAP中的特定颜⾊向量。
2。
灰度图像:数据矩阵I,I中的数据代表了颜⾊灰度值。
矩阵中的元素可以是double类型、8位或16位⽆符号的整数类型。
3。
RGB图像:即真彩图像。
矩阵中每个元素为⼀个数组,数组的元素定义了像素的红、绿、蓝颜⾊值。
RGB数组可以是double类型、8位或16位⽆符号的整数类型。
4。
⼆值图像:⼀个数据阵列,每个象素只能取0或1。
矩阵的基本运算⾏列式求值:det(A)矩阵加减:+、-矩阵相乘:*矩阵左除:A/B %相当于inv(A)*B矩阵右除:A\B %相当于A*inv(B)矩阵的幂:^矩阵转置:'矩阵求共轭(实部相同,虚部相反):conj(X)矩阵求逆:inv(X)级数的求和与收敛symsum(fun,var,a,b):其中fun是通项表达式,var为求和变量,a为求和起点,b为求和终点例如:I为1/[n*(2n+1)]从1到正⽆穷的和,求Isyms n;f1=1/(n*(2*n+1));I=symsum(f1,n,1,inf)计算结果为:I =2-2*log(2)空间曲⾯mesh()函数语法:mesh(Z):mesh(X,Y,Z,C):其中C是⽤来定义相应点颜⾊等属性的数组例:求x^2+y^2=z的空间曲⾯x=-4:4;y=x;[X,Y]=meshgrid(x,y);%⽣成x,y坐标Z=X.^2+Y.^2;mesh(X,Y,Z)曲⾯图[x,y]=meshgrid(xa,ya) 当xa,ya分别为m维和n维⾏向量,得到x和y均为n⾏m列矩阵。
哈里斯角检测器是一种在计算机视觉领域常用的算法,用于检测图像中的角点。
它能够通过一定的数学和统计方法,快速准确地找出图像中的角点,是图像处理和特征提取中的重要工具之一。
在本文中,将介绍哈里斯角检测器算法的原理、实现方法以及在MATLAB中的应用。
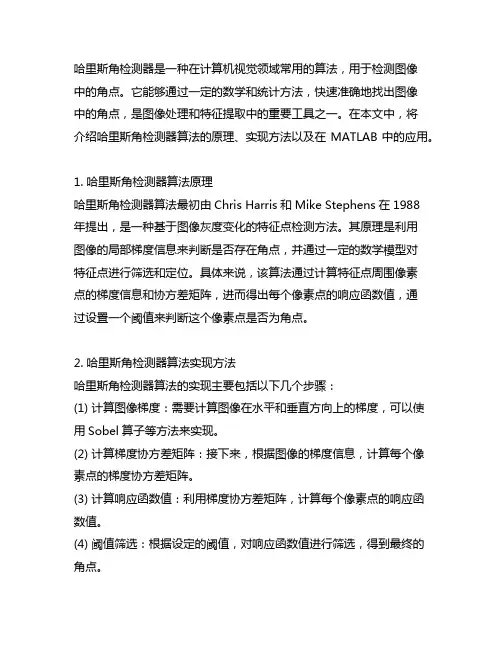
1. 哈里斯角检测器算法原理哈里斯角检测器算法最初由Chris Harris和Mike Stephens在1988年提出,是一种基于图像灰度变化的特征点检测方法。
其原理是利用图像的局部梯度信息来判断是否存在角点,并通过一定的数学模型对特征点进行筛选和定位。
具体来说,该算法通过计算特征点周围像素点的梯度信息和协方差矩阵,进而得出每个像素点的响应函数值,通过设置一个阈值来判断这个像素点是否为角点。
2. 哈里斯角检测器算法实现方法哈里斯角检测器算法的实现主要包括以下几个步骤:(1) 计算图像梯度:需要计算图像在水平和垂直方向上的梯度,可以使用Sobel算子等方法来实现。
(2) 计算梯度协方差矩阵:接下来,根据图像的梯度信息,计算每个像素点的梯度协方差矩阵。
(3) 计算响应函数值:利用梯度协方差矩阵,计算每个像素点的响应函数值。
(4) 阈值筛选:根据设定的阈值,对响应函数值进行筛选,得到最终的角点。
3. 哈里斯角检测器算法在MATLAB中的应用MATLAB是一种功能强大的数学软件,具有丰富的图像处理和计算机视觉工具包,非常适合进行哈里斯角检测器算法的实现和应用。
在MATLAB中,可以利用内置的函数或者自行编写代码来实现哈里斯角检测器算法,并对图像进行角点的检测和标记,从而实现对图像特征的提取和分析。
哈里斯角检测器算法是一种经典的图像特征点检测方法,在计算机视觉和图像处理领域具有广泛的应用。
通过理解其原理和实现方法,并在MATLAB中进行实际操作,可以更好地掌握该算法的特点和应用技巧,为进一步的图像处理和特征提取工作奠定基础。
接续上文,哈里斯角检测器算法在计算机视觉领域的应用非常广泛,例如在目标跟踪、图像配准、三维重建、立体视觉等领域都有重要作用。
matlab中的detectharrisfeatures -回复Matlab中的detectHarrisFeatures函数是一个用于检测图像中Harris角点的函数。
在本文中,我们将一步一步地回答与这个函数相关的问题,从函数的目的和输入参数到如何使用和优化这个函数。
第一步:了解Harris角点检测算法在解释detectHarrisFeatures函数之前,我们首先需要了解Harris角点检测算法的原理。
Harris角点检测算法是一种用于检测图像中角点的经典算法。
它基于角点的特征,即图像上曲线交叉或曲率变化显著的点。
Harris 角点检测算法使用局部窗口的二阶矩矩阵来计算Harris响应函数,根据阈值筛选出具有较高响应值的像素点作为角点。
第二步:了解detectHarrisFeatures函数的输入参数detectHarrisFeatures函数有多个输入参数,了解这些参数是使用该函数的重要前提。
下面是detectHarrisFeatures函数的常用参数列表:1. I:待检测的图像。
这是唯一一个必需的参数,它指定了我们要对哪个图像进行角点检测。
2. Name-Value参数对:可选参数,用于进一步指定检测的各种设置。
比如,'MinQuality'参数指定了检测到的角点最小质量,'FilterSize'参数指定了输入图像的响应滤波器尺寸,'ROI'参数指定了感兴趣区域等。
第三步:使用detectHarrisFeatures函数进行角点检测使用detectHarrisFeatures函数进行角点检测非常简单。
我们只需要提供待检测的图像作为输入参数,然后函数将返回一个包含检测到的角点位置信息的角点检测结果对象。
下面是一个简单的使用示例:matlabI = imread('image.jpg');corners = detectHarrisFeatures(I);在上面的示例中,我们使用imread函数读取了一张图片,然后将该图片作为输入参数传递给detectHarrisFeatures函数。
图像拼接基于harris检测matlab代码编辑整理:尊敬的读者朋友们:这里是精品文档编辑中心,本文档内容是由我和我的同事精心编辑整理后发布的,发布之前我们对文中内容进行仔细校对,但是难免会有疏漏的地方,但是任然希望(图像拼接基于harris检测matlab代码)的内容能够给您的工作和学习带来便利。
同时也真诚的希望收到您的建议和反馈,这将是我们进步的源泉,前进的动力。
本文可编辑可修改,如果觉得对您有帮助请收藏以便随时查阅,最后祝您生活愉快业绩进步,以下为图像拼接基于harris检测matlab代码的全部内容。
自定义函数都在下面clcclear all% 读入图片pic1=imread(’lena1.jpg');pic2=imread('lena2。
jpg’);% Harris角点检测points1=myHarris(pic1);points2=myHarris(pic2);% 画出Harris角点figure(1)drawHarrisCorner(pic1,points1,pic2,points2);% 角点特征描述des1=myHarrisCornerDescription(pic1,points1);des2=myHarrisCornerDescription(pic2,points2);%角点粗匹配matchs=myMatch(des1,des2);%获取各自出匹配角点位置matchedPoints1=points1(matchs(:,1),:);matchedPoints2=points2(matchs(:,2),:);% 粗匹配角点连线figure(2)drawLinedCorner(pic1,matchedPoints1,pic2,matchedPoints2);%角点精匹配[newLoc1,newLoc2]=pointsSelect(matchedPoints1,matchedPoints2); % 精匹配角点连线figure(3)drawLinedCorner(pic1,newLoc1,pic2,newLoc2);%图像拼接im=picMatched(pic1,newLoc1,pic2,newLoc2);%显示拼接图像figure(4)imshow(im);set(gcf,’Color',’w’);function points=myHarris(pic)% 功能:寻找Harris角点% 输入:RGB图像或gray图%输出:角点所在的行、纵的N×2矩阵if length(size(pic))==3pic=rgb2gray(pic);endpic=double(pic);hx=[-1 0 1];Ix=filter2(hx,pic);hy=[—1;0;1];Iy=filter2(hy,pic);Ix2=Ix.*Ix;Iy2=Iy.*Iy;Ixy=Ix。
如何使用Matlab进行图像拼接和图像融合技术实现引言:随着数字图像处理的快速发展,图像拼接和融合技术在许多领域中得到了广泛应用,如航空摄影、医学影像和虚拟现实等。
在本文中,我们将探讨如何使用Matlab软件来实现图像拼接和图像融合的技术。
通过学习这些技术,您将能够将多个图像合并为一个大的全景图像,并且可以通过融合不同曝光或不同焦距拍摄的图像来得到一个更高质量的图像。
一、图像拼接技术图像拼接是将多幅图像无缝合并为一个更大的全景图像的过程。
在Matlab中,可以通过以下步骤进行图像拼接:1. 加载图像:使用imread函数加载所有待拼接的图像。
确保拼接的图像具有重叠区域。
2. 检测特征点:使用SURF(Speeded-Up Robust Features)等特征检测算法在每个图像中找到相应的特征点。
Matlab中提供了现成的函数,如detectSURFFeatures和extractFeatures等。
3. 匹配特征点:使用特征描述符算法(如SURF)比较两幅图像的特征点,并找到相似的特征点。
Matlab中提供了matchFeatures函数来实现。
4. 估计变换矩阵:使用RANSAC算法估计两幅图像之间的单应性变换矩阵,该矩阵描述了如何将一个图像变换到另一个图像中。
Matlab中的estimateGeometricTransform函数可以实现这一步骤。
5. 图像拼接:使用warping技术将所有图像根据变换矩阵进行变换,并将它们拼接在一起。
Matlab提供了warp函数来实现这一过程。
6. 调整拼接后的图像:根据需求,使用imcrop函数对拼接图像进行裁剪,并使用imresize函数调整尺寸。
通过以上步骤,您可以使用Matlab实现图像拼接技术,并得到一个无缝连接的全景图像。
二、图像融合技术图像融合是将不同曝光或不同焦距下拍摄的图像进行融合,以得到更高质量的图像。
在Matlab中,可以通过以下步骤实现图像融合:1. 加载图像:使用imread函数加载待融合的图像。

matlab中的detectharrisfeaturesMatlab中的detectHarrisFeatures函数是一个用于检测Harris角点的特征点的函数。
在本文中,我们将一步一步回答与这个函数相关的问题,并详细讨论其工作原理和用法,包括输入参数、输出参数以及一些示例代码。
Harris角点检测方法是由Chris Harris和Mike Stephens在1988年提出的,它是一种用于在图像中检测兴趣点的算法。
这个算法主要用于计算图像局部区域的强度变化,以及这些变化的方向,并根据这些信息确定特征点。
首先,让我们了解一下detectHarrisFeatures函数的基本用法和语法。
在Matlab中,您可以使用以下语法调用这个函数:points = detectHarrisFeatures(img)这个函数采用一个图像作为输入,并返回一个包含检测到的Harris角点的一个对象数组。
可以使用这个点数组进行进一步的处理和分析。
在这里,'img'是要进行Harris角点检测的输入图像。
这可以是一个灰度图像或一个彩色图像。
函数将自动将彩色图像转换为灰度图像进行处理。
现在,让我们深入了解detectHarrisFeatures函数的工作原理和各个参数的作用。
Harris角点检测方法是通过对图像进行局部窗口内的像素灰度值计算来实现的。
通过在每个像素位置使用一个小的窗口,该方法计算出一个称为Harris矩阵的矩阵。
Harris矩阵包含了图像局部区域中的灰度值变化情况。
根据Harris矩阵的特征值,可以确定图像中的角点。
Harris矩阵的计算基于以下公式:H = [A B; B C]其中A、B和C是通过计算图像灰度值在局部窗口内的x和y方向上的梯度的平方和的积分。
detectHarrisFeatures函数具有几个参数,这些参数可以根据需要进行设置。
以下是这些参数的详细说明:1. 'FilterSize'参数:这个参数用来指定局部窗口的大小。

M A T L A B图像拼接算法及实现图像拼接算法及实现(一)论文关键词:图像拼接图像配准图像融合全景图论文摘要:图像拼接(image mosaic)技术是将一组相互间重叠部分的图像序列进行空间匹配对准,经重采样合成后形成一幅包含各图像序列信息的宽视角场景的、完整的、高清晰的新图像的技术。
图像拼接在摄影测量学、计算机视觉、遥感图像处理、医学图像分析、计算机图形学等领域有着广泛的应用价值。
一般来说,图像拼接的过程由图像获取,图像配准,图像合成三步骤组成,其中图像配准是整个图像拼接的基础。
本文研究了两种图像配准算法:基于特征和基于变换域的图像配准算法。
在基于特征的配准算法的基础上,提出一种稳健的基于特征点的配准算法。
首先改进Harris角点检测算法,有效提高所提取特征点的速度和精度。
然后利用相似测度NCC(normalized cross correlation——归一化互相关),通过用双向最大相关系数匹配的方法提取出初始特征点对,用随机采样法RANSAC(Random Sample Consensus)剔除伪特征点对,实现特征点对的精确匹配。
最后用正确的特征点匹配对实现图像的配准。
本文提出的算法适应性较强,在重复性纹理、旋转角度比较大等较难自动匹配场合下仍可以准确实现图像配准。
Abstract:Image mosaic is a technology that carries on the spatial matching to aseries of image which are overlapped with each other, and finally builds a seamless and high quality image which has high resolution and big eyeshot. Image mosaic has widely applications in the fields of photogrammetry, computer vision, remote sensingimage processing, medical image analysis, computer graphic and so on. 。
Matlab中的图像拼接与合成方法图像拼接和合成是数字图像处理中的重要技术,在许多领域都有广泛的应用,如计算机视觉、图形学、遥感和医学图像等。
在Matlab中,我们可以利用一些强大的工具和函数来实现图像拼接与合成。
一、图像的基本处理在进行图像拼接与合成之前,我们需要先对待处理的图像进行一些基本的预处理,比如图像的读取、转换、调整和裁剪等。
Matlab提供了丰富的函数和工具箱来完成这些任务。
1. 图像读取与转换Matlab中可以使用imread函数来读取图像,支持多种图像格式,如JPEG、PNG和BMP等。
读取后的图像可以保存在一个矩阵中,每个像素的值代表该位置的颜色信息。
读取图像示例代码:image = imread('image.jpg');对于彩色图像,可以使用rgb2gray函数将图像转换成灰度图像,方便后续处理。
转换为灰度图像示例代码:gray_image = rgb2gray(image);2. 图像调整与裁剪Matlab中提供了imresize函数来调整图像大小,可以根据比例因子或指定的尺寸来调整图像。
另外,还可以使用imcrop函数来裁剪图像,根据指定的位置和尺寸来截取感兴趣的部分。
调整图像大小示例代码:resized_image = imresize(image, 0.5); % 缩小为原来的一半裁剪图像示例代码:cropped_image = imcrop(image, [x, y, width, height]); % 截取位置为(x, y),尺寸为width x height的图像二、图像拼接方法图像拼接是将多幅图像按照一定的规则拼接在一起,构成一幅更大的图像。
Matlab中有多种方法可以实现图像的拼接,常用的方法包括简单的几何变换、局部特征匹配和全局优化方法等。
1. 简单的几何变换最简单的图像拼接方法是通过几何变换将多幅图像对齐,然后将它们合并在一起。
在Matlab中,可以使用imtransform函数来进行几何变换,常见的变换包括平移、旋转、缩放和翻转等。
角点提取与匹配算法实验报告1 说明本文实验的目标是对于两幅相似的图像,通过角点检测算法,进而找出这两幅图像的共同点,从而可以把这两幅图像合并成一幅图像。
下面描述该实验的基本步骤:1.本文所采用的角点检测算法是Harris 角点检测算法,该算法的基本原理是取以目标像素点为中心的一个小窗口,计算窗口沿任何方向移动后的灰度变化,并用解析形式表达。
设以像素点(x,y)为中心的小窗口在X 方向上移动u ,y 方向上移动v ,Harris 给出了灰度变化度量的解析表达式:2,,|,|,,()(x y x y x u y v x y x y I I E w I I w uv o X Y∂∂=-=++∂∂∑∑ (1) 其中,,x y E 为窗口内的灰度变化度量;,x y w 为窗口函数,一般定义为222()/,x y x y w e σ+=;I 为图像灰度函数,略去无穷小项有:222222,,[()()2]2x y x y x y x y E w u I v I uvI I Au Cuv Bv =++=++∑(2)将,x y E 化为二次型有:,[]x yu E u v M v ⎡⎤=⎢⎥⎣⎦(3)M 为实对称矩阵:2,2x y x x y x y y I I I M w I I I •⎤⎡=⎥⎢•⎢⎥⎣⎦∑ (4)通过对角化处理得到:11,200x y E R R λλ-⎛⎫= ⎪⎝⎭(5)其中,R 为旋转因子,对角化处理后并不改变以u,v 为坐标参数的空间曲面的形状,其特征值反应了两个主轴方向的图像表面曲率。
当两个特征值均较小时,表明目标点附近区域为“平坦区域”;特征值一大一小时,表明特征点位于“边缘”上;只有当两个特征值均比较大时,沿任何方向的移动均将导致灰度的剧烈变化。
Harris 的角点响应函数(CRF)表达式由此而得到:2(,)det()(())CRF x y M k trace M =-(6)其中:det(M)表示矩阵M的行列式,trace(M)表示矩阵的迹。
在Matlab中进行图像配准和形状匹配的技术一、引言图像配准和形状匹配是计算机视觉领域中的重要研究方向,主要用于解决图像处理中的对应、定位和识别问题。
在Matlab中,有许多强大的工具和函数可用于图像配准和形状匹配的实现。
本文将介绍Matlab中常用的图像配准和形状匹配技术,并给出相应的代码实现和示例。
二、图像配准技术1. 基本概念图像配准是将两幅或多幅图像进行对齐,使得它们在空间中具有相同的位置和尺度。
图像配准技术的应用非常广泛,如医学影像、地图制作、机器视觉等领域。
2. 像素级配准像素级配准是通过对图像中的像素进行变换和校正,实现两幅图像的对齐。
Matlab中的imregister函数可用于图像的像素级配准。
以下是一个示例代码:```matlabimage1 = imread('image1.jpg');image2 = imread('image2.jpg');transform = imregtform(image1, image2, 'similarity');registeredImage = imwarp(image1, transform);figure;subplot(1, 2, 1), imshow(image1), title('Original Image');subplot(1, 2, 2), imshow(registeredImage), title('Registered Image');```3. 特征点配准特征点配准是通过检测和匹配两幅图像中的特征点,实现图像的对齐。
Matlab 中的detectSURFFeatures和matchFeatures函数可用于特征点的检测和匹配。
以下是一个示例代码:```matlabimage1 = imread('image1.jpg');image2 = imread('image2.jpg');points1 = detectSURFFeatures(image1);points2 = detectSURFFeatures(image2);[features1, validPoints1] = extractFeatures(image1, points1);[features2, validPoints2] = extractFeatures(image2, points2);indexPairs = matchFeatures(features1, features2);matchedPoints1 = validPoints1(indexPairs(:, 1), :);matchedPoints2 = validPoints2(indexPairs(:, 2), :);tform = estimateGeometricTransform(matchedPoints1, matchedPoints2, 'similarity');registeredImage = imwarp(image1, tform);figure;showMatchedFeatures(image1, image2, matchedPoints1, matchedPoints2);title('Matched Features');figure;subplot(1, 2, 1), imshow(image1), title('Original Image');subplot(1, 2, 2), imshow(registeredImage), title('Registered Image');```三、形状匹配技术1. 基本概念形状匹配是指在图像处理中,通过计算和比较两个物体或图像之间的形状特征,判断它们是否相似或相匹配的技术。
使用Matlab进行图像配准的基本步骤与技巧图像配准是计算机视觉领域的重要任务,它是指将不同视角、不同时间、不同传感器等条件下获取的图像进行对齐,使它们之间的特征点相互对应,从而实现图像的整合和比较。
Matlab作为一种功能强大的编程语言和图像处理工具,在图像配准方面具有广泛的应用。
本文将介绍使用Matlab进行图像配准的基本步骤与技巧。
一、图像配准的基本步骤图像配准的基本步骤包括以下几个方面:1. 准备待配准的图像:首先,需要准备待配准的图像,可以是两张具有一定重叠区域的图像,也可以是多张图像。
这里我们以两张图像为例进行讨论。
2. 提取图像特征:在进行图像配准之前,需要对图像进行特征提取。
常用的特征有角点、边缘、纹理等。
在Matlab中,可以使用角点检测算法如Harris角点检测、SIFT、SURF等,提取图像的特征点。
3. 特征匹配:特征匹配是图像配准的核心步骤,它是通过计算两幅图像的特征点之间的距离或相似度,将它们进行匹配。
在Matlab中,可以使用KNN算法、RANSAC算法等进行特征匹配。
4. 计算变换矩阵:在进行特征匹配之后,可以根据匹配点对计算出图像的变换矩阵。
常用的变换矩阵有相似变换、仿射变换、投影变换等。
5. 图像配准:根据计算得到的变换矩阵,对待配准的图像进行变换,使其与目标图像对应点重合。
在Matlab中,可以使用imwarp函数进行图像配准。
6. 评估配准结果:完成图像配准之后,需要对配准结果进行评估。
常用的评估指标有均方差、互信息等。
在Matlab中,可以使用imregister和imregconfig函数进行配准结果的评估。
二、图像配准的技巧在进行图像配准时,需要注意以下几个技巧:1. 特征提取算法选择:不同的图像特征对应不同的图像内容,选择合适的特征提取算法对于获取准确的特征点是非常重要的。
需要根据图像的内容和应用场景选择合适的特征提取算法。
2. 特征匹配策略选择:特征匹配过程中存在匹配错误、误匹配等问题,选择合适的特征匹配策略可以提高配准的准确性。
matlabharris角点检测函数Matlab中的harris角点检测函数Harris角点检测算法是计算机视觉领域中非常重要的算法之一。
它能够在图像中自动检测出具有较高对比度变化和明显边缘的角点,从而在很多应用中发挥重要作用,例如图像配准、目标跟踪和三维重建等。
在Matlab 中,我们可以使用内置的harris角点检测函数来实现这一功能。
本文将详细介绍harris角点检测函数的使用方法。
Harris角点检测函数在Matlab中的函数原型如下:H = corner(I)其中,I代表输入的待检测图像,H是一个包含了检测到的角点坐标和相应响应值的二维矩阵。
下面我们一步一步来介绍如何使用这个函数进行角点检测。
第一步:导入图像并转换为灰度图像首先,我们需要导入一个待检测的图像。
假设我们要检测的图像叫做"image.jpg",我们可以使用imread函数来读取这个图像,并将其转换为灰度图像。
灰度图像对于角点检测来说更加合适,因为它只包含了亮度信息,而不包含颜色信息。
以下是导入和转换的代码:I = imread('image.jpg');Igray = rgb2gray(I);在这里,我们使用了imread函数来读取图像,并且使用rgb2gray函数将读取到的RGB图像转换为灰度图像。
转换后的图像被存储在一个名为Igray的变量中。
第二步:应用Harris角点检测函数接下来,我们需要将灰度图像输入到Harris角点检测函数中进行处理。
处理后的结果将存储在一个名为H的变量中。
以下是应用角点检测函数的代码:H = corner(Igray);在这里,我们通过调用corner函数并将灰度图像作为参数传入,来实现Harris角点检测。
第三步:可视化和分析检测结果一旦角点检测完成,我们可以通过可视化检测结果来验证算法的效果。
我们可以使用imshow函数来显示原始图像和检测到的角点。
利用Matlab进行图像配准与立体视觉处理概述图像配准和立体视觉处理是计算机视觉领域的重要研究方向,它们在医学影像处理、遥感图像分析、工业检测等领域具有广泛应用。
本文将重点探讨如何利用Matlab进行图像配准和立体视觉处理,并介绍一些常用的算法和工具。
一、图像配准图像配准是将不同视角或时间的图像对齐,使得它们在相同地理坐标下一一对应。
在Matlab中,我们可以利用图像处理工具箱中的函数来实现图像配准。
常见的图像配准算法有基于特征点的方法、基于灰度值的方法和基于区域的方法。
1.1 基于特征点的图像配准基于特征点的图像配准方法主要是利用图像中的显著特征点进行匹配,然后通过计算变换矩阵将图像对齐。
在Matlab中,可以使用函数detectHarrisFeatures和extractFeatures来检测和提取图像中的Harris角点特征。
然后,可以使用函数matchFeatures来进行特征匹配,并通过函数estimateGeometricTransform计算变换矩阵。
1.2 基于灰度值的图像配准基于灰度值的图像配准方法通过最小化图像之间的灰度差异来实现对齐。
在Matlab中,可以使用图像处理工具箱中的imregister函数来实现基于灰度值的图像配准。
该函数支持多种配准算法,如互相关和归一化互相关等。
用户可以根据不同需求选择适合的算法。
1.3 基于区域的图像配准基于区域的图像配准方法将图像分成若干个区域,然后通过计算区域之间的相似性来实现对齐。
在Matlab中,可以使用图像处理工具箱中的cp2tform函数和imtransform函数来实现基于区域的图像配准。
用户需要首先选择一个参考图像,并在该图像上选择若干个参考点。
然后,可以通过选择合适的变换模型,利用cp2tform函数计算变换参数,并通过imtransform函数将其他图像进行变换。
二、立体视觉处理立体视觉处理是利用多个视角的图像进行深度信息的恢复和三维重建。
如何在Matlab中实现图像拼接概述图像拼接是将多个局部图像通过一定的算法融合在一起,最终形成一张完整的图像的过程。
在计算机视觉领域中,图像拼接常用于全景图、卫星图像、医学图像等领域。
本文将介绍如何在Matlab中实现图像拼接,并附带示例代码和具体步骤。
1. 准备工作在开始进行图像拼接之前,我们需要准备一些工作。
首先,确保你已经安装了Matlab软件,并确保版本较新。
其次,准备一些要拼接的图像,这些图像最好具有一定的重叠区域,以便能够通过算法找到匹配点。
2. 导入图像在Matlab中,我们可以使用`imread`函数导入图像。
例如,我们有三张要拼接的图像,可以使用以下代码导入:```matlabimage1 = imread('image1.jpg');image2 = imread('image2.jpg');image3 = imread('image3.jpg');```3. 特征提取在进行图像拼接之前,我们需要提取图像中的特征点。
特征点是图像中独特的、易于识别的点,例如角点、边缘等。
在Matlab中,我们可以使用`detectSURFFeatures`函数来提取图像的SURF特征点。
例如,我们可以对第一张图像进行特征提取:```matlabpoints1 = detectSURFFeatures(rgb2gray(image1));```4. 特征匹配得到特征点之后,我们需要对不同图像中的特征点进行匹配,以找到匹配的特征对。
在Matlab中,我们可以使用`matchFeatures`函数来进行特征匹配。
例如,我们可以对第一张图像和第二张图像进行特征匹配:```matlabpoints2 = detectSURFFeatures(rgb2gray(image2));features1 = extractFeatures(rgb2gray(image1), points1);features2 = extractFeatures(rgb2gray(image2), points2);indexPairs = matchFeatures(features1, features2);matchedPoints1 = points1(indexPairs(:, 1), :);matchedPoints2 = points2(indexPairs(:, 2), :);```5. 图像配准特征匹配之后,我们需要对图像进行配准,即将不同图像中的特征点对齐在一起。
自定义函数都在下面clcclear all% 读入图片pic1=imread('lena1.jpg');pic2=imread('lena2.jpg');% Harris角点检测points1=myHarris(pic1);points2=myHarris(pic2);% 画出Harris角点figure(1)drawHarrisCorner(pic1,points1,pic2,points2);% 角点特征描述des1=myHarrisCornerDescription(pic1,points1); des2=myHarrisCornerDescription(pic2,points2); % 角点粗匹配matchs=myMatch(des1,des2);% 获取各自出匹配角点位置matchedPoints1=points1(matchs(:,1),:); matchedPoints2=points2(matchs(:,2),:);% 粗匹配角点连线figure(2)drawLinedCorner(pic1,matchedPoints1,pic2,matchedPoints2);% 角点精匹配[newLoc1,newLoc2]=pointsSelect(matchedPoints1,matchedPoints2); % 精匹配角点连线figure(3)drawLinedCorner(pic1,newLoc1,pic2,newLoc2);% 图像拼接im=picMatched(pic1,newLoc1,pic2,newLoc2);% 显示拼接图像figure(4)imshow(im);set(gcf,'Color','w');function points=myHarris(pic)% 功能:寻找Harris角点% 输入:RGB图像或gray图% 输出:角点所在的行、纵的N×2矩阵if length(size(pic))==3pic=rgb2gray(pic);endpic=double(pic);hx=[-1 0 1];Ix=filter2(hx,pic);hy=[-1;0;1];Iy=filter2(hy,pic);Ix2=Ix.*Ix;Iy2=Iy.*Iy;Ixy=Ix.*Iy;h=fspecial('gaussian',[7 7],2);Ix2=filter2(h,Ix2);Iy2=filter2(h,Iy2);Ixy=filter2(h,Ixy);[heigth,width]=size(pic);alpha=0.06;R=zeros(heigth,width);for i=1:heigthfor j=1:widthM=[Ix2(i,j) Ixy(i,j);Ixy(i,j) Iy2(i,j)]; R(i,j)=det(M)-alpha*(trace(M)^2); endendRmax=max(max(R));pMap=zeros(heigth,width);for i=2:heigth-1for j=2:width-1if R(i,j)>0.01*Rmaxtm=R(i-1:i+1,j-1:j+1);tm(2,2)=0;if R(i,j)>tmpMap(i,j)=1;endendendend[row,col]=find(pMap==1);points=[row,col];function drawHarrisCorner(pic1,points1,pic2,points2) % 功能:画出Harris角点的连接% 输入:% pic1、pic2:待拼接的图像% points1、points2:Harris角点位置X1=points1(:,2);Y1=points1(:,1);X2=points2(:,2);Y2=points2(:,1);dif=size(pic1,2);imshowpair(pic1,pic2,'montage');hold onplot(X1,Y1,'b*');plot(X2+dif,Y2,'b*');set(gcf,'Color','w');function des=myHarrisCornerDescription(pic,points) % 功能:Harris角点特征描述% 输入:% pic:原图像% points:角点位置% 输出:% des:8×N的角点特征描述矩阵if length(size(pic))==3pic=rgb2gray(pic);endlen=length(points);des=zeros(8,len);for k=1:lenp=points(k,:);pc=pic(p(1),p(2));des(1,k)=pic(p(1)-1,p(2)-1)-pc;des(2,k)=pic(p(1),p(2)-1)-pc;des(3,k)=pic(p(1)+1,p(2)-1)-pc;des(4,k)=pic(p(1)+1,p(2))-pc;des(5,k)=pic(p(1)+1,p(2)+1)-pc;des(6,k)=pic(p(1),p(2)+1)-pc;des(7,k)=pic(p(1)-1,p(2)+1)-pc;des(8,k)=pic(p(1)-1,p(2))-pc;des(:,k)=des(:,k)/sum(des(:,k));endfunction matchs=myMatch(des1,des2) % 功能:特征点双向匹配% 输入:% des1、des2:特征点描述信息构成的矩阵% 输出:% matchs:匹配的特征点对应关系len1=length(des1);len2=length(des2);match1=zeros(len1,2);cor1=zeros(1,len2);for i=1:len1d1=des1(:,i);for j=1:len2d2=des2(:,j);cor1(j)=(d1'*d2)/sqrt((d1'*d1)*(d2'*d2));[~,indx]=max(cor1);match1(i,:)=[i,indx];endmatch2=zeros(len2,2);cor2=zeros(1,len1);for i=1:len2d2=des2(:,i);for j=1:len1d1=des1(:,j);cor2(j)=(d1'*d2)/sqrt((d1'*d1)*(d2'*d2)); end[~,indx]=max(cor2);match2(i,:)=[indx,i];endmatchs=[];for i=1:length(match1)for j=1:length(match2)if match1(i,:)==match2(j,:)matchs=[matchs;match1(i,:)];endendfunction drawLinedCorner(pic1,loc1,pic2,loc2)% 功能:画出匹配角点的连接% 输入:% pic1、pic2:待拼接的图像% loc1、loc2:匹配角点位置X1=loc1(:,2);Y1=loc1(:,1);X2=loc2(:,2);Y2=loc2(:,1);dif=size(pic1,2);imshowpair(pic1,pic2,'montage');hold onfor k=1:length(X1)plot(X1(k),Y1(k),'b*');plot(X2(k)+dif,Y2(k),'b*');line([X1(k),X2(k)+dif],[Y1(k),Y2(k)],'Color','r');endset(gcf,'Color','w');function [newLoc1,newLoc2]=pointsSelect(loc1,loc2) % 功能:筛选匹配特征点对,获取高精度的控制点% 输入:% loc1、loc2:粗匹配特征点位置% 输出:% newLoc1、newLoc2:精匹配控制点位置slope=(loc2(:,1)-loc1(:,1))./(loc2(:,2)-loc1(:,2));for k=1:3slope=slope-mean(slope);len=length(slope);t=sort(abs(slope));thresh=t(round(0.5*len));ind=abs(slope)<=thresh;slope=slope(ind);loc1=loc1(ind,:);loc2=loc2(ind,:);endnewLoc1=loc1;newLoc2=loc2;function im=picMatched(pic1,newLoc1,pic2,newLoc2) % 功能:获取拼接之后的图片% 输入:% pic1、pic2:待拼接图片% newLoc1、newLoc2:变换控制点矩阵% 输出:% im:拼接后的图片if length(size(pic1))==2pic1=cat(3,pic1,pic1,pic1);endif length(size(pic2))==2pic2=cat(3,pic2,pic2,pic2);endSZ=2000;X1=newLoc1(:,2);Y1=newLoc1(:,1);X2=newLoc2(:,2);Y2=newLoc2(:,1);sel=randperm(length(newLoc1),3); x=X2(sel)';y=Y2(sel)';X=X1(sel)';Y=Y1(sel)';U=[x;y;ones(1,3)];V=[X;Y;ones(1,3)];T=V/U;cntrX=SZ/2;cntrY=SZ/2;im=zeros(SZ,SZ,3);for i=1:size(pic2,1)for j=1:size(pic2,2)tmp=T*[j;i;1];nx=round(tmp(1))+cntrX;ny=round(tmp(2))+cntrY;if nx>=1 && nx<=SZ && ny>=1 && ny<=SZim(ny,nx,:)=pic2(i,j,:);endendendim=imresize(im,1,'bicubic');tpic1=zeros(SZ,SZ,3);tpic1(1+cntrY:size(pic1,1)+cntrY,1+cntrX:size(pic1,2)+cntrX,:)=pic1; re=rgb2gray(uint8(im))-rgb2gray(uint8(tpic1));for k=1:3ta=im(:,:,k);tb=tpic1(:,:,k);ta(re==0)=tb(re==0);im(:,:,k)=ta;endclear ta tb re tpic1im=getPicture(im,SZ);im=uint8(im);if length(size(pic1))==2im=rgb2gray(im);endfunction im=getPicture(pic,SZ) % 功能:获取图像有用区域% 输入:% pic:拼接图像% SZ:预定图像尺寸% 输出:% im:有用区域图像if length(size(pic))==2pic=cat(3,pic,pic,pic);endk=1;while k<SZif any(any(pic(k,:,:)))breakendk=k+1;endceil=k; %上边界k=SZ;while k>0if any(any(pic(k,:,:))) breakendk=k-1;endbottom=k; %下边界k=1;while k<SZif any(any(pic(:,k,:))) breakendk=k+1;endleft=k; %左边界k=SZ;while k>0if any(any(pic(:,k,:)))breakendk=k-1;endright=k; %右边界%%获取图像im=pic(ceil:bottom,left:right,:);。