纺织品出口竞争力研究外文文献翻译最新译文
- 格式:doc
- 大小:50.00 KB
- 文档页数:9
越南纺织品产业竞争力研究的国内外文献综述目录越南纺织品产业竞争力研究的国内外文献综述 (1)(一)国外文献综述 (1)(二)国内文献综述 (2)(三)文献述评 (4)(一)国外文献综述竞争力研究理论最早可以追溯到古典经济学派理论,比较优势和积聚优势理论揭示了国际分工体系下国家间的竞争优势形成机理,因此被奉为竞争力优势理论的基础。
然而对竞争力进行系统研究是上个世纪八十年代开始的。
国际上最早对竞争力进行系统、全面研究的机构或学者有两个。
一个是世界经济论坛和瑞士洛桑国际管理开发学院的竞争力评价方法和指标体系,其研究侧重于宏观层面的竞争力问题。
另一个是美国哈佛大学教授迈克尔.波特的竞争力理论。
迈克尔.波特发表了四本极具影响力著作:《竞争战略》、《竞争优势》、《全球产业中的竞争》和《国家竞争优势》。
Wong Amy(2021)提出了基于资源的企业理论。
他认为企业竞争力是一种能够让企业产生可持续发展能力的资源。
PETE BIGELOW(2021)从技术与组织的角度提出了竞争力能使市场、企业和技能互相结合的观点。
Li Junxuan(2021)在《国际物流运输研究杂志》发表的《中小企业的弹性与竞争力:实证研究》中阐述了中小企业的竞争优势,并通过实证的方法来研究影响竞争力的因素。
Pavleen Soni(2021)提出了制造型中小企业在市场经济中有着重要地位的观点,且他认为对于制造型中小企业来说提升自身的竞争力是非常重要的。
Kalender Gulcin Ipek(2021)阐述了区域竞争力思想的演变,总结出怎样融合不同的观点理论来提供整体的思路。
Augustin Ignatov(2018)通过对欧盟2007年~2016年期间经济创新相关数据的定量分析发现,商业驱动的创新在竞争环境中更有效,也更多的被采用。
与政府驱动的创新相比,企业驱动的创新更具竞争力,更适合竞争环境。
通过深层次的整合,将促进竞争并且提高业务和市场作为决策因素的作用。
外文翻译原文LABOR MARKET EFFECTS OF IMPORT COMPETITON: THEORY AND EVIDENCE FROM THE TEXITILE AND APPAREL INDUSTRIESMaterial Source: Atlantic Economic JournalAuthor: BEN S. SHIPPENAbstract: Since the early 1980s, much attention has been given to the possibility of trade-related job losses and wage effects in the textile and apparel industries. This paper uses aggregate time series data from the Annual Survey of Manufacturers (Bartlesman and Gray, 1996) with import price data from the Bureau of Labor Statistics (Alterman, 1991) for 1977-91 to test the effect of imports on employment and wages in textiles and apparel. Theoretical models suggest that import competition should be a factor in the determination of employment, and possibly wages, regardless of whether the country is represented as a price-setter or price-taker. The empirical analysis provides some support.Key words: Labor market Import competition Wage Textile industry IntroductionThere is widespread speculation that international trade has a large negative effect on employment and wages especially in low wage sectors where foreign labor costs are particularly low. Since the early 1980s, much attention has been given to the possibility of displaced domestic labor and wage losses in the textile and apparel industries.Historically, textiles and apparel have been important industries in the U.S. economy, in terms of both output and employment. As recently as 1973, they employed 2.3 million workers or more than 11 percent of the total number of workers in manufacturing. By 1993 however, employment had declined to about 1.6 million workers and 8.3 percent of manufacturing--a decline of more than 30 percent. Real wages for both industries remain well below the manufacturing average. In 1993 the average apparel wage was 41percent less, and the average textile wage was 26 percent less than average wages in other manufacturing industries. A popular explanation for employment declines and low wages is the presence of importcompetition. The purpose of this paper is to look at this popular notion by testing the effect of imports on employment and wages in textiles and apparel with aggregate time series data. Such an examination is absent in literature.This paper is organized as follows. First, a theoretical model of textile and apparel supply and demand is presented to explain how import competition is expected to affect workers. In the world market, the U.S. is modeled as both a price-setter and a price-taker. The theoretical models suggest that import competition could be a factor in determining employment regardless of whether the U.S. is represented as a price-setter or price-taker. However, this would only be a determining factor of wages if the U.S. is a price-setter. Two empirical models are developed to test whether the U.S. textile and apparel market is a price-setter or price-taker. If the U.S. textile and apparel industries are price-takers, then a measure of import price should be sufficient to measure the effect of import competition on wages and employment. However, if the U.S. textile and apparel market is a price-setter, then endogeneity bias is a possibility in the import price variable and corrective steps must be taken to model the import effects. The analysis here suggests that the effect of import competition on employment and wages is small.Theoretical AnalysisThere are two limiting, theoretical possibilities regarding the way the U.S. production market affects the price in the world market:1) Every domestic change in demand and supply causes a change in world prices.2) Domestic changes in demand and supply have no affect on world prices.The first possibility assumes that the U.S. is a large producer or consumer in the world market and is, thus, a price-setter. The second assumes that the U.S. is a small producer and a small consumer on the world market and is, thus, a price-taker. The distinction between these two possibilities is important because it determines whether import price is endogenous or exogenous to shocks in the domestic market.Starting with the assumption that the U.S. is a price-setter in the world market, the import demand curve is a function of excess demand. The excess demand curve is negatively related to price and, as the domestic demand and supply curves shift, the intercept of the demand for imports changes. Assuming perfect substitutability between domestics and imports as demand for domestic production increases, then excess demand for import production will also increase. However, if domestic supply increases, then excess demand for imports will decrease.The aggregate import supply curve represents the excess supply of goods in other countries. The supply schedule is positively related to price and reflects changes in foreign supply and demand. Foreign incomes and cost conditions abroad are inversely related to the supply schedule while technological changes positively affect supply.The alternative model assumes that the U.S. is a price-taker. The excess demand curve in this model is the same as with the U.S. as a price-setter, with the intercept of the demand curve in the import market starting at the level of equilibrium of demand and supply in the U.S. domestic market. Changes in domestic conditions will change both the domestic equilibrium point and the excess demand in the import market. The supply curve in the import market is perfectly elastic, however, indicating that although changes in domestic demand and supply affect the quantity of imports purchased, they do not affect price.Employment and Wage Models of Import CompetitionTwo models are used to calculate import competition effects on employment and wages in the textile and apparel industries, The first assumes that the U.S. market is a price-taker and, following the empirical framework of (Grossman ,1986), uses import price as the measure of international competition. The second model assumes that the U.S. is a price-setter and, in an approach similar to (Revenga ,1992), uses two-stage least squares (2SLS) with weighted exchange rates as an instrument for import price.First, consider the structural labor demand schedule. Let it L be labor demandin industry i and year t. Then dln it L =1θdln it W +d it Z Γ+it w 1(1) where: 1θ is theemployment elasticity with respect to the wage; it W is the average industry wage;it Z is a vector of observable factors that shift the demand for labor in industry i andyear t; Γis a vector of employment elasticity that corresponds to it Z ; and it w 1 isan error term that is designed to capture unobserved demand shocks.The vector of variables that shifts labor demand includes the measures of aggregate demand in the economy and direct measures of labor demand. The vector of demand shifters include measures of import competition, real gross national product (GNP), domestic production, and an index of the cost of materials. Employment is expected to vary positively with GNP and the industry output. It could vary inversely or positively with the cost of materials depending on whether the output or substitution effect is dominant.The measure of import competition is an index of import prices. Employment isexpected to vary positively with import price as an increase in the import price increases the production in the U.S.Next, consider the labor supply to an industry: dln it L =c.dln it W +dit H ψ+it w 2(2) where: it W is the industry wage at year t; c is the industry supply elasticity with respect to the wage; it H is a vector of observed factors that shift labor supply; ψis a vector of industry supply elasticity; and it w 2 represents unmeasured supplyshocks.It is necessary to estimate the system in reduced form because wages and employment are simultaneously determined. The equations written in reduced form are: dln it L =1γd it Z +2γd it H +it v (3) and dln it W =1βd it Z +2βd it H +it v (4) where it v and it v are error terms that reflect unmeasured shocks to labor demand and supply.For 2SLS estimation, a first-stage equation is required to estimate the endogenous import price variable used in the second-stage equation. The first-stage equation is: dln it P =1ξd it Z +2ξd it H +3ξd it I +it ∈(5) where it P represents theaverage import price for industry i and year t, it I represents the weighted exchangerate variable for industry i and year t, and it ∈ represents a random error term forindustry i and year t. Predicted values of dln it P are then used to estimate (3) and (4)using 2SLS estimation.DataThe data used are obtained from the National Bureau of Economic Research productivity and trade databases. These are compiled for the 1972 manufacturing industries at the standard industry code's four-digit level (450 total) for 1958-91. Other variables include value of shipments, cost of materials, production employment, production hours, and production payroll on an annual basis. These variables have been converted to the three-digit level to accommodate the index of import price data. Variables that are not included in the National Bureau of Economic Research databases but are used in these equations are GNP, an index of import prices, and a weighted exchange rate. Constant GNP is drawn from the Economic Report of the President [1993] for 1972-91 while the import price variable is international price indices taken from the Bureau of Labor Statistics (Alterman ,1991) for selected three-digit manufacturing industries for 1977-91. The weighted exchange rate is from the Bureau of Census' International Trade Division(Alterman ,1991) for the top five exporting countries to the U.S. in textiles and apparel in 1991, and the total weighted index is from the Economic Report of the President. Finally, implicit price deflators for value of shipments and the index ofthe cost of materials are also taken from the Economic Report of the President.The Results of the Ordinary Least Squares (OLS) and 2SLS ModelsTable 1 presents the results of the import price specification. The employment elasticity of domestic output with respect to hours and employment in the apparel industry is positive and significant. Also in apparel, the coefficient on the alternative real wage is estimated to be -1.558 in the employment equation, suggesting that a one percent increase in the alternative wage (which, in turn, increases own wage) would reduce employment by 1.59 percent in these industries. In the textile industry, the coefficient on the alternative wage in the employment equation is also significant. GNP and the index of the cost of materials in this model have no effect on employment or wages in either industry.TABLE 1The coefficient on import prices in the apparel industry is positive and significant for the hours and employment equations, indicating that an increase inimport price has a positive effect on hours worked and overall production employment. The coefficient on the import price variable is small and insignificant in the apparel wage equation. This result, however, is not unexpected if apparel workers are taken from a large labor market where apparel firms are wage-takers. On the other hand, the coefficient on import prices in the hours, employment, and wage equations in the textile industry is small and insignificant, suggesting that a change in the import price in this specification has little effect on hours worked, people employed, or average wages of production workers. In this model, only changes in domestic output and the alternative wage have significant effects on hours, employment, or wages in the textile industry.Table 2 presents the results for the 2SLS model for the textile and apparel industries. This estimation assumes that the U.S. is a price-setter and is designed to correct for endogeneity bias in the import price variable by estimating import price as a function of weighted exchange rates. This corrected import price variable should not be correlated with the dependent variables or with industry-specific domestic shocks.TABLE 2Domestic output remains the most significant variable in the employment equations of both industries, with positive coefficients in the two-stage estimations. The alternative wage variable in the employment equation continues to be positive in the textile industry and negative in apparel. GNP and the index of the cost of materials are insignificant in all equations for both industries.The coefficient on the import price variable in the 2SLS estimations increases from the previous OLS estimations for textiles and apparel. In the apparel industry, the coefficient in the hours and employment equations increased from 0.442 to 0.528 log points and from 0.359 to 0.541 log points, respectively. 4 Since using 2SLS models often results in a loss of efficiency compared to OLS estimates, it is not surprising that these results change from being significant to insignificant at standard levels. The estimation would benefit with increased observations to determine if the problem is associated with the small sample, or if import prices truly have no effect. The estimate of import price also appears larger in the 2SLS equations of the textile industry, compared to the results of the OLS estimation, although the coefficients are insignificant.ConclusionsThe results from the two models are mixed. The results of the OLS model with the U.S. as a price-taker suggest that foreign competition plays a significant role in determining employment and hours worked in the apparel industry. The textile industry, however, is not significantly affected by import prices in hours worked, employment, or wages. The results from the 2SLS model using weighted exchange rates to instrument the index of import price variable are more consistent with these results, although standard errors are large. Indeed, the coefficients of the import price variable with respect to employment and hours are larger in these estimations for both industries than in the OLS models but are not significant. The results of import competition on wages for the 2SLS models were small and insignificant.Insofar as these models suggest that import competition is an important but not primary cause of employment loss for these industries over the period, the results of these models appear to be consistent with the results found elsewhere in literature. The estimated effects of import competition on wages are consistent with there being relatively competitive labor markets and with the U.S. textile and apparel industries as price-takers in the world product market.译文劳动力资源对进出口竞争的影响:以纺织业为例资料来源:大西洋经济期刊作者:苯·希膨摘要:20世纪80年代以来,人们普遍关注失业和工资对国际贸易中纺织和服装业进出口的影响。
外文翻译原文EXPORT COMPETITIVENESS OF INDIAN TEXTILEAND GARMENTINDUSTRYMaterial Source: Indian Council For ResearchOn International Economic RelationsAuthor:Samar VermaThe international trade in textile and clothing sectors has been a egregious exception to the most favoured nation principle of GATT and, since the early 1960s, has been a case of managed trade through forced consensus. However, the WTO Agreement on Textile and Clothing (ATC) marked a significant turnaround. According to the ATC, beginning 1st January 1995, all textiles and clothing products that had been hitherto subjected to MFA-quota, are scheduled to be integrated into WTO over a period of ten years. “The dismantling of the quota regime represents both an opportunity as well as a threat. An opportunity because markets will no longer be restricted; a threat because markets will no longer be guaranteed by quotas, and even the domestic market will be open to competition”. From 1st January 2005, therefore, all textile and clothing products would be traded internationally without quota-restrictions. And this impending reality brings the issue of competitiveness to the fore for all firms in the textile and clothing sectors,including those in India. It is imperative to understand the true competitiveness of Indian textile and clothing firms in order to make an assessment of what lies ahead in 2005 and beyond.Owing to its significant contribution, the Indian textile and clothing industry occupies a unique place in the Indian economy. It contributes about 4% of GDP and 14% of industrial output. Second largest employer after agriculture, the industry provides direct employment to 35 million people including substantial segments of weaker sections of society. With a very low import-intensity of about 1.5% only, it is the largest net foreign exchange earner in India, earning almost 35% of foreign exchange. This is the only industry that is self-sufficient and complete in cotton value chain- producing everything from fibres to the highest value added finishedproduct of garments. Its growth and vitality therefore has critical bearings on the Indian economy at large.What Is Competitiveness?Competitiveness is about productivity, which in turn is a function of factors related to cost of products, as well as those related to non-price factors such as delivery schedules, reliability of producers, and such intangible factors like image of the country/company and brand equity. Together, they define the competitive sinews of a product to compete under conditions of free market.However, in order to translate industry competitiveness into sales (greater export share in world market), another set of issues- in addition to productivity-need to be examined. These relate to market access conditions. Indeed, industry competitiveness of restrained exporters such as India was not much of an issue during the last almost four decades, ever since the Short Term Arrangement (STA) of 1961. And the reason lay not in price and non-price factors, but in the“manage”dconditions und er which global trade in textile and clothing products took place. In fact, it was precisely because of the price competitiveness of some Asian exporters in the 1950s and the 1960s that the “generally and solemnly agreed rules of post-war policy conduct-including the keystone of the system, the non-discrimination rules- were formally set aside for reasons regarded as pragmatic”. This system of managed trade, however, will come to an end on 31st December 2004.For the purpose of this study, industry has been defined as a group of firms manufacturing products that directly or indirectly competes with each other. It is implied that no nation can be competitive in manufacturing all goods and services. Hence, industry competitiveness of an entire nation is not quite meaningful. Instead, since it is the firms who compete in international markets, the entire framework of competitiveness would revolve around the study of the firm. “…industrial success was founded on behaviour of firms, not on the decisions of governm ents”. The list of products (industries) identified is in Appendix A.Objective & Scope Of The StudyThe objective of the project is to evaluate the export competitiveness of Indian textile and clothing sectors. Because Indian textile and clothing sector is predominantly cotton based, this study would focus mainly on the cotton textile and apparel, and look at the entire value chain from fibre to garment and retail distribution.With the aforementioned objective in mind, this study has first identified the products in Indian export basket which have shown a promising growth in value, or in unit value and have a considerable weight in the Indian export basket on the basis of recent performance of Indian exports of textile and clothing sectors in the US and EU markets.Research MethodologyIn order to evaluate the demand-side of Indian textile and clothing exports, the study has analysed the competitive performance of Indian exports of the ‘identified’products in the US and EU markets. It has also been used to highlight the role of emerging trade policy environment- specifically, the role of discriminatory rules of origin in Regional Trading Arrangements [RTAs], tariff peaks and environmental and labour standards-as market access issues relevant to textile and clothing exporting countries.To assess the supply-side factors of export competitiveness, a preliminary interview was conducted with a few exporters. The interview sought their views and opinions chiefly in respect of the supply-side bottlenecks that they are facing in India. The supply-side framework is based more on opinions than on data/numbers. The inferences about the supply-side factors are therefore based on the opinions expressed by exporters of identified products.Competitive Performance- Operational DefinitionIn both these markets, competitive performance has been defined through changes in market shares (in value terms) over the years 1995 and 2000. The following twincriterion was employed to identify export-competitive products.A product is said to be export-competitive if the growth rate in unit value of the product imported from India exceeds average growth rate in unit value of the product from all suppliers in a market (US/EU), and Its market share grows over the period 1995-2000.However, there are two additional qualifications that need to be borne in mind.1. To the extent market share is a function of quotas, it may so happen that some countries’ market share declines over time only because their exports are constrained by quotas.2. Because the market share-based competitive performance has been evaluated in value terms, the effect of exchange rate movements on export competitiveness (and revealed in market shares) cannot be ruled out a priory.All value data is reported in US$ terms for the two years 1995 and 2000.During this period, the value of US$ declined by almost 13%, if deflated by consumer price index in the US. The data in the tables have been reported in nominal terms, and analysis made on that basis, since they are all reported in US$ and are equally therefore affected.Using the twin-criteria of export-competitiveness, all selected products are classified into the four categories of leaders, gainers, losers and outliers.译文印度纺织服装行业的出口竞争力资料来源: Indian Council For ResearchOn International Economic Relations作者:Samar Verma自1960年早期,纺织服装行业是国际贸易中关贸总协定最惠国之间经过谈判一致同意的,对关贸总协定正常纪律的例外。
本科毕业论文外文翻译外文题目:Determinants of firm-level export performance: a case study of Indian textile garments and apparel industry出处:J. Int. Trade & Economic Development 10: 1 65-92作者:T. A. Bhavani and Suresh D. Tendulkar译文:企业出口表现的决定因素:印度纺织服装和纺织产业的案例分析任何单一商品出口表现都受这些因素影响:(一)、一国政府进出口的政策制度,(二)、外部需求条件,(三)、在外部市场建立和维护价格质量竞争力的供应反映。
在这一节,我们根据纺织服装和服装行业来讨论这些因素。
1951年之前,在印度占主导地位的为内向型或进口替代战略,同时相关的限制性贸易和工业政策一直存在,产生出口偏见。
这个贸易政策,由对汇率的过高估计和对进口种种限制所构成,使得出口商有效汇率低于进口商,因此使出口受到歧视。
进口限制和工业政策比如容量许可,导致国内生产者从外部和内部竞争中孤立出来,以此对国内市场中现有的生产者进行保护。
所有这此政策的最终影响相对于外部市场是为了加强国内市场销售的盈利能力。
1997年7月的经济政策改革开始涉及货币贬值,逐步减缓了峰值速率,平均速率以及进口关税的扩张,除了一些消费品,取消了进口的数量限制,同时除了一些短期的和明确定义为负面的项目,还取消了工业许可。
此外,政府采用一些比如退税和预先许可的鼓励措施。
这些政策的改变为出口商在国际市场销售中提高盈利能力创造了一个有利环境。
转向外部需求状况,Nueks曾经强调在低收入国家,外部需求对于出口是最有约束力的约束。
这篇论文后来被克拉维斯质疑,他认为欠发达国家的出口不景气首要原因是由于内部的供应限制。
克拉维斯的说法被Panoutsopoulos最近的一个实证检验所证实。
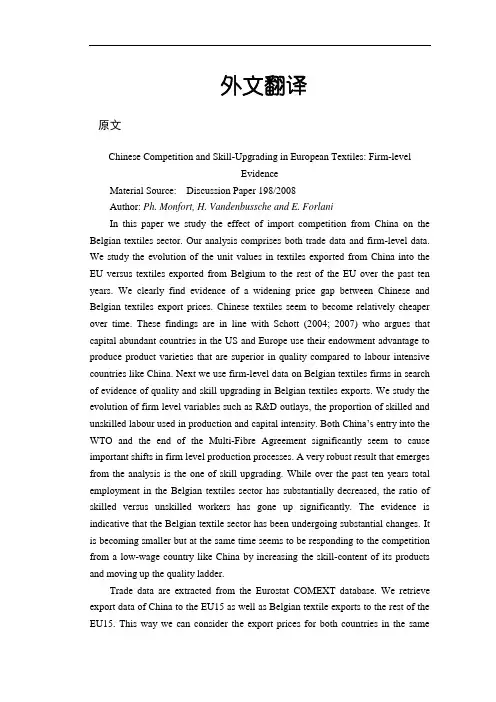
外文翻译原文Chinese Competition and Skill-Upgrading in European Textiles: Firm-levelEvidenceMaterial Source: Discussion Paper 198/2008Author: Ph. Monfort, H. Vandenbussche and E. ForlaniIn this paper we study the effect of import competition from China on the Belgian textiles sector. Our analysis comprises both trade data and firm-level data. We study the evolution of the unit values in textiles exported from China into the EU versus textiles exported from Belgium to the rest of the EU over the past ten years. We clearly find evidence of a widening price gap between Chinese and Belgian textiles export prices. Chinese textiles seem to become relatively cheaper over time. These findings are in line with Schott (2004; 2007) who argues that capital abundant countries in the US and Europe use their endowment advantage to produce product varieties that are superior in quality compared to labour intensive countries like China. Next we use firm-level data on Belgian textiles firms in search of evidence of quality and skill upgrading in Belgian textiles exports. We study the evolution of firm level variables such as R&D outlays, the proportion of skilled and unskilled labour used in production and capital intensity. Both China’s entry into the WTO and the end of the Multi-Fibre Agreement significantly seem to cause important shifts in firm level production processes. A very robust result that emerges from the analysis is the one of skill upgrading. While over the past ten years total employment in the Belgian textiles sector has substantially decreased, the ratio of skilled versus unskilled workers has gone up significantly. The evidence is indicative that the Belgian textile sector has been undergoing substantial changes. It is becoming smaller but at the same time seems to be responding to the competition from a low-wage country like China by increasing the skill-content of its products and moving up the quality ladder.Trade data are extracted from the Eurostat COMEXT database. We retrieve export data of China to the EU15 as well as Belgian textile exports to the rest of the EU15. This way we can consider the export prices for both countries in the sameexport destination market. The products that we consider in the textiles are identified by 4-digit NACE5 sectors 1710, 1720, 1740, 1760, 1771, 1772, 1810, 1822, 1823, 1824, 1830 (a detailed data description is in the Appendix). Firm level data are extracted from the BELFIRST database. This database contains very detailed firm-level information in company accounts format. We identify all Belgian Textile firms operating in the four-digit NACE sectors listed above. This way we obtain more information on the characteristics of the textiles firms’ production process We start by showing the evolution of Belgian and Chinese Textiles prices in the EU15. As indicated above, the main indicator used to assess quality differentials between various countries of the same product group is the price. We use the database on values and volumes of exports to compute the unit value of Belgian (Pb) and Chinese (Pc) textile exports to the EU-15 market6 which can simply be done by dividing values by the quantities7. This further allows us to compute relative prices of Belgian versus Chinese textiles products in the same export market. Figure 2 displays the evolution of the relative prices (Pb/Pc) over the period 1995- 2006 where product groups were aggregated within the textile industry. The relative price in Figure 2 is an average of the unit values in the NACE sectors mentioned above. It is constructed as a weighted mean between each product group’s price8 included in a specific sector where the weights are the values’ share of exports of each product inside its own NACE sector.As mentioned above we obtain data at firm level from BELFIRST database, covering a period of nine year (1998-2006); our data consists of the population of Belgian Textile firms in the sectors mentioned above. More precisely we collect data on operating revenues, tangible fixed asset and labour employment to measure respectively output, capital and labour. We construct also capital-labour ratio in order to assess capital intensity in firms’ production process. To proxy firm effort in product upgrading we have data on intangible fixed assets, which is rough measure of R&D intensity and we have data on skilled and unskilled workers. Skilled workers are those with a higher degree education or University education. Unskilled workers are those workers with only primary or secondary education degree. Additionally our data also contains information on vocational training in terms of number of hours firms spent on training workers. In addition we also have data on value added and raw material expenditures. This allows us to construct measures of productivity such as value added per worker (labour productivity) and total factor productivity (TFP). We measure TFP with a parametric estimation of productionfunction using the methodology by Levinshon-Petrin, where material costs are used as intermediate inputs.From the results below it is clear that China’s entry in the WTO coincided with a loss ofrevenue for Belgian textile firms, a reduction in capital outlays, a reduction in employment and value added. The reduction in value added is likely to indicate an increase in the extent of outsourcing although we do not have a good measure of outsourcing available to us. In terms of labour productivity we do not find a significant change. However, when using a more sophisticate productivity measure like “Total Factor Productivity” Levinsohn and Petrin as in specification 6 yields a positive improvement of productivity but only significant at the 10% level. Furthermore we note from Table 1 an increase in the ratio of skilled over unskilled entrants but a reduction in the amount of workers in on the job training (“Training”) and the amount of hours spent on training workers (“Hours”)10. The increased hiring of more skilled workers already suggests that firms are switching their product portfolio towards different types of products. The reduction in the number of training hours may be related to the already higher skill level of new workers11. Finally we find a reduction in R&D levels after 2001.This is different than we would expect. If strong import competition results in quality upgrading of products we would expect EU firms to spend relatively more on R&D. One possibility is that EU textile firms started to offshore their R&D activities to other countries. The increase in the skill ratio however, implies that the production process that remains in Belgium is becoming more skill intensiveThis paper aims to contribute to a better understanding of how industries in developed countries like the EU respond to global competition forces notably competition from China. We focus on the Textile & Clothing industry for the reason that competition in this sector has been amongst the fiercest. Our analysis involved two steps. In the first step we followed the work by Schott (2007) who for the US found a widening price gap between the US and Chinese price of textiles in the US market, which was, interpreted as an indication of quality upgrading in US textiles. Similarly in this paper we found that on the EU market, the unit values of Belgian exports have generally increased compared to those of Chinese exports. The widening price gap between Belgian and Chinese textiles was already indicative of an upgrading process where Belgian textile firms upgrade their products. However, prices are only a proxy for quality and to exclude alternative interpretations, in a second step of our analysis we go in search of quality upgrading at the firm level.We do this by identifying Belgian textile firms in similar sectors as the Chinese textile exports to the EU and study the evolution of firm characteristics that have a bearing on product quality such as R&D spending, the skill mix capital-intensity. From this first and tentative analysis evidence already suggests that Chinese competition has been significantly accompanied by a change in Belgian textile firms’ production process. First we find that the textile industry has shrunk over time with dis-investment in capital and labour ever since the entry of China into the WTO. In addition we find evidence of higher capital intensity and the use of more skilled labour over time. This evidence seems to be in line with a story where a sector like Textiles in Europe is downsizing and switching products and possibly production technology. Theory would predict that Belgian textiles can only survive by producing textiles with higher factor content than Chinese textiles. The empirical evidence presented in this paper seems to suggest that indeed this is what is going on.译文中国纺织品在欧洲市场竞争力和技术升级:公司层面的证据资料来源: 198/2008研讨论文作者:莫福特,万德柏森,佛莱尼在本文我们学习进口竞争的作用从中国的对比利时纺织品区段。
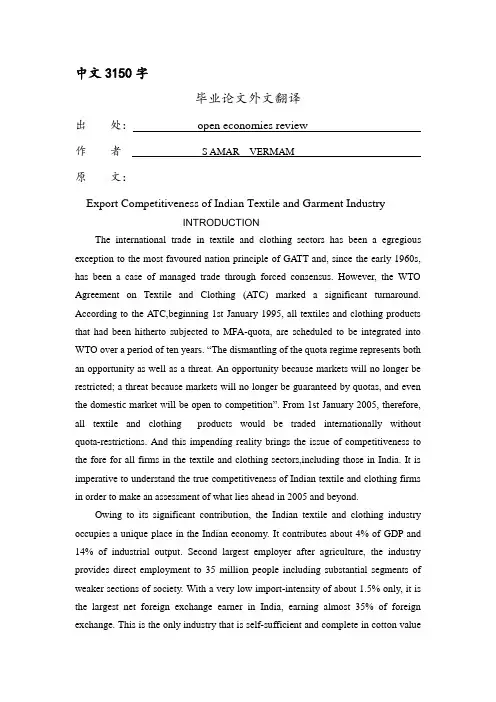
中文3150字毕业论文外文翻译出处:open economies review作者S AMAR VERMAM原文:Export Competitiveness of Indian Textile and Garment IndustryINTRODUCTIONThe international trade in textile and clothing sectors has been a egregious exception to the most favoured nation principle of GATT and, since the early 1960s, has been a case of managed trade through forced consensus. However, the WTO Agreement on Textile and Clothing (ATC) marked a significant turnaround. According to the ATC,beginning 1st January 1995, all textiles and clothing products that had been hitherto subjected to MFA-quota, are scheduled to be integrated into WTO over a period of ten years. “The dismantling of the quota regime represents both an opportunity as well as a threat. An opportunity because markets will no longer be restricted; a threat because markets will no longer be guaranteed by quotas, and even the domestic market will be open to competition”. From 1st January 2005, therefore, all textile and clothing products would be traded internationally without quota-restrictions. And this impending reality brings the issue of competitiveness to the fore for all firms in the textile and clothing sectors,including those in India. It is imperative to understand the true competitiveness of Indian textile and clothing firms in order to make an assessment of what lies ahead in 2005 and beyond.Owing to its significant contribution, the Indian textile and clothing industry occupies a unique place in the Indian economy. It contributes about 4% of GDP and 14% of industrial output. Second largest employer after agriculture, the industry provides direct employment to 35 million people including substantial segments of weaker sections of society. With a very low import-intensity of about 1.5% only, it is the largest net foreign exchange earner in India, earning almost 35% of foreign exchange. This is the only industry that is self-sufficient and complete in cotton valuechain- producing everything from fibres to the highest value added finished product of garments. Its growth and vitality therefore has critical bearings on the Indian economy at large.What Is Competitiveness?Competitiveness is about productivity, which in turn is a function of factors related to cost of products, as well as those related to non-price factors such as delivery schedules, reliability of producers, and such intangible factors like image of the country/company and brand equity. Together, they define the competitive sinews of a product to compete under conditions of free market.However, in order to translate industry competitiveness into sales (greater export share in world market), another set of issues- in addition to productivity- need to be examined. These relate to market access conditions. Indeed, industry competitiveness of restrained exporters such as India was not much of an issue during the last almost four decades, ever since the Short Term Arrangement (STA) of 1961. And the reason lay not in price and non-price factors, but in the …managed‟ conditions under which global trade in textile and clothing products took place. In fact, it was precisely because of the price competitiveness of some Asian exporters in the 1950s and the 1960s that the “generally and solemnly agreed rules of p ost-war policy conduct- including the keystone of the system, the non-discrimination rules- were formally set aside for reasons regarded as pragmatic”. This system of managed trade, however, will come to an end on 31st December 2004.For the purpose of this study, industry has been defined as a group of firms manufacturing products that directly or indirectly competes with each other. It is implied that no nation can be competitive in manufacturing all goods and services. Hence, industry competitiveness of an entire nation is not quite meaningful. Instead, since it is the firms who compete in international markets, the entire framework of competitiveness would revolve around the study of the firm. “…industrial success was founded on behaviour of firms, not o n the decisions of governments”. The list of products (industries) identified is in Appendix A.Objective & Scope Of The StudyThe objective of the project is to evaluate the export competitiveness of Indian textile and clothing sectors. Because Indian textile and clothing sector is predominantly cotton based, this study would focus mainly on the cotton textile and apparel, and look at the entire value chain from fibre to garment and retail distribution.With the aforementioned objective in mind, this study has first identified the products in Indian export basket which have shown a promising growth in value, or in unit value and have a considerable weight in the Indian export basket on the basis of recent performance of Indian exports of textile and clothing sectors in the US and EU markets.Research MethodologyIn order to evaluate the demand-side of Indian textile and clothing exports, the study has analysed the competitive performance of Indian exports of the …identified‟produc ts in the US and EU markets. It has also been used to highlight the role of emerging trade policy environment- specifically, the role of discriminatory rules of origin in Regional Trading Arrangements [RTAs], tariff peaks and environmental and labour standards- as market access issues relevant to textile and clothing exporting countries.To assess the supply-side factors of export competitiveness, a preliminary interview was conducted with a few exporters. The interview sought their views and opinions chiefly in respect of the supply-side bottlenecks that they are facing in India. The supply-side framework is based more on opinions than on data/ numbers. The inferences about the supply-side factors are therefore based on the opinions expressed by exporters of identified products.GLOBAL TRADE IN TEXTILE AND CLOTHING: INDIA’S COMPETITIVEPERFORMANCEDuring the MFA period, the textile exporters from industrial countries and those from developing countries merely changed shares between themselves during the 24 years period. The share of industrial countries declined by almost as much (19.2%) as was the gain in the share of developing countries (18.8%). Clothing exporters.however, exhibit significant changes, with the share of top 13 exporters having declined by 13.8%. New entrants have come in as well as some old ones have been knocked out. Of these new entrants, most- if not all- are from developing countries, since the share of industrial countries has declined during the period, and that of developing countries has increased. The countries that are gaining share in clothing exports are the ones whose industries are integrated to one or the other advanced country through some policy-induced preferential arrangements. Mexico, Caribbean region, East European countries and Mediterranean countries are capturing much of the space vacated. There has been a much deeper globalisation in clothing than in textiles. Indeed, that has been one of the principal reasons for the developed countries agreeing to an eventual phase-out of MFA quota in the UR of negotiations.During the MFA period, (between 1973 to 1997, to be precise), while in textiles, there was an inexorable shift away from developed countries and to developing countries at large, in clothing the shift away from developed countries is increasingly being grabbed by …preferred‟ developing countries.Thus, in clothing, the non-preferred group of developing countries is fighting amongst themselves for a pie that is increasingly declining. One should expect a much higher level of intra-industry and intra-firm trade in clothing than in textiles. This is entirely compatible with the fact that it is the trade in clothing that is growing faster than that in textiles. And this trend is likely to deepen, as clothing retailers consolidate, and Outward Processing Trade (OPT) traffic increases. The opportunity clearly lies much more in clothing, though the caveat is that the exporting country would have to achieve the …preferred‟ status, and integrate its manufacturing with that of an importing country in order to continue exporting to the restricted markets. The pressure to export would intensify in the years to come since 80% of additional output during 1995-2005 is expected to be located indeveloping countries. On the other hand, only 50% of the additional fibre consumption would originate in developing countries.India’s Competitive Performance in the US1.Of the eight cotton apparels, India‟s market share (in 2000) in US import market exceeded 10% in cotton dresses (336), W&G woven shirts (341), and cotton skirts (342). Market share grew in 336 and 341.In 336, India exported higher quantity at reduced prices, while in 341, India moved up the value chain. But the US import market grew strongly in 341 and 342, and not as much in 336. However, in 341, the size of quota is close to the size of US home market, whereas in 336, about 43% of US home market would be opened only on 1st January 2005. Therefore, not much growth should be expected in 341 in terms of US market size. Besides, there are no current threats from …preferred‟ developing countries in 341 yet. Hence this is one category where India should very clearly focus, since the competitor countries are essentially Asian. The one big threat, would be China. Currently, China exports at an appreciably higher uvr compared to India. The evidence from 1995-2000 indicate that China has upgraded its 341 faster than India has. If China continues on that path, India may not worry too much, since the gap between Indian and Chinese prices would be quite significant. But then, if India also upgrades its product, as it has done in 341, competitiveness based only on price will be extremely risky.2.In descending order of uvr, Indian exports of the chosen cotton apparels belong to between 40 and 50 percentile, among all supplier countries for a given MFA product category. Which means India operates in the low value segment in most cotton apparels in the US. However, it is interesting to note that there are three cotton apparels whose uvr have been between percentiles 55 and 60. They are knit shirts (cat 338) and trousers for M&B (cat 347) and for W&G (cat 348). Incidentally, US imports of these products is growing fastest among all cotton apparel categories. However, India has lost market share in all except 347 during 1995-2000. In 347, its unit prices have grown fastest among top ten suppliers. And almost 70% of US market remain to become quota-free only on 1st January 2005. India must build up itsstrength in this product category quickly to capture the huge market that would suddenly open in 2005. Quite apart from …preferred‟ group of developing countries, Pakistan is one country which has done exceedingly well in 347, and has been building its domestic manufacturing facilities very fast. But Pakistan is not yet as much of a threat since its unit value is considerably lower than India. China, however, is likely to emerge as a big threat to India in 347 since their uvr is closer to India‟s and they too are upgrading their product rapidly. Their market share declined due wholly to quota constraint. But they seem to be producing less numbers, and better quality of 347 for US export market. They would pose a big challenge to India.3.In cotton apparels, the competitor countries- aside from …preferred‟ developing countries- are Indonesia, Malaysia, Hong Kong, Philippines, Indonesia, Sri Lanka and Bangladesh. From among these, Bangladesh is the lowest cost supplier in almost all categories. In view of the threat from …preferred‟ developing countries, India must move away from competing only on the basis of price, since the share of this segment is any case declining with the …preferred‟ countries growing rapidly in this segment. And when India upgrades its value, it would have to contend with strong Asian competitors like Hong Kong, China and South Korea, whose performance has been constrained due to quota ceilings. But once the quotas are removed, India may find itself again losing in this upgraded market segment due to sheer size of these countries‟exports. The important lesson for India therefore is that it must not only upgrade its values, but also begin to find ways of competing increasingly on non-price factors.译文印度服装纺织行业的出口竞争力一、简介20世纪60年代初以来,纺织和服装部门的国际贸易一直是在关贸总协定和最惠国待遇原则之外的,一直都是通过强迫达成的共识。
中国纺织品产业出口竞争力研究中国作为全球最大的纺织品生产国和出口国,其纺织品产业的发展对全球纺织品市场有着重要的影响。
本文将对中国纺织品产业出口竞争力进行深入研究,旨在了解其发展现状、分析竞争力优势和挑战,并探讨未来发展前景。
中国纺织品产业的发展可以追溯到上世纪改革开放时期,经过几十年的快速发展,已经形成了从原材料采购到加工制造、品牌运营、国际贸易等完整的产业链。
随着科技水平的提高和国际化进程的加快,中国纺织品产业面临着国际市场竞争的巨大压力,因此,提高其出口竞争力显得尤为重要。
中国纺织品产业出口竞争力主要体现在以下几个方面:生产成本:中国纺织品产业拥有大规模的劳动力资源,这使得中国的纺织品生产成本相对较低。
随着产业技术的不断提高,中国纺织品生产效率也得到了大幅提升,进一步提高了产品竞争力。
产品质量:近年来,中国纺织品产业在产品质量方面得到了显著提升。
企业不断引进先进的生产技术和设备,加强原材料的品质控制,使得产品质量达到了国际先进水平。
价格优势:中国纺织品不仅在质量上具有竞争力,价格上也具有较大优势。
由于中国纺织品产业拥有完善的产业链和大规模的生产能力,使得其能够在国际市场中以较低的价格提供优质的产品。
市场前景:随着全球消费者对纺织品的需求不断增长,中国纺织品产业面临着广阔的市场前景。
特别是在一带一路政策的推动下,中国纺织品在亚洲、欧洲和非洲等地区的市场份额将持续扩大。
然而,中国纺织品产业出口也面临着一些贸易壁垒,主要包括以下几个方面:贸易政策:一些发达国家对中国纺织品出口实施了贸易保护主义政策,如关税壁垒、反倾销等,这些政策对中国纺织品出口造成了一定的限制。
配额:一些国家对中国纺织品出口实施了配额限制,导致中国纺织品在某些市场的出口量受到影响。
质量标准:一些国家对中国纺织品的质量标准提出了高要求,这使得中国纺织品需要不断提高产品质量以符合国际标准。
尽管面临上述贸易壁垒,中国纺织品产业仍有很大的提升空间。
印度纺织服装行业的出口竞争力外文翻译外文翻译原文EXPORT COMPETITIVENESS OF INDIAN TEXTILEAND GARMENT INDUSTRYMaterial Source: Indian Council For ResearchOn International Economic RelationsAuthor:Samar VermaThe international trade in textile and clothing sectors has been a egregious exception to the most favoured nation principle of GATT and, since the early 1960s, has been a case of managed trade through forced consensus. However, the WTO Agreement on Textile and Clothing ATC marked a significant turnaround. According to the ATC, beginning 1st January 1995, all textiles and clothing products that had been hitherto subjected to MFA-quota, are scheduled to be integrated into WTO over a period of ten years. “The dismantling of the quota regi me represents both an opportunity as well as a threat. An opportunity because markets will no longer be restricted; a threat because markets will no longer be guaranteed by quotas, and even the domestic market will be open to competition”. From 1st January2005, therefore, all textile and clothing products would be traded internationally without quota-restrictions. Andthis impending reality brings the issue of competitiveness to the fore for all firms in the textile and clothing sectors,including those in India. It is imperative to understand the true competitiveness of Indian textile and clothing firms in order to make an assessment of what lies ahead in 2005 and beyond.Owing to its significant contribution, the Indian textile and clothing industry occupies a unique place in the Indian economy. It contributes about 4% of GDP and 14% of industrial output. Second largest employer after agriculture, the industry provides direct employment to 35 million people including substantial segments of weaker sections of society. With a very low import-intensity of about 1.5% only, it is the largest net foreign exchange earner in India, earning almost 35% of foreign exchange. This is the only industry that is self-sufficient and complete in cotton value chain- producing everything from fibres to the highest value added finished product of garments. Its growth and vitality therefore has critical bearings on the Indian economy at large.What Is Competitiveness?Competitiveness is about productivity, which in turn is a function of factors related to cost of products, as well as those related to non-price factors such as delivery schedules, reliability of producers, and such intangible factors like image of the country/company and brand equity. Together, they define the competitive sinews of a product tocompete under conditions of free market.However, in order to translate industry competitiveness into sales greater export share in world market, another set of issues- in addition to productivity-need to be examined. These relate to market access conditions. Indeed, industry competitiveness of restrained exporters such as India was not much of an issue during the last almost four decades, ever since the Short Term Arrangement STA of 1961. And the reason lay not in price and non-price factors, but in the“manage”dconditions under which global trade in textile and clothing products took place. In fact, it was precisely because of the price competitiveness of some Asian exporters in the 1950s and the 1960s that the “generally and solemnly agreed rules of post-war policy conduct-including the keystone of the system, the non-discrimination rules- were formally set aside for reasons regarded as pragmatic”. This system of managed trade, however, will come to an end on 31st December 2004.For the purpose of this study, industry has been defined as a group of firms manufacturing products that directly or indirectly competes with each other. It is implied that no nation can be competitive in manufacturing all goods and services. Hence, industry competitiveness of an entire nation is not quite meaningful. Instead, since it is the firms who compete in international markets, the entire framework of competitiveness would revolve around the study of the firm.“…industrial succe ss was founded on behaviour of firms, not on the decisions of governments”. The list of products industries identified is in Appendix A.Objective & Scope Of The StudyThe objective of the project is to evaluate the export competitiveness of Indian textile and clothing sectors. Because Indian textile and clothing sector is predominantly cotton based, this study would focus mainly on the cotton textile and apparel, and look at the entire value chain from fibre to garment and retail distribution.With the aforementioned objective in mind, this study has first identified the products in Indian export basket which have shown a promising growth in value, or in unit value and have a considerable weight in the Indian export basket on the basis of recent performance of Indian exports of textile and clothing sectors in the US and EU markets.Research MethodologyIn order to evaluate the demand-side of Indian textile and clothing exports, the study has analysed the competitive performance of Indian expor ts of the ‘identified’products in the US and EU markets. It has also been used to highlight the role of emerging trade policy environment- specifically, the role of discriminatory rules of origin in Regional Trading Arrangements [RTAs], tariff peaks and environmental and labour standards-as market access issues relevant to textile and clothingexporting countries.To assess the supply-side factors of export competitiveness, a preliminary interview was conducted with a few exporters. The interview sought their views and opinions chiefly in respect of the supply-side bottlenecks that they are facing in India. The supply-side framework is based more on opinions than on data/numbers. The inferences about the supply-side factors are therefore based on the opinions expressed by exporters of identified products.Competitive Performance- Operational DefinitionIn both these markets, competitive performance has been defined through changes in market shares in value terms over the years 1995 and 2000. The following twincriterion was employed to identify export-competitive products.A product is said to be export-competitive if the growth rate in unit value of the product imported from India exceeds average growth rate in unit value of the product from all suppliers in a market US/EU, and Its market share grows over the period 1995-2000.However, there are two additional qualifications that need to be borne in mind.1. To the extent market share is a function of quotas, it may so happen that some countri es’ market share declines over time only because their exports are constrained by quotas.2. Because the market share-based competitive performance has been evaluated in value terms, the effect of exchange rate movements on export competitiveness and revealed in market shares cannot be ruled out a priory.All value data is reported in US$ terms for the two years 1995 and 2000. During this period, the value of US$ declined by almost 13%, if deflated by consumer price index in the US. The data in the tables have been reported in nominal terms, and analysis made on that basis, since they are all reported in US$ and are equally therefore affected.Using the twin-criteria of export-competitiveness, all selected products are classified into the four categories of leaders, gainers, losers and outliers.译文印度纺织服装行业的出口竞争力资料来源: Indian Council For ResearchOn International Economic Relations作者:Samar Verma自1960年早期,纺织服装行业是国际贸易中关贸总协定最惠国之间经过谈判一致同意的,对关贸总协定正常纪律的例外。
文献出处:Fetscherin M, Alon I, Johnson J P. Assessing the export competitiveness of Chinese industries[J]. Asian Business & Management, 2010, 9(3): 401-424.原文Assessing the export competitiveness of Chinese industriesMarc; Ilan; JohnsonIntroductionCompetitiveness has been assessed and studied at various levels: country (Jones, 1994; Murtha and Lenway, 1994; Enright et al , 1999), region (Uysal et al , 2000), industry (Roth and Morrison, 1992; Mitchell et al, 1993; Contractor et al, 2005; Fetscherin and Alon, 2007) and network/group (Peng et al, 2001). Country-level assessments are provided in The Global Competitiveness Report(World Economic Forum, 2008), the World Competitiveness Yearbook(Institute for Management Development, 2008) and elsewhere (Eckhard, 2006), but are often too general to be applied to a single country (Krugman, 1994). In contrast, individual company cases and studies are too specific and may not be applicable to an entire industry or to all industries from a single country (Peng et al , 2001). Analyzing competitiveness at the industry level, however, provides greater detail and a better understanding of the competitive dynamics of an industry than the country or company level, for several reasons: (i) examining the degree of specialization for a given industry can identify the comparative (dis)advantage of a national industry; (ii) industry-specific analysis permits international comparisons of an industry's degree of specialization and rate of growth; and (iii) an industry-level analysis permits comparisons with other industries.One dimension of industry competitiveness is export competitiveness. A key indicator of the extent of export competitiveness of an industry is the degree of its participation in international trade. According to data published by the World Trade Organization (WTO, 2007), the volume of world merchandise trade in 2006 grew by 8 per cent to about US$11.8 trillion, compared to world gross domestic product growth ofjust 3.5 per cent. In the past two decades, world trade has grown much faster than world GDP, suggesting that the international economy is a source of dynamism and opportunity.The theory of comparative advantage (Smith, 1776; Ricardo, 1871; Ohlin, 1933; Heckscher, 1949) underscores the importance of specialization and trade in enhancing productivity and consumer well-being. Smith (1776) argued that, under free unregulated trade, each nation should specialize in the production of the goods that it can make most efficiently, and import those goods in which it has a comparative disadvantage. In order to sustain export competitiveness in an industry, companies operating within that industry must understand the concept of revealed comparative advantage, because it allows them to understand and benchmark their position within an industry in terms of, for example, specialization, growth rate and export market share. How to model the export competitiveness of an industry has hitherto remained unresolved, however, particularly when comparing across industries within one country. The purpose of this article is to present a framework that measures, illustrates and compares the export competitiveness of an industry compared to other industries from the same country. Although this framework can also be applied to compare a single industry across various countries, cross-country comparison is not the focus of this article.China‟s globalization has been one of the most dramatic economic evelopments of recent decades (Alon and McIntyre, 2008). During the period 1979–2005, China‟s annual growth rate averaged 9.6 per cent, and its integration into the world trading system has been remarkable. Its share in world merchandise trade increased from less than 1 per cent in 1979 to 7.4 per cent in 2005. In the same year, China became the third largest trading nation after the United States and Germany (Greene et al, 2006). The expansion of China‟s international trade has been the key to its rising prominence in the world economy, and China‟s economy has a strong potential to becom e the world‟s top exporter by the beginning of the next decade (Greene et al, 2006). Currentstudies investigating and assessing Chinese export competitiveness can be grouped into two main research streams. One stream focuses on the relationship between FDI and China‟s trade performance (for example Liu et al, 2001; Khun and Xing, 2007; Xing, 2007). This is an important topic, and most of these studies use the country as the unit of analysis, although some studies use China‟s provinces. The other stream focuses on the export performance of industries (for example Greene et al, 2006; Van Assche et al, 2008). As the unit of analysis of this study is the industry, its contribution is to the second stream of research.Greene et al (2006) provide an overview of C hina‟s trade policy environment and examine China‟s impact on world prices and the deterioration of its own terms of trade. The study by Van Assche et al (2008) focused on export market share only and concluded that China continues to have a comparative advantage in low-technology activities and a comparative disadvantage in high-technology activities. Our study contributes to this literature by providing a multi-dimensional framework that allows us to measure, identify and compare which Chinese industries have a comparative advantage/disadvantage, which are growing faster or slower than the world average, and their relative importance in international trade.Measuring export competitivenessThe industry is the location where firms win or lose market share and it is the industry level that permits an examination of the dynamic nature of industrial evolution and reformation in the global business environment (Passemard and Kleiner, 2000). In the academic literature, there is still a general paucity of research on industry export competitiveness, with previous studies consisting mostly of examinations of a single domestic industry and the use of subjective measures (Makhija et al , 1997). Multiple measures have been suggested: Mandeng (1991) examined the size or increase of export market share, while others have used export competitiveness (for example Balassa, 1965; Balassa and Bauwens, 1987), price ratios (for example Durand and Giorno, 1987) and cost competitiveness (for example Siggel and Cockburn, 1995). Our conceptualization of export competitiveness attempts to combine appropriate elementsfrom previous studies and follows the recommendation of Buckley et al (1992) and Porter (1990) for the use of multiple indicators. Specifically, the framework that we present here contributes to existing literature as it not only uses multi-dimensional measures, but also allows an examination of industry export competitiveness using either an intra- or inter-country analysis. The use of multiple dimensions is superior to the use of single measures as it puts into better perspective an industry's export competitiveness (Balassa Index), dynamism (growth rate) and importance (export market share) in comparison with other industries. For example, an industry that is highly specialized but not important in terms of export market share can be compared with one that might be less specialized but has a larger world export market share. Having only one dimension might lead to a wrong assessment and conclusion. The proposed framework tries to address some of those issues.Industry specialization (IS )The concept of comparative advantage has been widely accepted as one of the foundations for international trade. A country has a pattern of specialization that is determined by what goods it exports and the volume of each good it exports, both of which change over time (Vernon, 1966; Hoskisson and Yiu, 2003; Kelleher, 2003). Krugman (1994) argues that international trade is not a zero-sum game and that the rise or fall of particular industries and nations reflects changing factor endowments and the need to shift to new areas of competitive advantage. When a nation enjoys a comparative advantage in a particular industry, it is natural that firms make investments in order to profit from this advantage, resulting in a relatively high degree of specialization within that industry (Dunning, 1993). A commonly used measure of industry specialization, based on export data, is revealed comparative advantage, often referred to as the Balassa Index ( BI ) (Balassa, 1965). Richardson and Zhang (1999) used the Balassa Index for the United States to analyze variations in patterns of trade across time, sectors and regions. They found that patterns differed by region and over time and also for different levels of aggregation of the export data.Industry growth (IG )Studies of industry competitiveness have tended to take a static rather than dynamic or longitudinal perspective, and have provided little insight into globalization trends. As we want to assess the past, present and future export competitiveness of Chinese industries, an assessment of industry trends can shed light on the manner in which Chinese industry as a whole is globalizing and at what pace (Makhija et al, 1997). Our framework includes industry export growth because, over time, a country may start to specialize more in some industries and less in others, thus changing its pattern of specialization. This also highlights the difference between dynamic and static industries. Some studies (for example Hinloopen and van Marrewijk, 2001; Alessandrini et al, 2007) measure this change of pattern of specialization by using Shorrocks‟ (1978) mobility index. However, the mobility index does not provide sufficiently detailed information, as it just ranks industries or sectors of a country according to export volume, groups them into quintiles and calculates the net change between quintiles; industries that do not have a net change between quintiles are considered to be static rather than dynamic. Other studies (for example Baldwin and Gu, 2004; Amador et al, 2006; Cooper, 2006) have used a simpler but perhaps more precise measure of changes in specialization by calculating the compound annual growth rate (CAGR) of exports in certain sectors over a certain period of time. It can be assumed that export growth in a given industry and country, particularly growth that is higher than the average global industry growth, implies a greater degree of globalization for that industry. However, this measure suffers from the weakness that domestic production and consumption, which are important for competitiveness, are omitted. Nevertheless, given the focus of our framework on export competitiveness, this weakness is not significant. Therefore, we use CAGR as a measure of growth in exports.Methodology and data collectionWe used data from the UNCTAD and the WTO for the years 2001-2005. The 5-year time period in our data allows for an analysis of changing global dynamics, especially important in the case of China. During the period of our investigation, Chinaundertook many market reforms and joined the WTO in 2001, events which changed the competitive position of its industries.We first provide a brief overview of the overall pattern of international trade for China compared to other Asian countries. Then, for the 97 Chinese industries, we calculate the degree of industry specialization and the industry growth rate in terms of exports over the selected period of time. Finally, we apply our framework to assess the degree of export competitiveness of the various industries in China.ResultsInternational trade comparisonTable 1 provides an overview of the total export value in US dollars for various countries from Asia for the years 2001-2005 as well as the corresponding CAGR.Overall, during the period 2001–2005, all countries in Table 1 registered a positive CAGR in terms of exports, ranging from 10 per cent in the case of Japan to 30 per cent in case of China (with India the next highest, with 4 per cent). In absolute terms, the highest value of exports for the main Asian countries in 2005 was recorded by China with US$762 billion, followed by Japan with US$595 billion and Hong-Kong (SAR) and South Korea with US$292 billion and US$284 billion, respectively. In the same year, India had only US$103 billion worth of exports, positioning it as a relatively weak exporting country.It also shows that countries from Asia, and specifically China, continue to gain importance in the global market as, for most of these countries, the average growth rate of exported products is higher than the average global export growth rate of 14 per cent between 2001 and 2005. The main product groups exported by China were 'Electrical, electronic equipment' (US$172.3 billion); 'Boilers, machinery, nuclear reactors' (US$149.6 billion); 'Articles of apparel, accessories not knit or crochet' (US$35 billion); 'Articles of apparel, knit and crochet' (US$30.8 billion) and 'Optical, photo, technical, medical apparatus' (US$25.4 billion).However, understanding international trade data in terms of absolute and relativevalues at the country level is necessary (Table 1), it is insufficient for assessing the export competitiveness of industries because it lacks specificity and comparative data at the industry level across multiple indicators. Our proposed framework will take these factors into account and this will be discussed in the next section.Industry export competitivenessWe calculated values for the three key variables for each of the 97 Chinese industries. Figure 2 - See PDF, provides an overview of the different industries from China and their degree of export competitiveness in terms of industry specialization, growth and size. The reference point for the Balassa Index (horizontal axis) was a threshold value of 1 (which, as mentioned before, has been used in previous studies); while for industry growth (vertical axis), the reference point was the world average export growth of 14 per cent for the period 2001-2005.One interesting result is that the majority of Chinese industries (73 per cent) are categorized as …dynamic‟, either domestic (39 per cent) or global (34 percent), both having a higher than average export growth rate (30 and 28 percent, respectively) compared to the world average of 14 per cent. For the period of the investigation, most Chinese industries grew faster than their world counterparts, not surprisingly, given the higher relative GDP growth of China in general.In China, the 'global static' category consists of light manufacturing, such as travel goods, clocks, umbrellas, textiles and commodities such as wool, silk, bird skin, and salt, earth and stone. China has established a specialization in international markets for these types of products, thus exhibiting a high Balassa Index, but the growth rate of these industries lags behind the world average.Conclusions and Future ResearchThe purpose of this study was to present a novel framework that allows us to measure, illustrate and compare the export competitiveness of industries. The framework is innovative as it takes into account multiple measures: (i) the degree of industry specialization, (ii) the industry export growth rate and (iii) the export marketshare. Using these variables, this model provides a basis for intra-country comparisons of industries of various competitive postures. It could also be used for inter-country comparisons of one industry among countries (not shown in this article). The use of multiple variables in the framework provides more meaningful information than the single variable analyses which previous studies have generally used (for example Van Assche et al, 2008). The use of multiple measures, such as specialization, growth rate and export market share of an industry, allows us to put into perspective the competitiveness, dynamism and importance of one industry compared to others. Our framework also allows for a comparative analysis of sub-industries or product groups depending on the data set usedThe proposed framework has been applied to China, a leading emerging economy and one of the largest trading nations in the world. Most of China‟s industries (73 per cent) are dynamic, showing above-average export growth rates. Many reasons account for this rapid growth, including market liberalization, falling trade barriers and a favorable exchange rate. Our results show that most Chinese industries have increased their specialization over time, which is in line with various OECD studies (for example Greene et al, 2006). However, our study further reveals t hat less than half of these …dynamic‟ industries are globally competitive, according to the Balassa Index. China therefore still has a long way to go in fortifying its position as a leader in world exports across a spectrum of various industries.Two important relationships are confirmed by our study. First, there is a positive and significant correlation between degree of specialization and relative market share, and, secondly, there is no significant correlation between degree of specialization and export growth rate. In other words, industry specialization may affect the relative market share of Chinese exports, but not their rate of growth. Overall, 46 per cent of Chinese industries are categorized as …global‟ in our framework, with a world export market share of between 19 and 24 percent. This finding indicates that these industries are not only strong global players, but are also influencing the international competitive landscape. Over 70 per cent of those industries are also …dynamic‟, withexports growing on average at about 28 per cent annually, compared to the remaining 30 per cent, which are …static‟ and growing at 11 per cent on average over the period 2001–2005. This result further suggests that the more an industry is specialized, the higher its world market share in terms of exports.译文中国产业的出口竞争力评估马克;伊兰;约翰逊引言专家学者们对竞争力已经进行了多方面的研究:有国家层次的竞争力评估(琼斯,1994;恩莱特等,1999),有地区层次竞争力的评估(索尔等,2000)、也有对行业竞争力的评估(罗斯和莫里森,1992;米切尔等,1993;菲斯坦因和艾伦,2007)等。
外文翻译译文标题:中国纺织服装产业与全球市场的五种竞争力量资料来源:山姆先进管理杂志作者:杰克麦卡恩本研究分析了中国的服装产业凭借波特的竞争框架,不仅能够对竞争环境提供有见解的建议,也会在全球经济中影响整个产业的战略和竞争地位。
在探讨理论框架之后,该框架应用于中国服装产业。
之后,对最具竞争力的主要服装出口国家进行了比较。
竞争战略,国家战略和竞争环境关系着中国政府的政策对于纺织服装工业的步伐。
根据仇(2005),该产业从开放政策和经济改革开始后,对于国家的出口来说已成为一种驱动力。
纺织服装行业在中国是以市场为导向,最大的竞争对手是最接近的市场和客户。
作为一个国家经济的支柱产业,劳动密集型产业在世界市场上具有比较大的优势。
在过去几年美国和欧洲联盟(欧盟)的贸易配额中,从预期推动到逐步消除,始终没有实现中国纺织服装产业。
在2009年里,虽然中国的纺织服装产业在市场份额上没有显著高于美国和欧盟等其他国家,但中国的全球市场份额在从2001年的38.8%上升至了2005年的47.1%,但从那年以后就再也没有显著提高了。
事实上,在美国和欧盟,中国的市场份额从2006年的71.3%下降至2008年的66.8%。
中国的市场份额在美国服装进口市场转入,由2003年的19.9%上升到了一个预期的35.9%,并在2009年欧盟的进口市场由2001年的21.8%上升到了2008年的42.8%。
全球的市场份额竞争在新兴国家之中都有所增加,走低价格,低成本路线的国家在2009年受益。
根据赛巴斯丁(2009)及中国贸易的两个特点显示,元素丰富是其出口实绩的解释。
在全球市场上,劳动密集型产品的高渗透一直伴随着大份额出口(企业),外商的投资高渗透在劳动密集型的行业。
中国在劳动密集型产品的自然优势是提高生产率的增长,资本积累、迁移、鼓励外商投资和扭曲在金融市场上的利率。
自中国实行改革政策和对外开放以来,纺织工业一直在迅速地增长。
它从一个初级工业转变成为一个成熟的工业,并建立了一个由棉、毛、麻、丝、化纤、服装、纺织机械行业组合而成的垂直整合的工业体系。
文献综述浙江纺织业出口竞争力研究随着经济全球化和经济一体化的发展,市场竞争也越来越激烈,呈现出非常突出的特征——国际化趋势,行业面临的环境更为严峻。
世界产业结构在全球范围内调整和升级,正呈现出新的特征,而出口竞争力已构成了产业发展的主旋律。
我们必须根据国际市场的发展变化调整浙江纺织业国际竞争战略,因地制宜发挥好浙江纺织业的出口竞争优势。
在此背景下,我们尝试对该领域内主要贡献者的观点进行归纳,并梳理其理论逻辑。
本文对文献的综述分为四个部分。
第一部分是关于国际竞争力国内国外学者的定义研究。
第二部分介绍了国内国外学者对产业国际竞争力研究现状评述。
第三部分是对纺织行业的出口竞争力进行评价的研究。
第四部分是专门针对浙江纺织产业国际竞争力的研究。
1 国际竞争力的定义研究早提出国际竞争力命题的B·巴拉萨(Bela Balassa,1964)认为:“如果作为价格变动或其它因素的结果,一个国家在国际和国内市场上的销售能力得到提高或降低,我们就可以说这个国家更加具备或更加缺乏国际竞争力”(吴健伟,1999)。
Mar kusen(1992)将国际竞争力定义为在一个国家通过贸易使实际收入的增长高于其贸易伙伴,则说明其有竞争力。
Cohen和Zyman(1989)年认为,国际经济竞争实质上是企业之间的竞争,国际竞争力最核心的是企业的国际竞争力,而一个企业有竞争力是指这个企业能够在建立和保持市场地位的同时获得利润的能力。
樊纲(1998)指出,狭义地说,竞争力指的是一国商品在国际市场上所处的地位,所以竞争力的概念最终可以理解为“成本”概念。
就基本内容而言,竞争力的概念既不复杂也不特别,它所涉及的不过是经济学的最基本内容。
但竞争力的特殊性在于,它是一个涉及到国与国之间经济关系的国际经济学概念,因为它除了技术和制度(包括“管理”)这两个经济学的基本要素外,还包含了“比较优势”的概念。
金碚(1997)认为,所谓国际竞争力是“在国际间自由贸易条件下(或在排除了贸易壁垒因素的假设条件下),一国某特定企业的产品所具有的开拓市场、占据市场并以此获得利润的能力。
我国纺织与服装行业分析(英文版)Analysis of China's Textile and Apparel Industry Introduction:The textile and apparel industry is one of the key sectors in the Chinese economy and plays a significant role in global supply chains. China has been the world's largest textile and apparel exporter for decades, with a competitive advantage in terms of low labor costs, vast production capacity, and strong manufacturing capabilities. In this analysis, we will delve into the growth, challenges, and future prospects of China's textile and apparel industry.Growth:China's textile and apparel industry has experienced remarkable growth over the past few decades. The industry has benefited from favorable government policies, increased investment in infrastructure, and a robust domestic market. With an abundance of cheap labor and a skilled workforce, China has been able to maintain a competitive edge in the global market.China's textile and apparel exports have surged over the years, driven by the demand from developed countries for cost-effective production. The industry has integrated with global supply chains, with Chinese manufacturers supplying raw materials, fabrics, and finished goods to multinational companies. The country's textile and apparel exports reached a peak of $221 billion in 2019, accounting for over 35% of the global market share.Challenges:Despite its impressive growth, China's textile and apparel industry faces several challenges. Firstly, rising labor costs have eroded its cost advantage, making it less competitive compared to emerging economies such as Vietnam and Bangladesh. This has prompted many manufacturers to relocate their production facilities to these countries, leading to a decline in China's market share.Secondly, environmental concerns have become a significant issue for the industry. China's textile and apparel production is associated with high levels of pollution, primarily due to the release of toxic chemicals during the dyeing and finishing processes. The government has implemented stricter environmental regulations, forcing many small and outdated factories to shut down. The industry must adopt sustainable practices to comply with these regulations and reduce its environmental impact.Future Prospects:Despite the challenges, China's textile and apparel industry still holds significant potential. The country has made efforts to upgrade its manufacturing capabilities and enhance product quality. By focusing on advanced manufacturing technologies such as automation and 3D printing, Chinese manufacturers can increase efficiency and reduce production costs. This will help regain some of the lost market share and remain competitive in the global market.Moreover, China's domestic market offers considerable growth opportunities. With a rising middle class and increasing disposable incomes, the demand for high-quality textiles and fashionable clothing is expected to surge. The industry can tap into this potential by shifting its focus from low-cost, mass-produced garments to more customized and value-added products.Furthermore, the Belt and Road Initiative (BRI) provides a unique opportunity for China's textile and apparel industry to expand its reach. The BRI aims to enhance connectivity and trade between China and countries in Asia, Africa, and Europe. By investing in infrastructure development and establishing trade partnerships, Chinese manufacturers can access new markets and diversify their customer base.Conclusion:China's textile and apparel industry has played an instrumental role in the country's economic growth and global trade. While facing challenges such as rising labor costs and environmental concerns, the industry has the potential to overcome these obstacles and continue to thrive. By embracing advanced manufacturing technologies, adopting sustainable practices, and leveraging domestic and international market opportunities, China's textileand apparel industry can remain a dominant force in the global market.继续写相关内容:政府支持和政策:中国政府一直以来对纺织服装行业给予了大力支持和积极政策,推动了行业的快速增长。
中国产品出口竞争力外文翻译文献(文档含英文原文和中文翻译)China’s Competitive Performance: A Threat To East Asian Manufactured Exports?There is growing concern in Southeast and East Asia about the competitive threat posed by China’s burgeoning exports, exacerbated by its accession to the WTO. The threat is not confined to labor-intensive products but spans the whole technological and skill range. At the same time, China is rapidly raising its imports from the region, and it is not clear whether its burgeoning exports will damag e its neighbors. We examine the dimensions of China’s competitive threat in the 1990s, benchmarking competitive performance by technology and market, and finds that market share losses are so far mainly in low technology products, with Japan being the most vulnerable market. We analyze market share changes and highlight product groups that are directly or indirectly exposed to a competitive threat. We examine intra-regional trade and find that China and its neighbors are raising high technology exports in tandem: the nature of theinternational production systems involved lead to complementarily rather than confrontation. China is thus acting as an engine of export growth for its neighbors in terms of direct trade. However, this will change as China moves up the value chain and takes on the activities that have driven East Asian export growth.IntroductionConcern about China’s competitive threat is widespread (in developed economies like US as well as developing ones like Mexico), but is strongest in East an d Southeast Asia. China’s burgeoning exports–backed by cheap and productive labor, a large stock of technical manpower, huge and diversified industrial sector, attractiveness to foreign investors, pragmatic use of industrial policy, and, now, freer access to world markets under WTO – lead to apocalyptic visions of export losses.2 China is most threatening to neighbors that rely primarily on low wages for their export advantage. However, as it upgrades its export structure, the more advanced economies (Singapore, Hong Kong, Korea and Taiwan) also fear for their competitiveness. The current hollowing out of their low-end manufacturing may soon extend to complex production, design, development and related services. Domestic markets are also threatened by China, but so far most attention seems to have been on exports.Offsetting this threat are the promise of the giant Chinese market (WTO accession is only one of several initiatives to liberalize regional trade) and the potential for collaboration with it in exporting to the rest of the world. Trade within the East Asian region is flourishing. China is a growing importer from the region of natural resources that it does not possess. It is also raisin g imports of manufactured products. Its advanced neighbors are selling it sophisticated consumer and producer goods, and using it as a base for processing exports to third countries. The multinational companies (MNCs) that now account for around half of Chinese exports (and far more of its high technology exports, UNCTAD,2002) are incorporating China into production systems spanning the region (‘fragmentation’ and‘segmentation’ are used to describe this phenomenon3), so promoting considerable intra-firm trade with other regional bases. China’s own enterprises are like ly to specialize with respect to regional counterparts and so raise intra-industry trade in differentiated products. Perhapsworryingly for competitors in other regions, such integration can lead China to complement regional competitiveness as a whole, rather than substitute its exports for those of its neighbors.It is difficult to assess, however, whether complementarily between China and the regional economies will fully offset its competitive threat. The dynamics and complexity of the interactions make it impossible to quantify the outcome, even to predict broad directions. The basic issue is whether China’s higher wage neighbors can move into more advanced export activities or functions rapidly enough to permit continued export expansion. If they can, they can continue with export-led growth. If they cannot, they will suffer export deceleration and/or a shift in specialization towards primary products or slow-growing segments of manufactured exports. The outcome, in other words, will depend on the relative growth of technological and other capabilities in Chinese and regional enterprises, with the former having such advantages as lower wages, larger scale economies, greater industrial depth, pools of technical skill and a proactive government. However, as East Asian countries differ widely in these factors (Lall, 2001), they face different kinds and intensity of competitive threat. The nature of the threat depends, moreover, on the organization of the production and marketing system: independent local firms are likely to compete more directly than affiliates of the same MNC spread over different countries in an integrated system.This paper does not try to measure China’s competitive threat or its effects, but to map relative export performance in the 1990s by technology and destination and so assess where the threat appears most intense. We focus on major East Asian exporters5 and on exports to third markets, but we also analyses complementarities between China and East Asia, particularly in electronics, th e region’s largest export and the one where MNC systems dominate. As the 1990s predate China’s WTO accession, we do not go into the implications of this accession; however, the analysis of competitive trends has implications for the evolution of future trade by the region as liberalization grows.Background on Chinese export performanceChinese manufactured exports grew by 16.9% per annum over 1990-2000, compared to 6.4% for the world, 12.0% for all developing countries and 10.3%for the rest of East Asia. Its share of world manufactured exports rose from 1.7% to 4.4% over the decade and continued rising rapidly. 6 Thus, by 2002 China accounted for 5.1% of world merchandise exports; it was then the fifth largest exporter (after USA, Germany, Japan and France, and ahead of the UK). China’s share of developing world manufactured exports rose from 11% to 20% over the 1990s and of the East Asian region excluding China from 18.7% to 41.8%. Its export gains (see below) spanned the entire technological spectrum, and were most dynamic in the complex end of the range, in products that have recently driven the export growth of the rest of East Asia.This export surge is likely to be sustained for some time to come. China has ‘spare capacity’ in that its per capita exports are still relatively small,7 wages are much lower than in its main neighbors and it has large reserves of cheap and disciplined labor (though drawing it into exports will involve the cost of building links with the interior).8 More importantly, its advantages are not static (confined to cheap labor); they are upgrading rapidly. China is investing heavily in technology and advanced skills; for example, the share of the relevant age group enrolled in tertiary education rose from 9 percent in 1997 to 13 percent in 2000 (UNESCO website). It is exploiting the scale offered by its giant market to become competitive in capital-intensive activities beyond the reach of many neighbors. It is using its diverse industrial base to deepen local content. It is drawing in export-oriented FDI at an impressive rate, using its market attractions to induce investors to raise local R&D and linkages; till now it has been able to impose performance requirements of the type soon to be banned under WTO rules.WTO accession may con strain China’s ability to use industrial policy (Nolan, 2001) but it will also open up new export opportunities, particularly in textiles and garments.9 Accession may also enhance its domestic competitiveness: it will improve the investment climate for FDI, make imported inputs cheaper (for enterprises outside special export regimes) and induce faster restructuring of domestic enterprises (Ianchovichinaetal, 2003, and Lemoyne and Unal-Kesenci, 2002).Market share changes in major developed country marketsWe analyze market shares of China and its neighbors in three major markets: Japan, the US and West Europe, according to technology categories (Annex Table 1). In terms of value, the most important market for China in 2000 is the US ($49 billion), followed by Japan ($36 billion) and West Europe ($38 billion). However, the rest of the world is almost as large a destination for Chinese exports as these together ($106 billion in 2000) and within this the rest of East Asia is larger than any major OECD market by itself ($74.6 billion).The competitive position of each country can be analyzed in terms of the market share in 1990 and 2000 and the change over the decade. The annex table shows the following:Total manufactured exports: China does best in Japan, followed at some distance by the US. In common with most neighbors, its market share gain is weakest in West Europe. Korea loses market shares in both Japan and US, while Taiwan loses only in the US. Hong Kong’s loses market shares in all markets, particularly in the US and Japan. Like Taiwan, Singapore loses only in the US. The new Tigers gain share in all markets. With the exception of Indonesia, with a rather tepid performance, the others all gain most share in the Japanese market. Resource based products: China again leads the region in terms of market share increases, with a pattern similar to that for total exports. However, Korea has a large gain in Japan, in contrast to Taiwan and Singapore, which lose shares; the latter two also lose in the US. Thailand is a big gainer in Japan while Indonesia and the Philippines lose out in the US. Low technology products: China’s massive market share gains are again concentrated in Japan. The four mature Tigers generally suffer losses in market share, but Singapore sees an increase in Japanese market share. The best overall performance among the new Tigers is by Indonesia.Medium technology products: While the Chinese pattern of success recurs, the new Tigers make significant gains in Japan and Korea incurs a significant loss. Taiwan and Singapore suffer losses in the US market. High technology exports: Taiwan again diverges from Korea in its performance in Japan, the former showing the second largest gain in the group (after China) and the latter the largest loss. In the US market, the situation is reversed, with Singapore joiningTaiwan in losing market shares. Among the new Tigers, Malaysia and the Philippines are the big gainers in Japan, but the other two also benefit significantly. The Philippines is the second largest winner in the group in the US market. In sum, China’s main market share gains in the developed world are concentrated in Japan (though the US accounts for a larger dollar value of export growth). This is also true of its neighbors with the exceptions of Korea and Indonesia (Hong Kong was an all-round loser). To the extent that we can interpret market share changes to be causally related to China’s export surge, it would seem that the mature Tigers suffered the most from Chinese competition. The largest such loss is in low technology products, which is to be expected, but this not take into account the growth of LT exports by Korea and Taiwan to China. The relatively low gains by the lower-income new Tigers in LT may also reflect the impact of Chinese competition – without the offsetting increase in exports of intermediates to China.ConclusionsChina’s export surge has raised grave concerns in the region. While some of the apocalyptic predictions may have been overdone, it is certainly possible that rapid export growth by such a massive entrant will adversely affects export growth in its neighbors. As this analysis shows,however, the outcome is complex. For a start, the rise in China’s exports is matched by that in its imports – within the region its import growth outpaces its export growth. With appropriate restructuring of activities to match new competitive needs, its neighbors should be able to maintain high rates of export growth.There are two main drivers of regional exports to China. The first is to meet its burgeoning demand for imported products: primary products and resource-based manufactures that it cannot produce capital goods and intermediates for domestic -oriented production and more sophisticated consumer goods than its industry can currently provide. The second is to meet the needs of its export industries. This has two components: ‘processing’ activity in special economic zones that use imported inputs for export activities, and other exporters that also need imports. Processing activity is increasingly organized as part of integrated production systems, particularly its high technology segments, thoughsome domestic oriented industries are also being plugged into this system as they realize scale and learning economies and become globally competitive. Both drivers are likely to continue into the foreseeable future, though their composition will change as Chinese and regional capabilities develop.中国竞争力的表现:是对东亚制成品出口的威胁吗?越来越多的东南亚和东亚地区关注中国出口的迅速增长所带来的竞争威胁,中国加入WTO后,更加剧了这种情况。
文献信息标题: Revealed Comparative Advantage of Carpets and Textile Floor Covering Industry in Pakistan, India and China作者: Altaf, Saba期刊名称: Journal of Economic Cooperation & Development;卷: 35;期: 4;页: 113-133;年份: 2014 Revealed Comparative Advantage of Carpets and Textile Floor Covering Industry in Pakistan, Indiaand China1. IntroductionThe global trade pattern has been changed in the pursuance of trade liberalization policies in the form of removal of tariff and non-tariff barriers, reduction in quotas and technological advancement on the part of world economies. South Asian economies such as China and India are seeking a favorable position from the trade composition perspective in the international markets. These countries possess comparative advantage in textile sector and show a noteworthy growth in changing trade patterns across the world. Pakistan has a great potential to stand out in this sector in the region as a prospective and overwhelming proportion of labor force is engaged in this sector. It is expected that export-led growth strategy cause a significant boost in production, employment and the productivity of labor along with the improvements in overall economic status but the political and socio-economic conditions in addition to primitive types of technology use may hinder the way to rapid progress.Pakistan's current export structure requires structural transformation and changes in its export diversification and prototype specialization. The industrial sector in Pakistan has been playing a pivotal role in the national economy in terms of its share in GDP, exports, employment, foreign exchange earnings, investment and its contribution to the value added industry. China is one of the world's largest textiles exporters, accounting for one third of the global textile trade volume. Although the prolonged anti-dumping investigations hit the country's textile export, still textile industry in China has remained a key pillar of development in the country. It has played a vital role in proliferation of various sectors of the economy. Due to its large contribution in the economic growth, Chinese government has remained very much focused to upgrade this sector. India, another major exporter of textile goods is self-reliant and independent with lots of versatility and diversification in textile sector. Apart from providing one of the basic necessities of life i.e. cloth, the textile industry contributes about 14 % to the country's industrial output and about 17 % to export earnings. This sector stands at second in the provision of jobs to people after agricultural sector.There is continuing debate and emerging concern about the position of these countries in the world market and the resulting edge of China for intensified competition in the labor-intensive manufactured goods. This signifies the importance of the structure of comparative advantage in selected countries; China, India and Pakistan and to find out the extent of competition among these countries in the market of selected subsector i.e., textile.This study focuses on one of the important sub-sector of textile industry i.e. Carpets and other textile floor Coverings (under the category of code 57 as per Harmonized System of classification, HS). The carpet industry plays a fundamental role in determining the export bearing of Pakistan. There has been an ever increasing demand for carpets and floor coverings both in Pakistan and around the globe. Carpets have always been a valuable asset since ages and therefore remained in vogue. This wasgradually commercialized in Pakistan because of the development of export market. Commercialization gave new dimensions to this industry and it started expanding in rural areas due to the availability of cheap labor. This is one of the sectors that grew tremendously during 1970s and 80s. Among the value added goods it remained on the top of the list (Awan and Khan, 1992).This sector started getting a set back after the issue of child labor raised by international organizations. As majority of the carpet weavers in Pakistan were estimated to be children less than 15 years of age. Although, data on the Pakistan labor force and child labor is vulnerable. Nevertheless, there is little doubt that child labor has assumed massive proportions in Pakistan. The actual total number of working children in Pakistan is probably somewhere between 2 and 19 million.2Primarily, the promotion of carpet industry depends upon availability of raw material, presence of skilled weavers and the tradition of weaving art, etc. The skill and productivity of workers in carpet industry along with the availability of socio-economic infrastructure affects the competitiveness of this sector. Despite the presence of weaknesses in few areas, the carpet industry serves as a backbone for the economy of Pakistan. It has been a major source of foreign exchange earnings and contributes a lot in relief of poverty, especially in rural areas. Presently this industry is not revealing a significant export growth and there is a dire need to focus on the provision of infrastructure to support the growth of this industry.A UNICEF-Punjab report (1992) asserted that "according to conservative estimates, one million out of1.5 million workers in the carpet industry in Pakistan were children. A separate 1992 UNICEF/Govemment of Pakistan study reported that 90 percent of the one million workers in the carpet industry are children, many of whom began working in the industry before 10 years of age. The Human Rights Commission of Pakistan found that weaving thrives in self-contained homesteads, where labor is cheap and readily available".Different techniques have been used in literature to determine country's competitiveness in selected industry. One of the most widely used methods involves the concept of Revealed Comparative Advantage (RCA) developed by Balassa (1965). Revealed comparative advantage (RCA), a measure of international competitiveness specifies that a country is defined as being specialized in exports of a certain product if its market share in that product is higher than the average.A number of studies are available on measuring competitiveness in various sectors of Pakistan, but there is no empirical work done on RCA of Pakistan in carpet and other textile floor coverings industry till the year of this study conducted. For small as well as growing economies, competitiveness is essential for promoting economic development and to survive in the globalized world where carpet industry holds its own worth.From the above given perspective, the objective of this study is to analyze the comparative advantage of the carpet industry in Pakistan and compare it with selected South Asian countries .i.e. China and India. These countries were selected for measuring and comparing RCA with Pakistan's because they are similar in size and factor endowments and core competitor of Pakistan in the world market. The study enables us to find out the competitiveness of this sector in the world market and can probe at the future potential of growth in the carpet industry of Pakistan. The Balassa Index (1965) is used to find out the comparative advantage at 2-digit and 4-digit level of Harmonized System of Classification. The rest of the paper is organized as follows. Next section provides the literature survey followed by the methodology and data description. The empirical results of the study are reported and discussed in section 4. Last section concludes the study with some policy recommendations.2. Review of LiteratureA number of studies have been conducted to find out Revealed Comparative Advantage (RCA) using Balassa Index (1965). This section provides a brief literature review that can give a better knowledge and understanding of the pattern of RCA in different countries for different sectors.Balassa (1977) has undertaken an analysis of the pattern of comparative advantage of industrial countries for the period 1953 to 1971. The empirical findings of this study suggest a renewal of the product cycle for US that possess an ever increasing technical lead. Based on the standard deviation of the RCA indices for different countries an association is also seen to hold between size and diversification of exports. Furthermore, Balassa's results show that the extent of export diversification tends to increase with the degree of technological development and a reversal takes place at higher levels in the trade patterns.Leishman et al. (1999) empirically analyzed the international competitiveness for agricultural commodities by applying Revealed Comparative Advantage (RCA) for wool- exporting countries. A number of six wool producing countries are selected for measuring RCA over the time period of 37 years. RCA index for Australia, Argentina, Newzeland, South Africa, United Kingdom and Uruguay indicates that GATT Uruguay Round has changed the RCA's of countries significantly.Mehmood (2005) analyzed the export specialization and comparative advantage/disadvantage of Pakistan's non agriculture production sectors in the context of on-going multilateral trade negotiations. The study uses RCA approach at HS-4 digit level for the period 1990-2000. The data set has been drawn from International Trade Statistics compiled by the Australian National University (AND). The data set comprises 16 product categories made up of 978 product lines. Findings show that Pakistan's top-ranking exports belong to textiles and clothing sector, consistent with the natural and human factor endowments however Pakistan has failed to move from low value added to technically intensive high value added manufacturing. Pakistan's economic well-being depends on the extent to which the non-agricultural sector remains competitive and contributes to economic growth, exports, investment and employment.Batra and Khan (2005) examined the structure of comparative advantage enjoyed by India and China in the global market keeping in view their similar resource endowment and size. The study estimates Balassa index of RCA for India and China at sector and product level of the Harmonized Classification System (HS-1996) both at 2 and 6-digit level for the year 2000 and 2003 using data on exports from UN Comtrade.3 The year 2000 is taken as reference, as this is the year immediately preceding China's accession to WTO. The main objective of the study is to figure out the leading manufacturing industries in India and China in terms of their revealed comparative advantage. The study reveals that the maximum number of commodities with comparative advantage in the world market is concentrated in sectors like organic chemicals. There are also some sectors where India is comparatively disadvantageous positioned at the aggregate level but reveal significant comparative advantage at the constituent commodity level (HS-six digit).In addition, China enjoys comparative advantage in the world market in 47 sectors and 1828 commodities out of 97 sectors and 4923 exported commodities, respectively by China to the world. The sectors of comparative advantage in China belong to the electrical and electronic equipment, manufacture of leather, toys, organic chemicals, articles of apparel and cotton. The number of sectors for which India and China enjoy comparative advantage remains roughly the same between 2000 and 2003. An important finding of the study is that some sectors are at disadvantageous at the aggregate level but may enjoy comparative advantage at the constituent commodity level.Hanif and Sabina (2006) constructed Balassa's Revealed Comparative Advantage (RCA) index for the textile sector of Pakistan to analyze the relationship between the financial development and international trade competitiveness. Pakistan's focus of trade policy shifted from import substitution to export promotion in the seventies and turned its resources to the products showing comparative advantage. The results show that greater access to external finance has a strong positive impact on the country's textile sector competitiveness over the time period 1974 to 2004. The study concluded that if the economies of scale, technology and endowments are identical between countries, still a country with relatively developed financial institutions will have comparative advantage in the production of processed goods requiring more external finance.Welch and Conrad (2007) evaluated the US competitive position in the cotton yam segment using RCA index based on Balassa (1965) among the set of countries including China, India, Pakistan, and Turkey. The results disclose that United States fails to make the competitive grade in several categories and if it happens to make it, that is by narrowing margins. While the Revealed Comparative Advantage index indicates that the United States is lagging behind China, India, Turkey, and Pakistan in terms of market share in exports of yam, fabric, etc.Akhtar et al. (2008) analyzed the competitiveness of footwear industry of Pakistan in the global perspective using revealed comparative advantage at 2-digit and 4-digit level of HS classification for the period of 1996 to 2006. RCA indices have been calculated for Pakistan and other Asian countries i.e. China and India, since both countries are similar in size and factor endowments and greatest competitor of Pakistan. Calculations show that Pakistan's footwear industry has shifted from a situation of comparative disadvantage to competitive advantage especially since after 2003 due to increase in volume as well as in the value of footwear exports and thus there is an upward movement in comparative advantage.At disaggregate level, Pakistan has been enjoying comparative advantage since after 2005. This study also highlights the problems faced by footwear industry and explains the role of entrepreneurs in this regard. The rising trend of RCA reveals that there is a potential for higher growth of this industry which requires strengthening of competitiveness of the footwear industry.According to Jayawickrama and Shandre (2010), given the abundant resources, China and India have comparative advantage in a broad range of manufactured goods as compared to Singapore. From the disaggregated analysis at 2-digit level, the paper finds that the Singapore and China exports are complements, although the degree of complementarity has being declining over time. Meanwhile, Singapore and India exports are found to be stronger complements and stable over time. The results also show that China and India exports are strong substitutes. This makes the comparative advantage position of both countries more competitive. The study reported that the exports diversifications have broadened the exports net by China and India, as well.Wei and Zhao (2012) found that the comparative advantage of Chinese manufactured products in both world and US markets are gradually increasing. This is pertinent to mention that most of the products with comparative advantage are low-technology products. While, the comparative advantage of Chinese medium-technology products in the world market has largely improved, but their RCA indexes are low and their kinds of products with very high comparative advantage are small. Finally, they concluded that the Chinese manufactured exports are of greater comparative advantage in the world market than in the US market.Focusing on the clothing export sector, Kathuria (2013) demonstrated that the comparative advantage of India has increased from 23 products to 25 products between 1995 and 2003 and for Bangladesh,this number increased from 21 products to 29 products between 1995 and 2003. Moreover, the comparative position on the basis of a measure of structural change in exports of India and Bangladesh also pointed out towards a better standings of these countries.This completes the review of relevant literature. Now we turn to the trends of carpet and weaving sector in selected countries.3. Trend and Pattern of Carpet and Floor Coverings Industry: Pakistan, India and China's PerspectiveA brief picture of the trends in exports of carpet and floor covering industry is provided in this section. Overall, exports of the carpet industry in Pakistan mounted and reached up to Rs. 109 million earnings in 1971-72. By 1975-76, the income from carpet export gone up to Rs. 719 million and it further increased to Rs. 1,180 million in 1977-78 and then to Rs. 2,198 million in 1979-80. In 1980-81 carpet exports touched the highest ever figure of Rs. 2,243 million. There was a slight decline after that because of recession in the world market. With the export income coming down to Rs. 1,676 million and Rs. 1,913 million in 1981-82 and 1982-83, respectively. In 1985-86 the income rose to Rs. 2,693 million. The income from carpet exports further increased to Rs. 3,419 million in 1986-87. Table 1 depicts the trend of export value for three countries over the years 1996 to 2009 at 2-digit level of HS classification.China and India exhibit an increasing trend in exports while the figures for Pakistan showed first declining trend up to year 2002 and then a sharp rise that followed by a gradual rise in the export value. Pakistan's export values remained high than China and India from 2004 to 2007. The reason for lower export values afterward are less competitiveness, high interest rates and cost of inputs, non-conducive government policies and non-guaranteed energy supplies that hinders the competitiveness of Pakistani exports over other countries. Moreover, the bans on child labor, in the backdrop of ILO recommendations also hampered the growth of this sector in Pakistan, as an overwhelming proportion of labor force working in this sector is child labor. Furthermore, the enactment of Employment of Children Act of 1991 that banned the child labor put the sector's status in more vulnerable condition than ever before. China presented the highest export value among three countries with few exceptional years.4. Methodology and DataMeasuring comparative advantages may create certain difficulties since relative prices under autarky are not directly observable. Thus comparative advantage is calculated by calculating Revealed Comparative Advantage (RCA) for specific sector. There are different indices applied for this purpose, most common of which is Balassa Index (1965) of RCA. The concept of revealed comparative advantage (Balassa, 1965) pertains to the relative trade performance of individual countries in particular commodities. The advantage of using comparative advantage index is that it considers the intrinsic advantage of a particular export commodity and is consistent with changes in an economy's relative factor endowment and productivity. Demerit of using comparative advantage index is that it is a partial equilibrium framework and provides general direction of movement and do not predict the potential future comparative advantage in particular sector of the country.4This study used Balassa Index to calculate the RCA for Pakistan in rapidly growing Carpets and other textile floor coverings industry and is based on export data as per the (HS 2007) classification and is given the code 57. RCA is calculated at 2-digit and 4-digit level at aggregated and disaggregated classification.5 Data has been sourced from UNCOMTRADE and World Development Indicators (WDI) covering a period of 14 years i.e. froml996 to 2009. RCA at 4 digit disaggregated level has been estimated for the years 2004-2009. (完整内容请到百度文库)The study calculates RCA indicesfor Pakistan, China and India.5. Empirical Results and InterpretationThe study measures revealed comparative advantage indices for the carpet and floor coverings industry. The analysis has been divided into two parts. The first part analyses the comparative advantage at aggregated level. The 2-digit level of Harmonized System (HS-2007) is employed to calculate RCA index at aggregated level. The second part, calculates RCA indices at disaggregate level i.e., at 4-digit level of HS2007 classification. The purpose of calculating RCA index at disaggregate level is to work out possible differences across the industry at different level. RCA indices are measured for Pakistan and a comparison is made with India and China since both of these countries are among the major competitors of Pakistan in the export of carpets and other textile floor coverings.5.1 Aggregate Analysis of Revealed Comparative AdvantagesThe estimation of Balassa Index for the years 1996-2009 presents the movement in the pattern of revealed comparative advantage. Our findings show that at HS-2 level, Pakistan has an upward moving trend in the comparative advantage for carpet industry. RCA index has remained greater than unity (RCA>1) since 1996 and is growing over the years as shown in Table 2.The results of Table 2 show that throughout the period of study, Pakistan has never faced a situation of comparative disadvantage in this industry. The growing trend of RCA shows that Pakistan has great potential for growth in carpet and floor coverings industry. Good export performance of this sector can lead to more competitiveness if accompanied with better incentives from the government in this sector. RCA values kept on increasing from 1996 till 2001 when RCA reached its highest value i.e. 2.05 but fell immediately in the next year that may be due to the return of Afghan refugees to their homeland as 80 percent of the workforce was comprised of Afghan refugees that time. Later on, it increased gradually but still with lower values of RCAs. The carpet industry in Pakistan needs much more attention in this regards.In the last ten years Pakistan has emerged as one of the leading exporters of hand-knotted carpet industry accounts for 0.64 percent share of total GDP, 3.66 percent of manufacturing sector GDP and approximately 14 percent of small-scale manufacturing sector GDP. The available evidence indicates that Pakistan's carpet and rugs industry make up around 2.5 % of total exports". A more than 1.5 million people are employed in this sector and more than three million people directly or indirectly depend on its earnings [Nasir (2004)]."Until 1970s, the carpet industry did not receive attention from the government but later on a number of carpet-weaving centers were established in the country. With the implementation of the labor laws and the factory Act of the mid-1970s, many big centers disintegrated into small units that eventually moved into residential areas to operate in private homes and sheds. The most carpet-weaving activity takes place in homes throughout the country. The upsurge in demand for handknotted carpets in foreign markets continued in 1980s and 1990s. However, with the slump in international economy in recent years, this demand has declined (EPB)".6The lack of competitiveness in Pakistan's carpet industry has also been attached with the bans on bonded labor by ILO as child labor are mostly involved in this sector and children and women are considered as the better weavers of carpets in this industry from their efficiency and productivity concerns. The ban on child labor in 1991 in the carpet industry leads not only to the financial loss to the family but also towards a fall in production leading to lower foreign exchange earnings from thissector in the country.Other problems hindering the export performance and competitiveness of this sector in Pakistan are pointed out as the reduction in rebates and incentives accompanied with high mark up rates that is troublesome for the carpet exporters; usage of obsolete production methods that is unable to produce carpets of outstanding quality; heavy reliance on the manual design methods while India and China use modem technologies; lack of skill development and the problems of supply chain and production capacity.Although the study is mainly concerned with measuring the RCA for Pakistan in carpet and floor coverings industry, it also incorporates movements in RCA of India and China. Despite the fact that Pakistani carpets are generally superior to Indian and Chinese carpets but cheap labor, low cost raw material and low utility/fmancing charges in India and China gave a price edge to these countries over Pakistani products.As depicted by the results, India is the strongest competitor with highest RCA values throughout the years of study. India has an edge over its competitors in this industry because of vast artistic skills of the weavers and low labor cost which is another advantage and favorable factor for growth. The magnificence of Indian carpet weaving and the intricate patterns substantially increased India's carpet exports and placed it prominently in the international carpet map, as depicted by the increasing RCA values.Table 3 reports the test of equality of means between RCAs of three countries. The table postulates a significant difference of RCA among China-India and India-Pakistan, but no statistically significant difference emerged across China and Pakistan. The test suggests that India has an edge over other two countries in terms of competitiveness as a higher value for means of revealed comparative advantage is estimated for India that is also consistent with the RCA trends. Hence, India has gradually escalating in terms of competitiveness in carpet industry, while China and Pakistan are losing its competitiveness in this sector.China has RCA in carpet and other textile floor coverings industry but it is facing a declining trend. China's exports fell by 8.10 % and the average unit price fell by 9.98 % in 2009. Though the situation get improved later on but the financial crisis and low price of carpet exports made profitable growth of the carpet more difficult. This decline in carpet exports and average per unit price harmed the sound development of China's carpet industry.Now, we turn towards the discussion of findings on RCA at disaggregated level.5.2 Disaggregated Analysis of Revealed Comparative AdvantageThe second part of analysis yields the measures of RCA at disaggregate level in order to capture the difference in export performance within the carpet and other textile floor coverings sub-sector for Pakistan and a comparison with China and India. At 4-digit level of HS-2007 classification, four sub sectors are selected of this industry owing to data availability. Pakistan is enjoying comparative advantage in the sector 5703 i.e. Carpets and other textile floor covering tufted. Whereas a comparative disadvantage in the other three sub sectors i.e. Carpets and other textile floor covering, knotted, whether or not made up (5701), Carpets and other floor coverings, of felt, not tufted or flocked, whether or not made-up (5704) and other Carpets and other textile floor coverings (5705). The results of RCA at disaggregate level are presented in Table 3, 4 and 5 for Pakistan, India and China, respectively.China and India are almost presenting the same picture as both have revealed comparativedisadvantage at 4-digit disaggregate level in four sub sectors where their RCA's are less than unity (RCA<1). India has a comparative disadvantage in four sub sectors of the economy implying that India is not specialized in the export of these products since India's share of world exports of these particular commodities is less than its share of world exports of all commodities. Nevertheless, India is performing well in the overall carpet industry as is obvious from the RCA at aggregated level. China is lagging behind India in terms of RCA at disaggregated level as well and is not showing competitiveness in terms of RCA.6. Conclusions and Policy RecommendationsThis study aimed at assessing the structure of comparative advantage in Pakistan and making its comparison with India and China. Data as per HS 2007 classification was used to calculate the Balassa index of RCA. Data is collected from UN Comtrade Statistics and World Development Indicator (WDI). Balassa index is the most common approach of calculating RCA. It measures the competitiveness of a country in a particular product by comparing a country's exports of a product relative to its total exports and to the corresponding exports of all countries in the world. Index was constructed at 2 digit and 4 digit level of exports of carpets and other textile floor coverings. It also analyzed the change in scene of comparative advantage from 1996 to 2009 and at disaggregates level from 2005 to 2009, respectively. The purpose of such an analysis was to obtain an inclusive view of the comparative advantage for Pakistan in this specific sector that can enable policymakers to focus on increasing exports further and facilitating the manufacturers so that RCA can be further enhanced.Results suggest that Pakistan enjoys a comparative advantage at 2 digit level of classification throughout the period except for the year 2002 when value of RCA considerably reduced to 1.04, the lowest of all the periods but still exceeding the required value. The reason for such a sharp decline in RCA for that time period provided is the return of Afghan refugees under the United Nations High Commission for Refugees (UNHCR) program. India and China also reveal a comparative advantage and have RCA values greater than one throughout the period of study. India is evidently dominating the carpet industry with the highest values of RCA. Reasons behind such a high demand for Indian carpets include exclusive and unique designing. This implies that carpet business will be very challenging in the future as Pakistan has to face a tough competition from India in the global arena and the cost of production in this business is constantly going up. China showed a declining trend towards the end of 2008-09 in RCA pertaining to its low exports in these years and relatively less formal supply chain. At 4-digit level of industrial classification, none of the three countries could reveal comparative advantage in any of the sectors except for Pakistan in the category 5703.Overall, the values for RCA index of Pakistan shows that Pakistan has a comparative advantage in this sector and has higher potential for growth and development of this sector. But the resources are not being utilized properly. Continuous government support through new schemes and training program will be helpful for handmade carpet sector. Results of the study suggest that a lot of opportunities are available for the carpet industry in terms of improving the productivity and quality of raw materials at reasonable prices. The Research &Development facilities for improving the fiber quality and development of specialized fibers/yams are required as market always demands a diversified nature of product. Rising Inflation is a world-wide phenomenon. Owing to increase in energy prices, the cost of raw material has increased that leads to rise in the price of carpets. So the government must step in and provide subsidies to make the carpet industry of Pakistan more competitive in international market. The policy implications flows out from the results to improve the competitiveness of carpet industry are mentioned below:。
英文文献资料(二)How do Industry Clusters Success:A Case Study in China’s Textiles and Apparel IndustriesZhiming Zhang, Chester , & Ning Cao(Institute of Textiles and Clothing,The Hong Kong Polytechnic University)3. Industry Clusters of Textiles and Apparel in ChinaIndustrial clustering is a new phenomenon in China. Only a few research started to pay attention to it in the 1990s. Wang (2001) described the development of some clusters in the coastal regions of China, and discussed their characteristics, including their localized network. He particularly examined the impact of accidental factor on the formation of clusters, and pointed out that the strength of the impact depended on the congruence of the sector choice, brought about by the accidental factor, with the natural advantages of the region and the rightness of the policy decision of the local government. Thus, the importance of government was emphasized.The first tier of the clusters existed in the late 1970s and early 1980s, when China was first open to the outside world. Taking the advantages of proximity and low labor cost, many Hong Kong textile and apparel companies invested in Pearl River delta, and there appeared a few clusters of textile and apparel firms. These clusters grew fast, as new investments also came from Taiwan and other places, and many local entrepreneurs emerged as well. These clusters include Shenzhen (though later much diluted as it is now one of the largest cities in China), Dongguan (similar to Shenzhen but to a less degree), Humen, Shaxi, and others.Closely following this, the economy in Yangtze River delta developed fast and became very dynamic. Many enterprises of collective ownership and of private ownership established and grew very fast. Many of them were textile and apparel firms. It was typical that these firms clustered together. Several reasons account for their fast growth: First, the entry barrier to the textile and apparel industry was very low in terms of capital and technology. For example, at the beginning, only one manually operated device to knit socks or just a few sewing machines were needed. At the same time, there was almost endless supply of cheap labor, who were farmers eager to leave the land. As the enterprises expanded, some shrewd entrepreneurs lured technicians and skilled labors who were retired from state-owned enterprises to work for them. These firms were most located in towns. The government granted very flexible policies for the growth and operation of these firms. They were much less restricted by the clumsy rules and regulations than the state-owned enterprises, for example, they did not have to offer the so called iron-bowl to their employees, and they had no burden of payments to retired employees. On the other hand, these firms were very sensitive and responsive to market changes. Thus, they were very competitive. Second, at that time China was just about to come out of the planned economy when there was insufficient supply of almost everything. Thus, there was never a lack of strong demand for such consumer goods as textiles and apparel. Along with this, little marketing and marketing skills were needed to sell the products. Third, as these firms were started by farmer-entrepreneurs in towns and even villages, they set examples and became models to others. Many times the latter just followed the footprints of the pioneers, starting with the same methods, making the same products, and selling in the same market.As villagers often belong to the same family, they did not view each other as competitors, and helped each other in terms of capital, technique, and even customers through the strong sense of kinship.These firms were the seeds of the industrial clusters of textiles and apparel. Now most of the clusters still distributed in the two areas: Pearl River delta and Yangtze River delta. The former is Guangdong province, and the latter Zhejiang province and southern part of Jiangsu province. These happen to be the most advanced regions in China, in coastal area, with the best infrastructure in information, communication, and transportation. As a matter of fact, most of the clusters are located either beside a highway or very close to a port. They are also very close to major cities, particularly Hong Kong, Guangzhou, and Shanghai.At present the structural development of the textile and apparel industry of China is characterized in two directions: one is a group of large companies based in large cities with capacity in marketing and product development, often operating supply chain regionally even globally; the other is a number of clusters of many small and medium sized firms based in small cities and towns, with featured products and vigorous growth (CNTIC, 2003). Thus, industrial clustering has become one of the two wings of the development of the textile and apparel industry in China. This demonstrates the importance of the clusters.4. Case ObservationWe conducted an industry survey in one industrial cluster, which is a town, called Shengze, located in Wujiang county of Jiangsu province in eastern China. While Shengze had an early history of silk production, it was primarily of agriculture before the late 1970s when China started economic reforms. At that time, the size of the town was about 4 square kilometers with a population of 30,000. Since then, the town has seen enormous growth and become one of the 19 towns with special features designated by CNTIC, and one of the most important textile clusters in China. The focus of Shengze is fabric manufacturing, primarily light weighted fabrics for lining of apparel. Now the size of the town has expanded to 25 square kilo meters with a population of nearly 200,000, most of them migrants from other parts of the country. There are about 1,100 factories, operating about 50,000 looms, all of which are of water-jet or air-jet. It is said to be one of the largest concentration of such looms. The total yearly output is about RMB20 billion (US$2.5 billion). There are about 4,000 selling and buying offices located in the town. The business district of the town is full of such offices, which would impress any visitors to the town. And there is no sign of stopping of the fast growth.This is a qualitative and exploratory study, and in-depth interviews with town officials and entrepreneurs were used to collect information about the industrial cluster. Altogether 3 town officials (Vice Party Secretary of the town, Director of The Town Government Office, and Director of The Town Development Office) and 8 entrepreneurs were interviewed by structured means. During the interviews, in addition to the current situation of the cluster, the history of development was also investigated. Emphases were paid to the following questions: how is the cluster formed; to what degree does township government play a role, and to what degree do market forces promote the clustering; what is the advantages of clustering to the locality and to the enterprises; what are the interactive relationship among the enterprises within the cluster; what is the relationship between the cluster and the external market system; how does the cluster attract the servicing industries; and how does the clustering help the creation of new enterprises and new jobs. These questions have profound policy and marketing implications. Some of the findings to these questions are presentedin this paper, with a focus on the origin and growth of the cluster.4.1. Historical factorsIn accordance with the literature (Krugman, 1986), the development of Shengze into a light-fabric cluster was accidental, but on he other hand quite natural with a historical reason. Located in southern China with warm climate, fertile land and abundant water from nearby rivers and lakes, Shengze had been one of the silk centers in China for hundreds of years. Historically, residents of Shengze were skillful in silk production, and many workshops and silk-related businesses were located in Shengze. Merchants from all over the country would flock to Shengze for silk. Thus, it could be regarded as a silk cluster even then. However, as planned economy was established and no private business was allowed to exist, the silk center was reduced to nothing and Shengze was no more than an ordinary agricultural town in China. This was for about 3 decades until the late 1970s. By then, economic reforms began, and town residents were allowed to start their own businesses. For a few of them, the natural choice was to enter the silk business, since this was something they were relatively familiar with and the local conditions were suitable for. This was the origin of the cluster.4.2. The Role of the Local AuthorityWhile the origin seemed to be natural and out of the plan of the local government, the government did play an important role in helping the cluster grow. Both government officials and entrepreneurs emphasized the importance of two measures taken by the local authority.The first one was the establishment of a market in its physical form. The Shengze government was sensitive to realize that the lack of a market had become the constraint on the development of the economic activities and a physical market was in demand. The government then financed and developed “The Oriental Silk Market”, which was like a mart and leased to various trading firms. This provided a platform, and tremendously stimulated the growth of businesses both in demand and supply. Later when this was no longer sufficient to hold all of the buying and selling offices, a new district was developed, which eventually expanded into an area which holds thousands of selling and buying offices.The other was the establishment of an industrial park, which is beside the provincial highway. The government provided the infrastructure in terms of road, water, electricity, and other basic conditions. This has created a good environment for manufacturing. While at the beginning, Shengze was only focused on silk production, very soon the enterprises broke the limits. As there was some similarity in technology between silk fabric and lightweight fabric, many of the firms expanded into the production of man-made fiber fabrics. Now even though Shengze is still known as a silk center, most of its looms are engaged in weaving of lightweight fabrics.4.3. The Role of Individual EntrepreneursDuring our interviews, we were very impressed with those entrepreneurs of Shengze. Many of them are local residents and previously were farmers. They demonstrated enormous spirit of risk taking, creativity, and willingness to learn from the market. One young entrepreneur started as a security guard, borrowed a little money to enter the business, then set up a small factory of his own. Now this has been expanded into a company, and just the weaving branch of it has capacity of 220 water-jet looms and 120 air-jet looms. He also exhibited outstanding leadership in organizing the local entrepreneurs to negotiate with Toyota of Japan. They collectively made the largest order ever in the world, 3,600 air-jet looms. In the process of his business expansion, he has helped numerous others to start their own business by loaning capital, sharing technology and market. Theseentrepreneurs help the development of Shengze as a cluster.4.4. The Development of the peripheral IndustriesShengze started with silk production. This was expanded into domestic trade of silk. Very soon light-weight fabric manufacturing began to develop. This further promoted the growth of trading. By then there seemed to be two wings of the town, one was enterprises of fabric manufacturing primarily clustered in the industrial park, one was the selling and buying offices of fabrics primarily clustered in the business district. As large amount of materials are needed, many yarn suppliers are attracted to come and set selling offices in Shengze. One of our interviewees was the owner of a trading company, headquartered in Hong Kong. The company imports man-made fibers from abroad, and sells these fibers to fabric weavers through its selling office here. Textile machine companies, both domestic and foreign, also set up offices in Shengze to sell machines and machine parts, and to provide services to the fabric manufacturers. It is said that none of the plants would keep any spare parts. If a belt is broken, even at midnight, a new one can be ordered and delivered in less than 20 minutes. These have significantly lowered the production costs, and are part of the external economies of the industrial clusters. As Shengze has become a fabric center, showrooms and selling offices of other fabrics, such as denim, are also set up in Shengze.4.5. Workforce SupplyAs the cluster grows and enterprises mushroom, large labor supply is needed. In his process the former agriculture town was totally transformed. Most of the land was turned into industrial uses, and all farmers are now employed in manufacturing. As the population of Shengze enlarges several folds (from about 30,000 to 200,000) in the last two decades, many migrants are attracted to live and work here. Most of the people were peasants and come from other provinces. While the neighboring Anhui province, which is relatively backward in economic development, provides a large portion of the labor supply, many workers come from remote provinces. They have formed nearly endless supply of cheap labor, and made great contribution to the development of the cluster. A large proportion of the labor supply is uneducated and unskilled. As there are many operational jobs, the raw labor could be trained in a short period time and then be able to work. Thus, the cluster in return also makes direct contribution to employment and indirect contribution to economic development of the less advanced regions of the country. However, there is a shortage of skilled labor. Compared to other places, labor compensation is better, as an operator can make about RMB1,500 (about US$180) per month. In other places, the prevalent wage rate is about RMB1,000 per month.5. Conclusive RemarksIn this paper, the development of industrial clustering of textiles and apparel in China is investigated. As a result of economic reforms and development, some characteristics of the textile and apparel industrial clusters are described. One particular cluster, Shengze which is famous for its silk and light-weight fabric, is used as a case to exemplify the growth of clusters. The empirical factors taken into account the cluster performance include the historical and natural origin, the role of the local government, the role of entrepreneurs, the development of supporting industries, and the supply of labor. During the past two decades in the process of development, the cluster not only grows in terms of quantity (number and scale of enterprises) but also in terms of quality (equipment, products, variety, marketing, and management). In the early when Shengze started to take off, factories used outdated facilities and equipment. Many of the machines used were those retired from state-owned plants. Over the years, as the enterprises grow, these machines have been gradually replaced by advanced ones. Now about 50,000 water-jet and air-jet looms are operating in Shengze,many of them are imported from abroad and are the most advanced models. Many of the companies in Shengze export fabrics to the international market. Not only do they receive order from abroad, some of them have set up offices in North America and Europe. They market their products initiatively, and obtain the most updated information on marketing and products. While most of the companies started as a family business, now many of them are managed professionally by University graduates with MBA and PhD. Many companies have well-established systems and met with international compliance standards and requirements, like ISO9000 certificates. Thus, many of the enterprises have changed from the old-fashioned township companies into modern corporation-type companies. It can be anticipated that these clusters will continue to contribute to the growth of the economy and industrial development of the country.英文文献中文翻译(二)来源:纺织与服装,技术与管理杂志(JTATM)Vol.4 第2期 2004年作者:张志明切斯特曹宁出版时间:2004年8月产业集群是如何成功:中国纺织和服装工业产业集群成功的案例研究(港)张志明切斯特曹宁3.在中国纺织品和服装产业集群产业集群在中国是一个新现象。
中国纺织品出口竞争力分析外文翻译文献(文档含英文原文和中文翻译)中国的纺织工业国际竞争优势摘要通过改革开放的政策,凭借要素禀赋优势中国纺织工业在全球纺织市场的份额持续增长超过20年。
本文认为,目前中国纺织行业竞争优势仍然是基于传统因素的比较优势,这可能由于国际纺织产业的技术不断地升级,国际竞争比以前更激烈。
中国加入WTO后,有一些弊端,如产业和贸易结构,贸易壁垒对中国纺织业发展的阻碍。
如何加快产业结构升级,提升中国纺织工业的国际竞争优势,是中国纺织行业发展的首要任务。
纺织工业一直是中国经济的支柱,得益于其在要素禀赋和市场规模的优势。
纺织部门的贸易额在过去25年(从改革开放)增长了27.11倍。
2005年,纺织品出口占了中国出口总额的15.4%,占了世界总出口的纺织品24.4%,而中国纺织品的生产和出口都位居世界前列。
尽管如此,中国纺织工业正面临着各种各样的困难,比如过度依赖资源,技术含量低和附加值低,复杂的贸易结构和出口市场的高度集中等对中国纺织品有越来越多的贸易制裁,特别值得一提的是,因为中国在这个行业的竞争优势被限制。
本文旨在通过深入的调查中国纺织行业的竞争优势,并带来了相应的建议。
一、中国纺织工业的国际竞争优势鉴于国际竞争优势关系的因素,纺织行业的发展仍然受劳动力成本和技术的决定。
相比较而言,服装业是高强度劳动,而在纺织行业,尤其是在化纤行业,资本和技术正在成为越来越重要的因素。
中国纺织行业显示了材料供应,劳动力成本,产品质量,与上下游的兼容性,明显的出口竞争优势积极促进规模经济和成本的影响。
但是,随着发达国家新技术持续投资于他们的纺织工业,廉价劳动力优势在发展中国家是倾向于被通过不断提高生产效率在发达国家削弱。
纺织行业在发达国家从而可以维持较高的利润,而同时降低了生产。
在本节中,中国纺织行业的竞争优势进行分析,并比较其对口发达国家和发展中经济体将会作出修改。
1.中国纺织行业的竞争优势的基础目前中国纺织行业的竞争优势在很大程度上取决于其雄厚的工业基础和廉价的成本。
文献出处:Tully E. The research of India's textile export competitiveness [J]. Research in International Business and Finance, 2015, 12(2): 17-26.原文The research of India's textile export competitivenessTully EAbstractIndia ranks high in the world in terms of textile production and export, and the textile industry is one of India's manufacturing industries first appeared, played an important role in promoting its economic development. After the international textile trade quotas were banned, free world textile trade rapid growth, participate in the international market countries change their state of textile trade management, on the management more adopted the approach of trade barriers. At the same time, the international textile market is becoming more and fiercer competition, the competition between countries and also increases. India in textile production and export in the world second, India has to develop textile raw material of natural geography and climate conditions; As a large Asian population of India is also have plenty of labor force to develop the domestic textile industry; India’s domestic backwardness of textile market has a broad development space and a series of advantages. Keywords: India textile; Export competitiveness1IntroductionFor most countries, as the country entered the industrialization in the early stage of development is the first of its textile industry, textile industry is a resource-intensive and labor-intensive industries, not only provide abundant raw materials and primary products for other industries, and the development of textile industry also can further promote the development of its other industries and upgrade. And textile industry demand for high-tech technology is relatively low, so in the fierce competition in the international market environment, the textile industry has become one of the few developing countries have a competitive advantage in the industry. The textile industry in creating foreign exchange and balance of payments for a country and stabilize their currencies are play an active and important role. Textile industry isone of the important economic pillars of India, a great contribution to textile exports to India's foreign exchange earnings. India in recent years the rapid development of textile exports, its growth has attracted the attention of the international market. According to the forecast authority, the 2010 India's textile and apparel export scale topped $50 billion. India's textile export growth will lead to the increasing trade friction. The outbreak of the financial crisis has made a resurgence of international trade protectionism, developed countries must use of technical trade barriers to limit the export of textile exporters, including India, so the technical trade barriers on the impact of India's textile export, and how to draw lessons from the experience of the technical barriers to trade deal with India textiles is extremely necessary.2 Literature reviewIn terms of factors that affect industrial international competitiveness, an American economist Michael porter (1990) argue that an industry international competitiveness mainly from four aspects, the influence of factors of production are industry, enterprise strategy structure and characteristics, product demand conditions, related industries and support industries. These four factors on the business environment construction have different effect, but can make more competitive business environment, competitive business environment will further promote enterprise development has the characteristics of enterprise products, formed a unique competitive advantage, and in promoting de-skilled and specialization of the elements of the intermediate products and supply plays an important role. At the same time, companies focus on domestic market change ability and the ability to respond will be formed in an industry international competitiveness plays an important role. Alfonso and ASHLEY had made a research on the international competitiveness of the enterprise (2007) believe that when a country's development in the domestic market plays an important role in the formation of international competitiveness. Generally larger domestic market has a relatively perfect market competition system, develop large-scale domestic enterprises more easily, thus receive benefits in the greater economies of scale, and in developing of enterprises in the market competition for limited resources in the domestic market will be more intense, it will help enterprisesimprove efficiency, William Bayesian and David (2009) to a certain extent the influence factors of international competitiveness of the extension, the introduction of the new factors, he not only covers the research on international competitiveness of porter's theory, will also be enterprise product price and quality, research and development of innovation ability and the need for customers to complete ability and speed range is also included in the study of industry international competitiveness, the industrial international competitiveness theory to carry on the further perfect.With the continuous development of global economy, the connection between the countries continue to strengthen, the way of trade between nations also by a single individual inter-industry trade to intra-industry trade and the change of labor division, and shift faster and faster, and at the same time, the inter-industry trade and division of labor division of intra-industry trade and gradually been cancelled and replaced. Trade between countries gradually from the final product is to intermediate products and semi-finished products, different countries to participate in the same commodity production and manufacturing, the evaluation and analysis on a country's international competitiveness of products easy to shake off the causing factors, the analysis results of the final cause interference. William (2010) study on this problem, the enterprises in the international competition in the market of each country should develop their own different from other national enterprises of industry international competitiveness, in many countries involved in the internationalization of production system to find their own positioning, and on this basis of the country's comparative advantage, forming the difference competitive advantage, different countries in the same division of different on different links of value chain of the development of the international market also has a certain role in promoting. According to the position of the enterprises in the value chain of each country can determine a country in which products have a competitive edge on the production and business operation. Nicky (2009) by the study found that India textile production enterprises for a long period of time distribution of relatively scattered, not formed industrial cluster centers, and production equipment obsolete, labor productivity is low, companies benefit from the market began to be very hard. India to reduce the power consumption of Indian textileindustry form their own competitive advantage to lay the foundation, make its have the strength of enterprise products from domestic market to foreign market to further expand the market, improve the market share. In the integration of international trade, international trade barriers against the background of gradually reduce; country exports ability will directly reflect the country's products and industries in the international market competition ability. In other words, the study of national industrial international competitiveness is ultimately about the national research products in the international market competitiveness. Some scholars also respectively from the Angle of industry, product and the enterprise product competitiveness of enterprises are analyzed and studied. Factors of production in their industry from industry, related and supporting industries and other factors as the starting point for the formation and development of the enterprise product competitive process are analyzed; In terms of product, they are from the structure of the product, price, quality and demand for basic research object, further analyzes the international competitiveness of the enterprise in the process of the formation of the impact of; At last they stood in the perspective of enterprise, from the enterprise innovation ability, the ability to meet customer demand and speed, and the enterprise products on the market possession ability, etc are analyzed and the research, the factors affecting the formation of the enterprise international competitiveness made a comprehensive and detailed analysis.3 export competitiveness related theoryResearch on the theory of international competitiveness in different countries, different period widely exist in both groups, but different structure, the research focus of scholars, research way is different, so that, the concept of international competitiveness also gave different definitions. International competitiveness is a country's creation, improve the added value, and increase the ability of national wealth. From the perspective of international trade, we can understand the export competitiveness of really existing level of macroeconomic environment and industry development, on the basis of a country industrial production of the product or service market development in the international market, the market, and the ability of profit.3.1 The comparative advantage theoryAbout export competitiveness theory, first of all should be the most worth mentioning is the comparative advantage theory, it is the tradition of classic economic theory, has been in the field of industry economics and international trade and its important position and strong competitiveness. The theory was first put forward by Adam Smith, a founding father; in his mind that international trade occurs is the primary basis of the existence of absolute cost differences. Absolute cost is between any two countries that produce a product, an absolute difference of the cost of labor, that is, a country absolute loss by Labor costs less than another country for labor cost. The concept that any country can be and should be exports to the country with absolute cost advantage of related products, so that it can get relatively considerable interests through international trade, which is the interpretation of the previously mentioned absolute advantage.3.2 Competitive advantage theoryComparative advantage theory analysis and explained the basis of the export competitiveness of a country or industry, but didn't really explain whether a country or industry has the real export competitiveness strength, and decided to export competitiveness strength should be relatively competitive advantage. In the 1980 s, the main members of the industry product competitiveness committee - Michael porter published one after another famous at home and abroad between the national competitive advantage ", "competitive advantage" and "competitive strategy" and other books and papers, in these books and academic papers in detail and put forward about the comparative advantage theory of competition. Michael porter thinks of export competitive advantage refers to the one country in the international market has the competitive advantages and strengths, and export competitive advantage is a country the main influence factors and the symbol of the levels of productivity development. To a country in the world market, and the most fundamental condition is to have a competitive advantage and comparative advantage has does not necessarily lead to competitive advantage, have a competitive advantage, the product also is not necessarily a country's comparative advantage, which includes technical progress andmonetary factors both tend to be back. The concept of competitive advantage in a certain extent has a progressive and innovative, because it is based on the Angle of modern market to express and describe the advantages of a country's products.译文印度纺织品出口竞争力研究Tully E摘要印度在纺织品生产和出口方面排在世界前列,而且纺织业是印度的最早产生的生产行业之一,在推动其经济发展中起到了重要作用。