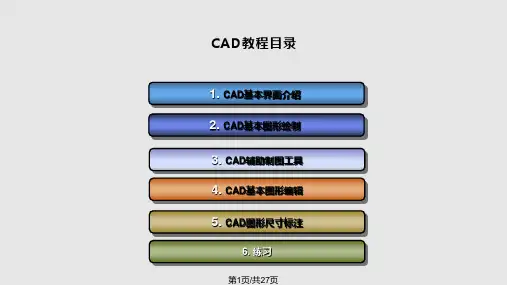
mathcad-培训教材
- 格式:ppt
- 大小:2.04 MB
- 文档页数:67


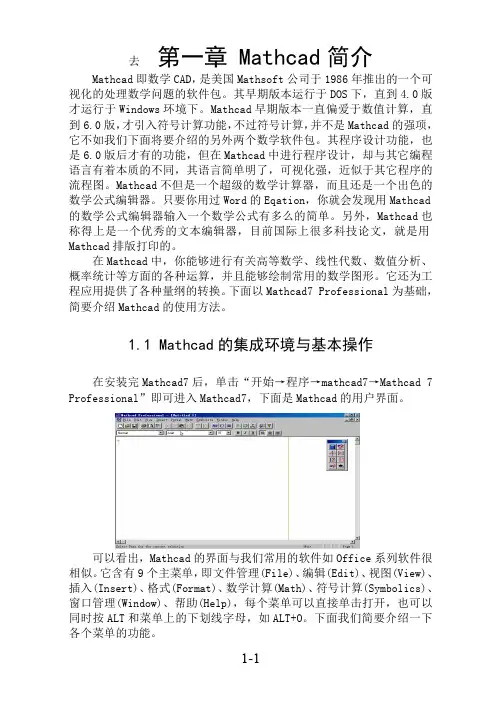
去第一章 Mathcad简介Mathcad即数学CAD,是美国Mathsoft公司于1986年推出的一个可视化的处理数学问题的软件包。
其早期版本运行于DOS下,直到4.0版才运行于Windows环境下。
Mathcad早期版本一直偏爱于数值计算,直到6.0版,才引入符号计算功能,不过符号计算,并不是Mathcad的强项,它不如我们下面将要介绍的另外两个数学软件包。
其程序设计功能,也是6.0版后才有的功能,但在Mathcad中进行程序设计,却与其它编程语言有着本质的不同,其语言简单明了,可视化强,近似于其它程序的流程图。
Mathcad不但是一个超级的数学计算器,而且还是一个出色的数学公式编辑器。
只要你用过Word的Eqation,你就会发现用Mathcad 的数学公式编辑器输入一个数学公式有多么的简单。
另外,Mathcad也称得上是一个优秀的文本编辑器,目前国际上很多科技论文,就是用Mathcad排版打印的。
在Mathcad中,你能够进行有关高等数学、线性代数、数值分析、概率统计等方面的各种运算,并且能够绘制常用的数学图形。
它还为工程应用提供了各种量纲的转换。
下面以Mathcad7 Professional为基础,简要介绍Mathcad的使用方法。
1.1 Mathcad的集成环境与基本操作在安装完Mathcad7后,单击“开始→程序→mathcad7→Mathcad 7 Professional”即可进入Mathcad7,下面是Mathcad的用户界面。
可以看出,Mathcad的界面与我们常用的软件如Office系列软件很相似。
它含有9个主菜单,即文件管理(File)、编辑(Edit)、视图(View)、插入(Insert)、格式(Format)、数学计算(Math)、符号计算(Symbolics)、窗口管理(Window)、帮助(Help),每个菜单可以直接单击打开,也可以同时按ALT和菜单上的下划线字母,如ALT+O。


《Mathcad应用》课程教学大纲课程编号0103606501826115课程名称(中文)Mathcad应用(英文)Application of Mathcad software课程基本情况1.学分:2+2学时:60 (课内学时:20 实验学时:40 )2.课程性质:专业课3.适用专业:理学适用对象:本科生4.先修课程:《高等数学》、《windows95操作基本知识》5.首选教材:《Mathcad 2000实例教程》黄亮等编中国电力出版社2000.8 二选教材:参考书目:《Mathcad7. 0入门及工程应用》宋征等编人民邮电出版社1999.126.考核形式:上机7.教学环境:课堂与机房课程教学目的及要求教学目的及要求:主要介绍目前非常流行的数学计算软件Mathcad专业版的使用方法。
详细介绍Mathcad软件的各种功能,如向量矩阵的计算、统计计算、图像处理、求解方程、符号的解析计算、编程等等。
要求学生通过学习掌握用Mathcad进行各种计算,二维,三维绘图,方程求解,函数拟合方法等基本操作。
了解:用Mathcad编程,制作动画和Mathconnex使用方法。
课程内容及学时分配(—)Mathcad 介绍(4 学时)1.Mathcad7. 0的特点及主要功能2.Mathcad操作界面3.Mathcad X作表处理重点:基本界面功能的了解(二)Mathcad使用基础(4学时)1.表达式和变量2.文本处理3.Mathcad的计算特点及计算控制4.向量矩阵5.Mathcad的运算符6.Mathcad中的单位和量纲重点:基本使用方法(三)使用Mathcad的函数库(2学时)1.内部函数A分2.计算方程的解析计算课程内容及学时分配4.计算方程的解析解5.矩阵的解析变换6.傅里叶变换、拉普拉斯变换及Z变换7.解析运算的最优化重点:Symbolics菜单的使用难点:操作中的各种规定(九)使用Mathcad编程(4学时)1.定义一个程序2.条件语句3.循环语句4.程序执行的流程控制5.程序之间的调用6.错误处理重点:怎样设置编程语句难点:如何编写(十)Mathcad高级实用技巧(8学时)1.Mathcad中的动画2.使用MathConnex软件3.在MathConnex中使用组件4.ConnexScript 语言参考重点:怎样实现动画,怎样使用MathConnex软件。
A Mathcad PrimerThis document will summarize many of the features of Mathcad 11 and how these features are used to solve physical chemistry problems. It is not a replacementfor the Mathcad Reference Guide by Mathsoft®.You need to enable Print Layout View in Word (View, Print Layout).You can CTRL-click any topic to go to any section or you can scroll down.ContentsThe Mathcad Window (2)Entering Text (3)Equations and Variables (3)Important Warning about Typical Scientific Symbols (6)Selecting and Editing (7)Variable Names (7)Units (8)Defining Your Own Units (9)Easy Graphs (10)Range Variables and Graphs (12)Zoom and Trace Functions in a Graph (14)Data and Data Files: Excel Data (15)Entering Data into Mathcad (16)Copying Data from EXCEL (18)Numerical Calculations (18)Numerical Roots of Equations (19)Symbolic Calculation (20)Symbolic Integration (21)The Assume Keyword (22)Partial Derivatives (23)Solving Equations (23)The Mathcad WindowWhen you start Mathcad, the screen should appear as shown below. A series of menu items are listed, and underneath the menu are toolbars. An ancillary toolbarcalled Math appears to the right. In this document, menu commands will be noted as Item 1, item 2, and so forth. As an example, the print preview command would be typed as: File, Print Preview . To execute the command you would point to File, then select Print Preview from the drop-down list.If you do not see all the items in the graphic, go to View, Toolbars , and select the toolbars that you wish to see. Your first assignment is to check the various menu items to see what they contain.The page boundary shows you what will fit on a normal page when the document is printed. Material to the right of the boundary will print on the next page. Menu ItemsToolbars Math toolbarInsertion pointPage boundaryStyle boxThe toolbar under the menu is the Standard toolbar and contains icons for: New document, Open document, Save, Print, Print Preview, and so on. These icons have tooltips (little tags that inform you of their functions). If you forget what an icon does, hold the mouse pointer over it for a second and the tooltip will appear.Note the red crosshair in the document window. This is the insertion point in Mathcad and any typed information will appear at this point. Clicking the mouse in a new location moves the insertion point (try it!).Entering TextIn Mathcad, text is different from mathematics. Text information and math information have their separate fonts, colors, and styles. The formatting toolbar (the one right above the actual document) has a style box that informs you of the type of information that is being typed or selected in the document. The default style is variables so when you type, Mathcad assumes you are typing mathematics.If you wish to type text, first type a quotation mark, “. The qu ote opens a text region in Mathcad and you can type any text that you wish. Click anywhere outside the text region to stop.Any good Mathcad document should contain text to annotate and explain the calculations. You can, and should, change the appearance of text to distinguish it from math. You can do this by typing Format, Style. This brings up the format dialog box. To change the text font, choose Normal and click modify. Click thefont box and you may change the font style, size, and color. A good choice is to make text font a different color than the black font used for variables.Equations and VariablesMathematical expressions are typed in the usual way, using the +, –, /, and *keys for addition, subtraction, division, and multiplication. Exponents areentered with the ^ key. You must remember to include the multiplication symbol in all expressions. Mathcad will interpret xy as a new variable, and not as the product of x and y. Here we type 5*12= and you can see the result is 60. If wetype 512= Mathcad interprets the second statement as the number 512 as you can see from the result.⋅60=512=512512Forgetting the multiplication symbol (*) is the most common source of headachesfor Mathcad beginners.A convenient way to see multiplication is to go to Tools , Worksheet options ,Display . If you make the multiplication symbol a dot, large dot, or ⨯, it will be hard to miss.You must first define a variable before you use it in a calculation. In theexample below, x is not defined at the beginning and is highlighted by Mathcad in red (an error):25x ⋅-=x no result because x is not defined.x 14:=define x x 25x ⋅-126=result of functionTo define a variable, use the := operator. You enter this by typing a colon. The := is an assignment operator in Mathcad; it states that the variable on the left is assigned the value or expression on the right. You cannot define anexpression on the right side of this operator; 14 := sin(x) will produce an error.Some typical uses: Try the assignment operator by typing x:12.5 and observe theresult. Common mathematical functions can be found by using the function icon, f (x ) on the toolbar. Try defining a new variable to be the cosine of y and set y equal to 15.x 12.5:=w e assign x a value Sine sin x ():=We define Sine as sin(x)Sine 0.066-=We print SineTo evaluate an expression, use the “normal” equals sign just as you would in normal mathematics.y x ()27x 2⋅x +:=define a function x 12.5:=set x y x ()4222.286=evaluate y x 195:=set new x y x () 1.027106⨯=evaluate ya faster and easier approach; the function isalready defined as y(x) so w e can place anyvalue of x into the expressiony 12.5()4222.286=y 195() 1.027106⨯=Notice that the function is always on the left side of the assignment operator. An expression such as 12:x = makes no sense to Mathcad.Exercise: Define a variable to represent the distance as a function of time. Thedistance follows this expression: initial_position + 11.5*time + 1.2*time 2.Set the initial position to 255 and calculate the position at time = 2, 12, 25.Exercise: Harmonic motion follows a sinusoidal pattern:position = amplitude*sin(time) + phase.Define a variable to represent the position as a function of time when theamplitude is 1.5 and the phase is zero. Calculate the position at time = 0, 12, 24, 44.What change to position occurs if the phase changes?Important Warning about Typical Scientific SymbolsMathcad has a built-in set of units that are used for cancellation and obtaining the units of an answer. This is a very powerful concept but sometimes these units can cause confusion when you try to make them variables. A common example is g. We all like to use g for grams, but Mathcad has already defined this symbol as the acceleration due to gravity:This problem also occurs for T. We like to use T for temperature, but itrepresents Tesla, the built-in unit for magnetic flux density. You can use T in this manner: T = 325 K, where K is the symbol for kelvin temperature. Another problem exists for the letter e . We typically use e as the charge on an electron but in Mathcad, e represents the base of natural logarithms (e = 2.781828….).Mathcad also writes e as exp as in e x = exp(x). Do not use g for gramsAtom ic m ass of sulfur is 32 gram sm 32g⋅:=M athcad interprets g as 9.8 m/s 2m 313.813m s2=Not the m ass of sulfur!m 32gm⋅:=m 0.032kg =The correct answ er in kilogram s An alternative m ethodg gm :=Redefine g as gram sm 32g⋅:=m 0.032kg =The correct answ er in kilogram sSelecting and EditingMathcad expressions can be edited using the standard windows methods for cut, copy, and paste. Before editing part of an expression, the appropriate section must be selected. To select an area, click inside the expression; the red crosshair will become a blue selection cursor that looks like ⎦, or ⎣. The small “foot” on the cursor indicates which way the data will be selected. ⎣ will select to the right, while ⎦ will select to the left. Use the insert key to change the direction. The spacebar repeatedly expands the selection, and the → and ← keys move it right and left respectively. Try it on an expression to see how these keys workThe spacebar changes the selection by parts of an expression (pieces connected by +, –, *, /), while the arrows move character by character. It is easier toobserve than to explain. Build and expression such as 2():27y x x =+ and try it.Once a part of an expression is selected, you can cut it, delete it, or copy it. You can also edit it by substituting different operators. Text is edited in the same manner. Any selected item can be pasted into another document such as a Word document or an Excel spreadsheet. All of the Mathcad work in this primer was pasted directly from Mathcad into Word. Variable NamesMathcad allows almost any name for a variable as long as the name is not a predefined function. Some example variables are:x y velocity temperatu re initial_concVariable names can be any combination of alphanumeric characters. These names should begin with a letter and should not contain symbols except for theunderscore( _ ), percent ( % ), or a prime( ` ). You cannot use unit symbols or built-in functions as names (to see a list of built-in functions, click the f(x) on the toolbar). Some examples of variables are:This_is_a_variable okayMass_proton okayVariable_4 okayV okay1st _value invalid; begins with a number.Sin(X) invalid; sin is a built-in function.A list of predefined functions can be found by clicking the f(x) icon on the toolbar.As simple example of variables, we calculate P from the ideal gas law. Define some values and evaluate the pressure.V 12:=R 0.0821:=T 225:=n 2.5:=P n R ⋅T⋅V :=P 3.848=The variables are defined in the first line; P is then defined (as nRT/V) and evaluated. If any variable is left undefined, the undefined quantities will be in red (an error). In this example, we delete the definition for V, therefore P cannot be calculated.R 0.08205:=T 225:=n 2.5:=P n R ⋅T⋅:=V =PYou can put a subscript as part of a variable name by using the period character on the keyboard . If we type v.initial (that’s v period initial), we get initial v in the document. Subscripted variable names can be quite useful. UnitsBy default, Mathcad will use the SI unit system for all calculations. You canchange this in the Tools , Worksheet options , Display command. Go to the Units tab and choose a system of units or set it to none. You enter a unit for any quantity by multiplying a numerical value by the unit. If you want a volume of 15 liters, you type V:15*L. The previous gas law example, with units is:V 15L ⋅:=R 0.08205L atm ⋅molK ⋅⋅:=T 225K ⋅:=n 2.5mol ⋅:=P n R ⋅T⋅V :=P 3.118105⨯Pa =Mathcad automatically cancels units and produces the result in Pascals (the default SI unit for pressure). If you prefer a different unit for the result, click the expression and a black box will appear after the Pa unit. Double-click this box and a set of possible units will be shown; you can choose the units you want. Here we change the answer to atmospheres.P n R ⋅T⋅V :=P 3.077atm =An easy way to see the defined units in Mathcad is to click the measuring cup on the toolbar. Choose any type of quantity (length, mass, etc.) and Mathcad will display the possible units.Defining Your Own UnitsMathcad does not contain all possible units for all possible quantities. For example, Mathcad does not have picometers in its units database. You can define units such as picometers in your Mathcad document.Defining a unit in Mathcadpm 1012-m ⋅:=Note that it is 10–12 * m! Don’t forget the multiplication operator . Mathcad alsohas a table of reference data that contains physical constants. These data can be copied and pasted into any Mathcad document. Click the Resource center icon on the toolbar (it looks like a book); click on quicksheets and reference tables; click reference tables and then physical constants. The Resource center is also anexcellent source for help, and the quicksheets are quite useful to show you how to do certain calculations in Mathcad.When you use units in calculations, Mathcad checks the units and will not work with incompatible units. You will get an error message.R 0.08205L atm ⋅molK ⋅⋅:=V 15L⋅:=New_Vol :=V R +The bar is the preferred unit of pressure, but Mathcad does not have the bar in its units database. You must define it as we did for picometers earlier. Bydefinition: 1 bar ≡ 105 Pa.Easy GraphsMathcad has a method for developing an xy graph of any simple function. Toillustrate the method , let’s graph the sine of x. Start a new document and put the cursor where you want the graph. From the menu, choose Insert, Graph, XY Plot . You will see an empty graph with black boxes (placeholders). You can cycle throughType x in the placeholder on the x-axis and then type sin(x) in the box on the y-axis. The graph will change to:10010101sin x ()xMathcad makes a guess at the limits, in this case: –10 to +10.Plot the function 32415y x x =-+. From the menu, choose Insert, Graph, XY Plot . You will see an empty graph. Type x in the x-axis box, and type the expression, 32415x x -+, in the y-axis box:10010200010001000x 34x 2⋅-15+xOne more graph example. We can define a function and then graph it by placing thef(x) in the y-placeholder:f x ()7x ⋅0.25x ⋅+2-:=0510100102030f x ()xIf the range of values on the x or y axis is not appropriate, you can change them by clicking the graph. Values in placeholders will show for the maximum and minimum x and y ranges. In the example, the maximum y is 22.636.51010010203022.6362-f x ()100xClick inside any value and edit it to your liking. Here the maximum y has been changed to 10 and the maximum x to 5.02450510f x ()xIf you double-click the graph, a dialog box will open that allows you to change any properties of the graph including whether it will be displayed as lines,points, or a combination of both; the color of the lines, labels for the axes, and a graph title. For the title to show, you must be sure to check the show title box (don’t ask why).Range Variables and GraphsWhen we need to have numerous values for a variable in Mathcad, we use range variables. Range variables are also used to generate graphs of scientific data. A range variable is a variable that has different values based on an index. For example, we may have three different pressures: P1, P2, and P3 where P1 is 100 bar, P2 is 220 bar and P3 is 75 bar.In Mathcad, enter a range variable by typing the variable name, then type [ and then the index. The [ is a definition for a subscripted range variable. This is completely different than the subscripted variable we discussed earlier (obtain by using a period). As an example, let’s produce a set of pressures that go from 1 to 12 atm in unit steps. First we define the range, i.Type i:1;12 (that’s i colon 1 semicolon 12)Now define the pressures, type P[i := iYou should see:i112..:=P ii :=To see that this works, type P = to list the values of P.What if we did not want to increase the pressure in unit steps, but we want increase it by steps of 0.25 starting at 1? In this case, we need to defineanother variable. We cannot change th e range of i to be 1, 1.25, 1.50…because iis the index for P. We can have P1, P2, or P3, but we can’t have P1.25. One way around this problem is shown below. We define i and an increment that depends on i.i112..:=incrii0.25⋅:=P i1incri+:=The new range variable (incr) changes the increment values to 0.25 times the index.Suppose you want a range of x-data for a graph that starts at 12.5, increments at 0.01, and ends at 22. You enter this as: x colon 12.5 comma 12.51 semicolon 22.defining a rangexdata12.512.51,22..:=Note that the second number (12.51) is the next value in the sequence and it is not the increment to be added to the initial value.We can also produce variables that are functional forms. For instance, we can define a range of pressures and then define a variable such as V(P) that depends on the pressure range. This method of using range variables is shown next. In this example, we use the pressure itself as the range variable. We define thecompressibility in terms of both pressure and temperature, and that allows us the option of evaluating and plotting multiple functions simultaneously.Compressibility factors for ammonia as a VDW gasamm onia dataR 0.08205:=pressure range a 4.281:=p 15,500..:=b 0.037847:=Z as function of p for a van der Waals gas Z p T ,()11R T ⋅b aR T ⋅-⎛ ⎝⎫⎪⎭⋅p ⋅+a R 3T 3⋅2b ⋅a R T ⋅-⎛ ⎝⎫⎪⎭⋅p 2⋅+:=0100200300400500211Z p 1379,()Z p 300,()Z p 500,()pNote how Z(p,T). The pressure is defined in the range and we plot three different temperatures: 1379, 300, and 500 K. Multiple arguments on the y-axis are entered and separated with a comma. To enter these functions we would type: Z(p, 1379), Z(p, 300), Z(p, 500) into the y placeholder on the graph.Zoom and Trace Functions in a GraphMathcad has built-in zoom and trace capabilities for graphs as shown in the next figure. On a Mathcad document, reproduce the work to produce the previous graph. Right-click the graph and choose either Trace or Zoom from the context menu.Zoom: Move the Zoom dialog box to the side. Click and hold at the point in the graph that you wish to begin the Zoom; drag a rectangular box until it encompasses the region you wish. Finish by clicking Zoom or OK in the dialog box.Trace: Move the Trace dialog box to the side. Click anywhere in the graph; the points will show in the Trace box. If the Track Data Points box is checked, Mathcad will skip from one data point to the next. It will not provide data (interpolate) between the points.Data and Data Files: Excel DataMathcad data are held in arrays and arrays have a range associated with them.Often we need to get scientific data into or out of Mathcad. Fortunately, Mathcad has built-in functions for this. Data can usually be saved as a text (ASCII) file from another program (such as EXCEL). In this example, the data were saved from a Word file (Saved a text file, not as a Word document!). To read the data file, we first define a variable for the data. Usually we have x and y data so thisvariable will have two columns of data; this is called a matrix. A typical matrixof data is:371.2 4.9217To add our data to Mathcad, click the Insert Data File Input, and then choose the file format (usually Excel). Click Browse to find the data file. Then click finish. Put a variable name in the placeholder on the Mathcad screen and you're done. When done, you should have something like this:The variable PZ is defined as the data set given by the url, C:\..\co2.txt. The variable PZ contains the pressure and compressibility data for the gas. Toseparate the pressure and compressibility data, we extract the columns of the data matrix. P is in the first column (Mathcad labels it as zero) and thecompressibility is in the second column (Mathcad labels it as one). To extract each column use the Extract Column command from the matrix palette or use CTRL6. You need to type in the column number that you want to extract. We define P as the first column of our data matrix and z as the second column:P PZ 0〈〉:=z PZ 1〈〉:=Now we have two variables of data and we can work with them just as we did for any other range of data. A graph of the data is:z PZ1〈〉:=02004006000.40.60.8z PEntering Data into MathcadOften we need to enter data directly into Mathcad. Data are held in arrays and arrays have a range associated with them. First, define a range variable (j in this case).Then type P[j :Type in the first number followed by a comma; repeat for each number. The last line shows that P 3 does equal 7.j15.. :=Pj157912:=P 37 =Another method of entering data is to define a variable as a matrix. For example, we can define X as a matrix of five elements in this manner: Type X : to produce the assignment operator; then choose Insert , Matrix from the toolbar. In the X ⎝⎪⎪⎪⎪⎪⎭:=You can now type values into the matrix.Copying Data from EXCELThe easiest method to provide Mathcad with EXCEL data is to define a variable such as New_data (you can use any name you choose): Open EXCEL and highlight the data range in EXCEL.Copy the data. In Mathcad, place the cursor on the placeholder for New_data and choose Edit, Paste from the menu (or right-click and chose Paste ). The selected data will now be in Mathcad. You can set up x and y variables in Mathcad and then paste the x data from EXCEL and then select and paste the y data from EXCEL.Numerical CalculationsMathcad can solve many problems numerically using common algorithms. As you have already seen, numerical computations are trivial:Integrals are evaluated using a modified Romberg algorithm, a method that is 0x x 5⎛⎜⎠d 121.5=Numerical derivatives are also easily obtained:x 3:=x sin x ()d d 0.99-=Numerical Roots of EquationsRoots of equations can be obtained from the root function:root(f(x),x)The root function obtains roots by successive approximation and it needs aninitial guess for the root. This guess can be supplied after graphing the function and observing where the function crosses the x-axis. As an example, we will find the roots of: 32()317005f x x x x =--+.Roots of the equationf x ()x 331x 2⋅-700x ⋅-5+:=Graph the function to estimate roots. You w ill need toadjust the lim its on the x axis to see all the roots. A cubic equationshould have three roots (although some roots m ay be im aginary). I n thegraph, the three roots are easily seen. The roots are at -15, 0, and 45(all values are approxim ate).20020404.1042.10402.104f x ()xNow we can find the exact roots:Find the negative root:x 15-:=first guess a rootanswer root f x ()x ,():=answer 15.169-=Find the largest root:x 40:=first guess a root answer root f x ()x ,():=answer 46.162=Warning: Always graph the function or try many initial estimates to be sure you have the correct root.Exercise: Find the third root of the function.Mathcad can also find the roots by symbolic calculation. In this example, we use the same function, 32()317005f x x x x =--+, but we do not write it as adefinition (that is, we leave out the f (x ) part). Select any x in the expression, and then select Symbolics, Variable, Solvex 331x 2⋅-700x ⋅- 5.+15.168870576389592537-7.140599615767146722610-3⋅46.161729976773825390⎛ ⎝⎫⎪⎪⎪⎭Note the decimal point after the 5 in the expression. Without a decimal number, Mathcad will solve analytically without substituting numbers into the expression. For numerical problems, this can be cumbersome.Exercise: Remove the decimal point after the 5 and solve to see the result.Also, note that Mathcad provides all three roots by this method. Symbolic CalculationA powerful feature of Mathcad is the ability to do symbolic algebra and calculus. The commands are located in the Symbolics menu on the toolbar and also on the Symbolics palette (the graduation hat icon). Symbolic calculations can either be static or “live”. A live symbolic calculation is automatically updated when a change is made to the document; a static calculation is not updated. Static symbolic work is accomplished by using the commands on the symbolics menu; live symbolic calculation is accomplished using the symbolics equal sign, →.As an example, let’s find the derivative of sin(5x) using the st atic method. Type sin(5x) into a worksheet (don’t forget the * for multiplication), select the x, and then click Symbolics, Variable, Differentiate . The result, 5cos(5x) will appear below your expression. Another option can be set to improve readability. Click Symbolics, Evaluation Style , and check the box that says Show Comments . Repeat the sin(5x) example and note the difference.If we use live symbolics to perform the same derivative, we would first enter the derivative symbols from the calculus palette (the one with the integral). Fill inthe placeholders with sin(5x) and x. Type CTRL . (Control period) and you should see the live symbolics arrow (this is equivalent to an equals sign). Clickanywhere and the result, 5cos(5x) should appear. The difference in live symbolics is that any change is immediately reflected in the result. Change the 5 to 17 and observe.x sin 17x ⋅()dd 17cos 17x ⋅()⋅→Symbolic calculations from the menu do not update in this manner as you can show for yourself.Symbolic IntegrationSymbolic integration works in the same manner as differentiation. We can evaluate both definite and indefinite integrals. Use the integral symbol from the calculus palette.x sin x ()⎛⎜⎠d cos x ()-→15x sin x ()⎛⎜⎠d cos 5()-cos 1()+→note the change to num eric form at w hen w e use decimal digits1.05.0x sin x ()⎛⎜⎠d .256→Mathcad can also evaluate double and triple integrals: y x x y 2⋅⎛⎜⎜⎠d ⎛⎜⎜⎠d 16x 2⋅y 3⋅→andψr θ,φ,()e7-r⋅cos θ()⋅:=02π⋅φ0πθ0∞r ψr θ,φ,()2r 2⋅sin θ()⋅⎛⎜⎠d ⎛⎜⎠d ⎛⎜⎠d 11029π⋅→Recall that r 2sin θ()⋅ drd θd φis the volum e element in spherical coordinatesNotice that in the second example, the function was defined and then substituted into the integral.The Assume Keyword (Very Important)Sometimes, we know something about the problem that Mathcad does not know. Forinstance, the integral2ax e dx ∞--∞⎰is not defined for a < 0. If we put thisexpression into Mathcad, we get this result:This is Mathcad’s way of telling you it cannot evaluate the expression; theresult is the same as the original. We must inform Mathcad that a > 0, and we use the assume keyword for this. Write the integral and then press CTRL SHIFT . (Control shift, period, pressed simultaneously) to produce the symbolics equal sign and a placeholder. You can also use the → from the symbolics palette if you prefer. In the placeholder, type assume, a>0, then click outside the integral to see the result.∞-∞x ea -x2⋅⎛⎜⎜⎠d assume a 0>,π2 ⎝⎪⎭a 12⎛ ⎝⎫⎪⎭→Mathcad sometimes has problems with the assume command and multiple integrals.R Z r ,()2Z r ⋅a o-⎛ ⎝⎫⎪⎭e Z -r⋅⋅:=a o⎛⎛o ,02π⋅φ0πθ0∞r R Z r ,()2r 2⋅sin θ()⋅⎛⎜⎠d ⎜⎠d ⎜⎠d assume a 0>Z 0>,→The integral can be evaluated if it is written as a product of three integrals:Partial DerivativesMathcad easily evaluates partial derivatives. In fact, Mathcad always assumes it is taking the partial derivative.x x y ⋅∂∂y→Partial derivatives:define a function of x,y,zf x y ,z ,()5x 3⋅y 2⋅6z3⋅+:=partial derivative w ith respect to zz f x y ,z ,()∂∂18z2⋅→partial derivative w ith respect to y yf x y ,z ,()∂∂10x 3⋅y⋅→partial derivative w ith respect to xxf x y ,z ,()∂∂15x 2⋅y2⋅→The partial derivative symbol is obtained by Math , Options , Display , Derivative .Solving EquationsMathcad can symbolically solve a single equation for an unknown or it can solve a set of equations for multiple unknowns. These calculations are done in solve blocks , a construct that is defined in Mathcad by the words given and find . Asolve block always begins with the word given . This is followed by the equation or equations to be solved. The result is evaluated in the find command. Solve blockuse only the symbolics equal sign typed as CTRL =. It appears as a bold equal in the document. A typical example is:x x y ⋅d d y →find the m axim um in a functionR Z r ,()2Z r ⋅a o -⎛ ⎝⎫⎪⎭eZ -r⋅⋅:=a odefine a functionGiven Begin the solve blockthis is a symbolic equals sign typed by CTRL =rR Z r ,()dd 0Find r ()3a o Z⋅→End of solve block。

1. MathCAD2000的基础知识MathCAD 是由美国Mathsoft 公司于1986年推出的优秀数学软件,它集科学计算、图形和文本二维排版编辑功能于一身,是数学、物理、力学和机械工程等学科强有力的二次开发软件。
MathCAD 的科学计算包括:三角与代数、级数与极限、微分与积分、矢量与矩阵、复变函数、数理统计、插值拟合、求解非线性方程组和微积分方程、最优化技术以及常用工程变换等。
图形功能包括:根据表达式绘制函数的直角坐标或极坐标线图、曲面图和等值线图、柱面图和散点图以及制作动画、图形文件和矩阵之间的数字化读写以及编辑。
科学计算可以是数值计算或者在可能的条件下给出解析结果(称为“符号运算”)。
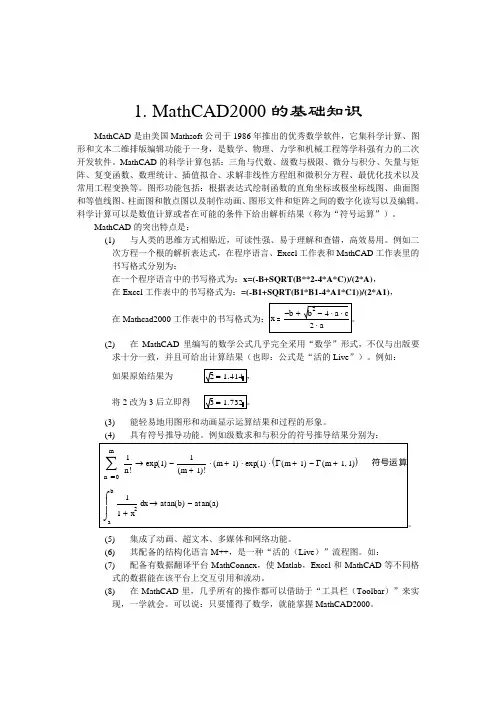
MathCAD 的突出特点是:(1) 与人类的思维方式相贴近,可读性强、易于理解和查错,高效易用。
例如二次方程一个根的解析表达式,在程序语言、Excel 工作表和MathCAD 工作表里的书写格式分别为:在一个程序语言中的书写格式为:x=(-B+SQRT(B**2-4*A*C))/(2*A), 在Excel 工作表中的书写格式为:=(-B1+SQRT(B1*B1-4*A1*C1))/(2*A1), 在Mathcad2000(2) 在MathCAD 里编写的数学公式几乎完全采用“数学”形式,不仅与出版要求十分一致,并且可给出计算结果(也即:公式是“活的Live”)。
例如: 如果原始结果为将2改为3后立即得(3) 能轻易地用图形和动画显示运算结果和过程的形象。
(4)具有符号推导功能。
例如级数求和与积分的符号推导结果分别为:(5)集成了动画、超文本、多媒体和网络功能。
(6) 其配备的结构化语言M++,是一种“活的(Live )”流程图。
如:(7) 配备有数据翻译平台MathConnex ,使Matlab ,Excel 和MathCAD 等不同格式的数据能在该平台上交互引用和流动。
(8)在MathCAD 里,几乎所有的操作都可以借助于“工具栏(Toolbar )”来实现,一学就会。

mathcad教程Mathcad是一种强大的数学建模和数据分析软件,用于求解复杂的数学问题和执行工程计算。
下面是一份简要的Mathcad教程。
首先,安装Mathcad。
你可以从官方网站下载Mathcad的安装程序,然后按照安装向导的指示完成安装。
启动Mathcad后,你将看到一个空白的工作区。
在这个区域内,你可以输入数学表达式、定义变量、进行计算等操作。
在Mathcad中,你可以使用基本的数学符号进行计算,比如加法、减法、乘法、除法等。
你只需要在工作区内输入相应的表达式,然后按下回车键进行计算。
你还可以在Mathcad中定义变量。
使用“:=”操作符可以给一个变量赋值。
例如,如果你想定义一个变量x,可以输入“x:=2”,然后按下回车键。
Mathcad还提供了丰富的函数库,可以进行复杂的数学计算。
你可以使用内置的函数,比如sin、cos、log等,也可以自定义函数。
输入函数名和参数,然后按下回车键进行计算。
在Mathcad中,你可以进行符号计算,比如求解方程、求导、积分等。
使用“solve”函数可以求解方程。
例如,如果你想求解方程“x^2 - 4 = 0”,可以输入“solve(x^2 - 4 = 0, x)”进行求解。
Mathcad还支持绘制图形。
你可以使用“plot”函数绘制函数图像,也可以使用“scatterplot”函数绘制散点图。
输入相应的函数或数据,然后按下回车键进行绘图。
此外,Mathcad还支持数据分析。
你可以导入数据文件,进行统计分析、回归分析等操作。
使用“worksheet”可以新建一个工作表,然后输入数据和相应的分析函数,按下回车键进行计算。
在Mathcad中,你可以使用注释和文本框来添加说明和注解。
使用“//”可以添加注释。
使用文本框工具可以添加文本框,然后在文本框中输入文字。
最后,你可以将Mathcad文档保存为不同的格式,比如Mathcad文档、PDF文件、Word文档等。
MathcadPrime3.0-应用指南Mathcad Prime 3.0 - 应用指南概述本课程介绍有关Mathcad Prime 的基础知识,同时采用清晰直观的说明与示例详细讲解Mathcad Prime 的各种功能。
学习本课程后,您将对Mathcad Prime 的众多关键功能有所了解,从而可以尽快使用该产品。
您需要针对每一个主题完成Pro/FICIENCY 技能测评。
这些问题会帮助强化您对这些课程主题的理解。
课程目标打开并保存Mathcad 文件浏览Mathcad 工作区标识数学和文本区域并为其设置格式开发和编辑数学表达式定义、计算和使用变量为表达式逆向赋值定义和计算用户定义的函数和内置函数定义、计算和使用值域变量定义并使用矢量和矩阵第一章入门模块概述:在本模块中,您将学习如何打开Mathcad 和保存Mathcad 文件。
目标:完成此模块后,您将能够:打开Mathcad 文件。
保存Mathcad 文件。
1-1打开Mathcad开始前,您必须先学习以下操作:打开Mathcad 并显示空白工作表。
图 1 –空白Mathcad 工作表打开新的Mathcad 工作表。
打开现有的Mathcad 文件。
图2 –打开新的工作表或现有Mathcad 文件打开Mathcad 和Mathcad 文件1.任务 1. 打开Mathcad。
1.单击开始> PTC Mathcad Prime 3.0。
Mathcad 即会打开并显示空白工作表。
图 1 2.任务 2. 打开新的Mathcad 文件。
1.单击“求导”(Prime) 按钮。
图 2 2.单击“新建”(New) 。
将打开新工作表选项卡。
图 33.任务 3. 打开现有的Mathcad 文件。
1.单击“求导”(Prime) 按钮,然后单击“打开”(Open) 。
图 42.随即显示―打开‖(Open) 对话框。
选择相应的Mathcad 文件并单击“打开”(Open)。
MATCHCAD 软件入门培训目 录一、MATCHCAD工作区域二、定义变量三、构建表达式进行简单计算四、格式调整及表格引用五、资源利用1一、MATCHCAD工作区域1一、MATCHCAD工作区域1“标准”工具栏提供到许多菜单命令的快速访问。
“格式化”工具栏含有滚动列表和按钮来为等式和文本指定字体特性。
“数学”工具栏中的每个按钮可打开另一个运算符或符号的工具栏。
二 定义变量键入冒号 [:]或单击“计算器”工具栏上的来插入定义符号1.0 要定义B为 1200mm,键入:B:1200mm。
2.0 定义函数下标时,输入”.” ,定义函数上标时,输入“^”或输入下标时单击“格式化工具栏”的上下标字母。
≈例如:要定义 W为 1.58kPa,键入:“W . 0 : 1.58 kPa”要定义 A为 1.5m2,键入:“A:1.5 m ^ 2”三 构建表达式进行简单计算一、可以在 Mathcad 工作表中任意位置放置数学表达式1. 单击以确定十字线位置。
2. 键入数字、字母和数学运算符,或通过单击 Mathcad 数学工具栏上的按钮来插入它们,从而创建数学区域。
(在默认设置下,Mathcad 将在十字光标处所键入的任何内容当作数学表达式)二、希腊字母有两种方式输入希腊字母:1,点击希腊字母图标2,键入希腊符号的罗马等价符号然后按下[Ctrl] G例如,要输入φ,则按下f [Ctrl] G。
三 构建表达式进行简单计算三、插入运算符1.单击空白区域并单击“计算器”工具栏上的 或直接键入[+]。
将出现带有两个占位符的加号。
2. 在第一个占位符中输入 2。
3. 在第二个占位符中单击或按下 [Tab] 以移动蓝色编辑线,并输入 6。
4. 按 [=] 或单击“计算器”工具栏上 的 以获取结果。
四、构建表达式请键入以下式子:五、键入名称和数字默认输入是数字区按空格键转成文本区(不可逆)输入:a + b.1 空格 / c^2三 构建表达式进行简单计算五、定义变量时注意:尽可能的避免使用MATCHCAD本身自带的单位符号进行定义。