Deposition and Aggregation of Au at the Liquid-Liquid Interface
- 格式:pdf
- 大小:652.12 KB
- 文档页数:4
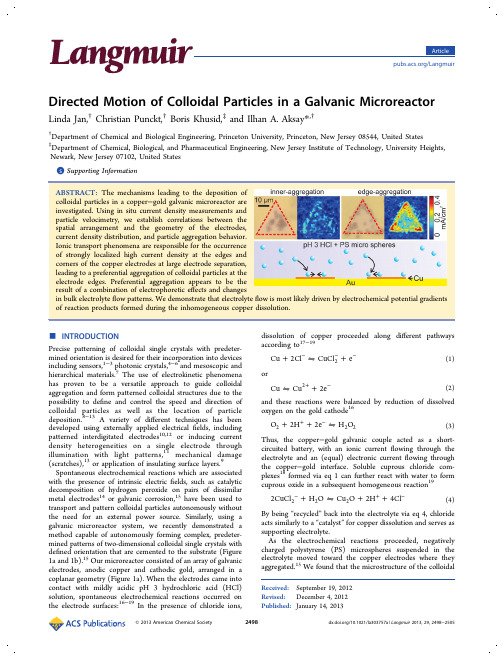
Directed Motion of Colloidal Particles in a Galvanic Microreactor Linda Jan,†Christian Punckt,†Boris Khusid,‡and Ilhan A.Aksay*,††Department of Chemical and Biological Engineering,Princeton University,Princeton,New Jersey08544,United States‡Department of Chemical,Biological,and Pharmaceutical Engineering,New Jersey Institute of Technology,University Heights, Newark,New Jersey07102,United States*Supporting Informationflow is most likely driven by electrochemical potential gradientsdissolution.INTRODUCTIONPrecise patterning of colloidal single crystals with predeter-mined orientation is desired for their incorporation into devices including sensors,1−3photonic crystals,4−6and mesoscopic and hierarchical materials.7The use of electrokinetic phenomena has proven to be a versatile approach to guide colloidal aggregation and form patterned colloidal structures due to the possibility to define and control the speed and direction of colloidal particles as well as the location of particle deposition.8−13A variety of different techniques has been developed using externally applied electricalfields,including patterned interdigitated electrodes10,12or inducing current density heterogeneities on a single electrode through illumination with light patterns,11mechanical damage (scratches),13or application of insulating surface layers.9 Spontaneous electrochemical reactions which are associated with the presence of intrinsic electricfields,such as catalytic decomposition of hydrogen peroxide on pairs of dissimilar metal electrodes14or galvanic corrosion,15have been used to transport and pattern colloidal particles autonomously without the need for an external power source.Similarly,using a galvanic microreactor system,we recently demonstrated a method capable of autonomously forming complex,predeter-mined patterns of two-dimensional colloidal single crystals with defined orientation that are cemented to the substrate(Figure 1a and1b).15Our microreactor consisted of an array of galvanic electrodes,anodic copper and cathodic gold,arranged in a coplanar geometry(Figure1a).When the electrodes came into contact with mildly acidic pH3hydrochloric acid(HCl) solution,spontaneous electrochemical reactions occurred on the electrode surfaces:16−19In the presence of chloride ions,dissolution of copper proceeded along different pathways according to17−19+⇋+−−−Cu2Cl CuCl e2(1) or⇋++−Cu Cu2e2(2) and these reactions were balanced by reduction of dissolved oxygen on the gold cathode16++⇋+−O2H2e H O222(3) Thus,the copper−gold galvanic couple acted as a short-circuited battery,with an ionic currentflowing through the electrolyte and an(equal)electronic currentflowing through the copper−gold interface.Soluble cuprous chloride com-plexes18formed via eq1can further react with water to form cuprous oxide in a subsequent homogeneous reaction19+⇋++−+−2CuCl H O Cu O2H4Cl222(4) By being“recycled”back into the electrolyte via eq4,chloride acts similarly to a“catalyst”for copper dissolution and serves as supporting electrolyte.As the electrochemical reactions proceeded,negatively charged polystyrene(PS)microspheres suspended in the electrolyte moved toward the copper electrodes where they aggregated.15We found that the microstructure of the colloidalReceived:September19,2012Revised:December4,2012Published:January14,2013aggregates depended on the location where PS particles aggregated first,and that the location of initial aggregation could be in fluenced by varying the electrode geometry.15When anodic separation s was small (≈20μm),PS particles deposited randomly on the inner region of the copper electrode (inner-aggregation)and formed polycrystalline aggregates at the electrode center through electro-osmotic flow (EOF)and electrohydrodynamic (EHD)flow e ffects.8,20,21Conversely,when s was large (≈80μm),PS particle aggregation initiated from the corners and edges of the copper electrode (edge-aggregation)where the particles aligned with the raised edges of the gold electrode.Such edge-aggregation was found to be necessary for forming highly ordered particle aggregates as shown in Figure 1b.We also showed that the long-range particle transport toward the electrodes was primarily in fluenced by reaction-induced bulk electrolyte flow.15This was demonstrated by employing silica microspheres which have a larger density (2.0g/cm 3)than PS (1.1g/cm 3)that undergo sedimentation and therefore,unlike PS particles which either remain suspended in the electrolyte or are attracted to the copper electrodes,can be used to explore colloidal transport near the gold electrode surfaces.Before they settled down on the electrode surfaces,silica particles migrated toward the copper electrode with the same velocity that was observed for PS.However,after sedimenting onto the gold cathodes they reversed direction and migrated away from the nearest copper electrode.15Reversal of the silica particles ’direction of motion with respect to electric field and ion concentration gradients indicated that long-range particle motion was not due to electrophoresis or di ffusiophoresis,in which case the direction of particle motion would be de fined solely by electric field,ion concentrationgradients,and particle zeta potential,15,22,23but instead the result of bulk fluid flow.However,we did not explain why the spatial patterning of the electrodes a ffected the directed motion of the colloidal particles resulting in di fferent locations of particle aggregation.The goal of this paper is to analyze the interplay between spatial patterning of the electrodes,reaction rates (current density),and bulk fluid motion in fluencing the motion of PS particles resulting in either inner-or edge-aggregation.We first investigate how electrode geometry a ffects the dissolution current density distribution in situ.On the basis of this analysis,we identify a characteristic current density pro file which correlates with edge-aggregation.Through this correlation we determine the potential driving forces for the fluid motion as e ffected by geometry-dependent electrode kinetics and trans-port of electroactive species.A numerical simulation is presented to support our arguments.■METHODSA schematic of our experimental setup is shown in Figure 1a.The galvanic mircoreactor consisted of an array of copper anodes surrounded by a continuous gold cathode.To fabricate the electrodes,we first deposited 10nm of titanium film followed by 100nm of gold film on a silicon wafer using an e-beam evaporator (Denton DV-502A,Denton Vacuum,Moorestown,NJ).A 20−40nm copper film was electrolessly plated onto the gold (using a solution of 1.5g of copper sulfate,7.0g of potassium sodium tartrate,2.0g of sodium hydroxide,and 5mL of formaldehyde in 50mL of deionized (DI)water at 25°C).On top of the copper,we used standard photolithography to pattern photoresist (AZ(R)5214-E,Clariant Corp.,Somerville,NJ)according to our electrode design.Following photolithography,we formed copper “islands ”(copper electrodes raised above the gold electrode)by etching in nitric acid or copper “trenches ”(copper electrodes lowered,see Figure 1a)by depositing an additional gold layer on top of the patterned photoresist using the e-beam evaporator and performing a “lift-o ff”.The electrode pattern used for generation of colloidal crystals consisted of identically sized equilateral copper triangles with edge-length l of approximately 38μm.They were arranged in a “honeycomb ”pattern with an alternating apex orientation (and thus parallel edges)and separated by a distance s ranging from 25to 80μm as shown in Figure 1b,where the copper electrodes are fully covered by the PS particles.Prior to each experiment,the electrodes were etched for 5s in pH 3HCl solution to minimize surface oxide layers.For particle tracking experiments,arrays of copper line electrodes were used.The reaction cell (Figure 1a)was assembled by placing a 7mm inner diameter circular poly(dimethylsiloxane)(PDMS)spacer ring of either ≈650or ≈1100μm thickness on top of the galvanic electrode substrate.To start the reaction,we filled the chamber with pH 3HCl solution and enclosed it with a microscope cover glass.For particle aggregation experiments,we suspended surfactant-free sulfate-decorated PS latex particles (lot 53977A,Invitrogen,Eugene,OR)in the electrolyte solution at concentrations between 0.04and 0.11vol %.Observations were made with bright-field optical microscopy (Zeiss Axioplan 2,Carl Zeiss MicroImaging,Inc.,Thornwood,NY)and recorded using a 12-bit digital CCD camera (Zeiss AxioCam HRc,Carl Zeiss MicroImaging,Inc.,Thornwood,NY).The reaction was terminated by opening the cell,rinsing the substrate with DI water,and blow drying with nitrogen.Tracking experiments with 3.0μm diameter silica particles (Bangs Laboratories Inc.,Fishers,IN)were performed on arrays of 50μm wide copper line electrodes with s ≈310μm in the copper island con figuration.Prior to the experiments,silica particles were centrifuged and resuspended in fresh DI water for 3cycles and diluted to a particle concentration of 0.002−0.005vol %in pH 3HCl electrolyte.In situ images of the particles were recorded at 0.5Hz,and their positions and velocities were analyzed using an algorithm written in house with MATLAB.The centers of tracked particleswereFigure 1.(a)Schematic of the galvanic microreactor (not to scale).Electrodes shown here are of the trench con figuration,where the copper surface is lower than the gold surface.PS,polystyrene;PDMS,poly(dimethylsiloxane).(b)Patterned and crystalline two-dimensional colloidal aggregates adherent to triangular copper electrodes imaged after rinsing and drying of the sample.Particles distributed on the gold substrate have been deposited there during rinsing and drying.Parameters:Copper triangle electrodes (l ≈40μm)with s ≈60μm in trench con figuration,0.11vol %PS particles in pH 3HCl electrolyte.This electrode geometry exhibits edge-aggregation.determined using morphological operations.Experiments were conducted with low particle concentrations to avoid particle−particle encounters,and the algorithm removed particles that were so close to one another that they could no longer be differentiated automatically. To decrease the measurement noise,velocities of the particles measured within a spatial interval of≈8μm were collected and averaged over20s.The error bars shown in the tracking data reveal that scattering in the distance and velocity of particles reflect Brownian motion over the time scale of the measurement((4DΔt)1/2/Δt=0.38μm/s).For dissolution analysis,the topography of copper island electrodes was measured in the manner described by Punckt et al.24Color images of the copper thinfilm were recorded in situ at a frequency of1Hz. The color difference between copper thinfilms of less than30nm thickness and the gold substrate is an approximately linear function of thefilm thickness.Consequently,the time evolution of the topography of the copperfilm can be determined in situ from the color change of the copper electrodes over time.From the temporal changes in the topography of the copperfilm,we calculated the dissolution rate (measured in nm/s)and corresponding current density distribution on the anodic copper surface,assuming that copper dissolution takes place through a one-electron process that involves a cuprous chloride complex(see eq1).17−19This leads us to a lower limit for the actual current density since to a certain degree also two-electron processes occur during copper dissolution.To decrease measurement noise, color data were averaged over several images taken during a period of 5s.Current density measurements could not be performed on the cathode in this manner as color changes there are not related to Faradaic current but rather to deposition of reaction products.24 The electrophoretic mobility of PS and silica particles suspended in pH3HCl electrolyte was obtained using a Coulter DELSA440SX unit (Beckman Coulter,Inc.,Miami,FL).Measurements of mobilities of PS particles were taken at11different positions across a rectangular capillary cell using three detection angles.Particle motilities were found to give an excellentfit to the Komagata equation(R2=0.99for all detection angles),which was used to determine electrophoretic mobility.25The motilities were averaged over all detection angles for two profile runs.The method of O'Brien and White26was used to calculate the particle zeta potential from the measured electrophoretic mobility.We neglected surface conductance because of the relatively low ionic strength(1mM)of our system.PS particles in pH3HCl solution had a zeta potential of−44±3mV.Profile measurements could not be conducted with the silica particles because they settled over the time required to collect a full profile(≈45min).Thus,we measured the particle mobility only in a single stationary plane using 14samples and three detection angles.The zeta potential of the silica particles was measured to be−39±4mV.To estimate the geometry offlow cells numerically,we determined the steady-state solution of the incompressible Navier−Stokes equations at low Reynolds number in a500×500μm2system with no slip boundary condition at the top and periodic boundary conditions on the side walls using COMSOL.On the bottom boundary,the profile of afluid slip velocity was defined based on the current density distribution over the copper and gold electrodes(see below).■RESULTS AND DISCUSSIONIn the following sections,wefirst investigate the effect of electrode geometry on the Faradaic current density distribution, reaction kinetics,and ion transport.We focus our observations on the copper anode and location of PS aggregation and show that the current density is influenced by three factors:(i) available cathodic surface area(due to kinetically limited cathode reactions,which include reduction of dissolved oxygen into hydrogen peroxide16,27),(ii)ionic transport,and(iii) concentration effects.Effect of Electrode Geometry on the Current Density Distribution.Figure2shows anodic current density distributions as a function of electrode spacing s measured about10s after initiation of the reactions.Values for s were chosen such that we observe inner-aggregation of PS particles on electrodes with the smallest s(Figure2a),a mix of inner-and edge-aggregation for s≈40μm(Figure2b),and edge-aggregation for all larger values of s(Figure2c and2d).The measured current density increases with s.At s≈80μm,along the electrode edges,particularly at the corners,values of≈450μA/cm2are reached,while at the electrode centers,lower currents between100and250μA/cm2are observed(Figure 2d).For smaller values of s,the current density profiles remain heterogeneous but the overall magnitude decreases.At s≈25μm,the current density at the electrode edges is onlyslightly Figure2.Initial(t≈10s)current density distribution as calculated from the dynamic copper dissolution profile on identically sized copper triangle islands(l≈35μm)for different anodic separation distances s:s≈(a)25,(b)40,(c)60,and(d)80μm.(Insets)In situ optical images of PS aggregation on copper electrodes:(a)inner-aggregation and(b)−(d)edge-aggregation are observed.Dashed lines indicate the boundaries of the underlying copper electrode.larger than the measurement noise level(<100μA/cm2)such that spatial features in the current density cannot be resolved (Figure2a).In summary,the results show that edge-aggregation of PS particles occurs in the presence of locally high and heterogeneous current density.The factors leading to variations in current density can be easily understood:Since the dissolution of copper is catalyzed by the presence of chloride ions,19the overall reaction is limited by the slow rate of oxygen reduction on the gold cathode27and therefore by the total available gold surface area.28As we reduce the spacing of the copper electrodes,we decrease the available cathodic surface area and thus reduce the overall reaction rate. However,by varying s,we not only change the cathodic surface area but also alter the copper area coverageθCu=A Cu/A total,i.e., the ratio of the copper to electrolyte volume,which changes the average concentration of reaction products and thus affects electrochemical equilibria and reaction rates.Furthermore, variations in anode spacing affect the transport of ions away from the high current density areas on copper,as can be understood by considering the solution of Laplace’s equation for ion diffusion in systems of different geometry.29Lastly,ionic (as well as electronic)currents are distributed in the microreactor such that energy dissipation is minimized.In the case of a kinetically limited reaction,such as oxygen reduction on the gold,the charge transfer reaction itself(eq3)is associated with a high so-called charge transfer resistance(also known as polarization resistance,kinetic resistance,chemical resistance),22,30,31and consequently,the ionic current spreads out over the majority of the cathode.In order to determine the contribution of variations in gold surface area to the observed changes in current density independent from contributions of changes in ionic transport and accumulation effects near the copper anodes,we conducted experiments in which we altered the exposed cathodic surface area with photoresist coatings,as detailed in the following.Kinetic Limitations vs Transport and Concentration Effects.By partially blocking the cathode with an insulating layer of photoresist,we can keep the ratio of the active gold and copper areas R=A Au/A Cu constant while varying the copper surface area fractionθCu(with respect to total geometric surface area).The photoresist-modified electrode with s≈80μm shown in Figure3is characterized by R≈4andθCu≈0.04.As shown in Figure3b,we obtain a heterogeneous current distribution and observe that the current density on the photoresist-modified electrode reaches about250μA/cm2atthe electrode edges.In the photoresist-modified system,PS particles start aggregating along the edges and corners of the copper electrodes(Figure3c),likely because this state exhibits similar current density and heterogeneity as observed for the pristine electrode with s≈40μm where edge-aggregation is observed as well(Figure2b).The current density on the photoresist-modified electrode has a significantly larger value than that obtained on the nonmodified electrode with s≈25μm shown in Figure2a which exhibits the same value of R≈4 (i.e.,identical accessible gold surface area)but a5times larger copper surface area fraction(θCu≈0.2,i.e.,larger accessible electrolyte volume).Therefore,in the case of small electrode spacing(Figure2a)dissolution of copper is limited not only by the comparably small cathodic surface area but also by the decreased rate of transport and thus by the accumulation of reaction products generated on the anode in a comparably small volume of electrolyte.This accumulation shifts the equilibrium potential for the dissolution reaction to a more positive value according to the Nernst equation.32The electrochemical overpotential which drives the dissolution reaction decreases,and the reaction rate drops.Conversely, decreasingθCu effects improved ionic transport and decreased concentration of anodic reaction products(due to comparably large electrolyte volume)which shifts the equilibria of the anodic reactions toward increased copper par-ing the current densities of the photoresist-modified electrode with the pristine s≈80μm electrode(Figure2d),where s and θCu are the same but R in the pristine electrode is higher(≈24), wefind that the current density of the photoresist-modified electrode is lower.This illustrates that a decrease in available cathodic area reduces the current since it no longer can spread out over a sufficiently large surface to sustain the electro-chemical reaction rates that can potentially be achieved at the anode in this geometry.27The photoresist-modified electrode thus appears to represent a case where the reaction rate is affected both by the limited rate of oxygen reduction andby Figure3.Experiments with photoresist-modified electrodes.Photo-resist partially covers the gold surface,reducing active gold surface area exposed to the electrolyte.(a)Schematic of a photoresist-modified electrode.We choose to examine identically sized copper triangles(l≈35μm)with the large anodic separation(s≈80μm),where in the pristine case edge-aggregation is observed.Thin layer of photoresist blocks offmost of the gold such that only a strip of width d≈11μm immediate to the copper electrode is exposed.(b)Initial current density distribution(t≈12s)on the photoresist-modified electrode system.Reducing active gold area suppresses the current density magnitude compared to the pristine electrode of the same geometry.(c)PS aggregation initiates from the edges and corners of the copper anodes in the photoresist-modified electrode system.accumulation of reaction products in the electrolyte slowing copper dissolution.Thesefindings are further supported by calculating the diffusion-limited current for different electrode geometries. Using the diffusion constant of the slowest species involved in the anodic reactions D CuCl2−≈5.7×10⁻¹⁰m2/s and a typical anodic reactant concentration of approximately1mM(pH3 HCl solution has,in very good approximation,a concentration of1mM),the one-dimensional diffusion limited current density(Cottrell)at10s is≈40μA/cm2.31,33For the s≈25μm electrode array,diffusive transport can be approximated as one-dimensional because s is small compared to the diffusion layer thickness(δ|t≈10s≈130μm)and the initially hemi-spherical diffusion layers of the individual copper anodes overlap within a few seconds creating an effectively one-dimensional concentration profile for all ionic species involved.29Consequently,the observed current density of about50μA/cm2lies near the calculated Cottrell current density.The current density of up to450μA/cm2measured for s≈80μm in the absence of photoresist,on the other hand, comes close to the limiting current that can be calculated for hemispherical diffusion(600μA/cm2on10s time scale).34In this case,hemispherical diffusion describes the transport within the reactor more accurately,because during a large fraction of the observation time the developing hemispherical concen-tration profiles around each copper anode do not overlap with those of neighboring electrodes.34In the presence of photoresist,such large current densities cannot be achieved due to the surface area of the cathode being insufficient to sustain the necessary high rate of oxygen reduction.It is a well-established concept in electrochemistry that spatial variations of the electrochemical reaction rate are small if the reaction under consideration exhibits a large charge transferresistance,i.e.,if large overpotentials are necessary to drive the reaction(secondary current distribution on a highly polarizable electrode).30,31This effect is,for example,used during electrodeposition of metals where,by addition of surfactants which partly block the electrode,the charge transfer resistance is increased in order to achieve a more homogeneous coating. To repeat,these conditions are met on the gold cathode.On the copper anodes,on the other hand,due to chloride complex formation,dissolution of copper is a fast process and therefore controlled by ionic transport(primary and tertiary current distributions),30,31resulting in strong current density hetero-geneities.Diffusion due to increased access to the electrolyte at the copper electrode edges and corners contributes the locally increased current densities there as compared to the electrode center where diffusion can be approximated as one dimen-sional.The observed current density heterogeneity due to both diffusion-and migration-related effects likely becomes more pronounced as s increases due to increased electrolyte volume between the anodes and lesser amounts of accumulating reaction products,amplifying differences in the(small)Ohmic drop between different locations on the electrodes.Unfortu-nately,the noise level of our current density data does not allow for experimental verification of this hypothesis.Temporal analysis of dissolution rate and particle motion as done below, however,provides additional evidence for the importance of concentration and ionic transport effects.Analysis of Temporal Behavior:Further Evidence for Transport and Concentration Effects.The current density profiles for a copper line electrode array shown in Figure4a reveal that the current density heterogeneity decreases in time. The high current zone near the copper edge(x≈0μm) broadens,and while the value of the maximum current density at the edge remains approximately constant,the current density at the electrode center(x≈−25μm)increases.At the same time,the total(integral)current increases in time(Figure4b). The location of the current density maximum slightly shifts toward the center of the copper electrode.We attribute the smoothening of the current profile over time to the aforementioned concentration changes in the electrolyte: accumulation of soluble reaction products in the electrolyte, including CuCl2−and Cu2+,16−19increases the electrolyte conductivity,which results in increased ionic currents further away from the copper−gold interface,thus increasing the dissolution rate near the electrode center.At the same time,the reaction equilibrium at the edge of the copper electrode is shifted toward decreased dissolution rate,limiting copper dissolution at later stages of the experiment.The shift of the maximum current toward the electrode center can be attributed to a slight decrease in electrode width as the gold underneath the copper electrode gradually becomes exposed,but may also be partially caused by a concentration-induced attenuation of the dissolution reaction at the copper−gold interface. During electrode dissolution,the velocity of silica particles on the gold electrode moving away from copper lines decreases in time despite increased overall current(Figure4c).Because of the moderately large electrolyte conductivity of400μS/cm and low ionic current densities of less than0.5mA/cm2, electrophoresis does not contribute significantly to thelong-Figure4.For an array of line electrodes(l≈50μm,s≈310μm):(a) current density over one-half a copper electrode located at−25μm≤x≤0μm where x≈−25μm is the copper electrode center.(b)Total current density(nA)over a copper electrode area of≈8300μm2as a function of time t.(c)Tracking of the lateral velocity of silica particles for different time intervals on the gold electrode surface located at x≥0μm as they move away from the copper and gold interface at x≈0μm.range motion of PS and silica particles(see Supporting Information for reproduction of evidence and argument for bulkfluid motion).15Therefore,the decreasing velocity of silica particles is associated with a decrease influidflow along the surface of the gold electrode,and this observation is correlated with the smoothening of the dissolution rate profile.In other words,wefind that bulkfluidflow in our reactor and consequently the velocity of silica particles on the gold cathode are dependent on the gradient of the copper dissolution rate. Related results of numerical simulations have been reported in the literature recently:Moran and Posner have shown that reaction-induced charge autoelectrophoreticfluid motion can decrease with increasing electrolyte conductivity which may increase in time in the microreactor.35As the composition and conductivity of the electrolyte change,reaction products,such as cuprous oxide,15,19can deposit on the electrodes,altering their native surface charge.All of these effects may affect electrokineticfluid motion but can currently not be evaluated experimentally.Preferential Particle Aggregation as Effected by Electrophoresis and Fluid Flow.Near or on the copper electrodes,particularly at the high current edges,electro-phoresis may be responsible for directly pinning the particles and thus prevent them from being recirculated into the electrolyte byfluid motion.This local electrophoretic effect increases in magnitude as the current density increases.Thus, one explanation for the occurrence of edge-aggregation at large electrode spacing is the increased contribution of electro-phoretic attraction toward high current areas.As we will show in the following,however,also bulkfluidflow has an effect on the location of particle deposition.To illustrate possible geometries offlow cells and how they can affect the location of particle deposition,we take into account that the bulkfluid motion in the galvanic microreactor is primarily driven by the gradient of the electrochemical potentialμof the cuprous chloride complex above the anode (i.e.,at the outer boundary of the diffuse layer)and can be expressed in terms of thefluid slip velocity u slip∼∇sμ.This assumption is based on theories for an electrochemical cell in a binary electrolyte,36,37which showed that the effects of the spatial variation of ion concentrations on thefluidflow can be expressed in terms of thefluid slip velocity.Physically, formation of suchflows is caused by the tendency of the system to equilibrate.Thus,their presence can be postulated based on the most basic principles of thermodynamics.In the galvanic microreactor,spatial variations of ion concentrations are certainly present due to the microreactor’s coplanar electrode configuration,in particular when current density distributions are heterogeneous.We assume that theflow generated over the copper electrode to equilibrate these heterogeneities dominates,because the current density heterogeneity is more prominent on copper compared to gold(see above).On the copper electrode,the most relevant counterion to consider is the cuprous chloride complex since it is the slowest diffusing species in the microreactor.The concentration of the cuprous chloride complex is related to its rate of formation via Fick’s law,and because the diffusion length is short at the early stage of our experiments,the cuprous chloride complex concentration and its rate of formation are roughly proportional.As an approximation for the spatial profile ofμ,we thus employ the current density distribution as determined on the copper line electrodes (Figure4a).Using this assumption,we calculated thefluidflow within our microreactor by assigning a spatially varying slip velocity to the copper surfaces:u slip∼∇s i.In Figure5,we show the computedflow pattern driven by a fluid slip velocity u slip over a pair of galvanic electrodes asnumerically calculated from two electrochemical potential profiles with different degree of heterogeneity(see Figure5 insets).Wefind that the steep outer gradient in the current density profile drivesfluid motion away from copper extending over the gold surface,which is consistent with our observed motion of the silica particles on gold.The recirculation of this largeflow cell likely brings particles,such as PS,suspended above the electrode surface toward the copper electrode,which is also consistent with our observations.The decrease in current density(and therefore in electrochemical potential)toward the center of the copper electrode drives another,counter-rotating flow cell directly over the copper surface.When the inner rotatingflow cell is strong compared to the outer one,as shown in Figure5a,PS particles located above the copper electrode can likely be directed toward the electrode edge before they reach a distance close to the electrode surface where they would become entrained by electrophoresis.When the counter-rotatingflow is weak,as shown in Figure5b,it is not effective in directing particles toward the edge before they reach the vicinity of the electrode where electrophoresis dominates.Thus, particles are more likely to deposit randomly over the inner region of the copper electrodes and later crystallize at the electrode center by EOF and EHDflow,8,20,21resulting ininner-aggregation.Figure 5.Calculations of thefluidflow pattern driven by electrochemical potential gradients near the copper−gold junction.(a)Presence of two counter-rotatingflow cells due to a strongly localized maximum of the electrochemical potential near the electrode interface.(b)Dominance of oneflow cell due to a more homogeneous electrochemical potential on the copper electrode.Images show only a part of the complete500×500μm2system.(Insets)Fluid slip velocity on and near the copper electrode is assumed to follow current density measurements for large(a)and small(b)electrode spacing (Figure4a).Left boundary of theflow images corresponds to x=0μm.。

新型抗阿尔茨海默病药物甘露寡糖二酸一、本文概述Overview of this article随着全球人口老龄化趋势的加剧,阿尔茨海默病(Alzheimer's Disease,AD)作为一种慢性神经退行性疾病,已经成为影响老年人生活质量的主要健康问题之一。
其临床表现主要为记忆障碍、失语、失用、失认、视空间技能损害、执行功能障碍以及人格和行为改变等,严重影响了患者的日常生活和社会功能。
目前,尽管已经有一些药物被批准用于治疗阿尔茨海默病,但这些药物在缓解症状、延缓疾病进程方面仍然存在一定的局限性。
因此,研发新型、有效的抗阿尔茨海默病药物成为了当前医学研究的热点和难点。
With the intensification of the global aging trend, Alzheimer's Disease (AD), as a chronic neurodegenerative disease, has become one of the main health problems affecting the quality of life of the elderly. Its clinical manifestations mainly include memory impairment, aphasia, loss of use, loss of recognition, impairment of visual and spatial skills, executive dysfunction, and personality and behavioral changes,which seriously affect the patient's daily life and social function. At present, although some drugs have been approved for the treatment of Alzheimer's disease, these drugs still have certain limitations in alleviating symptoms and delaying disease progression. Therefore, the development of new and effective anti Alzheimer's disease drugs has become a hot and difficult topic in current medical research.近年来,甘露寡糖二酸(Mannosylglycerate,MG)作为一种具有独特生物活性的天然产物,其在抗阿尔茨海默病方面的潜在作用逐渐受到了关注。

abandoned drives [?'b?nd?nd] [draivs] 废巷道abrasion resistance [?'brei??n] [ri'zist?ns] 抗磨蚀能力abrasive [?'breisiv] 磨料absorbent [?b's?:b?nt] 吸收剂access ramp ['?kses] [r?mp] 出入沟,出入引道accessory minerals [?k'ses?ri] ['min?r?ls] 副矿物accidental explosion [,?ksi'dent?l] [ik'spl?u??n] 意外爆炸Accumulated losses 累计亏损Acid Mine Drainage 矿山酸性废水Acidic run-off water from mine waste dumps and mill tailings ponds containing sulphide minerals. Also refers to ground water pumped to surface from mines.acid mine water ['?sid] [main] ['w?:t?] 酸性矿水acid resistant ['?sid] [ri'zist?nt] 耐酸的acid rock ['?sid] [r?k] 酸性岩acidite ['?sidait] 酸性岩acidulation 酸化acquirer投资主体Acquisition premium 收购溢价activated charcoal ['?ktiveitid] ['t?ɑ:k?ul] 活性煤activator ['?ktiveit?] 活化剂adamic earth ['?d?mik] [?:θ] 红粘土additive ['?ditiv] 添加剂adhere [?d'hi?] 粘着adhesion force [?d'hi:??n] [f?:s] 粘附力Adit ['?dit] 平硐An opening driven horizontally into the side of a mountain or hill for providing access to a mineral deposit.adit collar ['?dit] ['k?l?] 平硐口adit cut mining ['?dit] [k?t] ['maini?] 平硐开采adjustable prop [?'d??st?bl] [pr?p] 伸缩式支柱Administration and Corporate expenses行政管理及公司费用Administrative expenses 管理费用adobe blasting [?'d?ubi] ['blɑ:sti?] 裸露装药爆破adobe shot [?'d?ubi] [??t] 裸露装药爆破advancement [?d'vɑ:nsm?nt, ?d'v?ns-] 掘进advancing along the strike [?d'vɑ:nsi?] [?'l??] [straik] 沿走向掘进Aeromagnetic survey 航磁测绘A geophysical survey using a magnetometer aboard, or towed behind, an aircraft. AFC-The armored face conveyor.工作面皮带输送机Used on the coal face of an underground mine to protect the workers and convey the coal to the crusherAgate ['?ɡ?t] 玛瑙Agglomerate [?'ɡl?m?r?t, -reit, ?'ɡl?m?reit] 集块岩aggregate thickness ['?ɡriɡ?t, '?ɡriɡeit] ['θiknis] 总厚度Agitation .搅动,搅拌In metallurgy, the act or state of being stirred or shaken mechanically, sometimes accomplished by the introduction of compressed air.Air Crossing- [ε?] ['kr?:si?] 气流交汇点A place where return air and fresh cross over but are still divided.air flow [ε?] [fl?u] 气流air intake [ε?] ['inteik] 进气口air vent [ε?] [vent] 气孔,排气口Airborne survey 航测A survey made from an aircraft to obtain photographs, or measure magnetic properties, radioactivity, etc.airleg [ε?] [leɡ] 气腿式钻机,风动钻架Alloy 合金A compound of two or more metals.Alluvium 冲积层;冲积土Relatively recent deposits of sedimentary material laid down in river beds, flood plains, lakes, or at the base of mountain slopes. (adj. alluvial).Alteration 蚀变Any physical or chemical change in a rock or mineral subsequent to its der and more localised than metamorphism.Alunite ['?ljunait] 明矾石anchor bolts 固定螺栓Ancillary Equipment [?k'ses?ri] [i'kwipm?nt] 辅助设备ANFO 氨油炸药Acronym for ammonium nitrate and fuel oil, a mixture used as a blasting agent in many mines. angle of dip ['??ɡl] [dip] 倾角anisotropic [?,nais?u'tr?pik] .各向异性的Anomaly 异常状态Any departure from the norm which may indicate the presence of mineralisation in the underlying bedrock.anthracite ['?nθr?sait] 无烟煤A hard, black coal containing a high percentage of fixed carbon and a low percentage of volatile matter.anticline ['?ntiklain] 背斜An arch or fold in layers of rock shaped like the crest of a wave.anticlinorium [,?ntiklai'n?:ri?m] 复背斜asbestos [?z'best?s] 石棉asphalt ['?sf?lt] 沥青asphyxia [?s'fiksi?], suffocation [,s?f?'kei??n], gassing ['ɡ?si?] 窒息Assay 化验;分析;鉴定,测定A chemical test performed on a sample of ores or minerals to determine the amount of valuable metals contained.Assay Foot 化验尺度(metre, inch,centimetre)Assessment Work 例行评估工作The amount of work, specified by mining law that must be performed each year in order to retain legal control of mining claims.Asset classified as held for sale供出售资产associate bed [?'s?u?i,eitid] [bed] 伴生层attributable to the owners of the parent entity归属母公司的auger drill ['?:ɡ?] [dril] 螺旋钻auger mining ['?:ɡ?] ['maini?] 螺旋钻采矿法augite ['?:d?ait] 辉石autoclave ['?:t?kleiv]: 高压灭菌器a closed strong vessel for conducting chemical reactions under high pressure and temperature.Autogenous Grinding 自磨The process of grinding ore in a rotating cylinder using large pieces of the ore instead of conventional steel balls or rods.Back [b?k] 巷道顶部The back is the roof or overhead surface of an underground opening.back fill [b?k] [fil] : 采空区充填Waste material used to fill the void created by mining an orebodybackfill cure ['b?kfil] [kju?] 回填物凝固Backhoe [b?kh?u] 反铲挖土机Backwardation (证券)交割延期(费)。

mineral deposit 定义-回复Mineral Deposit Definition and CharacteristicsIntroduction:Mineral deposits are natural accumulations of minerals or metals that have economic value and can be extracted for industrial or commercial purposes. These deposits are found in various geological settings and are formed through different processes over millions of years. This article aims to provide a comprehensive understanding of mineral deposits, including their definition, types, formation, and characteristics.Definition of Mineral Deposit:A mineral deposit refers to a concentration of one or more minerals or metals, occurring in a particular geological environment. These deposits are typically located within the Earth's crust or near its surface. They can be found in various sizes, ranging from small veins or pockets to large, extensive ore bodies. The economic viability of a mineral deposit depends on factors such as mineral abundance, concentration, accessibility, and market demand.Types of Mineral Deposits:Mineral deposits can be categorized into two broad types based on their geological origins:1. Magmatic Deposits: These deposits are formed as a result of solidification and crystallization of molten magma. During volcanic activity, magma rises to the Earth's surface or intrudes into existing rocks. As the magma cools and solidifies, certain minerals crystallize and concentrate, forming magmatic deposits. Examples of magmatic deposits include platinum-group elements (PGEs) in the Bushveld Complex of South Africa and copper-nickel deposits in the Sudbury Basin of Ontario, Canada.2. Sedimentary Deposits: Sedimentary deposits are formed through the accumulation and subsequent lithification of weathered fragments or dissolved minerals. Weathering and erosion of rocks release minerals into the water systems, which are then transported and deposited in bodies of water such as rivers, lakes, or oceans. Over time, the deposited sediments consolidate and form sedimentary rocks, including various economicallyvaluable minerals. Examples of sedimentary deposits include coal seams, oil and gas reservoirs, and iron ore deposits.Formation of Mineral Deposits:Mineral deposits are formed through a combination of geological processes and favorable conditions. The formation of a deposit requires:1. Source: A source of mineral-rich fluids or magma capable of transporting and concentrating the desired minerals. This source can be deep within the Earth's mantle or generated through the partial melting of existing rocks.2. Transport: The transportation of minerals from the source to a favorable deposition site. This can occur through various mechanisms such as fluid flow, volcanic eruptions, or glaciation.3. Deposition: The deposition of minerals in a specific geological environment, where favorable conditions allow the minerals to concentrate and solidify. This can happen due to changes in temperature, pressure, or chemical reactions with the surroundingrocks.Characteristics of Mineral Deposits:Several key characteristics help distinguish and evaluate mineral deposits:1. Grade: Refers to the abundance or concentration of the desired mineral within the deposit. Higher grades are generally more economically viable as they contain a higher proportion of the valuable minerals.2. Size and Morphology: Mineral deposits can vary in size and shape, ranging from small, discrete veins to massive ore bodies. The morphology affects the extraction methods and cost.3. Mineralogy: The specific minerals present in a deposit can determine its economic value and utilization potential. Different minerals have various uses and market demand.4. Geological Setting: The geological setting of a deposit influences its formation, accessibility, and potential associated geologicalphenomena such as faults, folds, or fractures.5. Economic Feasibility: The economic feasibility of a mineral deposit depends on factors such as market demand, commodity prices, extraction costs, available infrastructure, and environmental regulations.Conclusion:Mineral deposits are valuable natural resources that have shaped human societies throughout history. Understanding the definition, types, formation processes, and characteristics of these deposits is crucial for the responsible and sustainable extraction of minerals. Identifying and evaluating mineral deposits require interdisciplinary scientific knowledge, including geology, chemistry, and engineering. By studying and utilizing mineral deposits effectively, we can ensure the continued development and prosperity of various industries and economies.。
4322016年中国矿物岩石地球化学学会第16届侯德封矿物岩石地球化学青年科学家奖评选公告2016年4月9日, 中国矿物岩石地球化学学会第8届侯德封奖评选工作委员会在杭州召开了评审会。
19名评选委员会委员到会。
会议由评选委员会主任刘丛强院士主持。
本次共评选出18名获奖人, 经网上公示(公示时间: 2016-04-14至2016-04-25)无异议, 评选结果生效。
现将评选结果公告如下(以姓氏拼音为序)。
丛志远, 男, 1977年9月生, 中国科学院青藏高原研究所, 副研究员, 博士。
请奖项目: 青藏高原大气气溶胶地球化学表征与请奖项目有关的主要学术成就及创新点: ①利用分子标志物的指示作用, 揭示了南亚大气污染物向青藏高原的传输过程; ②通过湖泊沉积物重建了过去150年间大气黑碳的历史变化; ③明确了青藏高原气溶胶中痕量元素浓度水平及Pb同位素组成特征; ④针对雪冰介质的特点, 开发了有机酸标志物的前处理方法。
五篇代表性论著:1. Cong Z Y, Kang S C, Kawamura K, Liu B, Wan X, Wang Z Y, Gao S P, Fu P Q. Carbonaceous aerosols on the south edgeof the Tibetan Plateau: Concentrations, seasonality and sources. Atmospheric Chemistry and Physics, 2015, 15: 1573–1584.2. Cong Z Y, Kawamura K, Kang S C, Fu P Q. Penetration of biomass-burning emissions from South Asia through theHimalayas: New insights from atmospheric organic acids. Scientific Reports, 2015, 5: 9580, doi:10.1038/srep09580.(Highlighted by Nature).3. Cong Z Y, Kang S C, Zhang Y L, Gao S P, Wang Z Y, Liu B, Wan X. New insights into trace element wet deposition inthe Himalayas: Amounts, seasonal patterns, and implications. Environmental Science and Pollution Research, 2015, 22: 2735–2744.4. Cong Z Y, Kang S C, Gao S P, Zhang Y L, Li Q, Kawamura K. Historical trends of atmospheric black carbon on TibetanPlateau as reconstructed from a 150-year lake sediment record. Environmental Science and Technology, 2013, 47: 2579–2586.5. Cong Z Y, Kang S C, Luo C L, Li Q, Huang J, Gao S P, Li X D. Trace elements and lead isotopic composition of PM10 inLhasa, Tibet. Atmospheric Environment, 2011, 45: 6210–6215.侯通, 男, 1984年5月生, 中国地质大学(北京), 副教授, 博士。

第20卷 第12期 装 备 环 境 工 程2023年12月EQUIPMENT ENVIRONMENTAL ENGINEERING ·35·收稿日期:2023-11-13;修订日期:2023-12-12 Received :2023-11-13;Revised :2023-12-12基金项目:国家自然科学基金(52271071);国家重大科技项目(J2019-I-0016-0015)Fund :The National Natural Science Foundation of China (52271071); Major National Science and Technology Project (J2019-I-0016-0015) 引文格式:史海兰, 丁国寅, 张晓化, 等. 盐沉积方式对TC11钛合金热盐腐蚀行为的影响[J]. 装备环境工程, 2023, 20(12): 35-43.SHI Hai-lan, DING Guo-yin, ZHANG Xiao-hua, et al. Effect of Salt Deposition Mode on the Hot Salt Corrosion Behavior of TC11 Titanium Alloy[J]. Equipment Environmental Engineering, 2023, 20(12): 35-43.*通信作者(Corresponding author )盐沉积方式对TC11钛合金热盐腐蚀行为的影响史海兰,丁国寅,张晓化*,刘道新,高雨辰(西北工业大学 民航学院,西安 710072)摘要:目的 对比研究人工涂盐方法和盐雾试验方法沉积盐膜对TC11钛合金热腐蚀行为的影响规律。
方法 对人工涂盐和盐雾试验沉积盐膜的TC11钛合金试样500 ℃高温热盐腐蚀形貌、腐蚀动力学和腐蚀机理进行对比分析。
结果 2种不同盐膜沉积方式的TC11钛合金试样表面盐分的分布形态存在明显的区别,盐雾腐蚀试样表面的盐分存在局部聚集现象,人工涂盐试样盐分分布较为均匀。
肾素-血管紧张素系统与阿尔茨海默病孙金霞;王静【摘要】阿尔茨海默病(AD)是常见的进行性认知障碍和记忆力损害为主的中枢神经系统退行性疾病,已经成为继心血管疾病、肿瘤和脑卒中之后的第四位死亡原因.这一世界性的健康难题,其治疗和护理成本逐年上升.中老年人高血压与其日后认知功能障碍风险升高有关.降压药物中的血管紧张素转化酶(ACE)抑制剂能够减缓AD 的发病进程、降低发病率.然而,ACE抑制剂的使用可伴有β淀粉样蛋白1-42(Aβ1-42)聚集的增多.该文对脑中肾素-血管紧张素系统,特别是ACE抑制剂作为AD药物的作用及血管紧张素4受体(AT4)进行综述,预测AT4是治疗AD所致的记忆障碍的新的治疗靶点.【期刊名称】《医学综述》【年(卷),期】2014(020)011【总页数】3页(P1926-1928)【关键词】阿尔茨海默病;血管紧张素转换酶抑制剂;肾素-血管紧张素系统;AT4受体【作者】孙金霞;王静【作者单位】盐城卫生职业技术学院医学检验学院,江苏盐城224005;盐城卫生职业技术学院医学检验学院,江苏盐城224005【正文语种】中文【中图分类】R743.9阿尔茨海默病(Alzheimer′s disease,AD)是一种以进行性认知障碍和记忆力损害为主的中枢神经系统退行性疾病。
目前在美国约有450万AD患者[1],全世界每年确诊的新病例翻番[2]。
65岁以上的老年人中,年龄每增加5岁,患病率增加一倍。
仅在美国,AD患者的治疗和护理的相关费用已超过700亿美元[3]。
AD的相关研究的重点在于减缓、停止甚至扭转AD的进展。
近年来的研究发现,降压药物,尤其是血管紧张素转化酶(angiotensin converting enzyme,ACE)抑制剂和血管紧张素受体阻断剂,能够减缓AD的发病进程,降低其发病率[4]。
本文对脑中肾素-血管紧张素系统,特别是ACE抑制剂作为AD药物的作用及血管紧张素4受体(angiotensin Ⅳ receptor,AT4)等方面进行综述。
有关“化学沉积法”的英文
“化学沉积法”的英文是:Chemical deposition、chemical deposition method、Direct Chemical Deposition。
双语例句如下:
1.采用化学沉积法,在ZnO晶种面上研究了纳米棒于70℃过饱和硝酸锌/氢氧化钠溶液中的定向生长。
ZnO nanorods on ZnO-coated seed surfaces were fabricated by chemical deposition method using supersaturated Zn ( NO3) 2/ NaOH at 70 ℃.
2.试验采用化学沉积法负载钯-铜合金(4∶1)的多孔钛板作为电解反应器阴极,电解硝酸盐氮(NO-3-N)和五氯酚(PCP)的混合溶液。
Pd-Cu ( 4∶1) was loaded on a porous titanium as cathode by chemical deposition.
3.本文用液相化学沉积法对纳米TiO2进行了氧化铝和氧化硅包覆以及硅铝氧化物复合包覆。
This paper reports that nano-TiO2 is coated with Al2O3, SiO2 or both together by chemical liquid deposition.
4.通过化学沉积法将纳米MgO微粒分散在活性炭纤维表面。
The dispersing of MgO nano-particles on the surface of the activated carbon fiber ( ACF) was affected by chemical precipitation.。
2009 © The Japan Society for Analytical ChemistryIntroductionThe development of analytical methodologies based on particle stabilized liquid–liquid interfaces will require some knowledge of particle distribution and particle–particle interactions. Liquid–liquid interfaces containing colloidal particles have a long history1,2 with increasing interest in technologies including foods, flotation and advanced materials.3,4 Potential applications of these systems lie in the areas of emulsions, polymer blends, encapsulated pharmaceuticals, “bigels” and colloidosomes.5,6Pre-formed particles can be readily adsorbed at the liquid–liquid interface. Alternatively particles can be created, by chemical reaction, at the interface. The adsorption of the particles at the interface is dictated by the Gibbs energy (E) required to detach a particle of radius a. For detachment to the aqueous phase, the energy is:7,8 E = p a2g ow(1 – cos q)2, (1) where g ow is the surface tension between the oil and water phases and q is the contact angle measured through the aqueous phase. For particles that are equally wetted by both phases (q = 90˚) and for typical values of g ow, E can exceed 103k B T for a~10 nm,9 meaning that even nano sized particles can essentially be irreversibly bound to the interface. In applications of nanoparticle based interfacial films, such as particle stabilized emulsions, the film mesostructure plays a key, yet little understood, role in system behaviour.4 Here, we present some initial results where we have studied the aggregation behavior of gold nanoparticles being formed at an oil/water interface using optical microscopy, to try to shed new light on the aggregation process. We note that this interfacial system is, in many ways, an ideal 2-dimensional system for the study of aggregation. There are a number of prior reports of the aggregation of pre-formed particles in two-dimensional systems10but to the best of our knowledge the prior work on particles being formed at liquid–liquid interfaces only deals with aggregation in a qualitative manner.11–13ExperimentalReagents and chemicalsGold metal nanoparticles were formed at the interface between aqueous and organic salt solutions.14,15 A gold salt (1.0 mM NaAuCl4·2H2O, Aldrich), dissolved in the aqueous phase, was reduced to gold metal at the interface, by a lipophilic electron donor decamethylferrocene (3.0 mM DMFC, Aldrich) dissolved in the organic phase 1,2-dichloroethane (DCE, Aldrich), forming nanoparticles:Au3+(aq) + 3DMFC(org)æÆ Au(s) + 3DMFC+(org).The aqueous phase also contained two salts LiCl (0.1 M, Aldrich) and LiClO4(0.1 M, Fluka), and the organic phase contained the electrolyte tetrabutylammonium perchlorate (0.01 M TBAP, Aldrich). The excess of electrolytes (relative to the reagents forming the gold) was added to ensure that the concomitant ion transfer, which must accompany the interfacial electron transfer process, did not limit the overall deposition process. The phase volumes were approximately equal (see below) hence given the stoichiometry of the reaction and the reagent concentrations, particle formation will be limited by reagent transport from both sides of the interface. In the experiments reported here we focus on one set of conditions, but ongoing experiments are looking at the dependence of the process on transport limited by the organic phase (excess gold) and the aqueous phase (excess reducing agent), respectively. Sample cellFigure 1 illustrates the method followed to construct the simple glass cell used in the experiments. A hydrophobicNotesDeposition and Aggregation of Au at the Liquid/Liquid InterfaceAndrew I C AMPBELL,*† Robert A W D RYFE,* and Mark D H A W***The School of Chemistry, The University of Manchester, Oxford Road, Manchester M13 9PL, UK** D epartment of Chemical and Process Engineering, University of Strathclyde,James Weir Building, Glasgow G1 1XJ, UKThe mesostructure of nanoparticle stabilized interfacial films, in systems such as particle stabilized emulsions, plays a key, yet little understood, role. We have studied a system of gold nanoparticles being formed and aggregating at a planar oil/water interface using optical microscopy. A rapid “nucleation” step of meso (micron) scale aggregates was observed.Aggregation of the meso aggregates to form a percolating structure is seen to switch from a slow to a fast aggregation regime. Aggregation in the slow regime appears to be reaction limited. We tentatively attribute the fast aggregation regime to a capillary attraction.(Received August 29, 2008; Accepted October 14, 2008; Published February 10, 2009)† To whom correspondence should be addressed.E-mail: andrew.campbell.103@Present address: Department of Chemical and ProcessEngineering, University of Strathclyde, James Weir Building,Glasgow G1 1XJ, UK.coating was applied to a piece of glass tubing (10 ¥ 8 mm) using a similar method to that described by Horozov et al.16 when coating silica particles. The glass tubing was immersed in a 0.1 M solution of dichlorodimethyl silane (DCDMS) in anhydrous cyclohexane whilst stirring (Fig. 1A) for 1 h. All but the top 3 mm of the coating was then stripped away from the inside of the tubing using a 1.0 M solution of NaOH (~2 h, Fig. 1B). After washing the glass tubing with deionized water, the cell was reassembled with the hydrophobic portion of the cell wall at the bottom of the cell (Fig. 1C). It was found that by using this method of forming a hydrophilic/lipophilic boundary on the cell wall, we were able to form a very flat interface between the oil and water phases.MethodAbout 160 m L of the DCE solution was pipetted into the sample cell followed by 145 m L of an aqueous solution of the two salts LiCl (0.1 M) and LiClO 4 (0.1 M). The volume of the DCE solution was adjusted until a flat interface, as viewed from the side of the cell, was achieved. The cell was then mounted on a Leica DM IL inverted microscope and a ¥20 (0.4 N.A) objective selected. After a delay of approximately 30 min in which the system was allowed to equilibrate, 16 m L of a concentrated (10 mM) solution of NaAuCl 4 (0.1 M LiCl, 0.1 M LiClO 4) was added to the aqueous phase. Small aggregates of gold particles were visible at the interface within a few seconds of adding the concentrated gold salt solution. The aggregates were initially moving rapidly due to flow at the interface, slowing to about ~1.2 m m/s after about 2 min. No other aggregates appeared for several minutes, perhaps because the DMFC present at the interface is rapidly exhausted requiringfresh DMFC to diffuse from the bulk. After a short delay a “nucleation” step was observed as numerous disc-like meso -aggregates, large enough to be observed under the microscope (~1 m m), were formed. These meso -aggregates themselves aggregated to form a percolating structure. As the aggregation proceeded, flow at the interface slowed to no more than 0.4 m m/s.A sequence of 2500 images of the aggregating system was recorded at a rate of 4 frames per second using a Sony DXC-190 PAL color analog camera mounted on the camera view port of the microscope. The images were digitized via a National Instruments frame grabber card (PCI-1411) and saved as time-stamped 8-bit grayscale images (768 ¥ 572 pixels) to a computer hard disc using an image acquisition program written in the C++ programming language. Figure 2 shows an image of some aggregates at the interface recorded during the experiment.Image analysisA suite of image analysis algorithms was written in the C++ programming language. A Gaussian smoothing function was applied 17 to each image in the sequence to reduce noise. A multi-stage thresholding function was then applied to the smoothed image to identify object pixels. The object pixels were then saved to a binary image for further processing (see Fig. 2).Results and DiscussionTo try to identify trends in the aggregation process, another set of algorithms was used to compute cluster statistics from the binary images. The mean radius of gyration ·R g Ò of the clusterswas used to follow the growth of the clusters over time whereFig.1The sample cell was prepared by first coating the glass tubing with a hydrophobic coating (A). A strong NaOH solution was then used to strip away most of the coating (B) to leave a 3-mm deephydrophobic section, forming the bottom of the cell (C).Fig.2(A) Aggregated gold nanoparticles at the DCE/water interface 460 s after the start of the experiment. The aggregates appear as dark gray pixels on a light gray background. (B) The final processed binary image after applying the multi-stage thresholding function. Located object pixels are depicted as white and background pixels as black. The size bar represents 10 m m.R g is the radius of gyration of an individual cluster,R g(2)Here s is the mass of the cluster (the number of pixels in the image of the cluster) and ·r Ò is the cluster center of mass ·r Ò = sÂir /s .Figure 3 shows a plot of the number of clusters N c and ·R g Ò against time. No data from the first 2 min is shown, during this time there was some settling of the system after the introduction of the concentrated gold solution (see Experimental section). Initially, the addition of the concentrated gold solution caused rapid flow at the interface making it difficult to count the clusters using the image analysis algorithms. After 2 min, this flow had slowed to about 1.2 m m/s and the clusters could easily be identified and analyzed. Between 2 and 3 min after the addition of the gold salt solution to the aqueous phase, N c remains fairly constant at about 300 clusters and there is no observable growth of the clusters. A rapid “nucleation” step then follows in which N c rises rapidly to a maximum, ·R g Ò falls, reflecting the large number of new small clusters; i.e. “nucleation” dominates in this regime. These new clusters are disc-like, 1 – 2 m m diameter and are initially difficult to distinguish from background intensities, darkening with time presumably as new nanoparticles accrete onto the clusters. We did not measure the final thickness of the film formed but it is assumed that the majority of the new nanoparticles aggregated on to the surface of the clusters within the interfacial plane because of the driving force against detachment of the nanoparticles from the interface; see Eq. (1). After the “nucleation” period the clusters begin to aggregate. The plot clearly indicates two aggregation regimes. The initial slow aggregation regime (N c ~t –1.2) lasts for about 90 s before switching over to the fast aggregation regime (N c ~t –6.1). Although we quote the exponents for the slow and fast aggregation regimes, under the limited conditions presented here it is not yet possible to define their dependence on reaction conditions: this is the subject of ongoing experiments. Duringthe slow aggregation regime, small clusters diffuse quickly and frequently toward and away from one another before aggregating, reminiscent of reaction limited (RLCA)18,19 type aggregation, implying a short range repulsive intercluster interaction. In the fast aggregation regime, the larger clusters diffuse much more slowly, however, from visual observations a long range attractive force now clearly operates between the clusters. Clusters are visibly pulled toward one another from a distance of up to 3 m m. Interestingly, clusters add only at the end points of branches and never side on. We tentatively attribute this long range attraction to a capillary attraction.20To our knowledge this is the first time that a change in the aggregation rate and mechanism has been reported for a system where particles are being formed at the interface. Similar results have been reported for pre-formed particle systems, with the fast aggregation regime attributed to different reasons. For example, Hansen and Bergstrom 21 found the transition to be as a result of a switch from diffusion limited (DLCA)18,19 to convection limited cluster aggregation, resulting from flow in their study of silica aggregation at the air –toluene interface. They noted a factor of 10 increase in the scaling exponent of the weight average cluster mass S (t )S (t ) =Âss 2n (s ,t )Âssn (s ,t ), (3)where n (s , t ) is the number of clusters of size s at time t . For comparison, we have plotted S (t ) for this system (see inset Fig. 3) and found S (t ) ~t 1.8 for the slow aggregation regime and S (t ) ~t 7.0 for the fast aggregation regime. Whilst there is some flow in our system, we believe the observed long range attraction is the dominant cause of the increase in the scaling exponent.Evans and Haw 22 defined a “remoteness” parameter for measuring the distribution of empty space in aggregated particlestructures. It can be used as a structural measurement tool beyond R g , etc., measuring structure across the system and not just single clusters and provides a measurement of the porosityFig.3The number of clusters N c (–) and the mean radius of gyration ·R g Ò over time. N c shows a rapid nucleation of meso-aggregates followed by slow (1) and fast (2) aggregation regimes, ultimately forming a percolating structure. The dashed lines are a fit to the data. Inset: the weight average cluster mass S (t ).Fig.4Root mean square remoteness shows a decrease in remoteness during the “nucleation” period. The remoteness remains almost constant during the slow aggregation regime, rising rapidly during the fast aggregation regime.of the structure. We computed the remoteness distribution for each image in the sequence by measuring the distance from 10000 random points to the nearest aggregate. From this we computed the root mean square remoteness (RMSR) for each image in the sequence (see Fig. 4). Initially there is a significant variation in the RMSR, most likely due to flow at the interface. As the rate of flow slows and new clusters nucleate, the remoteness falls and remains at an almost constant value during the slow aggregation regime before rising rapidly during the fast aggregation regime. It is not clear why the remoteness remains almost constant during the slow aggregation regime but the clusters are still small and relatively mobile at this stage and can diffuse to reduce the size of new gaps in the structure opened by two clusters aggregating. The onset of fractal growth of aggregates implies the increasing scale of empty spaces in the film, shown by the rapid increase in RMSR. The precise scaling of RMSR with time will be determined by the kinetics of the aggregation; i.e. the dominant end-on cluster bonding. AcknowledgementsWe thank the EPSRC (grant EP/D053951/1) for financial support. References1. W. Ramsden, Proc. Roy. Soc. London, 1903, 72, 156.2. S. U. Pickering, J. Chem. Soc., 1907, 91, 2001.3. R. Aveyard, B. P. Binks, and J. H. Clint, Adv. ColloidInterface Sci., 2003, 100, 503.4. S. Reynaert, P. Moldenaers, and J. Vermant, Langmuir,2006, 22, 4936.5. A. D. Dinsmore, M. F. Hsu, M. G. Nikolaides, M. Marquez,A. R. Bausch, and D. A. Weitz, Science, 2002, 298, 1006.6. K. Stratford, R. Adhikari, I. Pagonabarraga, J. C. Desplat,and M. E. Cates, Science, 2005, 309, 2198.7. S. Levine, B. D. Bowen, and S. J. Partridge, Colloids Surf.,1989, 38, 345.8. J. H. Clint and S. E. Taylor, Colloids Surf., 1992, 65, 61.9. B. P. Binks, Curr. Opin. Colloid Interface Sci., 2002, 7, 21.10. L. Bergstrom, in “Colloidal Particles at Liquid Interfaces”,2006, ed. B. P. Binks and T. S. Horozov, Cambridge University Press, 77.11. C. Johans, K. Kontturi, and D. J. Schiffrin, J. Electroanal.Chem., 2002, 526, 29.12. D. Rautaray, R. Kavathekar, and M. Sastry, FaradayDiscuss., 2005, 129, 205.13. V. V. Agrawal, G. U. Kulkarni, and C. N. R. Rao, J. ColloidInterface Sci., 2008, 318, 501.14. R. A. W. Dryfe, A. O. Simm, and B. Kralj, J. Am. Chem.Soc., 2003, 125, 13014.15. R. A. W. Dryfe, E. C. Walter, and R. M. Penner,ChemPhysChem, 2004, 5, 1879.16. T. S. Horozov, R. Aveyard, J. H. Clint, and B. P. Binks,Langmuir, 2003, 19, 2822.17. J. C. Crocker and D. G. Grier, J. Colloid Interface Sci.,1996, 179, 298.18. P. Meakin, Adv. Colloid Interface Sci., 1988, 28, 249.19. D. A. Weitz, J. S. Huang, M. Y. Lin, and J. Sung, Phys. Rev.Lett., 1985, 54, 1416.20. J. C. Fernandez-Toledano, A. Moncho-Jorda, F. Martinez-Lopez, and R. Hidalgo-Alvarez, in “Colloidal Particles at Liquid Interfaces”, 2006, ed. B. P. Binks and T. S. Horozov, Cambridge University Press, 108.21. P. H. F. Hansen and L. Bergstrom, J. Colloid Interface Sci.,1999, 218, 77.22. R. M. L. Evans and M. D. Haw, Europhys. Lett., 2002, 60,404.。