北京城市蔓延的测度与分析_英文_
- 格式:pdf
- 大小:386.70 KB
- 文档页数:10
111—130 171—1851、北京城市蔓延的测度与分析作者:蒋芳; 刘盛和; 袁弘期刊号:2007年 06期时间:2007/06摘要:针对现阶段我国城市用地快速扩张和无序蔓延的现实问题,以北京市在1996 ̄2004年期间的城市扩展作为研究案例,提出可以从城市扩展形态、扩展效率和外部影响等三个方面来判识城市蔓延现象,并提出基于地理空间指标体系的城市蔓延测度方法,主要由涉及人口、经济、土地利用、农业、环境和城市生活等方面的13项指标所组成。
实证分析结果表明,该方法可以有效地测度和量化研究区城市蔓延的特征:①建设用地斑块具有明显的破碎化和不规则化趋势,缺乏良好的规划控制,不连续开发、条带式开发和跳跃式开发特征明显,扩展形态不尽合理;②新增建设用地的建设密度和容积率较低,并且新增用地的人口密度和经济产出水平均低于原有用地绩效,扩展效率不高;③城市蔓延占用大量的耕地和开敞空间、加重了交通负担,对农业、环境和城市生活存在显著的负面影响。
2、长江三角洲城市带扩展对区域温度变化的影响作者:谢志清; 杜银; 曾燕; 施雅风; 武金岗期刊号:2007年07期时间:2007/07 摘要:利用DMSP/OLS夜间灯光数据、土地利用统计数据和气象站常规观测资料,结合NOAA/AVHRR、MODIS反演的月地表温度数据,定量考察了长江三角洲城市群热岛增温效应对区域温度气候趋势的贡献,结果表明:①1992-2003年长江三角洲城市化经历了一个快速的空间扩展过程,宁镇扬、苏锡常、上海大城市区、杭州湾4个城市群构成了一个“之”字形城市带,城市群之间出现城市化连片趋势,城市带区域内1961-2005年年平均气温增温速率为0.28~0.44oC/10a,显著高于非城市带区域。
②城市热岛效应对区域平均温度的影响以夏秋季最强,春季次之,冬季最弱。
③长江三角洲城市带热岛强度和城市总人口对数呈线性正相关关系。
④城市带增温效应使得区域的年平均气温在1961-2005年间增加了0.072°C,其中1991-2005年间增温幅度为0.047°C;年最高气温升高了0.162°C,其中1991-2005年间增温幅度为0.083°C,表明1991-2005年间长江三角洲城市带的空间扩展正在改变区域温度变化趋势,且这种增温趋势显著。

城市化问题及措施的英语作文Urbanization Problem and MeasuresUrbanization is the process of increasing the population and size of cities, resulting in the growth of urban areas. This phenomenon has been occurring rapidly worldwide, particularly in developing countries. While urbanization can bring numerous benefits such as economic growth and improved quality of life, it also poses various challenges and issues that need to be addressed. In this essay, I will discuss the urbanization problem and propose several measures to mitigate its negative effects.One of the primary concerns associated with urbanization is the strain on infrastructure and resources. As cities expand, there is an increased demand for housing, transportation, water, and energy. Insufficient housing can lead to slum areas and overcrowded living conditions,exacerbating social inequality. Inadequate transportation infrastructure results in traffic congestion, air pollution, and long commuting hours. Additionally, the increased consumption of water and energy strains the available resources, potentially leading to scarcity and environmental degradation.Another major challenge of urbanization is the degradation of the urban environment. The rapid urban expansion often occurs at the expense of valuable natural habitats and agricultural land. Deforestation and land conversion for urban development contribute to climate change and loss of biodiversity. Moreover, the concentration of industries and transportation in urban areas results in pollution of air, water, and soil, negatively impacting the health and well-being of urban residents.To tackle these urbanization problems, several measures can be implemented. Firstly, urban planning should beconducted with a long-term perspective, emphasizing sustainable development. This includes the preservation of green spaces, protection of natural ecosystems, and promotion of compact and efficient urban design. By integrating nature into urban areas, cities can create a healthier and more livable environment for their residents.Secondly, investments should be made in the development of infrastructure and public services. This includes the construction of affordable housing, the improvement of public transportation systems, and the provision of adequate water and energy supplies. By ensuring the availability and accessibility of these essential services, cities can accommodate the needs of their growing population and alleviate the strain on existing resources.In addition, education and awareness programs are crucial in addressing urbanization challenges. By promoting sustainable practices, such as waste reduction, recycling,and the use of renewable energy, individuals can contribute to mitigating the negative impacts of urbanization. Educating the public on the importance of biodiversity conservation and environmental protection can also foster a sense of responsibility and stewardship towards the urban environment.Furthermore, the decentralization of economic activities can help alleviate the pressures on urban areas. By developing secondary cities and promoting regional development, the concentration of population and resources in major cities can be reduced. This not only reduces the strain on infrastructure and resources but also promotes balanced regional growth and reduces social inequalities.To conclude, urbanization presents various challenges such as strain on infrastructure, degradation of the urban environment, and social inequalities. However, with proper measures in place, these issues can be addressed. By implementing sustainable urban planning, investing ininfrastructure, promoting education and awareness, as well as decentralizing economic activities, cities can strive towards a more sustainable and inclusive urbanization process.。
第五章城市蔓延机理与治理5.1城市蔓延的概念与测度5.1.1城市蔓延的概念早在1950年代后期,美国众多大城市出现人口增长率减少至0%甚至为负数,而同时郊区的人口不断上涨的状态便引起了美国规划界的广泛关注,并将其称之为“郊区化”。
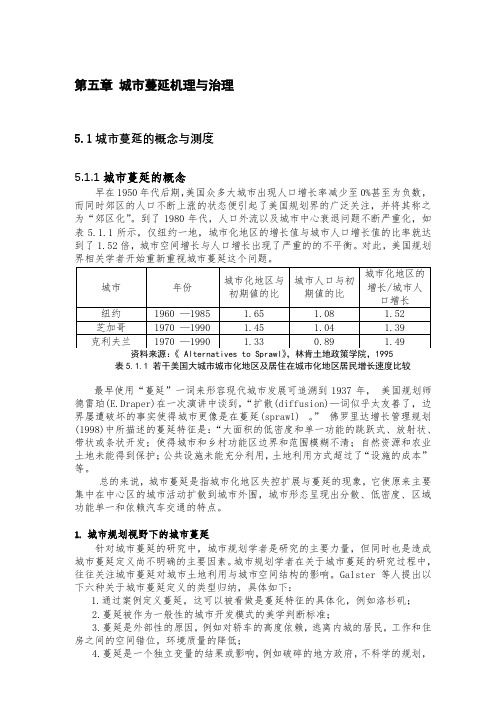
到了1980年代,人口外流以及城市中心衰退问题不断严重化,如表5.1.1所示,仅纽约一地,城市化地区的增长值与城市人口增长值的比率就达到了1.52倍,城市空间增长与人口增长出现了严重的的不平衡。
对此,美国规划界相关学者开始重新重视城市蔓延这个问题。
表5.1.1 若干美国大城市城市化地区及居住在城市化地区居民增长速度比较最早使用“蔓延”一词来形容现代城市发展可追溯到1937年,美国规划师德雷珀(E.Draper)在一次演讲中谈到,“扩散(diffusion)—词似乎太友善了,边界屡遭破坏的事实使得城市更像是在蔓延(sprawl) 。
”佛罗里达增长管理规划(1998)中所描述的蔓延特征是:“大面积的低密度和单一功能的跳跃式、放射状、带状或条状开发;使得城市和乡村功能区边界和范围模糊不清;自然资源和农业土地未能得到保护;公共设施未能充分利用,土地利用方式超过了“设施的成本”等。
总的来说,城市蔓延是指城市化地区失控扩展与蔓延的现象,它使原来主要集中在中心区的城市活动扩散到城市外围,城市形态呈现出分散、低密度、区域功能单一和依赖汽车交通的特点。
1.城市规划视野下的城市蔓延针对城市蔓延的研究中,城市规划学者是研究的主要力量,但同时也是造成城市蔓延定义尚不明确的主要因素。
城市规划学者在关于城市蔓延的研究过程中,往往关注城市蔓延对城市土地利用与城市空间结构的影响。
Galster等人提出以下六种关于城市蔓延定义的类型归纳,具体如下:1.通过案例定义蔓延,这可以被看做是蔓延特征的具体化,例如洛杉矶;2.蔓延被作为一般性的城市开发模式的美学判断标准;3.蔓延是外部性的原因,例如对轿车的高度依赖,逃离内城的居民,工作和住房之间的空间错位,环境质量的降低;4.蔓延是一个独立变量的结果或影响,例如破碎的地方政府,不科学的规划,排他性的分区;5.蔓延被定义为一个或多个现有的开发模式,最经常提到的是低密度和蛙跳,远离中心设施,就业和居住开发的散布,连续的条状开发;6.蔓延被看作是发生在特定时期,例如城市地区扩张时期的开发的过程。

城镇化进程中城市蔓延的增长效应研究r——以长江经济带为例李强;韦薇【摘要】城市蔓延式发展是城镇化进程的显著特征.文章从劳动力、居民消费水平、产业结构、外商直接投资四个方面阐释城市蔓延影响经济增长内在机理,在此基础上,基于长江经济带2005—2015年104个市级面板数据,采用系统广义矩估计法分析城市蔓延经济增长效应.研究表明:城市蔓延对长江经济带城市经济影响显著为正,说明城市空间快速分散且低密度扩张即城市蔓延推动经济快速增长,因此科学合理规划城市空间布局,在注重土地城镇化同时加速推进以人为本的城镇化,是促进长江经济带经济持续健康发展关键.【期刊名称】《东北农业大学学报(社会科学版)》【年(卷),期】2018(016)004【总页数】7页(P6-12)【关键词】城镇化;城市蔓延;长江经济带;经济增长【作者】李强;韦薇【作者单位】安徽财经大学,安徽 300222;安徽财经大学,安徽 300222【正文语种】中文【中图分类】F299.21引言随着改革开放和城镇化不断推进,目前我国城镇化率已达到58.52%,并与工业化、信息化、农业现代化同步推进。
长江经济带是我国最具影响力内河经济带,依托长江黄金水道,不论地理位置还是政治经济均具有重要战略地位。
快速城镇化进程中,长江经济带城镇化建设在全国范围内极具代表性。
《长江经济带发展规划纲要》指出,加快新型城镇化建设是长江经济带发展的重要任务,并提出协调城市空间发展格局,推进农业转移人口城市化,统筹城乡发展等积极措施。
然而,城镇化快速推进,引发长江经济带环境污染、资源浪费严重、社会保障制度不完善、区域发展不平衡、产业转型任务艰巨等一系列社会问题。
城镇化进程中大量农村劳动力流向城市,城市现代化、工业化发展加快,消耗大量能源的同时产生大量生产废料、生活垃圾等污染物,严重影响周围生态环境;同时政府过于注重城市区域土地规模扩张,使得人口城镇化速度跟不上土地城镇化速度,原本集中于城市中心的活动扩散至城市外围,城市空间呈现快速、分散、低密度扩张态势,土地过度扩张导致“鬼城”“空城”现象向各地蔓延,因此城镇化进程中城市蔓延是亟需解决的重点问题。

都市圈城市蔓延:基于经济学模型的演化性分析摘要:都市圈城市空间结构发展日已呈现出蔓延现象。
蔓延现象由多种因素推动形成,用城市经济学观点建立动态模型,分析都市圈城市蔓延的演化复杂性,辨析出都市圈城市蔓延的经济学因素,研究了都市圈蔓延过程的异速生长特性。
abstract: the development of urban spatial structure in metropolis has become sprawl. this phenomenon is driven by a variety of factors.the paper establishes the dynamic model with the urban economics perspective,analyzes the complexity of urban sprawl in metropolitan area, discriminates the economics factors and studies the allometric growth characteristics of urban sprawl.关键词:都市圈;城市蔓延;演化;异速生长key words: metropolitan;urban sprawl;evolution;allometry 中图分类号:f290 文献标识码:a 文章编号:1006-4311(2013)23-0015-020 引言城市蔓延是一种过度的城市空间增长形式,在空间形态上出现大量浪费资源的现象。
以京津冀都市圈为例,该都市圈呈现核心城市高度规模集聚态势,自2005年以来京津冀区域城市体系规模结构并未得到明显改善,城市规模处于无序发展中。
京津与河北省各地级市的城乡结合部对核心城区在社会服务和就业等方面的依赖持续加深,区划过多,投资分散。
同时,京津两市极化效应强烈而渗透效应不足,城市蔓延现象凸显。

Beijing 2020: Embracing Change in the Heartof the CityIn the heart of China, where history and modernity coalesce, Beijing stands as a testament to the dynamism of transformation. The city, which hosted the 2008 Summer Olympics, once again found itself at the center of global attention in 2020, not just for its historical landmarks but for the remarkable changes it has undergone.One of the most striking aspects of Beijing's transformation is its commitment to environmental sustainability. The city, once known for its smoggy skies, has made remarkable progress in reducing air pollution. This is evident in the increased number of green spaces and the推广 of clean energy vehicles. These efforts have not only improved the quality of life for residents but also positioned Beijing as a leader in environmental protection among major cities globally.Another remarkable transformation is the city's embrace of technology. With the advent of smart city initiatives, Beijing has become a hotspot for innovation and technology adoption. The integration of artificial intelligence, bigdata, and the internet of things has transformed various sectors, from transportation to healthcare. This technological revolution has not only made life more convenient for citizens but has also attracted a wave of tech-savvy talent and investors.Cultural preservation and innovation also play apivotal role in Beijing's story. The city, with its rich historical heritage, has successfully balanced the preservation of its cultural identity with contemporary expressions. This is evident in the way it has rejuvenated traditional arts and crafts, such as Peking Opera and Chinese painting, while also fostering a vibrant contemporary art scene. This cultural diversity has made Beijing a global hub for cultural exchange and understanding.Moreover, Beijing's commitment to social progress is evident in its education and healthcare systems. The city has made significant investments in improving access to quality education and healthcare services, particularly for its rural and underserved communities. This commitment to inclusivity and equality has helped solidify Beijing'sposition as a city that cares for its citizens, regardlessof their backgrounds.In conclusion, Beijing's transformation is not just a physical one; it's a testament to the city's spirit of innovation, sustainability, and inclusivity. As we look ahead to the future, Beijing continues to embrace change, ready to take on new challenges and opportunities that lie ahead. It is this dynamic spirit that makes Beijing notjust a city of history but also a city of hope for the world.**北京2020:城市中心的变革拥抱**在中国的心脏地带,历史与现代交织,北京作为变革的活生生的证明,屹立不倒。
北京城市化发展英文作文Beijing, the capital city of China, has undergone rapid urbanization in the past few decades. The city has seen a massive influx of people from rural areas, leading to a significant increase in population.The urban development in Beijing has brought about a plethora of opportunities for its residents. The city has witnessed the construction of modern infrastructure, including skyscrapers, highways, and subway systems, which has greatly improved the living standards of the people.However, the rapid urbanization has also resulted in various challenges for Beijing. The city is facing issues such as traffic congestion, air pollution, and inadequate public services. The increasing population has put a strain on the city's resources and infrastructure.Despite the challenges, Beijing's urban development has also led to the preservation and restoration of itscultural heritage. The city has made efforts to protect its historical sites and traditional neighborhoods, which are an integral part of its identity.In conclusion, Beijing's urbanization has brought about both opportunities and challenges. The city has experienced significant growth and development, but it also faces various issues that need to be addressed. As Beijing continues to urbanize, it is crucial to find sustainable solutions to ensure the well-being of its residents and the preservation of its cultural heritage.。
西方城市蔓延的界定与测度作者:李强, LI Qiang作者单位:北京工业大学,建筑与城市规划学院,北京,100022刊名:北京工业大学学报英文刊名:JOURNAL OF BEIJING UNIVERSITY OF TECHNOLOGY年,卷(期):2006,32(9)被引用次数:2次1.GOTTMANM J Megalopolis:the urbanized northeastern seaboard of the United States 19612.约翰·M·利维;张景秋现代城市规划 20033.GEDDES P Cities in Evolution 19684.DUTTON J A New American urbanism:re-forming the suburban metropolis 20005.GILLHAM O The limitless city:a primer on the urban sprawl debate 20026.BERLIN C Sprawl comes to the american heartland 2002(04)7.SIERRA Club1998 Sierra Club sprawl report 19988.BRUECKNER J K;FANSLER D A The economics of urban sprawl:theory and evidence on the spatial sizes of cities 1983LS E S Book review of Urban sprawl causes,consequences and policy responses 200310.HARVEY R O;CLARK W A V The nature and economics of urban sprawl 1965(01)11.OWLAFE P K City-region form and municipal property tax dependency:enhancing the prospects for more sustainable development of the Manitoba Capital Region 200112.DUTTON J A New American urbanism:re-forming the suburban metropolis 200013.FULTON W;PENDALL R;NGUYEN M Who sprawls most? How growth patterns differ across the U.S 200114.LOPEZ R;HYNES H P Sprawl in the 1990s:Measurement,distribution and trends 200315.KAHN M Does sprawl reduce the black/white housing consumption gap? 2001(01)16.KOLANKIEWICZ L;BECK R Weighing Sprawl Factors In Large U.S.Cities:Analysis of U.S.Bureau of the Census Data on the 100 Largest Urbanized Areas of the United States 200117.SQUIRES G D Urban sprawl:causes,consequences,& policy responses 200218.GALSTER G;HANSON R;WOLMAN H Sprawl to the ground:Defining and measuring an elusive concept2001(04)19.HASSE J E Geospatial Indices of urban sprawl in New Jersey 200220.HASSE J E;LATHROP R G Land resource impact indicators of urban sprawl[外文期刊] 20031.陈明星.叶超.付承伟国外城市蔓延研究进展[期刊论文]-城市问题2008(4)2.陈建华.Chen Jianhua我国城市蔓延问题成因分析[期刊论文]-现代经济探讨2009(4)3.冯科.吴次芳.韩昊英.FENGKe.WU Cifang.HAN Haoying国内外城市蔓延的研究进展及思考——定量测度、内在机理及调控策略[期刊论文]-城市规划学刊2009(2)4.张坤.ZHANG Kun城市蔓延度量方法综述[期刊论文]-国际城市规划2007,22(2)5.朱杰.ZHU Jie抑制城市蔓延的可持续发展路径及对中国的启示[期刊论文]-国际城市规划2009,24(6)6.刘卫东.谭韧骠.LIU Weidong.TAN Renbiao杭州城市蔓延评估体系及其治理对策[期刊论文]-地理学报2009,64(4)7.马祖琦.MA Zu-qi从"城市蔓延"到"理性增长"——美国土地利用方式之转变[期刊论文]-城市问题2007(10)8.李强.刘安国.朱华晟西方城市蔓延研究综述[期刊论文]-外国经济与管理2005,27(10)9.王子彦.高红樱.WANG Zi-yan.GAO Hong-ying值得重视的城市蔓延问题[期刊论文]-东北大学学报(社会科学版)2005,7(6)10.孙燕红.宗跃光.柯丹.王波.王燕军.SUN Yan-Hong.ZONG Yue-guang.KE Dan.WANG Bo.WANG Yan-jun空间生态价值评价方法在城市蔓延控制中的运用——以陕西省西安中心市区为例[期刊论文]-现代城市研究2011(5)1.孟祥菁城市蔓延的成因分析--以武汉市为例[期刊论文]-经济视野 2013(17)2.洪世键.张京祥城市蔓延的界定及其测度问题探讨——以长江三角洲为例[期刊论文]-城市规划 2013(7)本文链接:/Periodical_bjgydxxb200609010.aspx。
Urbanization in China: A Snapshot throughStatisticsUrbanization, a pivotal process in the development trajectory of any nation, has been particularly noteworthy in China over the past few decades. The transformation from a predominantly rural society to an increasingly urbanized one is reflected in a range of statistical indicators, offering a glimpse into the profound changes sweeping across the country.One of the most striking aspects of China’s urbanization is the rapid growth in urban population. According to recent statistics, the urban population in China has skyrocketed, accounting for a significant proportion of the total population. This shift is not just a matter of numbers; it represents a fundamental change in the way people live, work, and consume.The urbanization process has also been marked by the emergence of megacities and urban agglomerations. Cities like Beijing, Shanghai, and Guangzhou have grown exponentially, attracting millions of migrants from rural areas. These cities have become hubs of economic activity,innovation, an d culture, driving the country’s overall growth and development.However, the rapid urbanization in China has not been without its challenges. Infrastructure development, environmental protection, and social integration have emerged as key issues that need to be addressed. The government has taken several measures to mitigate these challenges, including investing heavily in urban infrastructure, promoting sustainable development practices, and implementing policies to ensure the inclusive growth of urban areas.Despite these challenges, the urbanization process in China remains a powerful force for transformation and progress. It is not only reshaping the country’s economic landscape but also influencing social, cultural, andpolitical dimensions. As China continues to urbanize, it presents an interesting case study for other developing nations seeking to navigate the complexities ofurbanization while ensuring sustainable and inclusive growth.In conclusion, the urbanization of China is aremarkable phenomenon that offers valuable insights intothe dynamics of urban development in a rapidly changing world. Through a careful analysis of statistical data, we can gain a deeper understanding of the trends, challenges, and opportunities associated with this process. As China continues to urbanize, it remains to be seen how it will balance the demands of growth with the need forsustainability and inclusivity.**中国城市化进程:统计数据的缩影**城市化,作为任何国家发展轨迹中的关键进程,在过去几十年里在中国尤为引人注目。
Rapid Urbanization in ChinaIn the past few decades, China has undergone a remarkable transformation, with its urbanization process happening at an unprecedented speed. This rapid urbanization has been a defining feature of the country's development, shaping its landscape, economy, and society in profound ways.China's urbanization is not just a matter of numbers;it's a testament to the country's incredible growth and development. The urban population in China has skyrocketed, with millions of people moving from rural areas to cities in search of better jobs, education, and living conditions. This migration has led to the emergence of new cities and the expansion of existing ones, creating a vibrant urban landscape that is constantly evolving and expanding.The rapid urbanization has had significant impacts on China's economy. As more people move to cities, they contribute to the growth of the urban economy, driving demand for goods and services. This, in turn, has led to the development of new industries and businesses, creating jobs and opportunities for the urban population. The urbaneconomy has become a key driver of China's overall economic growth, with cities like Beijing, Shanghai, and Guangzhou becoming global hubs for business and trade.However, the rapid urbanization has also presented challenges. The influx of people into cities has led to issues like overcrowding, pollution, and traffic congestion. The demand for housing, infrastructure, and public services has also skyrocketed, putting a strain on urban resources. Addressing these challenges requires smart planning and investment in sustainable urban development.The Chinese government has recognized the need for sustainable urbanization and has taken steps to address the challenges. This includes investing in infrastructure development, promoting green building practices, and improving public transportation systems. The government has also focused on providing affordable housing and improving access to public services for the urban population.In addition to the economic and societal impacts,China's rapid urbanization has also had cultural implications. The urban lifestyle has influencedtraditional customs and ways of life, leading to changes insocial norms and behaviors. The urban environment has also become a platform for the expression of modern art and culture, attracting artists and creators from around the world.Looking ahead, China's urbanization is expected to continue, with more people moving to cities in the coming years. This presents both opportunities and challenges for the country. To ensure sustainable urban development, it will be crucial for the government and society to work together to address the challenges and seize the opportunities that urbanization brings.China's rapid urbanization is a remarkable feat that has transformed the country's landscape and economy. It has created new opportunities and challenges, shaping thefuture of China in profound ways. As the urbanization process continues, it will be important for China to continue to invest in sustainable urban development and address the challenges that arise to ensure a bright and prosperous future for its cities and its people.**中国城市化迅速变化**在过去的几十年里,中国经历了显著的变化,其中城市化进程以空前的速度发展。
Journal of Geographical Sciences© 2007 Science in China Press Springer-VerlagReceived : 2007-01-20 Accepted : 2007-04-15Foundation : National Natural Science Foundation of China, No.40571056; Sustentation Fund on Doctoral Thesis fromBeijing Science and Technology Committee, No.ZZ0608Author: Jiang Fang (1979−), Ph.D, specialized in the study on regional and urban sustainable development, land use plan-ning and urban agriculture. E-mail: jiangfang1979@ DOI: 10.1007/s11442-007-0469-zMeasuring urban sprawl in Beijing withgeo-spatial indicesJIANG Fang 1,2, LIU Shenghe 1, YUAN Hong 1,2, ZHANG Qing 1,21. Institute of Geographic Sciences and Natural Resources Research, CAS, Beijing 100101, China;2. Graduate University of Chinese Academy of Sciences, Beijing 100039, ChinaAbstract: Concerning about the rapid urban growth in recent China, this study takes Beijing as a case and puts forward that urban sprawl can be measured from spatial configuration, urban growth efficiency and external impacts, and then develops a geo-spatial indices system for measuring sprawl, a total of 13 indicators. In order to calculate these indices, different sources data are selected, including land use maps, former land use planning, land price and floor-area-ratio samples, digitized map of the highways and city centers, population and GDP statistical data, etc. Various GIS spatial analysis methods are used to spatialize these indices into 100m ×100m cells. Besides, an integrated urban sprawl index is calculated by weight sum of these 13 indices. The application result indicates that geo-spatial indices system can capture most of the typical features and interior differentia of urban sprawl. Construction land in Beijing has kept fast growing with large amount, low efficiency and disordered spatial con-figuration, indicating a typical sprawling tendency. The following specific sprawl features are identified by each indicator: (1) typical spatial configuration of sprawling: obvious fragmenta-tion and irregularity of landscape due to unsuccessful enforcement of land use planning, unadvisable pattern of typical discontinuous development, strip development and leapfrog development; (2) low efficiency of sprawl: low development density, low population density and economic output in newly developed area; and (3) negative impacts on agriculture, environment and city life. According to the integrated sprawl index, the sprawling amount in the northern part is larger than that in the southern, but the sprawling extent is in converse case; most sprawling area include the marginal area of the near suburbs and the area between highways, etc. Four sprawling patterns are identified: randomly expansion at urban fringe, strip development along or between highways, scattered development of industrial land, leapfrog development of urban residence and industrial area.Keywords: urban sprawl; measurement; geo-spatial indices; Beijing1 IntroductionIn the late 1950s, urbanized areas in USA have extended outside rapidly during the subur-470 Journal of Geographical Sciences banization process of residence, industry and commerce, which encroach large amount of farmland and forest, brought negative effects to environment and cause more traffic prob-lems. This pattern of urban development out of control has been regarded as “urban sprawl” (Zhang, 2004). Urban sprawl has aroused wide social focus because it is possible to impede regional sustainable development. Related studies have come out consequently which mainly cover the features, the cause, impacts of sprawl and countermeasures as well.Urban sprawl also has emerged in some regions of China during the rapid urbanization period. Land development has been out of control and the construction land has kept ex-panding blindly, especially in the marginal areas of some metropolises. Some experts pointed out: the urban sprawl phenomenon in the past decade is extremely severe, and the tendency of scattered development and sprawling growth has been formed, which will seri-ously impede the modernization process of China if the rash urbanization could not be kept under control (Lu, 2006). Recently, the negative impacts of urban sprawl have got more awareness, and then the related departments of government have started to seek solutions for urban sprawl. Many scholars also have proposed policy suggestions on growth management (Liu, 2002; Sun, 2003; Yan, 2000).As for seeking solutions for urban sprawl, the first step is to analyze sprawl features so as to explore the cause of sprawl with which it is possible to put forward practicable counter-measures. However, the understanding on urban sprawl in China still rest on qualitative dis-cussion instead of quantitative analysis. There is no clear answer on how to identify sprawl, evaluate the extent of sprawl or estimate the policy effect. The existing methods for meas-uring urban sprawl are mainly put forward within the context of Western developed coun-tries. So those methods are not exactly developed for analyzing the spatial features and unique mechanism of urban sprawl within Chinese context.Beijing is a typical case of urban sprawl because the built-up area has increased very fast and gradually formed a situation of extensive development via various spatial patterns in-cluding circularity expanding, sector growth, corridor radiation, leapfrog and in-filling de-velopment (Liu, 2000; Zong, 2002; Xu, 2002; He, 2003). Thus, based on the conclusion of previous studies, this paper takes Beijing as a study area to put forward geo-spatial indices for measuring sprawl so as to contribute to decision-making on regulating sprawl.2 Geo-spatial methods for measuring urban sprawl in Beijing2.1 A review of measuring urban sprawlAccording to overseas literatures on measuring sprawl, various indices are widely used as the primary method. Some research organizations have put forward their indices for meas-uring sprawl, among which the most influential ones are raised by Sierra Club, USA Today and Smart Growth America. Sierra Club (1998) ranked major metropolitans in USA by four sprawl indices, including: population moving from inner city to suburbs; comparison of land-use and population growth; time cost on traffic; and decrease of open space. USA To-day (2001) put forward the share of population beyond SMSA (Standard Metropolitan Sta-tistical Area) as an indicator for measuring sprawl. Smart Growth America (2002) carried out a research to study the impacts of sprawl on life quality in which four indices were used to measure urban sprawl: residential density; mixture of residence, employment and serviceJIANG Fang et al.:Measuring urban sprawl in Beijing with geo-spatial indices 471 facilities; vitalization of inner city; and accessibility of road network.Besides, some overseas scholars also have contributed to measuring sprawl (Nelson,1999; Kline J D, 2000; Paul M Torrens, 2000; George Galster, 2000; Edward Glaeser,2001; Carlo Lavalle, 2002; John E Hasse, 2003; F Patrick Holmes, 2005; Gerald Shoultz,2005; Marjo Kasanko, 2006) by establishing multi-indices by GIS analysis or descriptivestatistical analysis. Those indices cover various aspects including population, employ-ment, traffic, resources consumption, architecture aesthetics and living quality etc.Commonly used indices include: growth rate, such as growth rate of population orbuilt-up area; density, such as population density, residential density, employment den-sity; and spatial configuration, such as fragmentation, accessibility and proximity.Generally speaking, most of the overseas studies took whole city as the analysis unit tocalculate these indices, which could exactly reflect the sprawling situation of a whole city orregion, but the interior differentia of sprawl in a given city could not be well depicted.Moreover, some indices are raised based on the context of Western urbanization; therefore,they are not so suitable for measuring sprawl in China, such as the share of detached house.Besides, some necessary statistic data are not successive enough to calculate certain indica-tor, such as the density of employment.As for China, some indices developed for measuring urban expansion could be usedfor reference. Those indices include: those reflecting spatial features, such as density ofbuilt-up area (Huang, 2006), intensity of annual growth (Liu, 2000; Xiao, 2003; Chen,2004); those reflecting growth scale, such as the area or share of urban growth (Fan,1997); those reflecting growth speed, such as annual growth rate (Liu, 2002), elasticityof urban growth to population (Chen, 2005); and those reflecting landscape configura-tion, such as shape index, fractural dimension, isolation index, etc. (Zhang, 2004; Zhu,2005; Yang, 2005). The latter three types of indices are suitable for analyzing generalsituation of sprawl, but not fit in illustrating interior differentia. The density of built-uparea and intensity of annual growth could efficiently depict the sprawl features of lowdensity and strong change, but they are still weak in capturing the particular spatial pat-terns of urban sprawl.To sum up, the overseas sprawl indices could not be directly applied to the Chinese con-text. The existing indices on urban expansion in the Chinese context could not be simplyused to measure urban sprawl either. So this paper proposes a series of geo-spatial indicesfor measuring sprawl based on the case of Beijing in China.2.2 Geo-spatial indices for measuring sprawl in BeijingGenerally speaking, urban sprawl is an urban growth pattern with the features of low density,dispersion, automobile-dependent and other environmental and social effects (Richard Moe,1993; Ewing, 1997; Downs, 1998; Burchell and Shad, 1999). Sprawl in China refers to rapid,low-efficient and disorderly growth of non-agricultural land towards peripheral areas.According to this working definition, 13 geo-spatial indices are selected from various as-pects of spatial configuration, growth efficiency and external impacts in order to measuresprawl (Figure 1). Six indices including size and shape of land use patches, consistency withplanning and three typical growth patterns are adopted to reflect spatial configuration of ur-ban growth. Four indices including horizontal and vertical building density, population den-472Journal of Geographical SciencesFigure 1 Geo-spatial indices for measuring urban sprawl in Beijingsity and GDP density are used to demonstrate the efficiency of urban growth. Another three indices including arable land loss, open space loss and traffic burden are applied to indicate the impacts on agriculture, environment and city life.3 Measuring urban sprawl in Beijing3.1 Study areaBeijing is located in the northwestern edge of North China Plain. The total area of Beijing is 16,410 km 2, among which mountainous areas account for 61.4%, and plain areas account for 38.6%. By the end of 2005, the total population of Beijing had come to 15.38 million, with 83.6% being urban population. During the period of the Tenth Five-Year Plan (2000–2005), the GDP increased 11.9% annually, reaching 681.45 billion RMB yuan by 2005. With rapid economic development, the area of non-agricultural land increased very fast but with low efficiency. From 1996 to 2004, non-agricultural land increased by 965 km 2, with an annual growth rate of 4.6%, which is twice as that of population. Each increment of 100 million yuan in GDP consumes 36 hm 2 of land for construction accordingly.3.2 Data sources and methodologyBasic data source includes population at town level of Beijing from the fifth national census in 2000, population at county level by 1% sample survey in 2005, GDP at county level of Beijing in 2005 from Beijing Yearbook, land use maps in 1996 and 2004 from land use up-date surveys, the existing land-use master planning (1997–2010), the map of floor-area ratio derived from land transactions cases from 1998 to 2003 and the vector maps of highways and city centers digitized from the hardcopy of Beijing geographical base map (Table 1).3.3 Results of measuring sprawl in Beijing(1) Sprawl features on spatial configuration: fragmentation and irregularity of land use patches, strong evidence for discontinuous, strip and leapfrog development, and noticeable planning inconsistency.Measuring SprawlJIANG Fang et al.:Measuring urban sprawl in Beijing with geo-spatial indices 473Table 1Definition of geo-spatial indices for measuring sprawl in BeijingIndex Data source Calculation methodsAI Area index Land use maps Overlay analysis, vector converting to grid; AI= patch area of newly developedSI Shape index Land use maps Overlay analysis, vector converting to grid; SI= 0.25×Perimeter/SQRT (area)DDI DiscontinuousdevelopmentindexLand use mapsDistance analysis, vector converting to grid;DDI=distance between newly developed and previouslydeveloped landSDI Strip develop-ment indexLand use maps;map of highwaysDistance analysis, vector converting to grid;SDI=distance between newly developed patches and high-waysLDI LeapfrogdevelopmentindexLand use maps;map of centers(point)Distance analysis, vector converting to grid;LDI=distance between newly developed patches and countycentersPCI PlanningconsistencyindexLand use maps;map of planningOverlay analysis, vector converting to grid;PCI={1, 0}, 1 stands for inconsistency with planHDI Horizontaldensity indexLand use map in2004Neighborhood analysis;HDI=The share of non-agricultural land area withinneighborhood of 1 km2VDI Vertical densityindexMap of floor-arearatioKriging Interpolation Analysis (samples Num: 2226);VDI=ratio of floor area to land areaPDI Populationdensity indexPopulation at townlevel; land use mapin 2004Kriging Interpolation Analysis (samples Num: 200);PDI=ratio of population to land areaGDI GDP densityindexGDP at countylevel in 2005Vector converting to grid;GDI=ratio of GDP to land areaAII Agricultureimpact indexLand use mapsOverlay analysis;AII={1, 0}, 1 stands for arable land lossOII Open spaceimpact indexLand use mapsOverlay analysis;OII={1, 0}, 1 stands for open space lossTII Traffic impactindexPDI; map ofcenters (polygon)Spatial modeling;TII=simulated population×distance to centersMethods for calculating indices are as follows: 1) data preparation by which to process various data so as to establish practicable database for each index; 2) spatialization processing for each index by spatial analysis or modeling so as to integrate all indices into the same grid platform of 100m×100m; 3) standardization processing by which to normalize these indices with different dimensions; and 4) weighting these indices by paired comparison method and then sum up all standardized indices into one integrated sprawl index (Table 1). The formula is given below:USI=−0.02[AI]+0.02[SI]+0.08[DDI]−0.09[SDI]+0.10[LDI]+0.14[PCI]−0.05[HDI]−0.05[VDI] −0.05[PDI] −0.05[GDI] +0.12[AII] +0.12[OII] +0.12[TII] (1) where USI stands for integrated urban sprawl index. Each sum term stands for one of 13 indices respectively, operator reflects the correlation with urban sprawl.As AI indicates, land use patches are of obvious fragmentation tendency. From 1996 to 2004, the patch number of non-agricultural land increased by 31%; meanwhile the average patch size only increased by 13%. The average patch size of the newly developed land (NDL) is only 1.52 km2, and 64% of them are less than 1 km2 (Figure 2a).As SI indicates, land use patches become more irregular. The average shape index of the NDL patch is 1.7, and the shape index is relatively wide, ranging from 0.97 to 4.33. About 65% of them are over 1.7 (Figure 2b).As PCI indicates, land development is lacking of effective planning management. Much NDL is inconsistency with the previous land use planning. Taking urban land for instance, there are two types of inconsistency with planning. One is “developed but not planned”: Some 35% of the urban NDL is beyond the planning area. The other is “planned but not de-veloped”: 7% of the planning areas have not been developed yet (Figure 2c).474 Journal of Geographical SciencesFigure 2The spatialization results of six indices on spatial configurationFigure 3The spatialization result of four indices on growth efficiencyAccording to the result of DDI, SDI and LDI, non-agricultural land is of strong evidence for discontinuous development, strip development and leapfrog development. As DDI indi-JIANG Fang et al.:Measuring urban sprawl in Beijing with geo-spatial indices 475 cates, 63% of the NDL is not adjacent to the previously developed lands. The average dis-tance between the NDL to the previously developed lands is 0.26 km (Figure 2d). As SDIindicates, the NDL has a typical feature of strip development, especially urban land. Theaverage distance between the urban NDL and highways is 4.79 km, and nearly 55% of theurban NDL is located in the 2-km buffer of the highways (Figure 2e). As LDI indicates, theNDL has a typical feature of leapfrog development. The average distance between the NDLand city centers is about 12 km, and 55% of the NDL has a distance over 10 km to city cen-ters (Figure 2f).(2) Sprawl features on growth efficiency: low density and low efficiency of the NDL.As HDI indicates, the horizontal density of the NDL is lower than before. The averagedensity of the NDL from 1996 to 2004 is 0.35, while the average density in 1996 is 0.52.Moreover, there is distinct spatial difference. For instance, the density in the outer suburb isless than 1/5 of that in the central area or 1/3 of that in the near suburbs (Figure 3a).As VDI indicates, the vertical density of the NDL is still lower. The floor area ratio rangesfrom 0.28 to 8.18 with an average of 1.26, and about 90% of the NDL with a floor area ratioof less than 2. What’s more, the floor area ratio in outer suburbs is much lower (Figure 3b).According to the result of PDI and GDI, the efficiency of the NDL still needs to be furtherimproved. As PDI indicates, the population capacity of the NDL is relatively low. The aver-age population density of the NDL is 2020 persons/km2, much lower than that of the previ-ously developed lands in 1996 (4091 person/km2) (Figure 3c). As GDI indicates, the eco-nomic output of the NDL is not high as expected. The average GDP density of the NDL is 54million yuan/km2, lower than that of the previously developed lands in 1996 (113 millionyuan/km2). Besides, only 30% of the NDL is located in the area with GDP density exceeding100million yuan/km2 (Figure 3d).(3) Sprawl features on external impacts: negative effects on agriculture, environment andcity life.According to the result of AII, OII and TII, urban sprawl has brought significant effectson agriculture, environment and city life. Firstly, urban sprawl has led to huge loss of highquality arable lands in the suburbs. Some 870 km2 of the NDL were transferred from arableland from 1996 to 2004 (Figure 4a). Secondly, urban sprawl has encroached upon limitedopen space, such as forests, grassland and water area. 156 km2 of the NDL were transferredfrom open space from 1996 to 2004 (Figure 4b). Thirdly, the urban sprawl caused trafficburden increases the distance between the NDL and city centers where job opportunitiesconcentrate upon. The average distance increased 21% from 1996 to 2004 (Figure 4c).(4) Interior differentia of sprawl: more sprawling in the northern part, severer sprawling atthe marginal area of the near suburbs and the area between highways, four typical sprawlingpatterns including randomly expansion at urban fringe, strip development along highways,scattered development of industrial land and leapfrog development of urban residence andindustrial area.According to the integrated urban sprawl index, the NDL could be classified into fourcategories: rational growth, low sprawling, moderate sprawling and high sprawling by natu-ral break method (Figure 5). The result shows that sprawling amount in the northern part islarger than that of the southern, but the sprawling extent is in converse case. Rational growthaccounts for over 20% in the northern part, while high sprawling accounts for 40% in the476 Journal of Geographical Sciences southern. Besides, severer sprawling mainly concentrates in the marginal area of the near suburbs and the area between highways. Four typical sprawling patterns could be identified: randomly expansion at urban fringe, strip development along highways, scattered develop-ment of industrial land and leapfrog development of urban residence and industrial area.Figure 4The spatialization results of three indices on external impactsFigure 5 Measuring result by Integrated Urban Sprawl Index4 Conclusion and discussionThis paper proposes a method for measuring sprawl. The analysis result shows that non-agricultural land in Beijing has kept fast growing with large amount, low efficiency and disordered spatial configuration, indicating a typical sprawling tendency. The following spe-cific sprawl features are identified: obvious fragmentation and irregularity of landscape due to unsuccessful enforcement of land use planning; unadvisable pattern of land use growthJIANG Fang et al.:Measuring urban sprawl in Beijing with geo-spatial indices 477 with typical discontinuous development, strip development and leapfrog development; lowdensity of land use growth, low population density and economic output in the NDL; andother negative impacts on agriculture, environment and city life. According to the integratedsprawl index, sprawling amount in the north part is larger than that in the southern, but thesprawling extent is in converse case; severer sprawling areas include the marginal area of thenear suburbs and the area between highways, etc. Four sprawling patterns are identified:randomly expansion at urban fringe, strip development along highways, scattered develop-ment of industrial land and leapfrog development of urban residence and industrial area.The application result indicates that the geo-spatial indices system can capture most of thesprawl features and interior differentia as well. Specifically, six indices on spatial configura-tion are most effective. Patch Area and Shape Index could directly depict the microcosmicfeatures; Discontinuous Development Index, Strip Development Index and Leapfrog De-velopment Index could indicate the growth pattern; and Planning Consistency Index exam-ines the enforcement of planning. Four indices on growth efficiency are more dependant onthe precision of spatializing process, especially the GDP Density Index. Due to the limitationof statistic data, the depiction on spatial differentia of economic output is not sufficient yet.Three indices on external impacts could comparatively quantify the impacts on arable landloss, opens space loss and traffic burden, but there are still other impacts of sprawl, such asenergy consumption, not being included in the indices system due to data limitation.ReferencesBeijing Statistics Bureau, Survey Office of the National Bureau of Statistics in Beijing. 1% Sample Population Survey Report in 2005. /Beijing Statistics Bureau, Survey Office of the National Bureau of Statistics in Beijing. Beijing National Eco-nomic and Social Development Report in 2005 and Tenth Five-Year Plan. Burchell R W, Shad N A, 1999. The evolution of the sprawl debate in the United States. West Northwest, 5(2): 137−160.Carlo Lavalle, N McCormick, Kasanko M et al., 2002. Monitoring, planning and forecasting dynamics in Euro-pean areas: The territorial approach as key to implement European policies. Technical Report of MOLANDProgram, 1−8. http://moland.jrc.it/Chen Benqing,Xu Hanqiu, 2005. Urban expansion and its driving force analysis using romote sensed data: A case of Xiamen City. Economic Geography, 25(1): 79−83. (in Chinese)Chen Longqian, Guo Dazhi, Hu Zhaoling, 2004. Research on spatial differentiation of urban growth using multi-temporal landsat thematic mapper satellite remote sensing images. Journal of China Coal Society, 29(3):308−312. (in Chinese)Downs A, 1998. How America’s cities are growing: The Big Picture. Brookings Review, 16(4): 8–12.Edward Glaeser, Matthew Kahn, Chenghuan Chu, 2001. Job Sprawl: Employment Location in U.S. Metropolitan Areas, Survey Series of Center for Urban & Metropolitan Policy, The Brookings Institution, 1–8.Ewing R, 1997. Is Los Angeles-style sprawl desirable? Journal of the American Planning Association, 63(1): 107–126.Fan Zuojiang, Cheng Jicheng, Li Qi, 1997. Study on urban growth by using RS and GIS analysis. Remote Sensing Information, (3): 12–16. (in Chinese)George Galster, Royce Hanson, Hal Wolman et al., 2000. Wrestling sprawl to the ground: Defining and measuring an elusive concept. Working Paper of Fannie Mae, 1–38.Gerald Shoultz, 2005. ASPH/CDC Fellow, National Center for Health Statistics, Measures of Sprawl Applied to Urban and Rural Areas, and Cardiovascular Disease Mortality: A Bayesian Spatial Analysis. Population Asso-478 Journal of Geographical Sciencesciation of America Annual Meeting Report, 1–3.He Chunyang, Chen Ji, Shi Peijun, 2003. City expansion model of metropolitan area in China: A case study of Beijing. Acta Geographica Sinica, 58(2): 294–304. (in Chinese)Holmes F Patrick. Rockies Sprawl Index, Annual Research Report of the Rockies Project, 2005. 61–70./.Huang Yue, Chen Xi, Bao Anming et al., 2006. Urban sprawl pattern and spatial features of Urümqi City during the last 15 years. Journal of Glaciology and Geocryology, 28(3): 364–370. (in Chinese)John E Hasse, Richard G Lathrop, 2003. Land resource impact indicators of urban sprawl. Applied Geography, 23: 159–175.Kline J D, 2000. Comparing states with and without growth management analysis based on indicators with policy implications comment. Land Use Policy, 17: 349–355.Liu Shenghe, Wu Chuanjun, Shen Hongquan, 2000. Beijing urban land growth pattern based on GIS analysis.Acta Geographica Sinica, 55(4): 407–416. (in Chinese)Liu Shenghe, 2002. Spatial pattern and dynamic mechanism of urban land use growth. Progress in Geography, 21(1): 43–50. (in Chinese)Lu Datao. Rash urbanization process will lead to endless negative impacts. December 31, 2006. (in Chinese)./html/Dir/2006/12/30/14/65/68.htmMarjo Kasanko et al., 2006. Are European cities becoming dispersed? A comparative analysis of 15 European urban areas. Landscape and Urban Planning, 77: 111–130.Nelson A C, 1999. Comparing states with and without growth management: Analysis based on indicators with policy implications. Land Use Policy, 16: 121–127.Paul M Torrens, Marina Alberti, 2000. Measuring Sprawl. Working Paper Series of Centre for Advanced Spatial Analysis, 1–43.Reid Ewing, Rolf Pendall, Don Chen. Measuring Sprawl and Its Impacts, 2002. 1–42. http://www. .Richard Moe, 1993. National trust for historic preservation, from communities at risk: The consequences of Sprawl.Sierra Club, 1998. The Dark Side of the American Dream. Research Report. http://www.sierraclub. org/ sprawl/report98/report.asp.Sun Chengren. Smart growth, the future of Chinese cities. Ministers and Governors Forum, 2003-11-29. (in Chi-nese)USA Today. A Comprehensive Look at Sprawl in America, 2001. /news/sprawl/ main.htm.Xiao Jieying, Ge Jingfeng, Shen Yanjun, 2003. Analysis on urban land use sprawl by using GIS: The case of Shi-jiazhuang City, China. Geographical Research, 22(6): 789–798. (in Chinese)XinHua Net. Beijing Channel, Beijing Introduction. /bjpd-whsd/sq.htmXu Xiaoli, Shi Peijun, He Chunyang, 2002. The urbanization process comparison of Beijing and Shenzhen. Ad-vance in Earth Sciences, 17(2): 221–229. (in Chinese)Yan Jinming, 2005. Land Resource Management Calls for Rational Notion. People Forum, (6): 40–41. (in Chi-nese)Yang Yingbao, Jiang Nan, Su Weizhong, 2005. Dynamics of landscape ecology in Nanjing city revealed by RS and GIS. Resources and Environment in the Yangtze Basin, 14(1): 34–39. (in Chinese)Zhang Bo, 2004. Study on Urban Growth Management in China. Beijing: Xinhua Press. 56–57. (in Chinese) Zhang Liqua, Wu Jiaping, Zhen Yu, 2004. A GIS-based gradient analysis of the urban landscape pattern of Shanghai Metropolitan Region. Acta Phytoecologica Sinica, 28(1): 78–85. (in Chinese)Zhu Ning, Wang Jiandi, 2005. Spatial configuration change of urban growth in Hangzhou. Zhejiang Economy,(16): 59. (in Chinese)Zong Yueguang, Zhou Shangyi, Zhang Zhenshi, 2002. Spatial characteristics of suburbanization and its develop-ing strategies in Beijing. Acta Geographica Sinica, 57(2): 135–142. (in Chinese)。