拉曼光谱培训教材
- 格式:pdf
- 大小:8.34 MB
- 文档页数:58
激光拉曼光谱实验讲义一 实验目的1、 了解拉曼散射的基本原理2、 学习使用拉曼光谱仪测量物质的谱线,知道简单的谱线分析方法。
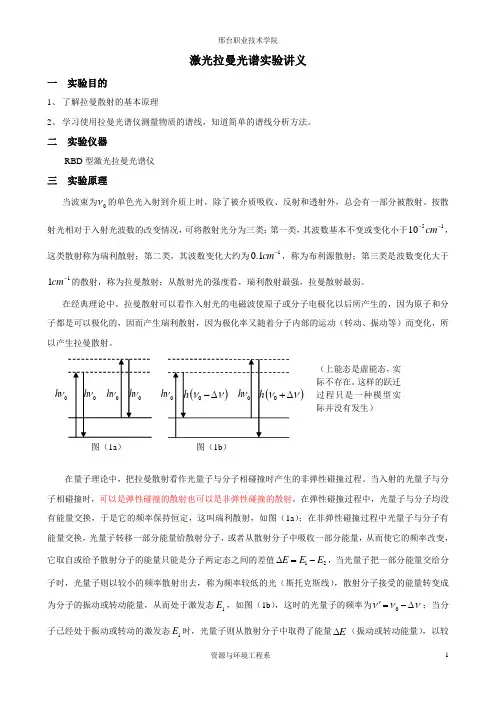
二 实验仪器RBD 型激光拉曼光谱仪三 实验原理当波束为0ν的单色光入射到介质上时,除了被介质吸收、反射和透射外,总会有一部分被散射。
按散射光相对于入射光波数的改变情况,可将散射光分为三类:第一类,其波数基本不变或变化小于5110cm --,这类散射称为瑞利散射;第二类,其波数变化大约为10.1cm -,称为布利源散射;第三类是波数变化大于11cm -的散射,称为拉曼散射;从散射光的强度看,瑞利散射最强,拉曼散射最弱。
在经典理论中,拉曼散射可以看作入射光的电磁波使原子或分子电极化以后所产生的,因为原子和分子都是可以极化的,因而产生瑞利散射,因为极化率又随着分子内部的运动(转动、振动等)而变化,所以产生拉曼散射。
在量子理论中,把拉曼散射看作光量子与分子相碰撞时产生的非弹性碰撞过程。
当入射的光量子与分子相碰撞时,可以是弹性碰撞的散射也可以是非弹性碰撞的散射。
在弹性碰撞过程中,光量子与分子均没有能量交换,于是它的频率保持恒定,这叫瑞利散射,如图(1a );在非弹性碰撞过程中光量子与分子有能量交换,光量子转移一部分能量给散射分子,或者从散射分子中吸收一部分能量,从而使它的频率改变,它取自或给予散射分子的能量只能是分子两定态之间的差值12E E E ∆=-,当光量子把一部分能量交给分子时,光量子则以较小的频率散射出去,称为频率较低的光(斯托克斯线),散射分子接受的能量转变成为分子的振动或转动能量,从而处于激发态1E ,如图(1b ),这时的光量子的频率为0ννν'=-∆;当分子已经处于振动或转动的激发态1E 时,光量子则从散射分子中取得了能量E ∆(振动或转动能量),以较大的频率散射,称为频率较高的光(反斯托克斯线),这时的光量子的频率为0ννν'=+∆。
如果考虑到更多的能级上分子的散射,则可产生更多的斯托克斯线和反斯托克斯线。
6Who should attendFrom Monday 9 am to Wednesday 5:30 pmDates: February 11-13, 2019 May 13-15, 2019 June 24-26, 2019 October 7-9, 2019November 18-20, 2019Users of HORIBA Scientific Raman spectrometers • A cquire theoretical and practical knowledge on Raman spectrometers • L earn how to use the software • L earn methodology for method development and major analytical parameters • H ow to set up an analytical strategy with an unknown sample • H ow to interpret results• L earn how to follow the performances of theRaman spectrometer over the time.Day 1• The theory of the Raman principle • R aman Instrumentation • P ractical session – System and software presentation, Acquisition Parameters: - L abSpec 6 presentation and environment: useraccounts, file handling, display of data, basic functions - S et up of acquisition parameters and singlespectra measurement - Templates & ReportsDay 2• Analysis of Raman spectra • P ractical session: Raman spectrum measurement and Database Search - O ptimization of the parameters: how to chosethe laser, the grating, the confocal hole, the laser power- How to use the polarization options - Library Search using KnowItAll software - How to create databasesRaman imaging • H ow to make a Raman image (1D, 2D and 3D) • D ata evaluation: cursors, CLS fitting, peakfitting•Image rendering, 3D datasets •Fast mapping using SWIFT XSDay 3Data processing• Processing on single spectra and datasets • Baseline correction • Smoothing • Normalization• Spectra subtraction, averaging • Data reduction • Methods• Practical exercisesCustomer samples: Bring your own samples!Duration: 3 daysReference: RAM1Raman Microscopy for Beginners7Acquire technical skills on DuoScan, Ultra Low Frequency (ULF), Particle Finder or TERS.Users of HORIBA Scientific Raman spectrometers who already understand the fundamentals of Raman spectroscopy and know how to use HORIBA Raman system and LabSpec Software. It is advised to participate in the basic Raman training first (RAM1).Introduction to DuoScan• Principle and hardwareDuoScan Macrospot• Practical examplesDuoScan MacroMapping• Practical examplesDuoScan Stepping Mode• Practical examplesCustomer samples: Bring your own samples!Presentation of the ULF kit• Principle and requirements • Application examplesInstallation of the ULF kitIntroduction to Particle Finder• Principle and requirementsPractical session• Demo with known sample• Customer samples: Bring your own samples!Practical session• Demo with known samplesCustomers samples: Bring your own samples! Presentation of the TERS technique• Principle and requirements • Application examplesDemo TERS• Presentation of the different tips and SPM modes • Laser alignment on the tip • T ERS spectra and TERS imaging on known samplesPractical session• Hands-on on demo samples (AFM mode)• Laser alignment on the tip • T ERS spectra and TERS imaging on known samplesRaman Options: DuoScan, Ultra Low Frequency, Particle Finder, TERS8Users of HORIBA Scientific Raman spectrometers who already understand the fundamentals of Raman spectroscopy and know how to use HORIBA Raman system and labSpec Software. It is adviced to participate in the basic Raman training first.Who should attendDates: February 14, 2019 June 27, 2019November 21, 2019Duration: 1 dayReference: RAM2From 9 am to 5:30 pm• Acquire theoretical and practical knowledge on SERS (Surface Enhanced Raman Spectroscopy)• Know how to select your substrate • Interpret resultsRaman SERSIntroduction to SERSPresentation of the SERS technique • Introduction: Why SERS?• What is SERS?• Surface Enhanced Raman basics • SERS substratesIntroduction to the SERS applications• Examples of SERS applications • Practical advice • SERS limitsDemo on known samplesCustomer samples: Bring your own samples!Raman Multivariate Analysis9Users of HORIBA Scientific Raman spectrometerswho already understand the fundamentals of Ramanspectroscopy and know how to use HORIBA Ramansystem and LabSpec Software. It is advised toparticipate in the basic Raman training first (RAM1).• Understand the Multivariate Analysis module• Learn how to use Multivariate Analysis for data treatment• Perform real case examples of data analysis on demo and customer dataIntroduction to Multivariate Analysis• Univariate vs. Multivariate analysis• Introduction to the main algorithms: decomposition (PCA and MCR), classification and quantification (PLS)Practical work on known datasets (mapping)• CLS, PCA, MCRIntroduction to classification• HCA, k-means• Demo with known datasetsIntroduction to Solo+MIA• Presentation of Solo+MIA Array• Demo with known datasetsData evaluation: cursors, CLS fitting, peak fitting• Fast mapping using SWIFT XSObjective: Being able to select the good parameters for Raman imaging and to perform data processScanning Probe Microscopy (SPM)• Instrumentation• T he different modes (AFM, STM, Tuning Fork) and signals (Topography, Phase, KPFM, C-AFM, MFM,PFM)Practical session• Tips and sample installation• Molecular resolution in AFM tapping mode• M easurements in AC mode, contact mode, I-top mode, KPFM• P resentation of the dedicated tips and additional equipment• O bjective: Being able to use the main AFM modes and optimize the parametersimaging)Practical session• Hands-on on demo samples (AFM mode)• Laser alignment on the tip• T ERS spectra and TERS imaging on known sample Day 3TERS Hands-on• T ERS measurements, from AFM-TERS tip installation to TERS mapping.• TERS measurements on end users samples.• Bring your own samples!28Practical informationCourses range from basic to advanced levels and are taught by application experts. The theoretical sessions aim to provide a thorough background in the basic principles and techniques. The practical sessions are directed at giving you hands-on experience and instructions concerning the use of your instrument, data analysis and software. We encourage users to raise any issues specific to their application. At the end of each course a certificate of participation is awarded.Standard, customized and on-site training courses are available in France, G ermany, USA and also at your location.Dates mentionned here are only available for HORIBA France training center.RegistrationFill in the form and:• Emailitto:***********************• Or Fax it to: +33 (0)1 69 09 07 21• More information: Tel: +33 (0)1 69 74 72 00General InformationThe invoice is sent at the end of the training.A certificate of participation is also given at the end of the training.We can help you book hotel accommodations. Following your registration, you will receive a package including training details and course venue map. We will help with invitation letters for visas, but HORIBA FRANCE is not responsible for any visa refusal. PricingRefreshments, lunches during training and handbook are included.Hotel transportation, accommodation and evening meals are not included.LocationDepending on the technique, there are three locations: Longjumeau (France, 20 km from Paris), Palaiseau (France, 26 km from Paris), Villeneuve d’Ascq (France 220 km from Paris) or at your facility for on-site training courses. Training courses can also take place in subsidiaries in Germany or in the USA.Access to HORIBA FRANCE, Longjumeau HORIBA FRANCE SAS16 - 18 rue du canal91165 Longjumeau - FRANCEDepending on your means of transport, some useful information:- if you are arriving by car, we are situated near the highways A6 and A10 and the main road N20- if you are arriving by plane or train, you can take the train RER B or RER C that will take you not far from our offices. (Around 15 €, 150 € by taxi from Charles de Gaulle airport, 50 € from Orly airport).We remain at your disposal for any information to access to your training place. You can also have a look at our web site at the following link:/scientific/contact-us/france/visi-tors-guide/Access to HORIBA FRANCE, Palaiseau HORIBA FRANCE SASPassage Jobin Yvon, Avenue de la Vauve,91120 Palaiseau - FRANCEFrom Roissy Charles de Gaulle Airport By Train • T ake the train called RER B (direction Saint RemyLes Chevreuse) and stop at Massy-Palaiseaustation• A t Massy-Palaiseau station, take the Bus 91-06C or 91-10 and stop at Fresnel• T he company is a 5 minute walk from the station,on your left, turn around the traffic circle and youwill see the HORIBA building29 Practical InformationAround 150 € by taxi from Charles de Gaulle airport. From Orly Airport By Train• A t Orly airport, take the ORLYVAL, which is ametro line that links the Orly airport to the AntonyRER station• A t Antony station, take the RER B (direction StRemy Les Chevreuse) and stops at Massy-Palai-seau station• A t Massy-Palaiseau station, take the Bus 91-06C, 91-06 B or 91-10 stop at Fresnel• T he company is 5 minutes walk from the station,on your left, turn around the traffic circle and youwill see the HORIBA building• O r at Orly take the Bus 91-10 stop at Fresnel.The company is 5 minutes walk from the station,on your left, turn around the traffic circle and youwill see the HORIBA building. We remain at yourdisposal for any information to access to your trainingplace. You can also have a look at our web site at thefollowing link:/scientific/contact-us/france/visi-tors-guide/Around 50 € by taxi from Orly airport.Access to HORIBA FRANCE, Villeneuve d’Ascq HORIBA Jobin Yvon SAS231 rue de Lille,59650 Villeneuve d’Ascq - FRANCEBy Road from ParisWhen entering Lille, after the exit «Aéroport de Lequin», take the direction «Bruxelles, Gand, Roubaix». Immmediatly take the direction «Gand / Roubaix» (N227) and No «Bruxelles» (A27) Nor «Valenciennes» (A23).You will then arrive on the ringroad around Villeneuve d’Ascq. Take the third exit «Pont de Bois».At the traffic light turn right and follow the road around, (the road will bend left then right). About 20m further on you will see the company on the right hand side where you can enter the car park.By Road from Belgium (GAND - GENT)Once in France, follow the motorway towards Lille. After «Tourcoing / Marcq-en-Baroeul», follow on the right hand side for Villeneuve d’Ascq. Take the exit «Flers Chateau» (This is marked exit 6 and later exit 5 - but it is the same exit). (You will now be following a road parallel to the mo-torway) Stay in the middle lane and go past two sets of traffic lights; at the third set of lighte, move into the left hand lane to turn under the motorway.At the traffic lights under the motorway go straight, (the road shall bend left then right). About 20 m further you shall see the company on the right hand side where you can enter the car park.AeroplaneFrom the airport Charles de Gaulle take the direction ‘Ter-minal 2’ which is also marked TGV (high speed train); where you can take the train to ‘Lille Europe’.Train - SNCFThere are two train stations in Lille - Lille Europe or Lille Flandres. Once you have arrived at the station in Lille you can take a taxi for HORIBA Jobin Yvon S.A.S., or you can take the underground. Please note both train stations have stations for the underground.Follow the signs:1. From the station «Lille Flandres», take line 1, direction «4 Cantons» and get off at the station «Pont de bois».2. From the station «Lille Europe», take line 2, direction «St Philibert» and get off at the following station «Gare Lille Flandres» then take line 1, direction «4 Cantons» and get off at the station «Pont de Bois».BusBus n°43, direction «Hôtel de Ville de Villeneuve d’Ascq», arrêt «Baudoin IX».InformationRegistration: Fill inthe form and send it back by FAX or Email four weeks before beginning of the training.Registration fees: the registration fees include the training courses and documentation. Hotel, transportation and living expenses are not included except lunches which are taken in the HORIBA Scientific Restaurant during the training.Your contact: HORIBA FRANCE SAS, 16-18 rue du Canal, 91165 Longjumeau, FRANCE Tel: + 33 1 64 74 72 00Fax: + 33 1 69 09 07 21E-Mail:***********************Siret Number: 837 150 366 00024Certified ISO 14001 in 2009, HORIBA Scientific is engaged in the monitoring of the environmental impact of its activitiesduring the development, manufacture, sales, installation and service of scientific instruments and optical components. Trainingcourses include safety and environmental precautions for the use of the instrumentsHORIBA Scientific continues contributing to the preservation of theglobal environment through analysis and measuring technologymentisnotcontractuallybindingunderanycircumstances-PrintedinFrance-©HORIBAJobinYvon1/219。

拉曼光谱(Raman spectra),是一种散射光谱。
拉曼光谱分析法是基于印度科学家C.V.拉曼(Raman)所发现的拉曼散射效应,对与入射光频率不同的散射光谱进行分析以得到分子振动、转动方面信息,并应用于分子结构研究的一种分析方法。
历史1928年C.V.拉曼实验发现,当光穿过透明介质(液体苯)被分子散射的光发生频率变化,这一现象称为拉曼散射。
在透明介质的散射光谱中,频率与入射光频率υ0相同的成分称为瑞利散射;频率对称分布在υ0两侧的谱线或谱带υ0±υ1即为拉曼光谱,其中频率较小的成分υ0-υ1又称为斯托克斯线,频率较大的成分υ0+υ1又称为反斯托克斯线。
靠近瑞利散射线两侧的谱线称为小拉曼光谱;远离瑞利线的两侧出现的谱线称为大拉曼光谱。
瑞利散射线的强度只有入射光强度的10-3,拉曼光谱强度大约只有瑞利线的10-3。
小拉曼光谱与分子的转动能级有关,大拉曼光谱与分子振动-转动能级有关。
拉曼光谱的理论解释是,入射光子与分子发生非弹性散射,分子吸收频率为υ0的光子,发射υ0-υ1的光子(即吸收的能量大于释放的能量),同时分子从低能态跃迁到高能态(斯托克斯线);分子吸收频率为υ0的光子,发射υ0+υ1的光子(即释放的能量大于吸收的能量),同时分子从高能态跃迁到低能态(反斯托克斯线)。
分子能级的跃迁仅涉及转动能级,发射的是小拉曼光谱;涉及到振动-转动能级,发射的是大拉曼光谱。
与分子红外光谱不同,极性分子和非极性分子都能产生拉曼光谱。
激光器的问世,提供了优质高强度单色光,有力推动了拉曼散射的研究及其应用。
拉曼光谱的应用范围遍及化学、物理学、生物学和医学等各个领域,对于纯定性分析、高度定量分析和测定分子结构都有很大价值。
拉曼散射光谱的特征a. 拉曼散射谱线的波数虽然随入射光的波数而不同,但对同一样品,同一拉曼谱线的位移与入射光的波长无关,只和样品的振动转动能级有关;b. 在以波数为变量的拉曼光谱图上,斯托克斯线和反斯托克斯线对称地分布在瑞利散射线两侧, 这是由于在上述两种情况下分别相应于得到或失去了一个振动量子的能量。
实验二拉曼光谱(Raman)一、实验目的1、了解拉曼散射的基本原理;2、熟悉拉曼光谱仪的构造,能够针对不同的待测物质选择合适的仪器部件;3、学习使用拉曼光谱仪测量物质的特征谱线;4、初步掌握解读拉曼光谱的思想和方法。
二、仪器的基本工作原理及结构拉曼光谱(Raman spectra),是一种散射光谱。
拉曼光谱仪是通过采集激光照射到待测物质后产生的非弹性散射信号并对其进行分析,以得到分子(晶格)振动、转动方面信息,并应用于分子(晶格)结构等方面的研究。
拉曼光谱属于分子振动光谱,横坐标为拉曼频仪(即散射光频率相对于入射光频率的变化值),常用波数(cm-1)来表示,最常用的拉曼光谱区域波数范围是50-4000 cm-1,纵坐标为拉曼散射信号的强度。
拉曼光谱检测分子(晶格)的振动,主要适用于共价键分子的定性和定量分析。
定量了解分子间作用力和分子内作用力情况,并推断分子的对称性、几何形状、分子中原子的排列,故可确定相结构、确定晶体结构、测量固体有序度、测量应力、监测材料的相变,有序-无序转变等。
拉曼光谱检测可使用各种溶剂,尤其是能测定水溶样品或含水样品。
样品处理简单。
拉曼光谱仪主要由光源(激光)、光路、样品仓、单色器、和检测器五部分组成。
三、使用仪器及材料1、仪器:美国热电公司(Thermo Scientific) 激光共聚焦显微拉曼光谱仪(DXR Raman Microscope)、美国热电公司(Thermo Scientific) 智能拉曼光谱仪(DXR Smart Raman)2、材料:单晶硅、石墨、聚苯乙烯等。
四、实验步骤1、开机:消除操作人员身上静电,更换合适光栅、滤光片和激光器,依次打开稳压电源、样品台驱动(Link)、显微镜照明、DXR主机、计算机及显示器电源,之后打开激光器,预热20 min;2、仪器性能优化:进行光路准直调节以及仪器校正;3、样品制备:将待测样品(粉末、块状样品置于载玻片上,液体样品置于石英池中)置于样品仓;4、设定测定模式:根据待测样品特征,选择合适物镜,设定测试模式和合适的参数,进行光谱采集;5、数据处理与分析;6、测试完毕,关闭激光器及仪器各部分电源。
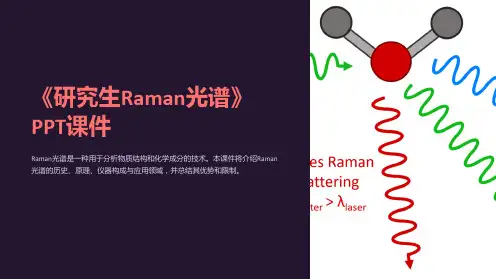
内容概要拉曼光谱原理拉曼光谱仪各部件功能激光器 滤光片 物镜及共焦针孔 光栅和焦长 探测器CCD 常用附件及选择© 2009 HORIBA, Ltd. All rights reserved.拉曼光谱原理© 2009 HORIBA, Ltd. All rights reserved.什么是拉曼效应?1928 年,印度科学家C.V Raman in首先在CCL4光谱 中发现了当光与分子相互作用后,一部分光的波长 会发生改变(颜色发生变化),通过对于这些颜色 发生变化的散射光的研究,可以得到分子结构的信 息,因此这种效应命名为Raman效应。
Provided by Prof. D. Mukherjee, Director of Indian Association for the Cultivation of Science© 2009 HORIBA, Ltd. All rights reserved.弹性散射与非弹性散射弹性散射: 频率不发生改变,如瑞利散射 非弹性散射: 频率发生改变,如拉曼散射拉曼散射λscatter≠ λlaserλlaser瑞利散射λscatter= λlaser拉曼散射λscatter≠ λlaser© 2009 HORIBA, Ltd. All rights reserved.斯托克斯散射反斯托克斯散射 反斯托克斯散射 斯托克斯散射 瑞利散射能级示意图虚态瑞利散射 电子激发态 +激光线hv0 hv0 hv0h(v0-v) hv0能量差hvh(v0+v) 电子基态-x0xRaman shift (cm-1)© 2009 HORIBA, Ltd. All rights reserved.能级示意图电子激发态虚态hv1hv0 hv0 hv0h(v0-v) hv0h(v0+v)能量差hvhv2发射光 子能量电子基态荧光反斯托克斯散射 斯托克斯散射 瑞利散射© 2009 HORIBA, Ltd. All rights reserved.拉曼位移498KJ/mol OO941.7KJ/mol NNIntensity (a.u.)υ = (k /μ)1/2 2πc1 200 1 4001 6001 8002 000Raman Shift (cm-1)2 2002 400 2 600k : 与键能有关 μ:与原子质量有关μ=MAMB (MA+MB)键能越大,拉曼位移越大; 原子质量越大,拉曼位移越小.© 2009 HORIBA, Ltd. All rights reserved.拉曼位移的影响因素 — 原子质量SWNT的G峰位移与C12/C13比例密切相关Hongjie Dai et al. J. Am. Chem. Soc. (2008) 130: 13540-13541© 2009 HORIBA, Ltd. All rights reserved.拉曼位移的影响因素 — 键能(同素异形体)同素异形体 — 石墨 & 金刚石1332 1580© 2009 HORIBA, Ltd. All rights reserved.2000015000347kJ/mol10000348.9kJ/mol50000 1000120014001600Wavenumber (cm-1)18002000拉曼位移的影响因素 — 晶格(多晶型)Intensity (cnt)2 400金红石和锐钛矿同为TiO :2 2002相同的化学组成,不同的晶型2 0001 800金红石1 6001 4001 2001 000800600400锐钛矿2002004006008001 0001 2001 400Raman Shift (cm-1)© 2009 HORIBA, Ltd. All rights reserved.拉曼位移的影响因素 — 空间结构麻黄碱伪麻黄碱非对映异构体Raman Intensity (arbitrary unit)500100015002000250030003500Raman Shift (cm-1)© 2009 HORIBA, Ltd. All rights reserved.拉曼光谱中的信息定性的信息: 拉曼光谱是物质结构的指纹光谱 定量的信息: 可以通过光谱校正,得到准确的应力大小和浓度分布谱带位置:化学组成,结构,构象, 形态频率位移:应力,温度 半高宽:结晶度强度:浓度或物质的量强度峰位谱峰偏移半高宽 FWHMRaman shift© 2009 HORIBA, Ltd. All rights reserved.拉曼光谱应用领域1:半导体材料; 2:聚合体;3:碳材料; 4:地质学/矿物学/宝石鉴定; 5:生命科学; 6:医药;7:化学; 8:环境;9:物理 10:考古;11:薄膜; 12: 法庭科学:违禁药品检查;区分各种颜料,色素,油漆,纤维 等;爆炸物的研究;墨迹研究;子弹残留物和地质碎片研究© 2009 HORIBA, Ltd. All rights reserved.拉曼光谱的优势信息样品• 分子层面 • 对结构与环境敏感•各种性状 •无需特殊处理 •含水样品 •玻璃样品池方法• 无损,非破坏性 • 特异性 • 微量和宏观 • 实时检测 • 活体检测© 2009 HORIBA, Ltd. All rights reserved.拉曼光谱仪© 2009 HORIBA, Ltd. All rights reserved.拉曼光谱测量光栅探测器瑞利滤光装置 光源样品 干涉滤光片© 2009 HORIBA, Ltd. All rights reserved.拉曼光谱仪原理图(滤光片型)激光器干涉滤光片 功率衰减片共聚焦针孔狭缝 瑞利滤光片光栅© 2009 HORIBA, Ltd. All rights reserved.显微镜 样品CCD拉曼光谱仪原理图(滤光片型)激光器干涉滤光片 功率衰减片共聚焦针孔狭缝 瑞利滤光片光栅© 2009 HORIBA, Ltd. All rights reserved.显微镜 样品探测器激发波长与拉曼位移Bi2O3 633 nmIntensity (a.u.)能量差 值恒定拉曼位移是一个相对值,对于 同一振动模式,发射光子与入 射光子的能量差恒定。
不同的 激发波长下拉曼位移相同。
Intensity (a.u.)100200300400500Raman Shift (cm -1 )Bi2O3 514 nm100200300400500Raman Shift (cm -1 )© 2009 HORIBA, Ltd. All rights reserved.信号强度与激发波长在同等条件(如激光功率、光栅、采集时间等)下 激发波长越短,拉曼信号越强! I ∝ 1/λ4Raman对于所有样品都应选择短波长激光?© 2009 HORIBA, Ltd. All rights reserved.激发波长的选择244nm 325nm 473nm 488nm 514nm 532nm 633nm 785nm 。
1 避开荧光干扰 2 确定信息来源-拉曼或荧光 3 不同深度信息研究© 2009 HORIBA, Ltd. All rights reserved.1 避开荧光干扰• 532 nm laser • 633 nm laser • 785 nm laser1 0002 000 Raman Shift (cm -1 )© 2009 HORIBA, Ltd. All rights reserved.3 000Intensity (cnt)2 确定信号来源-拉曼或荧光5 000 4 000 3 000 2 000 1 000CaF-488 CaF-514 CaF-5325001 0001 5002 0002 500Raman Shift (cm-1)用不同的激发波长测试CaF 样品2© 2009 HORIBA, Ltd. All rights reserved.3 0002 确定信号来源-拉曼或荧光Intensity (cnt)5 000 4 000CaF-488 CaF-514 CaF-5323 0002 0001 0000500510520530540550560570Wavelength (nm)将cm-1转换为nm用不同的激发波长测试CaF 样品2© 2009 HORIBA, Ltd. All rights reserved.3 分析样品不同深度的信息利用不同波长穿透深度不同,可以分析样品不同层的信息© 2009 HORIBA, Ltd. All rights reserved.拉曼光谱仪原理图(滤光片型)— 滤光片激光器干涉滤光片功率衰减片瑞利滤光片共聚焦针孔 狭缝光栅© 2009 HORIBA, Ltd. All rights reserved.显微镜 样品探测器干涉滤光片的作用Intensity (cnt)52040 000 35 000 30 000 25 000 20 000 15 000 10 0005 000 030 000 25 000 20 000 15 000 10 0005 000 05001 0001 500Raman shift (cm-1)2 0005001 0001 500Raman shift (cm-1)2 000Intensity (cnt)滤除等离子线© 2009 HORIBA, Ltd. All rights reserved.滤光片在LabRAM HR中的位置干涉滤光片瑞利滤光片(Edge或Notch)© 2009 HORIBA, Ltd. All rights reserved.两种瑞利滤光片Notch滤光片:有机材料镀膜、寿命短、一般2-3年换一套。
可以做斯 托克斯和反斯托克斯。
Edge滤光片:介电材料制作、寿命长。
只能测量斯托克斯拉曼信号。
150Intensity (a.u.)100Notch 50Intensity (cnt)0-300-200-1000100200300Wavenumber (cm-1)30 00025 00020 000Laser15 00010 0005 00000200400600Raman Shift (cm -1)Edge8001 000© 2009 HORIBA, Ltd. All rights reserved.专利调角度技术对于HR,可以使用低波数附件将信号测至10cm-1© 2009 HORIBA, Ltd. All rights reserved.拉曼光谱仪原理图(滤光片型)—— 功率衰减片激光器干涉滤光片 功率衰减片共聚焦针孔狭缝 瑞利滤光片光栅© 2009 HORIBA, Ltd. All rights reserved.显微镜 样品CCD功率衰减片的作用衰减激光功率,避免高强度激光辐射损坏样品 有以下6种可供选择:½ ¼ 1/10 1/100 1/1000 1/10000© 2009 HORIBA, Ltd. All rights reserved.拉曼光谱仪原理图(滤光片型)——显微镜激光器干涉滤光片 功率衰减片共聚焦针孔狭缝 瑞利滤光片光栅© 2009 HORIBA, Ltd. All rights reserved.显微镜 样品CCD显微镜• 显微镜收集信号的方式。