flowchartdrawing(流程图的制作方法)
- 格式:ppt
- 大小:1.05 MB
- 文档页数:12
使用Flow功能在Word中创建流程图和组织结构图Microsoft Word是一个广泛使用的办公软件,它不仅可以用来编辑文档,还有一些强大的功能,如创建流程图和组织结构图。
在本文中,我们将介绍如何使用Word中的Flow功能来实现这些图表的创建。
首先,我们需要打开Word并创建一个新的文档。
在顶部的菜单栏中,我们可以看到一个名为“插入”的选项。
点击这个选项,然后在下拉菜单中选择“SmartArt”。
SmartArt是Word中的一个功能,它允许我们创建各种类型的图表和图形。
在SmartArt面板中,我们可以看到不同的图表类型,包括流程图和组织结构图。
我们可以根据需要选择其中一个类型。
如果我们选择了流程图类型,Word会自动创建一个空白的流程图,并在右侧的面板中显示相关选项。
我们可以在面板中添加文本框,以表示流程图中的不同步骤或节点。
我们可以通过单击面板中的“添加形状”按钮来添加新的文本框,并通过拖动和调整大小来调整它们的位置和大小。
除了添加文本框,我们还可以在流程图中添加箭头或连线,以表示不同步骤之间的关系。
我们可以通过单击面板中的“连接形状”按钮来添加箭头或连线,并通过拖动它们来连接不同的文本框。
在创建组织结构图方面,Word的流程图功能同样提供了很多便利。
我们可以使用组织结构图类型来创建一个具有层级结构的图表。
在面板中,我们可以添加不同的文本框来表示不同的职位或角色,并通过箭头或连线来表示它们之间的关系。
除了基本的文本框和箭头,Word的流程图功能还提供了其他一些高级选项。
例如,我们可以更改文本框的颜色和样式,以使图表更加美观。
我们还可以添加背景色和边框,以及调整箭头的样式和粗细。
在完成流程图或组织结构图的创建后,我们可以将其保存为Word文档或导出为其他格式,如PDF或图像文件。
这样,我们就可以方便地与他人共享或打印这些图表。
总之,使用Flow功能在Word中创建流程图和组织结构图非常简单。
Flow chart = process diagram一、流程图的特点1. 描绘某一事物的发展或运作过程2. 遵循某种顺序3. 图中会标出原材料的名称和步骤的细节4. 一般会出现一些专业生词5. 流程最终要达成某种目的或结果二、流程图的写作步骤1. 读题目,确定描述什么?目的或结果?2. 找信息,定步骤所有的信息点,包括图中所有有文字的地方,或所有表示动作或变化的图示(所有的时间、大小、距离等数字信息)1.定框架,写文章第一段:介绍流程图是做什么的。
第二段:详细介绍原料与准备、每一步的变化、过程及结果。
第三段:简单总结2.读文章,做检查单词拼写、语法、替换重复的词汇等。
三.流程图常用的表达1. The flow chart illustrates the recycling process of _____.2. The process of ____ involves the following steps.3. The whole procedure of ___ can be categorised into ____ stages.4. The row materials for ____ include ___, ___ and ____.5. The first step is to ______.6. ____ with ____ is prepared to _____.7. ____ is used as ____ of ____.8. _____ is mixed with ____ to produce _____.9. _____ can change into ____, when ____.10. The process of ____ is really a simple(complicated) process.The pictures below show the recycling process of wasted glass bottles.As is displayed in the flow chart, the recycling process of glass is really a complex one.The overall process can be categorised=classified=divided into three stages.First, glass products in various forms are gathered=assembled in the Collection point, so that they are easily transported by special trucks or vans to the Cleaning plant, where they get sterilisation byhigh-pressured water. There are three different channels in the Recycling plant, namely Brown, Green and Clear, which represent the colors of glass. After recycled in the furnace, glass products are melted=forged into recycled liquid glass. Mixed with new liquid glass, the compound is finally moulded into solid glass, which, afterwards, will be sent to various customer supermarkets for selling. Thus, the glass will go to the customers for different purposes.Through a brief introduction of the circle of glass recycling, we come to realize that recycling plays a vital role inenvironmental protection and ecological preservation.The diagram below describes how to recycle organic waste to produce compost(fertilizer).1. The flow chart illustrates the recycling process of organic waste toproduce fertilizer.As is clearly shown in the picture, the first step is to find a plastic container of two cubic metres and stab several holes on its body so that air could fill in. Secondly, a 15cm thick layer of food is placed at the bottom of the container and grass is put just above the layer for the same height with some news paper covered on the very top. After that, some nitrogen and water are added into the container, and the water should only be hot. Finally, the container is sealed up and the external heat would help the formation of the compost. After six months, when the fertilizer is ready, all we have to do is to pour it into garden soil to nourish plants and flowers.Generally speaking, making garden fertilizer in this way is easy to operate but it costs much time.2. The flow chart shows the whole process of producing fertilizer by recycling organic waste.Firstly, a two cubic metres plastic container is prepared, with some air holes on its body. Secondly, some organic waste is put into the plastic container. The organic waste includes news paper, grass and food. The right order of adding them is putting food in the bottom 15cm of the container and grass in the middle 15cm upon food. News paper is on the very top. Then nitrogen and water are added into the container. What should be noticed isthat water can only be hot water. The next step is to seal up and heat the container. After six months, compost is produced. So we can use them to fertilize the garden.As can be seen from the picture, it is usually simple to change organic waste into fertilizer used to water flowers and trees in the garden.3. The information provided in the diagram is about how to use organic waste to produce compost in the following several simple stages.The first stage is to prepare a plastic container, two cubic metres in volume, with some ventilation holes on the side.Then organic waste such as leaves, pieces of paper and residues can be placed into the container so that three layers (each 15 cm) can be formed in the bottom---news paper, grass and food respectively from up to down. The next important step is to add nitrogen into it and then pour hot water only in to mix together. What is remembered to do next is that the container needs to be sealed and heated. As a result, the vapor can be emitted through the holes located on its body. After that it takes roughly six months to convert into composts and then they are ready for fertilizing plants and flowers in the garden.。
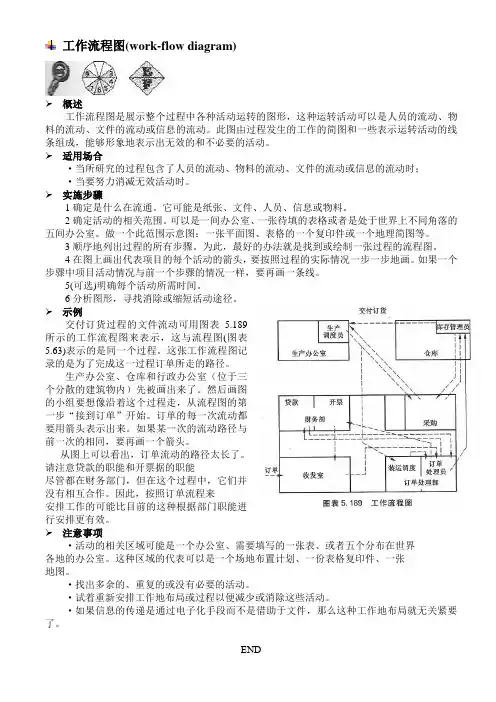
工作流程图(work-flow diagram)概述工作流程图是展示整个过程中各种活动运转的图形,这种运转活动可以是人员的流动、物料的流动、文件的流动或信息的流动。
此图由过程发生的工作的简图和一些表示运转活动的线条组成,能够形象地表示出无效的和不必要的活动。
适用场合·当所研究的过程包含了人员的流动、物料的流动、文件的流动或信息的流动时;·当要努力消减无效活动时。
实施步骤1确定是什么在流通。
它可能是纸张、文件、人员、信息或物料。
2确定活动的相关范围。
可以是一间办公室、一张待填的表格或者是处于世界上不同角落的五间办公室。
做一个此范围示意图:一张平面图、表格的一个复印件或一个地理简图等。
3顺序地列出过程的所有步骤。
为此,最好的办法就是找到或绘制一张过程的流程图。
4在图上画出代表项目的每个活动的箭头,要按照过程的实际情况一步一步地画。
如果一个步骤中项目活动情况与前一个步骤的情况一样,要再画一条线。
5(可选)明确每个活动所需时间。
6分析图形,寻找消除或缩短活动途径。
示例交付订货过程的文件流动可用图表 5.189所示的工作流程图来表示,这与流程图(图表5.63)表示的是同一个过程。
这张工作流程图记录的是为了完成这一过程订单所走的路径。
生产办公室、仓库和行政办公室(位于三个分散的建筑物内)先被画出来了。
然后画图的小组要想像沿着这个过程走,从流程图的第一步“接到订单”开始。
订单的每一次流动都要用箭头表示出来。
如果某一次的流动路径与前一次的相同,要再画一个箭头。
从图上可以看出,订单流动的路径太长了。
请注意贷款的职能和开票据的职能尽管都在财务部门,但在这个过程中,它们并没有相互合作。
因此,按照订单流程来安排工作的可能比目前的这种根据部门职能进行安排更有效。
注意事项·活动的相关区域可能是一个办公室、需要填写的一张表、或者五个分布在世界各地的办公室。
这种区域的代表可以是一个场地布置计划、一份表格复印件、一张地图。
如何画流程图流程图是一种用来描述各种活动之间相互关系的图形工具。
它以一种符号表示活动,并以箭头表示活动之间的流向。
流程图可以帮助人们理解活动的流程和顺序,从而更好地组织和管理工作。
要画一个流程图,需要以下步骤:1.确定流程主题:首先要确定要画的流程图的主题。
这可以是任何活动,比如生产流程、销售流程或项目管理流程等。
2.确定活动:根据流程主题,确定需要包含在流程图中的活动。
这些活动可能包括:开始、结束、判断、决策、处理和存储等。
3.定义活动:对每个活动进行定义,包括名称和描述。
这有助于更清楚地了解每个活动的功能和目的。
4.确定活动之间的流向:根据活动的执行顺序,确定活动之间的流向。
可以使用箭头来表示流向,箭头的方向表示活动的顺序。
5.标注控制条件:如果存在条件控制条件,可以使用判断符号来表示。
在流程图中,“是”和“否”可以用菱形表示,以便更清楚地描述条件的判断结果。
6.添加连接符号:在流程图中,经常会有需要将多个活动连接起来的情况。
这时,可以使用连接符号来表示。
连接符号可以是圆圈或其他形状。
7.添加文字和注释:为了更好地理解流程图,可以添加文字和注释。
文字可以用来描述每个活动的具体步骤,注释可以用来解释每个活动的目的和意义。
8.检查和修改流程图:完成流程图后,需要仔细检查并进行修改。
确保每个活动都有明确的描述,每个流向都正确地连接起来。
9.上传和共享:完成后,将流程图上传到共享平台或与团队成员共享。
这样可以方便其他人理解和使用流程图。
综上所述,绘制流程图需要明确主题、确定活动、定义活动、确定活动流向、标注控制条件、添加连接符号、添加文字和注释、检查和修改流程图,并最终上传和共享流程图。
通过画流程图,可以更好地理解和管理各种活动的顺序和关系。

c语言程序流程图符号及绘制方法Flowchart symbols in C programming include start/end symbol, input/output symbol, process symbol, decision symbol, and connector symbol. These symbols are used to represent different elements in a C program and to illustrate the flow of the program. The start/end symbol is represented by an oval shape with the word "Start" or "End" inside it. This symbol marks the beginning and end of the program. The input/output symbol is represented by a parallelogram shape with the words "Input" or "Output" inside it. This symbol indicates the input or output of data in the program. The process symbol is represented by a rectangle shape with a description of the process inside it. This symbol represents the various calculations and operations performed in the program.在C语言编程中,流程图符号包括开始和结束符号、输入/输出符号、处理符号、决策符号和连接符号。

程序流程图怎么画?手把手教你搞定画流程图这件小事流程图现在越来越重要了,很多公司的组织结构图、业务流程什么的都是用他来表示,不会画流程图或者看不懂它都觉得不好意思了,所以不懂流程图的朋友赶快将它学起来吧!流程图也不是啥复杂高深的东西,一学就会,不骗人,接下来我就手把手地教你搞定它。
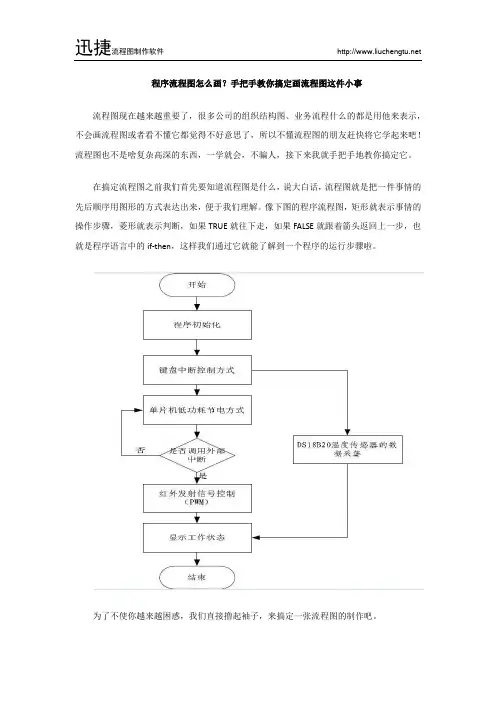
在搞定流程图之前我们首先要知道流程图是什么,说大白话,流程图就是把一件事情的先后顺序用图形的方式表达出来,便于我们理解。
像下图的程序流程图,矩形就表示事情的操作步骤,菱形就表示判断,如果TRUE就往下走,如果FALSE就跟着箭头返回上一步,也就是程序语言中的if-then,这样我们通过它就能了解到一个程序的运行步骤啦。
为了不使你越来越困惑,我们直接撸起袖子,来搞定一张流程图的制作吧。
1、下载安装迅捷流程图制作软件,或者直接使用它的在线版本也可以,打开它后创建一个新图表,可以看到软件提供了很多图表模板给我们选择。
不想用模板的话使用空白图表也是可以的。
2、创建空白图表后,我们可以在左侧栏上看到一些图形,找个自己想要的图形创建吧,友情提示:左下角的“更多图库”包含着更多图形哦。
3、创建完图形后我们可以给它添加颜色,选中它在右侧栏中的“样式”即可设置它的颜色、线条等。
4、选中图形后还可以发现他周围的半透明浅蓝色箭头,这些箭头是做连线用的,右侧图表选项还可以设置箭头、连接点选项哦。
5、为了使连线更为容易,这款软件提供了个小功能——连接时复制,勾选这个功能后只要拉动图形周围的箭头到空白处就会自动出现一个一模一样的图形和一条连接线。
6、最后我们如果想在图形内添加文本的话,只要用鼠标双击图形就可以了哦,右侧栏的“文本”还可以进行字体、对齐方式、颜色等设置。
以上就是制作一张流程图的基本操作了,没骗你吧,简单6步就把画流程图这件小事给搞定了。
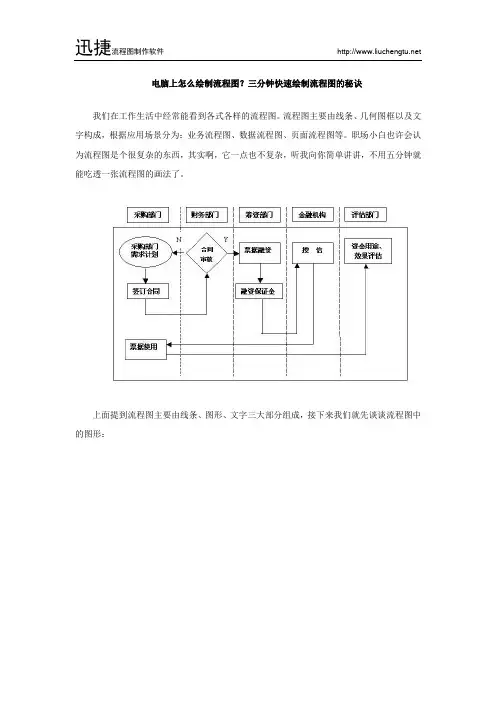
电脑上怎么绘制流程图?三分钟快速绘制流程图的秘诀
我们在工作生活中经常能看到各式各样的流程图。
流程图主要由线条、几何图框以及文字构成,根据应用场景分为:业务流程图、数据流程图、页面流程图等。
职场小白也许会认为流程图是个很复杂的东西,其实啊,它一点也不复杂,听我向你简单讲讲,不用五分钟就能吃透一张流程图的画法了。
上面提到流程图主要由线条、图形、文字三大部分组成,接下来我们就先谈谈流程图中的图形:
如图所示,流程图中的每个图形都有其对应的含义,不是你认为的哪个好看用哪个,是有一套规则在里面的。
否则你画出来的流程图就只能给你自己看,别人都看不懂,你说是吧?所以,画流程图的第一步就是选择合适的图形,自然就需要你了解清楚每个图形的含义了,其实也就十几个图形,常用的差不多十个,很容易记住。
然后,我们来了解一下流程图的基本结构,这是构成流程图的框架。
基本结构也就三种,很容易记。
了解了常用图形和基本结构后,下面我们就可以开始画一张流程图了,下面以“迅捷流程图制作软件”为例,手把手带你画一张流程图。
1、进入软件官网,为了省事我们直接点击“在线版”在线画流程图即可。
2、然后创建流程图模板,这里我选择的是空白图表。
3、接下来创建图形,别忘了前面提到的图形含义哦。
4、然后就是添加图形文本了,直接双击图形即可。
5、接着创建图形连接线,直接拉动图形的蓝色三角形即可。
6、如果你想自定义图形的样式,可以选中图形在右侧面板中设置。
OK,掌握这6步就可以画一张流程图了,我说的画流程图一点也不复杂吧,快去试试吧。
关于流程图图示是否有国际间认同定义,我也曾请教过一些专业人士,但似乎没有一致的定论。
以目前微软产品visio应用最多,当然国际上也有专业的smart draw,国内也有些产品,因此我的做法是基础图示如开始(六角菱型)、过程(四方型)、决策(菱型)、终止(隋园型)掌握著,其它也就自已和别人知道什么意义就可以,当然能自已在流程图面上说明图示定义那就更好。
例子:一、国际通用的流程图形态和程序:开始(六角菱型)、过程(四方型)、决策(菱型)、终止(椭圆型) .在作管理业务流程图时国际通用的形态:方框是流程的描述;菱形是检查、审批、审核(一般要有回路的);椭圆一般用作一个流程的终结;小圆是表示按顺序数据的流程;竖文件框式的一般是表示原定的程序;两边文件框式的一般是表示留下来的资料数据的存储.流程图符号流程图符号是专门用来画图的,其中有流程图,里面有符号的解释。
1 含义2 符号约定3 说明4 参考资料流程图符号-含义不管什么符号,都需要给它定义,定义行为是由制定人予以完成的,要完成这项工作不应该先定义符号代表什么,而应该在做到组织结构或者作业流程心中有数后进行归类,根据归类采用不同的符号加以区分。
另外,我所见过的很多有效组织结构图都是一种符号到底的,他们采取的是多重互联回形目录树的形式,也很有效阿。
这也佐证我的观点。
为了让您的新构架流程图不至于让他人难于理解,建议最好不要因采取过多的符号加以分类而造成实施人难以理解。
另外,还建议您在采取分类后将在流程图的下方添加注解。
其实,没有哪个企业会因一图而兴,关键靠的是实施和控制(重点包括环节控制)。
图再好,别人看不懂又有什么用呢?没有实施过程的监控与指导又会起多大效力呢?以微软产品visio应用最多,当然国际上也有专业的smartdraw,国内也有些产品,因此我的做法是基础图示如开始(六角菱型)、过程(四方型)、决策(菱型)、终止(隋园型)掌握著,其它也就自已和别人知道什么意义就可以,当然能自已在流程图面上说明图示定义那就更好。
3工艺流程图的绘制(The drawing of 3 process flow chart)3 process flow drawing.Txt I was degraded, and I can't swim until now. I know I was the fastest one before I was born. This article was contributed by zx55107499Ppt documents may experience poor browsing on the WAP side. It is recommended that you select TXT first or download the source file to the local machine.Synthesis process design of polymerSchool of materials science and EngineeringXu lili1Section 5 rendering process flow chartThe basic knowledge of drawing drawing, technological process sketch, process flow chart and piping instrument flow chartBasic knowledge of chemical process drawing1 the basic composition of the drawings2 drawings format3 graphics proportionGraphics should comply with the national standard "the proportion of technical drawing ratio (GB/T1469093) regulations". Stipulation of drawing proportion should be marked in Title column. If some of the main view and view the proportion of different proportion, in a drawing, if some views and the proportion of the different proportion of the main viewin a drawing, the proportion should be marked in the figure, the view above the line fine line. Mark the scale above the view, such as the graph, where the line is a fine solid line. Beta beta alpha alpha alpha 1?? to not according to the proportion of 1: 5 1: 5 1:54 text formatThe writing format of Chinese characters, letters and numbers in drawings should be unified and suitable in size. The writing format of Chinese characters, letters and numbers in drawings should be unified and suitable in size.Layout of engineering drawingsTechnical explanationBreadth linePatternLegendFrameDetail listDetail listDetail table title barFigure 3-11 width and size of drawingTwo process sketch 1 program flow chart: the flow chart can be expressed by block diagram, and the flow chart can be expressed by block diagram,Relationship between. Relationship between.2345Sketch of process flow: sketch of process flow: also called process flow diagram. Material balance diagram process flow chart (PFD) (PFD). Process flow chart (PFD). Piping instrument flow chart (PID) (PID). Piping instrument flow chart (PID).2 process sketch: also called process flow diagram. Sketch of process flow:(symbol of equipment). Equipment schematic diagram (equipment) material pipeline (material piping). Material pipeline (material piping).Thick lines draw all the raw material and the arrow indicates the direction of pipeline, draw all the raw material of pipeline, with thick lines draw all the raw material of pipeline, and the arrow indicates the direction, with thick lines to draw important auxiliary material pipelines. The valve and meter thick lines to draw important auxiliary materials, pipeline valves draw important auxiliary material pipelines. And so on. And so on.(3) text annotation (notes). Text annotation (notes) (notes).The equipment is annotated (code name, name) to annotate the equipment (code name), indicating the name, source and whereabouts of the material entering and leaving the stock. Mark names, sources, whereabouts.3 material flow chart (material balance diagram)The number chart of the material in the whole production process is represented by the chart to represent the quantity balance relationship of the whole process of production, the state parameter and the performance parameter of each stock material. The quantity balance relation, the state parameter and performance parameter of each stock material. Each material has a logistics number (material stream each material has a logistics number number), and corresponds to the material balance table. And corresponding to the material balance table. The top left side box frame or rectangular diamond diamond on the pipeline of logistics, the corresponding diamond frame or rectangle on the pipeline of logistics, corresponding on the pipeline of the corresponding material or pipeline), (above),Material flow in the box or above the material pipeline (left), material flow and various parameters are given in the material balance table. And various parameters are given in the material balance sheet.Three process flow chart process flow diagram(a) schematic diagram of the main content of the material flowand drawing (two) notes (legend and note legend and legend and notes) (note) (three) the title bar and list of the equipment (title Panel and equipment date sheet)(1) the main contents and drawing methods of the material flow diagramThe 1 painting equipment according to the material flow through the main sequence from left to right, in order to draw, the main material flows through the reserve order from left to right in turn on drawing, through the order from left to right, the devices do not need to draw a line of the same, just don't draw a draw, a number of production lines don't draw; equipment, production lines of the same, only need to draw a fine line;2 in proportion to draw the outline and main equipment of each internal node thin lines equipment outline and main characteristics of the internal structure of drawing in proportion. Structural characteristics. Pumps, compressors and other equipment is not drawing in proportion. Table 3-7 the compressor equipment is not drawn to scale. The PFD should be in the size of the equipment list marked equipment; PFD should be in the size of the equipment list of equipment shall be marked in the size of the equipment list marked equipment; the indicating device name (equipment name) and a number (equipment number), the equipment classification code can see table 3-8. The code for classification of equipment may be shown in table, in which the device classification code can be seen, and can be seen in figure 13. Method can be seen in figure 3-13.Table 3-7 common painting equipment2 material pipeline representation methodWith the flow of the solid line in the process flow diagram as a solid line with the pipeline flow with the flow of the solid line in the process flow diagram as the pipeline (material piping) said the flow of logistics and logistics; and said flow and flow of the logistics; each need to define a number of logistics logistics (material stream number), logistics in the diamond shape or rectangular box, you can also write to put the box in the logistics logistics, a diamond or a rectangle on a diamond or a rectangular box in the pipeline pipeline above the top or left or left, top or left in the pipeline, the logistics and material balance in the corresponding logistics No. the key point of operation; the key point of operation in logistics number corresponding; for the key point of operation should also show the logistics point temperature Or pressure, temperature, or pressure. The temperature or pressure of the logistics point.In PFD, the drawing between the material pipeline and the material pipeline and the PFD intersection of the control instrument should be disconnected. The drawing should be broken when crossing. The pipeline open principle: the main pipeline connection, the principle of pipeline disconnected: main materials and auxiliary materials pipeline pipeline connection is disconnected; disconnect the horizontal or vertical line; disconnect pipeline, continuous control line; disconnect the horizontal or vertical line; the pipeline system, continuous meter connections disconnected etc.. Instrument wiring disconnection and so on. 3-14. The main valves and important fittings must be drawn in the material pipeline of PFD. PFDmaterial pipeline must draw the main valve and important pipe material, the pipeline must draw the main valve and important pipe fittings.If a graph can not fully represent the whole process, it can be drawn into multiple process flow charts when the whole process is not completely expressed when a graph can not fully represent the whole process. When the part is disconnected, the drawing process is drawn. In the figure, the inlet and outlet points of the material are represented by a sharp box with a sharp box. The inlet and outlet points of the material pipeline are represented by a sharp box, and the flow chart number and the equipment number of the material coming or going are explained.Flow chart number and equipment position number. Figure 3-153 control scheme representation methodThe main contents of the main content of control scheme and testing, detection and control parameters and control scheme: the main content detection point, control parameters, instrument function, regulating valves, actuators, instrument function, regulating valves, executive structure, instrument installation position. Position, etc.. In the process, the control scheme is breaks in the process flow diagram of the instrument graphics, graphic character control scheme through the instrument regulating valve and actuator graphic symbols, number, regulating valves and actuators of the graphic symbols, the instrument connection said that. Tables, lines, etc..The instrument graphical symbol should indicate the instrument installation position, the test control instrument graphical symbol should indicate the instrument installation position, the test control parameter should indicate the instrument installation position, the instrument function and so on. Function content, instrument function and so on. The instrument graphic symbol consists of the instrument installation position, the graphic symbol and the instrument position number group, the instrument graphic symbol is installed by the instrument, the position symbol and the instrument position number group 16. A. Figure 3-16. The instrument position is composed of letters and numbers. The number of the instrument is composed of letters and numbers. Form。
怎么画流程图流程图是一种可以图形化展示一个过程或流程的工具,它通常用于帮助理解和解释流程中的各个步骤或环节。
画流程图可以帮助我们更好地分析和优化工作流程,提高工作效率。
下面将为大家介绍如何画流程图。
首先,准备好所需的工具。
画流程图的常用工具有铅笔、橡皮、直尺、彩色笔等。
可以选择纸张或专门的绘图软件。
第二,确定流程图的主题和目标。
要画出一幅清晰明了的流程图,需要明确流程的目标和主题。
例如,如果要画一幅购买商品的流程图,那么主题可以是“购买商品”,目标可以是“了解购买流程”。
第三,划分流程图的各个步骤或环节。
根据流程的主题和目标,将整个流程划分成一个个具体的步骤或环节。
每个步骤或环节都应该是一个清晰明了的动作或操作。
可以用矩形框表示步骤或环节,并用箭头表示它们之间的关系。
第四,为每个步骤或环节添加说明。
在划分好的各个步骤或环节旁边,添加相应的文本说明。
说明应该简洁明了,突出每个步骤或环节的关键点。
第五,确定流程图的起点和终点。
在流程图中,需要用特殊的符号表示流程的起点和终点。
起点通常用一个圆圈表示,终点通常用一个扁平的长方形表示。
第六,连接各个步骤或环节。
用箭头将各个步骤或环节连接起来,表明它们之间的顺序和关系。
箭头的方向应该从上到下或从左到右,避免交叉和错综复杂的线条。
第七,美化流程图。
可以使用彩色笔或绘图软件,为流程图添加一些装饰性的元素,使其更加美观。
可以使用不同的颜色、字体和线条,突出流程图的重点部分。
第八,检查和修改流程图。
画完流程图后,需要仔细检查和审查。
确保每个步骤或环节都清晰明了,顺序和关系都正确。
如果发现错误或不清楚的地方,及时修改。
最后,保存流程图或分享给他人。
如果使用电子绘图软件,可以直接保存流程图,并在需要时方便地编辑和分享。
如果使用纸张,可以扫描流程图并保存为电子文件,或拍照并发送给他人。
以上是画流程图的基本步骤和方法。
画流程图需要一定的逻辑思维和表达能力,同时也需要注重细节和精确性。
自动化画流程图的技巧Automation of drawing flowcharts is a useful skill that can save time and improve efficiency in various industries. By using software toolsto automatically create flowcharts, individuals can quickly visualize complex processes and communicate ideas effectively. The key to successfully automating flowchart drawing lies in selecting the right software and mastering its features.自动化绘制流程图是一项有用的技能,可以节省时间并提高各行各业的效率。
通过使用软件工具自动创建流程图,个人可以快速可视化复杂流程并有效传达想法。
成功自动化绘制流程图的关键在于选择合适的软件并掌握其功能。
When considering automating the drawing of flowcharts, it is essential to assess the specific requirements of the project or task at hand. Different software tools offer varying features and capabilities, so it is crucial to choose one that aligns with the needs of the user. Some tools may be more suitable for beginners or those with minimal experience, while others may cater to advanced users who require additional customization options.在考虑自动绘制流程图时,必须评估项目或任务的具体要求。