AAPL苹果公司财务报表分析
- 格式:ppt
- 大小:1.42 MB
- 文档页数:37
苹果公司审计报告1. 引言本文将对苹果公司进行一份审计报告,通过对其财务状况、业务运营和风险管理等方面的分析,为读者提供关于苹果公司的全面了解。
2. 公司概况苹果公司成立于1976年,总部位于美国加利福尼亚州库比蒂诺市。
该公司是全球知名的科技公司,主要经营电子产品、软件和在线服务等领域。
苹果公司以其创新的产品设计和卓越的用户体验而闻名,其主要产品包括iPhone、iPad、Mac和Apple Watch等。
3. 财务状况苹果公司目前是世界上市值最高的公司之一。
根据最新的财务报告,截至2021年第三季度,苹果公司的净利润达到了XX亿美元,同比增长XX%。
公司的总资产为XX亿美元,总负债为XX亿美元。
苹果公司在过去几年中保持了稳定的收入增长和健康的财务状况。
4. 业务运营苹果公司的主要业务包括销售硬件设备和提供在线服务。
硬件设备销售占据了公司总收入的大部分比例,其中最重要的产品是iPhone。
根据数据显示,截至2021年第三季度,苹果公司的iPhone销售额占据了总收入的XX%。
此外,iPad、Mac和Apple Watch等产品也取得了可观的销售业绩。
在线服务是苹果公司日益重要的业务领域之一。
公司提供的在线服务包括App Store、Apple Music和iCloud等,这些服务为用户提供了便利和增值服务。
在线服务的收入在近年来稳步增长,为公司的业绩做出了重要贡献。
5. 风险管理苹果公司在面对风险时采取了一系列的措施来保护公司的利益。
首先,公司进行了全面的市场分析和竞争对手调研,以确保产品能够适应不断变化的市场需求。
其次,苹果公司在供应链管理方面非常重视,以确保稳定的物流和供应。
此外,公司还加强了知识产权保护,防止侵权行为对公司品牌形象和利润造成损害。
6. 结论通过对苹果公司的审计,我们可以得出以下结论:苹果公司在过去几年中取得了显著的财务成果,其稳定的收入和健康的财务状况为其持续发展提供了坚实的基础。

XXXXX大学XXX学院本科生课程论文(设计)课程名称:会计英语论文题目:Financial Analysis on Apple Company 姓名:学号:专业:会计学年级:班级:任课教师:年月ABSTRACTThe Company designs, manufactures, and markets mobile communication and media devices, personal computers, and portable digital music players, and sells a variety of related software, services, peripherals, networking solutions, and third-party digital content and applications. The Company sells its products worldwide through its retail stores, online stores, and direct sales force, as well as through third-party cellular network carriers, wholesalers, retailers, and value-added resellers.The Company’s customers ar e primarily in the consumer, education, enterprise and government markets. The Company sells its products and resells third-party products in most of its major markets directly to consumers through its retail and online stores and its direct sales force. The Company also employs a variety of indirect distribution channels, such as third-party cellular network carriers, wholesalers, retailers, and value-added resellers. During 2013, the Company’s net sales through its direct and indirect distribution channels accounted for 30% and 70%, respectively, of total net sales.I will introduce about the financial status with two aspects in 2013, and the financial analysis is my importance in my following contents.Key words: Financial Status; Net Sales; Gross MarginContent1、Fiscal 2013 Highlights (4)2、Financial Status and Analysis (5)(1)Product Performance (5)(2)Segment Operating Performance (6)3、View on Gross Margin (7)4、Conclusion (8)Reference (9)Financial Analysis on Apple Company1、Fiscal 2013 HighlightsNet sales rose 9% or $14.4 billion during 2013 compared to 2012. This resulted from growth in net sales of iPhone; iTunes, software, and services; and iPad. Growth in 2013 reflects strong sales of iPhone 5, strong continuing sales of iPhone 4 and 4s, the introduction of iPhone 5c and 5s, strong performance of the iPad Mini and fourth generation iPad, and continued growth in the Company’s online sales of apps, digital content, and services. Growth in these areas was partially offset by declines in net sales of Mac and iPod. All of the Company’s operating segments experienced increased net sales in 2013, with net sales growth being particularly strong in the Americas, Greater China and Japan operating segments. Similar to 2012, growth in total net sales was higher during the first half of 2013, rising $12.6 billion or 14.7% over the same period in 2012. First half growth in 2013 was driven by iPhone and iPad introductions at or near the beginning of 2013.In April 2013 the Company announced a significant increase to its program to return capital to shareholders by raising the total amount it expected to utilize for the program through December 2015 to $100 billion. This included increasing its share repurchase authorization to $60 billion and raising its quarterly dividend to $3.05 per common share beginning in May 2013. During 2013, the Company utilized $23.0 billion to repurchase common shares and paid dividends of $10.5 billion or $11.40 per common share. In conjunction with its capital return program, in May 2013 the Company issued $17.0 billion of notes with varying maturities through 2043.2、Financial Status and Analysis(1)Product PerformanceWhen it comes to the iPhone, the growth in iPhone net sales and unit sales during 2013 resulted from increased demand for iPhone in all of the Company’s operating segments primarily due to the launch of iPhone 5 beginning in September 2012 and strong ongoing demand for iPhone 4 and 4s. All of the Company’s operating segments experienced increases in net sales and unit sales of iPhone during 2013 compared to 2012. The year-over-year impact of higher iPhone unit sales in 2013 was partially offset by a 3% decline in iPhone average selling prices in 2013 compared to 2012 primarily as a result of a shift in product mix towards lower-priced iPhone models, particularly iPhone 4. All of the Company’s geographic o perating segments experienced a decline in iPhone ASPs during 2013.Of course, the growth in net sales and unit sales of iPad during 2013 resulted from growth in iPad unit sales in all of the Company’s operating segments. This growth was driven by the launch of iPad mini and the fourth generation iPad beginning in the first quarter of 2013. The year-over-year growth rate of total iPad unit sales was significantly higher than the growth rate of total iPad net sales for 2013 due to a reduction in iPad ASPs of 15% in 2013 compared to 2012. This decline resulted primarily from introduction of the lower priced iPad mini and the full year impact of the price reduction on iPad 2 made in 2012. The decline in iPad ASPs was experienced to various degrees by all of the Company’s operating segments.In addition, the increase in net sales of iTunes, software and services in 2013 compared to 2012 was primarily due to growth in net sales from the iTunes Store and so on. The iTunes Store generated a total of $9.3 billion in net sales during 2013, a 24% increase from 2012. Growth in the iTunes Store, which includes the App Store, the Mac App Store and the iBooks Store, reflectscontinued growth in the installed base of iOS devices, expanded offerings of iOS apps and related in-App purchases, and expanded offerings of iTunes digital content.But for Apple, there is no great advantage with Mac. During 2013, Mac net sales and unit sales were down or relatively flat in all of the Company’s operating segments. Mac ASPs increased slightly partially offsetting the impact of lower unit sales on net sales. The decline in Mac unit sales and net sales reflects the overall weakness in the market for personal computers.(2)Segment Operating PerformanceThe Company manages its business primarily on a geographic basis. Accordingly, the Company determined its reportable operating segments, which are generally based on the nature and location of its customers, to be the Americas, Europe, Greater China, Japan, Rest of Asia Pacific and Retail. The Americas segment includes both North and South America. The Europe segment includes European countries, as well as India, the Middle East and Africa. The Greater China segment includes China, Hong Kong and Taiwan. The Rest of Asia Pacific segment includes Australia and Asian countries, other than those countries included in the Company’s other operating segments. The Retail segment operates Apple retail stores in 13 countries, including the U.S. The results of the Company’s geographic segments do not includ e results of the Retail segment. Each operating segment provides similar hardware and software products and similar services. No matter how many the segments are, we can see that they all keep the increasing trend for the net sales.Here, we just see the result of the Greater China. The growth in net sales in the Greater China segment during 2013 resulted from two major iPhone introductions during the year, iPhone 5 in December 2012 and iPhone 5c and iPhone 5s in September 2013. Further contributing to the growth in 2013 was the introduction of the fourth generation iPad and iPad mini during the secondquarter of 2013 and an increase in iPhone channel inventory as of the end of 2013 compared to the end of 2012. While net sales in the China segment were up 13% for all of 2013, net sales for the second half of 2013 declined 4% compared to the second half of 2012.3、View on Gross MarginThe gross margin percentage in 2013 was 37.6% compared to 43.9% in 2012. The year-over-year decrease in gross margin in 2013 compared to 2012 was driven by multiple factors including introduction of new versions of existing products with higher cost structures and flat or reduced pricing; a shift in sales mix to products with lower margins; introduction of iPad mini with gross mar gin significantly below the Company’s average product margins; higher expenses associated with changes to certain of the Company’s service policies and other 32warranty costs; price reductions on certain products, including iPad 2 and iPhone 4; and unfavorable impact from foreign exchange fluctuations.The Company anticipates gross margin during the first quarter of 2014 to be between 36.5% and 37.5%. The foregoing statement regarding the Company’s expected gross margin percentage in the first quarter of 2014 is forward-looking and could differ from actual results. The Company’s future gross margin can be impacted by multiple factors including, but not limited to those set forth above in Part I, Item 1A of this Form 10-K under the heading “Risk Factors” and those described in this paragraph. In general, gross margins and margins on individual products will remain under downward pressure due to a variety of factors, including continued industry wide global product pricing pressures, increased competition, compressed product life cycles, product transitions, potential increases in the cost of components, and potential strengthening of the U.S. dollar, as well as potential increases in the costs ofoutside manufacturing services and a potential shift in the Company’s sales mix towards products with lower gross margins. In response to competitive pressures, the Company expects it will continue to take product pricing actions, which would adversely affect gross margins. Gross margins could also be affected by the Company’s ability to manage product quality and warranty costs effectively and to stimulate demand for certain of its products. Due to the Company’s signi ficant international operations, financial results can be significantly affected in the short-term by fluctuations in exchange rates.4、Conclusion, In short-term solvency, whether it's, current ratio, quick ratio, cash ratio is superior to other electronic products industry for the company. In asset operational efficiency index, from inventory turnover, the company turnover is fastest. From this aspect we can see it also reflects the apple products widely recognized by the market, and achieves good sales performance. In the profitability, the company's gross margin and operation profit is the best in the same industry.There is no doubt that in the capital market or on the sales, Apple has become the measure of the mobile Internet era. Now, its iPad and iPhone 5s is popular in public. The company also plans to launch a series of mid-range apple mobile phones. Results in the above financial reports showed that Apple acquires revenue of $54.5 billion from this quarter, $13.81 earnings per share and net profit of $13.1 billion. Apple take innovation as the core, whether apple's past performance, and future growth, I think we can hold for a long time.Reference[1] The Analysis of Financial Reports on Apple, 2013</view/6391a713fc4ffe473268ab03.html>. [2]2013 10-K Annual Reports, 2013</>.[3] Xu Shujuan. Discussing with Enterprise financial analysis method, 2005</Article/CJFDTotal-JJSY200903028.htm>.。



财务管理案例分析3篇:分享财务管理的成功案例与经验一、苹果公司的成功财务管理案例分析苹果公司是一家全球知名的科技公司,其成功的背后离不开其精细的财务管理。
苹果公司拥有庞大的资产和收入,每年都能够创造出令人咂舌的利润,这都离不开其财务管理的精细和卓越。
首先,苹果公司的财务管理始终倡导简洁、高效和透明的原则,确保公司财务数据的及时准确和公开透明。
其次,苹果公司在利润和现金管理上也做得非常出色,不但能够稳定的提供股东回报,还能为公司未来的投资和扩张提供充足的资金支持。
另外,苹果公司还通过有效的成本控制和管理,保持了高效的生产和运营效率,并在市场竞争中赢得了更多的优势。
最后,苹果公司在财务管理上注重风险管理和规避,以确保公司经营的稳定和持续性。
总之,苹果公司成功的财务管理经验值得其他企业借鉴和学习。
苹果公司在财务管理上始终坚持高效、透明、规范的原则,不断优化和改进财务管理体系,保持了公司经营的稳健性和可持续性。
二、亚马逊公司的成功财务管理案例分析亚马逊公司是全球最大的电商公司之一,其成功的财务管理是其发展的重要支撑。
亚马逊公司始终坚持的财务管理原则是高效、透明、规范和创新,这些原则体现在公司财务管理的各个方面。
首先,亚马逊公司在现金和资产管理方面做得非常出色。
公司会定期对资产进行评估和管理,从而保证公司的投资和股东回报。
其次,亚马逊公司不断创新财务管理模式和技术,借助数字化技术来提高财务管理的效率和准确性。
另外,亚马逊公司在风险管理和规避方面也做得非常出色,通过建立风险管理体系,对可能的风险进行及时识别,规避和应对。
最后,亚马逊公司注重员工的财务素养和培训,提高员工的财务意识和管理能力。
总之,亚马逊公司的成功财务管理经验体现在其高效、透明、规范和创新的财务管理模式和原则。
同时,亚马逊公司不断优化和完善其财务管理体系,以保持公司的竞争优势和可持续发展。
三、耐克公司的成功财务管理案例分析耐克公司是一家全球知名的鞋类和运动装备生产商,其成功的财务管理为公司发展提供了稳定的资金支持和经营保障。
苹果公司财务报表分析
概述
本文档旨在对苹果公司的财务报表进行分析,并提供相关的数据和观察。
营业收入
根据最新的财务报表,苹果公司在过去一年中的营业收入增长了10%。
这是由于其产品销量的增加和市场份额的扩大所驱动的。
利润率
苹果公司的利润率在过去一年中保持稳定。
尽管面临着激烈的竞争,但公司通过提供高质量的产品和服务来保持了良好的利润水平。
现金流量
苹果公司的现金流量状况良好。
公司在过去一年中成功管理了其运营活动和投资项目,并保持了适度的现金储备。
资产负债表
苹果公司的总资产在过去一年中有所增长。
公司持续投资于研发和市场推广,以推动其产品创新和销售增长。
股东权益
苹果公司的股东权益也在过去一年中有所增加。
公司的稳定盈利和良好的运营管理为股东创造了价值。
结论
综上所述,根据苹果公司的财务报表分析,公司在过去一年中取得了良好的业绩。
公司的营业收入和股东权益均有所增长,利润率和现金流量保持稳定。
然而,公司仍需持续关注市场竞争和产品创新的挑战,以保持其竞争优势和可持续发展。

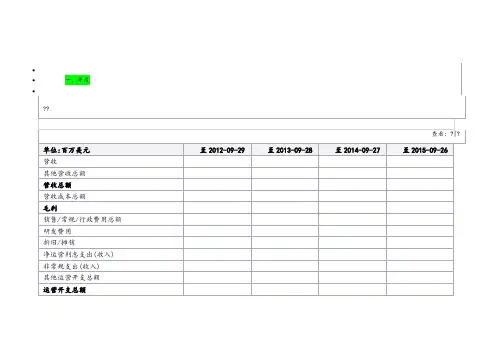
目录1.苹果公司 (2)2.筹资 (2)3.投资 (3)4.经营 (3)5.分配 (4)6.分析 (4)7.结论 (7)8.附报表 (7)11会计2班J11031232 黄章论文公司:苹果公司苹果公司(Apple Inc.)是美国的一家高科技公司,2007年由苹果电脑公司(Apple Computer, Inc.)更名而来,核心业务为电子科技产品,总部位于加利福尼亚州的库比蒂诺。
苹果公司由史蒂夫·乔布斯、斯蒂夫·沃兹尼亚克和Ron Wayn在1976年4月1日创立,在高科技企业中以创新而闻名,知名的产品有Apple II、Macintosh电脑、Macbook笔记本电脑、ipod音乐播放器、iTunes商店、iMac一体机、iPhone手机和iPad平板电脑等。
2012年8月21日,苹果成为世界市值第一的上市公司。
从苹果公司2012年的三大报表我分析得出以下粗略结论。
一.筹资2012年苹果公司普通股从最开始的14850百万美元到17167百万美元,资产增加了2317百万美元。
通过对外发行债券,苹果公司从市场上筹资了2317百万美元。
二.投资从苹果公司的资产负债表上看到,苹果公司的投资分为短期投资和长期投资。
其中短期投资从2012年开始的18417百万美元到年底的23666百万美元,一年内增加了5249百万美元。
增幅是28.5%。
而苹果公司的长期投资则从年初的81638百万美元增加到了97292百万美元。
15654百万美元。
增加了19.2%。
从这可以知道苹果公司的投资是逐渐加大的。
在 2012 财年苹果一共开设了 33 家新苹果零售店,其中 28 家在美国境外,目前苹果零售店的总数已经达到 390 家。
每家苹果零售店平均收益从 2011 年的 4330 万美元增至 2012 年的 5150 万美元,同比增长 19%。
三.经营从苹果公司的利润分配表可以知道,苹果公司收入从2012年年初的39186百万美元增加到年底的54512百万美元。
CONDENSED CONSOLIDATED STATEMENTS OF OPERATIONS (Unaudited)(In millions, except number of shares which are reflected in thousands and per share amounts)Three Months EndedDecember 28,2019 December 29,2018Net sales:Products $ 79,104 $ 73,435 Services 12,715 10,875 T otal net sales (1)91,819 84,310 Cost of sales:Products 52,075 48,238 Services 4,527 4,041 T otal cost of sales 56,602 52,279 Gross margin 35,217 32,031Operating expenses:Research and development 4,451 3,902 Selling, general and administrative 5,197 4,783 T otal operating expenses 9,648 8,685Operating income 25,569 23,346 Other income/(expense), net 349 560 Income before provision for income taxes 25,918 23,906 Provision for income taxes 3,682 3,941 Net income $ 22,236 $ 19,965Earnings per share:Basic $ 5.04 $ 4.22 Diluted $ 4.99 $ 4.18Shares used in computing earnings per share:Basic 4,415,040 4,735,820 Diluted 4,454,604 4,773,252(1) Net sales by reportable segment:Americas $ 41,367 $ 36,940 Europe 23,273 20,363 Greater China 13,578 13,169 Japan 6,223 6,910 Rest of Asia Pacific 7,378 6,928 T otal net sales $ 91,819 $ 84,310(1) Net sales by category:iPhone $ 55,957 $ 51,982 Mac 7,160 7,416 iPad 5,977 6,729 Wearables, Home and Accessories 10,010 7,308 Services 12,715 10,875 T otal net sales $ 91,819 $ 84,310CONDENSED CONSOLIDATED BALANCE SHEETS (Unaudited)(In millions, except number of shares which are reflected in thousands and par value)December 28,2019 September 28,2019ASSETS:Current assets:Cash and cash equivalents $ 39,771 $ 48,844 Marketable securities 67,391 51,713 Accounts receivable, net 20,970 22,926 Inventories 4,097 4,106 Vendor non-trade receivables 18,976 22,878 Other current assets 12,026 12,352 T otal current assets 163,231 162,819Non-current assets:Marketable securities 99,899 105,341 Property, plant and equipment, net 37,031 37,378 Other non-current assets 40,457 32,978 T otal non-current assets 177,387 175,697 T otal assets $ 340,618 $ 338,516LIABILITIES AND SHAREHOLDERS’ EQUITY:Current liabilities:Accounts payable $ 45,111 $ 46,236 Other current liabilities 36,263 37,720 Deferred revenue 5,573 5,522 Commercial paper 4,990 5,980 T erm debt 10,224 10,260 T otal current liabilities 102,161 105,718Non-current liabilities:T erm debt 93,078 91,807 Other non-current liabilities 55,848 50,503 T otal non-current liabilities 148,926 142,310 T otal liabilities 251,087 248,028Commitments and contingenciesShareholders’ equity:Common stock and additional paid-in capital, $0.00001 par value: 12,600,000 sharesauthorized; 4,384,959 and 4,443,236 shares issued and outstanding, respectively 45,972 45,174 Retained earnings 43,977 45,898 Accumulated other comprehensive income/(loss) (418 )(584 ) T otal shareholders’ equity 89,531 90,488 T otal liabilities and shareholders’ equity $ 340,618 $ 338,516CONDENSED CONSOLIDATED STATEMENTS OF CASH FLOWS (Unaudited)(In millions)Three Months EndedDecember 28,2019 December 29,2018Cash, cash equivalents and restricted cash, beginning balances $ 50,224 $ 25,913 Operating activities:Net income 22,236 19,965 Adjustments to reconcile net income to cash generated by operating activities:Depreciation and amortization 2,816 3,395 Share-based compensation expense 1,710 1,559 Deferred income tax expense/(benefit) (349 )53 Other (142 )(54 ) Changes in operating assets and liabilities:Accounts receivable, net 2,015 5,130 Inventories (28 )(1,076 ) Vendor non-trade receivables 3,902 6,905 Other current and non-current assets (7,054 )(886 ) Accounts payable (1,089 )(8,501 ) Deferred revenue 985 (370 ) Other current and non-current liabilities 5,514 570 Cash generated by operating activities 30,516 26,690 Investing activities:Purchases of marketable securities (37,416 )(7,077 ) Proceeds from maturities of marketable securities 19,740 7,203 Proceeds from sales of marketable securities 7,280 9,723 Payments for acquisition of property, plant and equipment (2,107 )(3,355 ) Payments made in connection with business acquisitions, net (958 )(167 ) Purchases of non-marketable securities (77 )(427 ) Other (130 )(56 ) Cash generated by/(used in) investing activities (13,668 )5,844 Financing activities:Proceeds from issuance of common stock 2 — Payments for taxes related to net share settlement of equity awards (1,379 )(1,318 ) Payments for dividends and dividend equivalents (3,539 )(3,568 ) Repurchases of common stock (20,706 )(8,796 ) Proceeds from issuance of term debt, net 2,210 — Repayments of term debt (1,000 )— Proceeds from/(Repayments of) commercial paper, net (979 ) 6 Other (16 )— Cash used in financing activities (25,407 )(13,676 ) Increase/(Decrease) in cash, cash equivalents and restricted cash (8,559 )18,858 Cash, cash equivalents and restricted cash, ending balances $ 41,665 $ 44,771 Supplemental cash flow disclosure:Cash paid for income taxes, net $ 4,393 $ 4,916 Cash paid for interest $ 771 $ 836。
Financial Statement Analysis: Apple Inc.高春华J08033206财务管理2班1.Preliminary financial analysis (1)2.Sales analysis by source (2)parative financial statements (6)4.Further analysis of financial statements (10)5.Short-term Liquidity (12)6.Capital Structure and Solvency (14)7.Return on Investment Capital (16)8.Analysis of Asset Utilization (17)9.Analysis of Operation Performance and Profitability (18)10.Summary Evaluation and Inferences (19)11. Financial Market Measures and Conclusion (20)APPLE IN.C 2010 ANNUAL REPORT1. Preliminary Financial AnalysisApple Inc. is an American multinational corporation that designs and markets consumer electronics, computer software, and personal computers. The company's best-known hardware products include the Macintosh line of computers, the iPod, the iPhone and the iPad. Its products and services include iPhone, iPad, Mac, iPod, Apple TV, the iOS and Mac OS X operating systems, iCloud, and various accessory and support offerings, as well as a range of consumer and professional software applications. The company sells its products and services to consumers, small and mid-sized business, education, enterprise, and government customers through its retail stores, online stores, and direct sales force, as well as through third-party cellular network carriers, wholesalers, retailers, and value-added resellers. In addition, it offers various third-party iPhone, iPad, Mac, and iPod compatible products, including application software, printers, storage devices, speakers, headphones, and other accessories and peripherals, through its online and retail stores; and digital content and applications through the iTunes Store, App Store, iBookstore, and Mac App Store. As of July 2011, the company operates 357 retail stores in ten countries, and an online store where hardware and software products are sold.As of September 2011, Apple is the largest publicly traded company in the world by market capitalization and the largest technology company in the world by revenue and profit.2. Sale Analysis by SourceNet Sales by Operating Segment:Americas net sales $ 38,315Europe net sales 27,778Japan net sales 5,437Asia-Pacific net sales 22,592Retail net sales 14,127Total net sales $ 108,249percentage of salesAmericas net sales 35.40%Europe net sales 25.66%Japan net sales 5.02%Asia-Pacific net sales 20.87%Retail net sales 13.05%Percentage of Americas net sales=38315/108249=35.4%Percentage of Europe net sales=27778/108249=25.66%Percentage of Japan net sales=5437/108429=5.02%Percentage of Asia-Pacific net sales=22592/108429=20.87%Percentage of Retail net sales=14127/108249=13.5%Apple Inc.’s sales by division in year 11 are shown in Exhibit A1.1. Its Americans and Europe divisions are the largest contributors of sales, accounting for 35.4% and 25.66%. Because Americas and Europe have similar language and culture , the awareness of Apple's use and acceptance are better than other divisions, so do the market environment.Net Sales by Product: A1.2 percentage of salesDesktops (a) $ 6,439 Desktops (a) 5.95% Portables (b) 15,344 Portables (b) 14.17%Total Mac net sales 21,783 Total Mac net sales 20.12%iPod 7,453 iPod 6.89% Other music related products Other music related productsand services (c) 6,314 and services © 5.83% iPhone and related products iPhone and related productsand services (d) 47,057 and services (d) 43.47% iPad and related products iPad and related productsand services (e) 20,358 and services (e) 18.81% Peripherals and other hardware (f) 2,330 Peripherals and other hardware2.15%(f)2,954 Software, service and other sales(g)2.73% Software, service and othersales(g)Total net sales $108,249Percentage of net sales by deaktop=6439/108249=5.95%Percentage of net sales by Portables=15344/108249=14.17%Percentage of net sales by ipod=7453/108249=6.89%Percentage of net sales by other music related products and services=6314/108249=5.83%Percentage of net sales by iphone and related products and services =47057/108249=43.47%Percentage of net sales by ipad and related products and services =20358/108249=18.81%Percentage of net sales by Peripherals and other hardware =2330/108249=2.15% Percentage of Software, service and other sales =2954/108249=2.73%From the Exhibit A1.2,we can see iphone and related products and services are the largest contributors of sales , accounting for 43.47%。
苹果公司盈利能力分析一、资本经营盈利能力分析净资产收益率变化:49.30%-34.90%=14.4%连环代替分析:2013年: [27.92%+(27.92%-1.17%)×0.6904]×(1-24.75%)=34.90%第一次替代:[33.05%+(33.05%-1.17%)×0.6904]×(1-24.75%)=41.43%第二次替代:[33.05%+(33.05%-1.07%)×0.6904]×(1-24.75%)=41.48%第三次替代:[33.05%+(33.05%-1.07%)×1.0233]×(1-24.75%)=49.49% 2014年: [33.05%+(33.05%-1.07%)×1.0233]×(1-25.04%)=49.30%总资产报酬率变动的影响为:41.43%-34.90%=6.53%负债利息率变动的影响为:41.48%-41.43%=0.05%资本结构变动的影响为:49.49%-41.48%=8.01%所得税税率变动的影响为:49.30%-49.49%=-0.19%由以上计算可得,苹果公司2014年净资产收益率提高主要是由于资本结构变动和总资产报酬率变动引起的,资本结构变动使净资产收益率提高了8.01%,总资产报酬率上升使净资产收益率提高了6.53%。
利息率下降给净资产收益率提高带来有利影响,使其提高了0.05%,所得税税率上升使净资产收益率下降了0.19%;四个因素共同作用使净资产收益率比上年上升了14.4%。
二、资产经营盈利能力分析总资产报酬率变化:33.05%-27.92%=5.13%因素分析:总资产周转率变动的影响:(1.07-0.95)×29.26%=3.5112%销售息税前利润率变动的影响:(31.03%-29.26%)×1.07=1.8939%分析结果表明,苹果公司2014年总资产报酬率比上年上升了5.13%,是由于总资产周转率和销售息税前利润上升共同引起的。