Aspen_中文培训资料
- 格式:ppt
- 大小:1.73 MB
- 文档页数:339

Aspen Tutorial #1: Aspen BasicsOutline:•Introduction to Aspen•Problem Description•Beginning a Simulation•Navigating the Aspen Window•Creating a Process Flowsheet•Data Input•Running the SimulationIntroduction:In industry complicated problems are often not solved by hand for two reasons: human error and time constraints. There are many different simulation programs used in industry depending on the field, application, and desired simulation products (entire process unit, one piece of equipment, etc.). When used to its full capabilities, Aspen can be a very powerful tool for a Chemical Engineer in a variety of fields including oil and gas production, refining, chemical processing, environmental studies, and power generation to name a few.Over the course of these tutorials, you will be introduced to some of the basic features of Aspen as we build a simulation of an acetone/water extraction-distillation process. This problem is based very loosely on Example Problem 4.4-2 in Elementary Principles of Chemical Process by Felder and Rousseau. Because we will build on our existing simulation with each tutorial, it is highly recommended that you save your work every week so you do not have to start from scratch each time. The homework problems will emphasize one particular feature of Aspen that is covered in the tutorial for that week. Problem Description:A mixture containing 50.0 wt% acetone and 50.0 wt% water is to be separated into two streams – one enriched in acetone and the other in water. The separation process consists of extraction of the acetone from the water into methyl isobutyl ketone (MIBK), which dissolves acetone but is nearly immiscible with water. The overall goal of this problem is to separate the feed stream into two streams which have greater than 90% purity of water and acetone respectively.This week we will begin by learning the basics of running Aspen and building a process flowsheet. This will be one of the longest tutorials of the quarter as it introduces you to a number of features that must be understood to complete even a basic simulation. Our goal at the end of this tutorial is to understand some of the features of Aspen while creating a simulation of the mixture of a feed stream of 100 lbs/hr of the 50/50 acetone-water mix with a solvent stream of 100 lbs/hr of MIBK.Beginning a Simulation:1.Start the Aspen program. It can be found in the start menu under:Start/Programs/ChemE/Aspen Plus User Interface2.Choose what type of simulation you would like to use. Later on in the quarteryou will want to open up an existing simulation, but now we will use the template option.The window that appears can be seen in Figure 1. I mention it to again highlight the variety of problems that Aspen can solve as seen by the number of availabletemplates.Figure 1: Available Simulation TemplatesWe will use the General with English Units option.3.When the Connect to Engine window appears, use the default Server Type (LocalPC).Navigating the Aspen Window:Figure 2, on the next page shows the Aspen process flowsheet window. Some of the features are highlighted in the Figure and the most general of these will be discussed in the sections that follow.Some things worth mentioning: • Your simulation efforts will be greatly aided by becoming familiar with the toolbar features. This will eliminate the need to search through the menu bar for the various features.• Hitting the arrow on the side of either a piece of equipment or the stream will present a number of options for that particular item.• The status bar will tell the user what each piece of equipment will do. This is useful when selecting pieces of equipment like columns or reactors for more complicated simulation work.• The simulation status in the bottom right hand corner will notify the user when all of the required data has been input and the simulation can be run.Figure 2: Process Flowsheet WindowCreating a Process Flowsheet:To place a unit operation (or piece of equipment) into the flowsheet window, select it from the Equipment Model Library and then click on the flowsheet window where you would like the piece of equipment to appear. Do this for each piece of equipment that you would like to add to your simulation. For this week’s simulation you will only need to add one Stream Mixer (found in the Mixers/Splitters Tab). You may want to go through the rest of the Equipment Model Library to see what other types of equipment are available in this program. Equipment ModelLibrary StreamLibrary Select Mode Button Status Bar Toolbar FeaturesSimulation StatusIt should be pointed out that after adding your desired unit operations you must click on the Select Mode Button to reposition or resize the icon. If you do not select this button, you will continue to add equipment to the process flowsheet. To delete extraneous equipment, simply highlight that object and hit the delete key on the keyboard.To add Material Streams to your simulation select the appropriate stream from the Stream Library (other options include heat and work, but we will not be using those at this time). It should be pointed out that Aspen has a feature that will indicate to you where streams are required. When you select the material stream option, a number of arrows will appear on each of the unit operations. Red arrows indicate a required stream and blue arrows indicate an optional stream. This is shown in Figure 3 below.Streams can be added by clicking on the process flowsheet where you would like the stream to begin and clicking again where you would like the stream to end. To connect to a piece of equipment you must have the desired stream type selected and then begin or end on one of the arrows shown on the piece of equipment (depending on if your stream is a feed to or product from the equipment). In a similar fashion to the equipment, each click will add a new stream to the process flowsheet until you click on the Select Mode Button.RequiredStream OptionalStreamFigure 3: Required Stream LocationsFor this tutorial, you will need to add two streams feeding into the mixer, and one product stream leaving the mixer.Some features of Aspen that should be mentioned at this point are the ability to rotate, resize, and rename both the streams and the unit operations. To do this, simply select the object that you would like to manipulate and right click on it. This will present you with a number of options for changing each object. I would recommend renaming both the material streams and the mixer to names that will better distinguish them (rather than the default numbers and letters).At this point your process flowsheet should be complete and it should somewhat resemble the one shown in Figure 4. Notice the simulation status has been changed from “Flowsheet not Complete” to “Required Input Incomplete”.Figure 4: Completed Mixer FlowsheetData Input:All of the data input for Aspen is entered in the Data Browser window. This window can be opened by clicking on the eyeglass icon or by going to Data/Data Browser in the Menu Bar. Aspen has two features in the Data Browser window that can both help and hurt the user. The first of these can be seen on the right hand side. Aspen highlights the areas where the input has been complete and has not been completed with the use of either a blue check mark or a half filled red circle, as seen in Figure 5. However, you can not always assume that all of the required input has been entered, especially if you are simulating a more complex problem. This feature will only track the minimal data input required to run a simulation and may cause problems in getting simulations to converge successfully. I recommend going through each icon on the left hand side one by one to make sure that you input all of the desired data for your particular application.Aspen also has a tool in the toolbar that will automatically take the user through the required data input in a stepwise fashion. The button that does this is the blue N with the arrow (Next), also seen in Figure 5. Again, this feature steps through only the minimal data input and I would recommend avoiding the use of it until you are more experienced with Aspen.Figure 5: Data Browser WindowUnder the Setup tab, in the Specifications folder you can input features such as asimulation title and a description of the project that you are working on. These are useful features for tracking your work and for tracking changes that you make to your work over time. Other features that are worth mentioning are the Units-Sets option and the Report Options. In the Units-Sets tab a user can input a new base set of units based on what they would like for their specific application. For now we will stick with the default base set. Under the Report Options the user can change how and what information is provided after a simulation is completed and converged. We will discuss this more thoroughly in next week’s tutorial.Under the Components tab the user will input what components will be used in this simulation. Aspen has a huge database of commonly used (and some not so commonly used) components and their physical properties. It also has an option where a user can define components that are not included in the database. Under the Specifications option we will input our components in the Selection tab. In the box marked component name, enter each of the components one at a time and hit the enter key. When you enter Methyl Isobutyl Ketone the find wizard will open up. Select MIBK from the list of possible matches, hit the add button, and then close the find window. You must also input aComponent ID for all of the components (although a default one will appear for MIBK). Next ButtonsInput CompleteInput IncompleteIf you do not, the program will not recognize that component later on. When you have entered all three components your screen should look similar to that in Figure 6.Figure 6: Component SelectionThis is the only option where we will need to input data under the Components tab. It should be noted that there are a number of options for entering pseudo components or refining crude assays, etc. which is a commonly used feature in some industrial applications.The user input under the Property tab is probably the most critical input required to run a successful simulation. This key input is the Base Method found under the Specifications option. The Base Method is the thermodynamic basis for all of the simulation calculations and this will be discussed in much greater detail in a later tutorial. For now select the Ideal method. In future applications, you may wish to use a Process type that is specific to your particular project. However, for now we will stick with the default All and this will complete our inputs under the Properties tab. The completed Property tab screen is shown in Figure 7.Figure 7: Completed Properties ScreenUnder the Streams tab, we will enter in all of the specifications for each of the feed streams one at a time. Remember one feed stream is 100 lbs/hr of a 50/50 wt% mixture of Acetone and Water and the other stream is 100 lbs/hr of pure MIBK. For this simulation we will use a temperature of 75° F and a pressure of 50 psi. Take notice of the many ways you can input the stream data (i.e. temperature/pressure/vapor fraction, mole/mass basis, and stream compositions based on percent flow/mass flow/mole flow etc.). Input the appropriate data for both your feed and solvent streams (mine are named Feed and MIBK1). You will either need to switch the basis for the streams or do some hand calculations to convert the problem’s mass flow to the default mole flow (I suggest switching the basis). When complete, the window should look like the one seen in Figure 8.Figure 8: Completed Feed Stream InputThe final area that requires input is the Blocks tab. Open up this feature and the tab corresponding to the mixer. Under this unit operation we have the option of forcing the feed streams to mix at a desired pressure or with valid phases. In our mixer we are not changing the temperature or pressure so we will specify that liquids are the only valid phases because both of the feed streams are liquid at these conditions. After this is input you will notice that the Simulation Status changes to “Required Input Complete”. There are a number of other features in the Data Browser that we will work with over the course of the quarter, but for now our input is complete and you are ready to run the simulation.Running the Simulation:There are a few ways to run the simulation. The user could select either the Next button in the toolbar which will tell you that all of the required inputs are complete and ask if you would like to run the simulation. The user can also run the simulation by selecting the run button in the toolbar (this is the button with a block arrow pointing to the right). Finally, the user can go to run on the menu bar and select run.After the simulation is run and converged, you will notice that the Results Summary Tab on the Data Browser Window has a blue check mark. Clicking on that tab will open up the Run Status. If your simulation has converged it should state “Calculations were completed normally”. If you have received this message you have successfully completed Tutorial #1.Next week: Convergence and Presentation of ResultsAspen Tutorial #2: Convergence and Presentation ofResultsOutline:•Problem Description•Checking Simulation Results•Adding Stream Tables•Adding Stream Conditions•Printing from Aspen•Viewing the Input SummaryProblem Description:A mixture containing 50.0 wt% acetone and 50.0 wt% water is to be separated into two streams – one enriched in acetone and the other in water. The separation process consists of extraction of the acetone from the water into methyl isobutyl ketone (MIBK), which dissolves acetone but is nearly immiscible with water. The overall goal of this problem is to separate the feed stream into two streams which have greater than 90% purity of water and acetone respectively.This week we will be learning about some of the features that Aspen has for presenting simulation results. We will also be covering the importance of checking for convergence and making sure that the solutions determined by Aspen are reasonable. We will be using our simulations from last week to cover these topics.Checking Simulation Results:One of the most important things to remember when using a computer simulation program, in any application, is that incorrect input data or programming can lead to solutions that are “correct” based on the program’s specifications, but unrealistic with regards to real life applications (i.e. a distillation tower that can split crude oil into fuel gas, gasoline, and asphalt on only one tray). For this reason it is very important that the user complete at least some very basic checks and balances to make sure the simulation results are reasonable, based on their experience and the expected results.At the end of Tutorial #1 we had completed a simulation of the first mixer in our acetone separation process. Reopen your simulation by using the “Open an Existing Simulation” option. Because this tutorial was focused on learning the basics of Aspen, we did not discuss checking your results. For this reason we will rerun our existing simulation.To do this we must first reinitialize our simulation in order to delete the existing results. This can be done by going to Run/Reinitialize in the menu bar. After selecting OK for both of the windows that pop up when you select the reinitialize option, your simulation will be reset (Note: This feature is useful when modifying an existing simulation and we will use it a lot this quarter). Now that the simulation has been reset, run it again, but this time use the next button. By using the next button to run the simulation, the program willshow you information about its convergence in a status window that otherwise does not normally appear. If you run the simulation in another fashion, this status window can be opened by selecting the Run Control Panel button in the toolbar. This window and the Run Control Panel button can be seen in Figure 1.Run ControlPanel ButtonFigure 1: Convergence Status WindowBecause our simulation is a very basic system you should not have convergence difficulties. However, as our simulation progresses over the quarter, we will be adding more complicated unit operations (equipment) which may require multiple iterations to solve. In this case you will want to examine this status window closely to make sure that the simulation did converge with reasonable tolerance. Some factors that lead to convergence difficulties are a poor choice for the Base Method (thermodynamics) and the addition of recycle streams. This status window will also list any warnings or errors that may arise based on your input choices.While our simulation converged normally, it does not necessarily mean that the solution is reasonable. We will now proceed on to another basic check that should be done when completing simulations. Close the status window by selecting the Run Control Panel button. When this window is closed open up the Data Browser window.Click on the Results Summary Tab and open up the Streams option. When you do this you will be presented with a stream material summary table. While we expect Aspen to be correct, it is advisable to run a few simple checks on the data presented in this table.As mentioned above, Aspen can give “correct” but unreasonable results due to convergence or the selected thermodynamics, so it is highly recommended that you verify the results presented in this table. Some checks to perform include a quick material balance, a quick heat balance, and a comparison to experimental or operating data if it is available. Further along in your careers, you will be able to use your experience to notice much more quickly if the results do not appear to be reasonable. However, even then you should look at every number that is presented in the results. If your results appear to be acceptable you can move on to adding the simulation results to the process flowsheet for ease of presenting.Adding Stream Tables:Adding stream tables to the process flowsheet is a simple process, but we will first go over some options for formatting and modifying your stream tables. On the current screen you will see two of the options for varying the stream table: Display and Format. Under the Display drop down menu there are two options, all streams or streams. The streams option allows the user to choose which streams they would like presented, one by one. Under the Format drop down menu there are a number of types of stream tables. Each of the options presents the data in a slightly different fashion, depending on the intended application. We will use the CHEM_E option this quarter. To add a stream table, simply click on the Stream Table button and a stream table will be added to your process flowsheet. These features are highlighted in Figure 2.Stream TableButtonDisplay Option Format OptionFigure 2: Stream Table ResultsAfter you have added a stream table your process flowsheet should look similar to that seen in Figure 3.Figure 3: Process Flowsheet with Stream TableThere is one other location where the user can modify the appearance and content of stream tables. In the Data Browser window, under the Setup tab there is an option entitled Report Options. In this option there is a tab labeled Stream which is shown in Figure 4. You will notice that the user can add to or reduce from the number of items to be included in the stream report (flow basis, fraction basis, etc.). The user can also change the sized of the stream format from standard to wide. However, if you change any of these features after your simulation has been run and converged, they will not appear in your stream table until you have rerun the simulation. At this point make sure that your stream table is set up to report the mole flow basis and the mass fraction basis, and rerun your simulation. Your process flowsheet should now look like that seen in Figure 5. You will notice the stream table that you have added to the process flowsheet should automatically update with the new stream table conditions that you have input. However, if it does not, simply click on the stream table and then click on the process flowsheet window and the table will update.Figure 4: Stream OptionsFigure 5: Updated Stream TableAdding Stream Conditions:In a large simulation, it is often useful to add stream conditions directly to the streams themselves so the user doesn’t have to search through a large stream table for values. While this is not the case in our simulation we will now add the temperature and pressure to each of the streams to learn how to do this.This can be done in the Options window under Tools in the menu bar shown in Figure 6. When you have opened the Options window, click on the Results View Tab. Select the Temperature and Pressure options and hit OK. You will notice those two properties will now be shown on your process flow worksheet as shown in Figure 7. The format of these variables can be changed in the Options window by changing the symbology in the Format box. The only value you will likely change is the number in the box – this represents the number of decimal places in the displayed values. We will not change this now.Figure 6: Options WindowFigure 7: Updated Process FlowsheetPrinting from Aspen:Printing a process flowsheet can be completed quite easily from the print button on the toolbar. However, the user may want to select only a portion of a process flowsheet to print. To do this, either right click on the flowsheet window and select Page Break Preview, or go to View/Page Break Preview in the menu bar. Doing so will place a grey box around your entire process diagram in the flowsheet window as shown in Figure 8. This box represents the area that will be printed, similar to the print preview option in other programs. This box can be moved around on the screen and/or reduced/enlarged to fit the user’s need. When the box is positioned to the users need, the flowsheet can be printed as mentioned above.Figure 8: Page Break PreviewViewing the Input Summary:Another way for an Aspen user to present their results is through the program’s Input Summary. This is a useful way to check your input data for errors (or for a supervisor to check a junior engineer’s work quickly to look for bad assumptions etc.). The input summary is easily produced by going to View/Input Summary in the menu bar. The summary will be opened up in Notepad and it can be saved or printed directly from here. Next week: Flash DistillationTutorial #2 Homework and Solution Question:Turn in a copy of both the completed process flowsheet and the Input Summary that are created while working through Aspen Tutorial #2.Solution:Tutorial 1Stream ID FEED MIBK1PRODUCT1 Temperature F 75.0 75.0 75.0 Pressure psi 50.00 50.00 50.00 Vapor Frac 0.000 0.000 0.000 Mole Flow lbmol/hr 3.636 0.998 4.635 Mass Flow lb/hr 100.000 100.000 200.000 Volume Flow cuft/hr 1.825 2.009 3.755 Enthalpy MMBtu/hr -0.432 -0.140 -0.573 Mass FracWATER 0.500 0.250 ACETONE 0.500 0.250 METHY-01 1.000 0.500 Mole Flow lbmol/hrWATER 2.775 2.775 ACETONE 0.861 0.861 METHY-01 0.998 0.998;;Input Summary created by Aspen Plus Rel.12.1at14:57:13Wed Oct13, 2004;Directory E:\Tutorial2FilenameC:\DOCUME~1\BERNAR~1\LOCALS~1\Temp\~ap58f.tmp;TITLE'Tutorial1'IN-UNITS ENGDEF-STREAMS CONVEN ALLDESCRIPTION"General Simulation with English Units:F,psi,lb/hr,lbmol/hr,Btu/hr,cuft/hr.Property Method:NoneFlow basis for input:MoleStream report composition:Mole flow"DATABANKS PURE12/AQUEOUS/SOLIDS/INORGANIC/&NOASPENPCDPROP-SOURCES PURE12/AQUEOUS/SOLIDS/INORGANICCOMPONENTSWATER H2O/ACETONE C3H6O-1/METHY-01C6H12O-2FLOWSHEETBLOCK MIXER1IN=FEED MIBK1OUT=PRODUCT1PROPERTIES IDEALSTREAM FEEDSUBSTREAM MIXED TEMP=75.PRES=50.MASS-FLOW=100.MASS-FRAC WATER0.5/ACETONE0.5/METHY-010.STREAM MIBK1SUBSTREAM MIXED TEMP=75.PRES=50.MASS-FLOW=100.MOLE-FRAC METHY-01 1.BLOCK MIXER1MIXERPARAM NPHASE=1PHASE=LBLOCK-OPTION FREE-WATER=NOEO-CONV-OPTISTREAM-REPOR NARROW MOLEFLOW MASSFRAC;;Aspen Tutorial #3: Flash SeparationOutline:•Problem Description•Adding a Flash Distillation Unit•Updating the User Input•Running the Simulation and Checking the Results•Generating Txy and Pxy DiagramsProblem Description:A mixture containing 50.0 wt% acetone and 50.0 wt% water is to be separated into two streams – one enriched in acetone and the other in water. The separation process consists of extraction of the acetone from the water into methyl isobutyl ketone (MIBK), which dissolves acetone but is nearly immiscible with water. The overall goal of this problem is to separate the feed stream into two streams which have greater than 90% purity of water and acetone respectively.This week we will be building upon our existing simulation by adding a flash separation to our product stream. This unit operation can be used to represent a number of real life pieces of equipment including feed surge drums in refining processes and settlers as in this problem. A flash distillation (or separation) is essentially a one stage separation process and for our problem we are hoping to split our mixture into two streams; one composed of primarily water and acetone and one composed of primarily MIBK and acetone.Adding a Flash Distillation Unit:Open up your simulation from last week which you have hopefully saved. Select the Separators tab in the Equipment Model Library and take a minute to familiarize yourself with the different types of separators that are available and their applications as shown in the Status Bar. We will be using a Flash3 separator using a rigorous vapor-liquid-liquid equilibrium to separate our stream for further purification.Select the Flash3 separator and add one to your process flowsheet. Select the material stream from the stream library and add a product stream leaving the flash separator from the top side, the middle, and the bottom side (where the red arrows indicate a product is required) as shown in Figure 1. Do not add a stream to the feed location yet.You will notice that I have removed the stream table and stream conditions from my flowsheet from last week. I have done this to reduce the amount of things on the screen and will add them back in at the end of this tutorial. You can leave yours on the process flowsheet while working through this tutorial or you can remove them and add them back in at the end of the tutorial.Figure 1: Flash SeparatorTo connect up the feed stream to your flash separator right click on the product stream from your mixer (mine is named PRODUCT1). Select the option Reconnect Destination and attach this stream to the inlet arrow on the flash separator drum. After renaming your streams as you see fit, your process flowsheet should look similar to that in Figure 2.Figure 2: Completed FlowsheetUpdating the User Input:You will notice that the simulation status has changed to “Required Input Incomplete” because of the new unit operation that we have added to our process flowsheet. When making drastic changes to an existing simulation like we have, it is best to reinitialize the simulation like we did in Tutorial #2. Do so now and then open up the data browser window.All of the user input is complete except for that in the blocks tab. One of the nice features of Aspen is that you only need to add input data to new feed streams and new equipment and it will complete calculations to determine the compositions for all of the new intermediate and product streams. However, there is one pitfall to this feature. Keep in mind that we originally selected our thermodynamic method based on our original, simpler simulation. Aspen does not force you to go back to the thermodynamic selection to confirm that the user has selected the appropriate thermodynamic base for their problem and this can lead to convergence problems and unrealistic results if it is not considered.In order for our simulation to properly model VLL equilibrium, we will need to change the thermodynamic method from IDEAL. In the data browser, select specifications under。


ASPEN中文操作手册1、aspen Plus 简介Advanced System for Process Engineering 1976~1981年由MIT主持、能源部资助、55 个高校和公司参与开发。
基于序贯模块法的稳态过程模拟软件。
1773种有机物、2450种无机物、3314种固体物、900种水溶电解质的基本物性参数。
丰富的状态方程和活度系数方法。
2、aspen Plus 基本概念用户界面(User Interface)。
流程图(Flowsheet)。
模型库(Model Library)。
数据浏览器(Data Browser)。
流股(Stream)。
模块(Block)。
3、使用aspen Plus的基本步骤1)启动User Interface2)选用Template3)选用单元操作模块:Model Blocks4)连结流股:Streams5)设定全局特性:Setup Global Specifications6)输入化学组分信息 Components7)选用物性计算方法和模型 Property Methods & Models8)输入外部流股信息 External Steams9)输入单元模块参数 Block Specifications10)运行模拟过程 Run Project11)查看结果 View of Results12)输出报告文件 Export Report13)保存模拟项目 Save Project14)退出 Exit4、选用 Template1)Simulations:根据过程类型和拟用的单位制选用,最常用的是: General with Metric Units2)Run Type 过程仿真用 Flowsheet5、设置全局特性 Setup Globe Spec1)标题 Title2)度量单位 Units of Measurement 输入数据 Input data 输出结果 Output results 3)全局设定 Global Settings 流量基准 Flow basis 大气压力 Ambient pressure有效物态 Valid phases 游离水计算 Use free water calculation6、输入化学组分信息1)每个组分必须有唯一的ID2)组分可用英文名称或分子式输入3)利用弹出对话框区别同分异构体7、选用物性计算方法和模型过程类型 Process type基础方法 Base method亨利组分 Henry components8、输入外部流股信息每一股外部流股都必须输入信息状态变量:温度、压力、流量组成:表达基准、数值9、输入单元模块参数每一各单元模块都必须输入模型参数模型参数的数量因模型而异,请认真理解其物理意义。
ASPEN培训课程内容1、ASPEN蒸馏模型-参考-A9-unit4塔.pdf2、普通精馏-1-ASPEN_气分.pdf3、板式塔计算、填料塔计算-参考-A10-附录 A 塔板和填料的设计和核算.pdf4、原油精馏:2-ASPEN_常压塔.pdf5、反应精馏-14-ASPEN_酯化反应精馏-动力学.pdf6、三相精馏-13-ASPEN_醇水三相精馏.pdf7、三相反应精馏-28-ASPEN_氯乙酸甲酯三相反应精馏.pdf8、共沸系统和剩余曲线-A6-共沸系统和剩余曲线.pdf均相共沸精馏-10-ASPEN_均相共沸精馏.pdf非均相共沸精馏-11-ASPEN_丁二烯脱水计算.pdf9、萃取精馏-萃取精馏.pdf萃取精馏塔-8-ASPEN_碳四萃取精馏.pdf萃取精馏及溶剂循环-9-ASPEN_萃取蒸馏及溶剂回收循环.pdf10、碱洗塔-25-ASPEN_碱洗塔.pdf11、MDEA脱硫-6-ASPEN_MDEA脱硫.pdf12、污水汽提-7-ASPEN_污水汽提.pdf13、装置模拟:15-ASPEN_MTBE装置.pdf14、热力学方法和ASPEN PLUS 热力学模型及选用:参考-5A-ASPEN物性方法和模型1-2章.pdf参考5B-ASPEN物性方法和模型5-6章.pdf参考5 C-ASPEN物性方法和模型附录B.pdf15、反应器的模拟计算:24-ASPEN_酯化反应器模拟.pdf16、再沸器、冷凝器计算:17-ASPEN_再沸器冷凝器计算.pdf17、流程设计与进料优化:18-ASPEN_流程设计及进料优化.pdf18、物性估计及应用- 21-ASPEN_非库组份物性估计.pdf19、物性数据回归-16-ASPEN_热力学数据回归.pdf以上为大致培训内容,次序和侧重点可根据需要调整,1、3和14中的参考内容太多不需复印,给大家电子文件。
8 高级精馏8.1 三相精馏例1:水和醇的分离题目内容:1、分离甲醇、丙醇、丁醇和水的混合物。
要求塔底产品中醇的摩尔百分含量不超过0.1%。
2、分析油相返回塔的百分数对产品纯度的影响。
主要掌握内容1、有效相的选择2、三相计算3、radfrac模块中水槽(decanter)的应用。
4、油相、水相概念5、存在三相平衡情况平衡级的判断已知条件:1、进料组成和条件组分流量(kmol/hr)methanol CH4O 3.01-propanol C3H8O-1 1.75n-butanol C4H10-1 2.65water H2O 38.00温度(C)70压力(atm) 1.52、塔的规定塔板数22塔顶冷却器形式全凝器在沸器釜式再沸器进料板8水槽(decanter)20塔顶采出量 3 kmol/hr回流量150 kmol/hr(L1)塔顶回流罐压力1atm塔底再沸器压力 1.3 atm3、水槽(decanter)的规定水相全回流,L2-spec=1.0 塔底水的摩尔含量为0.999 温度为30C气油比0.6油相返回量0.3~0.94、计算规定使用三相物系5、温度顶温60C底温110C6、物性方法UNIFAC8.2 塔的一些复杂规定例2 乙烯精馏塔的模拟题目内容:分离甲烷、乙烷、乙烯和丙烷的混合物。
要求侧线产品中乙烷摩尔百分含量不超过0.06%;塔底产品中乙烯摩尔百分含量不超过0.99%。
主要掌握内容:1、Heaters-coolers2、Pumparound3、中间冷凝器4、中间再沸器5、塔内某一板上产品组分纯度的规定已知条件:1、进料组成和条件组分流量(kmol/hr)methane (c1) CH4 0.4ethylene (c2-) C2H4 2557.3ethane (c2) C2H6 597.5propylene (c3) C3H6-2 0.6压力25.6 kg/sqcmvapor fraction 1.02、塔的条件塔板数120冷却器类型部分冷凝进料板95再沸器类型釜式再沸器侧线出料位置103、pumparound 规定95块板采出采出量为:2850 kmol/hr汽化份率:0.94、塔的规定塔顶冷凝器所提供的冷量为0.12 mmkcal/hr侧线采出量为2540 kmol/hr塔顶采出量为13.5 kmol/hr第二块板的热负荷-22.5 mmkcal/hr冷凝器压力19.33 kg/sqcm再沸器压力21.13 kg/sqcm5、温度stage 1 -35Cstage 2 -32Cstage 120 -10C6、设计规定控制第二块板的热负荷,使侧线乙烷的摩尔含量为0.0006 控制侧线采出量,使乙烯再塔底的摩尔含量为0.00997、物性方法:RK-SOA VE8.3 RADFRAC收敛问题例3:水/烃的分离题目内容分离丁烷、己烷和水的混合物主要掌握内容1、复习三相精馏2、塔的收敛已知条件:1、进料组成和条件组分流量(kmol/hr)n-butane C4H10-1 0.4n-hexane C6H14-1 2557.3water H2O 597.5压力 1 bar温度60C2、塔的条件塔板数8冷却器类型全凝器进料板 5再沸器类型釜式再沸器4、塔的规定塔顶采出量为12 kmol/hr塔釜蒸汽上升量50 kmol/hr冷凝器压力 1 bar再沸器压力 1 bar7、物性方法:UNIFAC例4:烃类组分的分离题目内容分离丙烷、正丁烷和正癸烷的混合物主要掌握内容1、收敛情况的判断2、结果的可用性3、塔的输入条件的合理化分析4、收敛方法的选取已知条件:1、进料组成和条件组分流量(kmol/hr)n-butane C4H10-1 100 propane C3H8 100n-decane C10H22-1 200压力 2 kg/cm2温度60C2、塔的条件塔板数10冷却器类型部分冷凝器进料板9再沸器类型釜式再沸器4、塔的规定塔顶采出量为200 kmol/hr塔釜蒸汽上升量200 kmol/hr冷凝器压力 1.03 kg/cm2第二板压力 1.2 kg/cm2再沸器压力 1.5 kg/cm25、物性方法:RK-SOA VE例5:四氢呋喃与己烷的分离题目内容:分离四氢呋喃、正己烷和水的混合物。
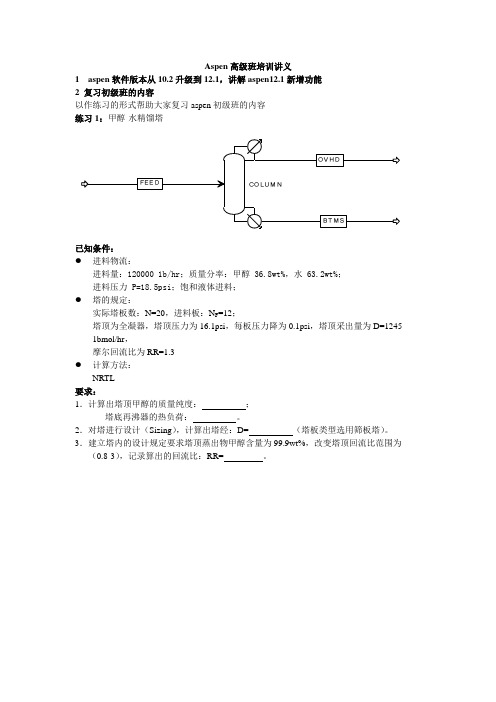
Aspen高级班培训讲义1aspen软件版本从10.2升级到12.1,讲解aspen12.1新增功能2 复习初级班的内容以作练习的形式帮助大家复习aspen初级班的内容练习1:甲醇-水精馏塔已知条件:●进料物流:进料量:120000 1b/hr;质量分率:甲醇 36.8wt%,水 63.2wt%;进料压力 P=18.5psi;饱和液体进料;●塔的规定:实际塔板数:N=20,进料板:N F=12;塔顶为全凝器,塔顶压力为16.1psi,每板压力降为0.1psi,塔顶采出量为D=1245 1bmol/hr,摩尔回流比为RR=1.3●计算方法:NRTL要求:1.计算出塔顶甲醇的质量纯度:;塔底再沸器的热负荷:。
2.对塔进行设计(Sizing),计算出塔经:D= (塔板类型选用筛板塔)。
3.建立塔内的设计规定要求塔顶蒸出物甲醇含量为99.9wt%,改变塔顶回流比范围为(0.8-3),记录算出的回流比:RR= 。
练习2:模拟二氯二甲烷催化裂解制氯乙烯的反应工艺,流程图如下已知条件:反应式为 CH 2CL-CH 2CL —— HCL + CHCL=CH 2 计算方法: RK-SOAVE(DEC ) (VCM ) CH 2CL-CH 2CL 转化率=0.55原料二氯二甲烷的进料量、温度和压力以及反应器、冷凝器、泵的操作条件在流程图中已给出,下面给出精流塔COL1、COL2的操作条件COL1:塔板数15 stages 、回流比RR=1.082、D:F=0.354、进料板:tray 7、压力为367 psiCOL2:塔板数10 stages 、回流比RR=0.969、D:F=0.550、进料板:tray 6、压力为115 psi 要求:1.由上述已知条件建立一个流程模块并给出下列结果: 反应器(REACTER)热负荷: 冷却器(QUENCH)热负荷: 冷却器(QUENCH)出口温度:COL2塔顶冷凝器和塔底再沸器热负荷: 在产品中VCM 的浓度:2.在反应器中DEC 的转化率在0.50-0.55之间变化,做一个灵敏度分析,被调节变量为反应器的热负荷和冷却器的热负荷。