Detection of structural DNA variation from next generation sequencing data: a review of informatic approaches Haley J. Abel a and Eric Duncavage b,*a Department of Genetics, Washington University School of Medicine, St. Louis, MO, USA b Department of Pathology and Immunology, Washington University School of Medicine, St. Louis, MO, USA Abstract Next generation sequencing (NGS), or massively paralleled sequencing, refers to a collective group of methods in which numerous sequencing reactions take place simultaneously, resulting in enormous amounts of sequencing data for a small fraction of the cost of Sanger sequencing. Typically short (50–250 bp), NGS reads are first mapped to a reference genome, and then variants are called from the mapped data. While most NGS applications focus on the detection of single nucleotide variants (SNVs) or small insertions/deletions (indels), structural variation, including translocations, larger indels, and copy number variation (CNV), can be identified from the same data. Structural variation detection can be performed from whole genome NGS data or “targeted” data including exomes or gene panels. However, while targeted sequencing greatly increases sequencing coverage or depth of particular genes, it may introduce biases in the data that require specialized informatic analyses. In the past several years, there have been considerable advances in methods used to detect structural variation, and a full range of variants from SNVs to balanced translocations to CNV can now be detected with reasonable sensitivity from either whole genome or targeted NGS data. Such methods are being rapidly applied to clinical testing where they can supplement or in some cases replace conventional fluorescence in situ hybridization or array-based testing. Here we review some of the informatics approaches used to detect structural
variation from NGS data.
Keywords
Next generation sequencing; massively paralleled sequencing; copy number variation; structural DNA variation; informatics
Introduction
The detection of structural DNA variation has long played a role in the diagnosis of cancer
and Mendelian disorders, predating the advent of modern DNA sequencing (1,2). Structural DNA variation is generally defined as variation in a DNA region larger than 1 kb and
? 2013 Elsevier Inc. All rights reserved.
* Corresponding author. EDuncavage@https://www.doczj.com/doc/fa12938988.html,. HHS Public Access Author manuscript
Cancer Genet . Author manuscript; available in PMC 2015 May 23.
Cancer Genet . 2013 December ; 206(12): 432–440. doi:10.1016/j.cancergen.2013.11.002.Author Manuscript
Author Manuscript
Author Manuscript
Author Manuscript
copy number variations (CNVs) (3). In the clinical laboratory, the detection of structural
variation is performed by a diverse group of methods. Among the oldest and most basic
methods for structural variation detection is routine cytogenetics, in which metaphase
chromosomes are stained and morphologically evaluated by light microscopy. Conventional
cytogenetics represents an unbiased approach for the detection of translocations, inversions,
and large deletions or insertions; however, most clinical cytogenetic as-says are performed
at the 350–500 band level and are of limited resolution and sensitivity. For example,
clinically relevant events such as the FIP1L1-PDGFRA deletion on chromosome 4q12 in
myeloid neoplasms, unusual or multi-partner rearrangements, and variants present in less
than 5% of cells are generally not identified by conventional cytogenetics (4–6). Another
major limitation of conventional cytogenetics is the requirement for cultured metaphase
cells, which are generally not obtainable in solid tumors. Fluorescence in situ hybridization
(FISH) offers considerable advantages over conventional cytogenetics, including increased
resolution, the ability to test fixed interphase cells, faster turnaround time, and greater
sensitivity. For solid tumors, FISH is often the method of choice for the detection of
recurrent mutations, such as ALK rearrangements in lung cancer, MYCN amplification in
neuroblastoma, and 1p/19q deletions in oligodendrogliomas (7–9). While FISH offers
improved sensitivity compared with that of conventional cytogenetics, the evaluation of
multiple loci requires multiple probes and FISH assays to be run, increasing the complexity
of testing. DNA microarray technology has proved to be another reliable clinical method for
the detection of structural variation, especially CNV and loss of heterozygosity (LOH).
However, unlike FISH, DNA microarrays are unable to detect balanced translocations
(10,11).
Next generation sequencing (NGS), often referred to as massively paralleled sequencing, is
a collective group of methods characterized by their high sequencing throughput (12).
Currently available NGS platforms include the Illumina HiSeq/MiSeq, Life Technologies
Ion Torrent/Ion Proton, Life Technologies SOLiD, and Roche 454. In contrast to Sanger
sequencing, which produces a single long (often >1 kb) read using dye terminator chemistry,
NGS methods typically generate millions of short reads on the order of 50–250 bp using
reversible sequencing chemistries (13). NGS methods have allowed for unprecedented
discovery in cancer, including acute myeloid leukemia, lung cancer, and breast cancer, and
are now being applied in the clinical setting for evaluation of cancer predisposition
syndromes, developmental delay, and cancer prognosis (14–19). NGS may be used to
generate whole genome data, generate exome data (all coding sequences in the genome), or
target specific genes or loci of interest (20). While whole genome data is generally low
coverage (8–30 × coverage) and suitable for the detection of constitutional variants, by
targeting sequencing to specific genes or regions of interest, coverage may be increased to
1,000× or higher, permitting more sensitive evaluation of gene variants and subclonal
populations in cancer (21).
NGS-based diagnostics are rapidly becoming part of the clinical genomic testing and are
now routinely offered by many commercial and academic laboratories. One of the key
features of NGS-based diagnostics is its ability to detect a full range of genetic variation,
Cancer Genet. Author manuscript; available in PMC 2015 May 23.
example, prognostic evaluation of acute myeloid leukemia generally requires the use of
multiple technologies including PCR and fragment sizing to detect FLT3 internal tandem
duplications and NPM1 insertions, Sanger sequencing to detect CEBPA, IDH1/2, and
DNMT3A mutations, and FISH to detect MLL, RARA, CBFB, and RUNX1 rearrangements.
Such complex evaluations require numerous highly trained personnel and are often
prohibitively expensive. NGS-based testing, however, can identify SNVs, insertions, and
trans-locations in a single assay, often for considerably lower cost compared with that of
conventional workups (22,23).
Here we review methods for the identification of DNA structural variation by NGS, with
particular emphasis on methods suited for targeted sequencing likely to be used in the
clinical laboratory. This review will focus on three major types of structural variation:
translocations, CNV, and insertions/deletions. While numerous software tools are available
for NGS analysis, currently no single tool is capable of identifying the full range of DNA
variation, and we will review some of the most widely used, publicly available software
packages.
NGS informatics
Algorithms for detection of structural variation from NGS data rely on one or more of the
following: discordant paired-end reads, split reads, or depth of coverage. Discordant paired
reads are read pairs that do not map together in the ordinary way: The paired ends may map
to different chromosomes or to the same chromosome either in the incorrect orientation or in
the proper orientation but, for instance, too far apart in the chromosome. Split reads are
single reads that map to the genome discontinuously: The first part of the read maps to one
genomic region and the remainder to another. Because of the short read lengths currently
available from NGS data, split reads are most useful and reliable from paired-end data, in
which one end maps uniquely to the genome, serving as an “anchor,” and the other end is a
split read. Finally, the depth of sequencing coverage local to a particular point in the genome
provides evidence of structural variation. While changes in read depth over large regions
often indicate copy number changes, more subtle variation in sequence coverage is often
seen near the breakpoints of other types of structural variation.
The performance of any method for detection of structural variation depends critically on the
type of sequencing data available. For instance, split-read methods to detect trans-locations
generally require adequate coverage so that the translocation breakpoints are spanned by
several split reads, and they will not perform well using low coverage whole genome
sequencing data. Similarly, indels can be detected from exome (or targeted-capture) data
using paired- or split-read methods only if at least one of the breakpoints falls within or near
the captured regions. Finally, any method that relies on read depth will perform differently
for whole genome as compared with exome or targeted-capture data, as the depth of
coverage in targeted-capture data is particularly susceptible to GC bias, uneven coverage
near the boundaries of the capture baits, and other systematic biases. A summary of tools
used for structural variation detection is presented in Table 1.
Cancer Genet. Author manuscript; available in PMC 2015 May 23.
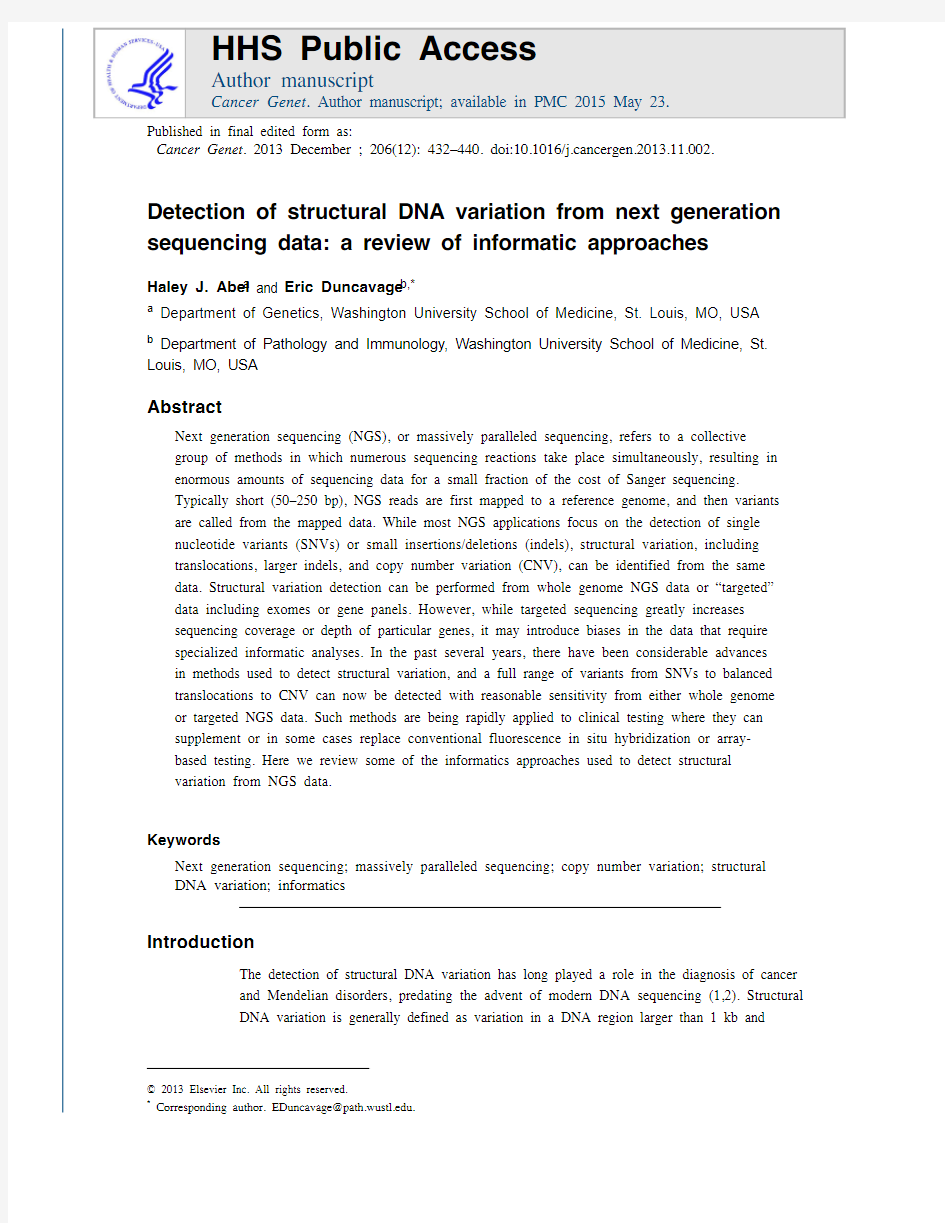
Many algorithms, including BreakDancer, Hydra, PEMer, and VariationHunter, for the
detection of structural variation rely on the presence of discordant paired reads (24–27). In
the case of interchromosomal translocations, one member of the pair maps to one
chromosome and its mate to another (Figure 1). In the case of inversions or
intrachromosomal translocations, the two ends map to the same chromosome but in the
wrong orientation or the wrong distance apart. These algorithms are generally quite sensitive
in detecting translocations and inversions in mappable areas of the genome; however, in
general, they can detect breakpoints only with low resolution and often suffer from low
specificity, particularly when one member of the pair maps to a repetitive region or to a
region that shares homology with other areas of the genome. Furthermore, translocations,
because of the mechanisms by which they are generated, tend to occur in regions with
repetitive elements, such as tandem duplications and transposons (26). Thus, true positives
exist in these regions and are difficult to discern from the many false positives. The Hydra
and VariationHunter software packages attempt to detect structural variations occurring in
such repetitive regions by considering multiple possible high scoring mappings per read,
rather than just the unique, best mapping. Most paired-read methods for detection of
structural variation rely on heuristic cutoffs to filter out false positives, such as the number
of supporting read pairs. One recently described algorithm, however, GASVPro, combines
paired-end and subtle coverage depth signals into a probabilistic model to achieve greatly
improved specificity in detection of structural variation (28).
In order to avoid the high false-positive rates inherent to most paired-read approaches, and
to better localize the breakpoints, as is needed for orthogonal validation of the breakpoints
by PCR, some algorithms for structural variation detection make use of split reads, in which
a single read contains spans a breakpoint between two distant genomic regions. One
indication of the presence of split reads in aligned sequence data is the existence of clusters
of soft-clipped reads. Soft clips are produced by some alignment software (including
Novoalign and BWA) when one end of a paired-end read maps uniquely and entirely to the
genome but the other end does not. If the second end maps only partially, but in the correct
orientation and has an [insert size] within the normal range, the remainder of the sequence is
represented as a “soft clip” (29). These soft-clipped reads often indicate reads with split
mappings and so can be used to localize translocations with single-base accuracy. CREST
and ClipCrop are two algorithms that make use of soft-clipping information to detect split
reads (30,31). SLOPE is another method for detection of translocations by split reads (32).
Instead of using soft clips, however, it performs a local realignment of the unmapped
“orphaned” mates in the vicinity of the uniquely mapped mate and looks for single
breakpoints supported by many split reads.
Detection of copy number variants
Copy number variants are defined as stretches of DNA, longer than a kilobase, that are
present in the genome with an abnormal number of copies. These include large deletions and
duplications, as well as unbalanced translocations.
Cancer Genet. Author manuscript; available in PMC 2015 May 23.
moderately sized deletions, that is, paired-end methods such as BreakDancer or split-read
methods such as Pindel (25,33). Large deletions are easier to detect than smaller indels using
paired-end methods, as they are easily distinguished from normal variation in the insert size.
Large duplications are more difficult to detect, as there is no single read or read pair
spanning the insertion. One software tool capable of detecting large insertions is Pindel,
which uses a pattern-growth approach to detect breakpoints, at which the sequenced genome
diverges from the reference. If two such breakpoints occur in the same chromosome with an
appropriate orientation, Pindel can piece them together to discover a large insertion event.
Discordant paired-end and split-read methods will generally not perform well for CNV
detection from exome or targeted-capture sequence data, as they require the capture of at
least one of the breakpoints. In this case, algorithms that examine the sequence depth of
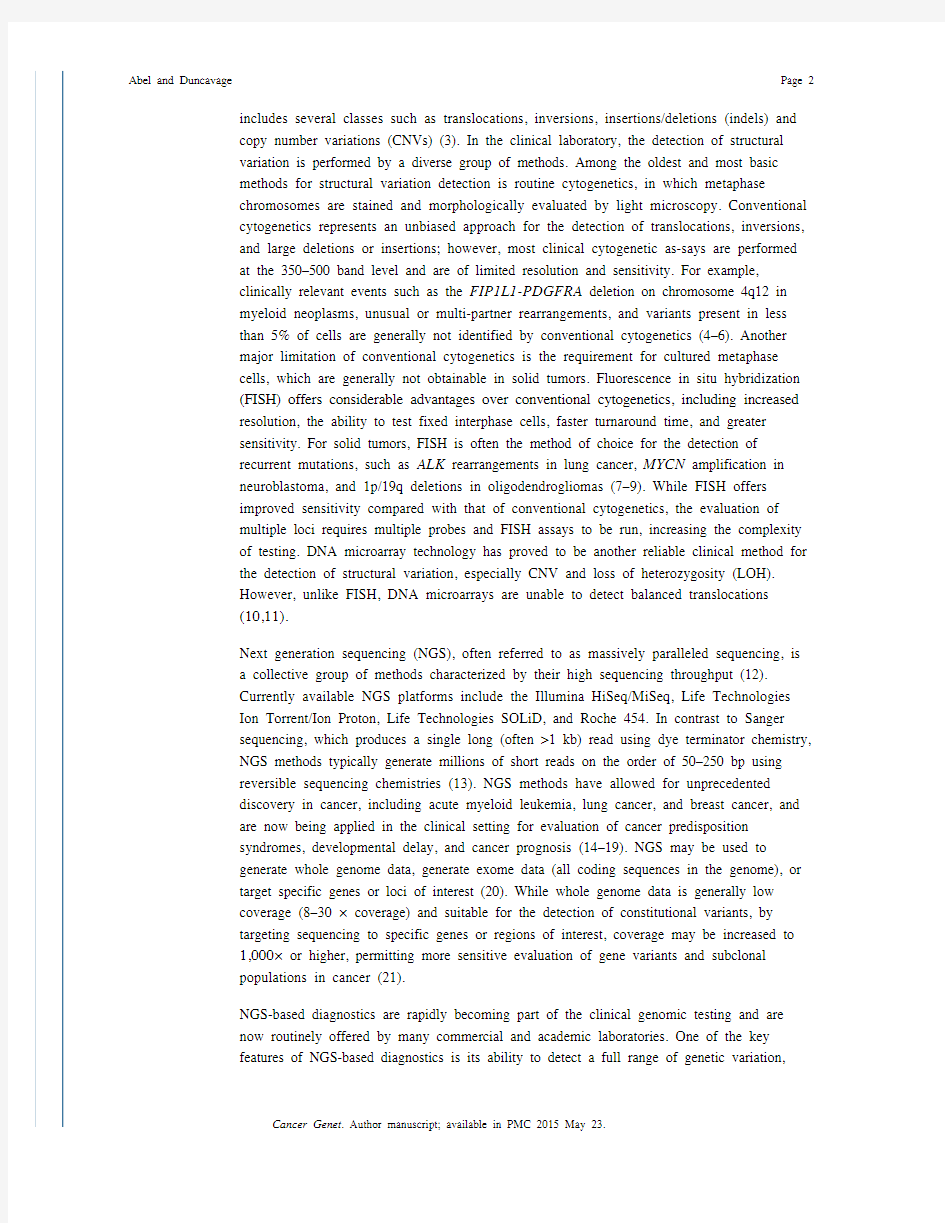
coverage are the primary means for detecting CNV. Read depth methods for CNV can be
applied to both whole genome and targeted-capture data but require different considerations
(Figure 2). In the case of whole genome sequence data, the pattern of deletions and
duplications is readily apparent from the sample's coverage profile, albeit at low resolution.
The computational problems here are to accurately localize the breakpoints and to determine
the number of copies present in each segment. Several software packages have been
developed to address these issues; some of the existing algorithms are intended to detect
CNV based on the read epth profile of a single sample, whereas others require a control
sequence for comparison.
Algorithms such as event-wise testing (EWT) for CNV detection from whole genome
sequence data do not require control sequence data; rather, they rely on deviations in
coverage depth from the sample's mean depth (34). Since many factors, including GC
content, influence a sample's coverage profile, these methods must attempt to correct for
these biases to provide adequate specificity (35). The general procedure for these algorithms
is to divide the genome into nonoverlapping bins of equal size and then calculate the mean
depth of coverage (DOC) for each bin. After the read depths are corrected for GC and other
biases, a segmentation algorithm is used to divide the genome into regions of constant copy
number.
Although methods for CNV detection with no control sample must explicitly account for GC
bias, other methods, including SegSeq, CNVnator, CNAseg, and CNV-seq, designed for
either tumor-normal or case-control comparison avoid this issue by comparing the same
region (which should be subject to the same GC bias) across multiple samples (36–39).
These approaches similarly partition the genome into regions, calculate the depth of
coverage ratio between case and control for each region and then partition the region into
segments of equal copy number, using a variety of approaches, including hidden Markov
models (HMMs) and circular binary segmentation (40). These algorithms, because they rely
on the coverage ratio rather than the raw coverage profile, permit finer mapping of CNV
boundaries using, for instance, mean-shift approaches from signal processing (37).
Detection of CNV from exome or targeted-capture sequence data presents unique challenges
due to the increased GC bias inherent to targeted-capture data, and the discontinuous nature
Cancer Genet. Author manuscript; available in PMC 2015 May 23.
(>1 kb) are targeted, CNV can be detected within single samples (no controls) following
correction for GC-content and edge effects (41). However, because of the small size of
targets in typical exome-capture data, many current algorithms for CNV detection require
either a paired normal sample or a panel of population controls. CONTRA, one such method
for CNV detection from exome data, first calculates the tumor/ normal coverage ratio
exome-wideband then employs a normal approximation to detect CNV at the exon level
(42). Finally, exon-level deletions or duplications are merged into larger CNV using circular
binary segmentation (CBS). CoNVEX detects CNV using a similar strategy, first denoising
the coverage ratio using a discrete wavelet transform, and then identifying copy gains and
losses via a hidden Markov model (43). A third, similar, approach is taken by ExomeCNV,
which segments the exome into regions of equal copy number using CBS, based on the
tumor/normal ratio (44). However, ExomeCNV also models the B-allele frequencies to
detect LOH, which can be used to corroborate CNV calls, deletions in particular.
An additional category of CNV detection algorithms, designed to detect sporadic CNVs
from population exome sequence data, uses principal components of the matrix of read
counts, over samples and exons, to normalize the read count data (45,46). In the absence of
recurrent CNVs, the top principal components, which explain the bulk of the exome-wide
variance in DOC, should represent experimental noise, including batch effects and GC-bias.
Thus, removing the top principal components (i.e., projecting the data onto the space defined
by the remaining components) should eliminate these biases. It should be emphasized,
however, that such methods are intended for detecting sporadic CNVs; recurrent CNVs tend
to be picked up by the top principal components, and their signals are therefore lost in the
process of normalization.
Detection of insertions and deletions
Indels are common in the human genome and contribute to genetic diversity and human
disease (47–49). In the clinical molecular oncology laboratory, the detection of small
(defined here as <10 bp) and medium (defined here as >10 but <1 kb) indels is important to
many cancers. Of particular clinical significance are the NPM1 insertion, FLT3 internal
tandem duplication (FLT3-ITD), KIT exon 8 indels in acute myeloid leukemia, and EGFR
exons 19 and 21 insertions and deletions in lung cancer (50–53). While small-and
mediumsized indels are usually simple to detect by Sanger sequencing or gel capillary–
based sizing methods, indel detection by NGS methods has been challenging largely because
of the short read lengths generated by NGS methods. In general, small indels can be called
with reasonable sensitivity from NGS data, although the specificity tends to be low.
Medium-sized indels, such as the FLT3-ITD, however, have proven difficult to detect by
most, but not all, methods (22). Further, most indel detection software is biased to detect
deletions over insertions, as inserted sequences are more difficult to align to the reference
sequence as described below. Indel detection software can be divided into four major
categories, although there is considerable overlap among software packages.
The most common indel detection methods are alignment-based methods that are generally
optimized to detect small indels. These methods are often included in popular variant
Cancer Genet. Author manuscript; available in PMC 2015 May 23.
(54–56). Alignment-based methods generally rely on probabilistic models to make indel
calls based on data obtained during the initial read mapping and alignment process (Figure
3A). For the example of a small insertion, reads containing the insertion are first mapped to
the reference sequence using gapped alignments, a step generally performed by the read
mapping software (BWA, Novoalign, etc.) (57). Indel variant detection software will then
use the alignment data to call an indel event after applying a filtering step to differentiate
common sequence alignment errors from true indels. There are numerous indel detection
programs that rely on this method, including Dindel, Stampy, and others, in addition to the
more general packages described previously (27,58–61). These methods differ principally in
the model used to discriminate between alignment errors and true indel calls, often resulting
in greatly discrepant indel calls between software and orthogonally generated data (62). Of
the many alignment-based indel detection methods, no single program has proven to be
completely accurate and all require considerable validation when used clinically. A major
drawback of alignment-based methods is the requirement that indels be contained within a
read and identified during the initial read mapping and alignment stage, limiting insertion
detection to approximately 15% of the total read length (22,59). However, larger deletions
may be detected by these methods; this is often referred to as “deletion bias.”
Split read mapping methods, such as the widely used Pindel program, are capable of
identifying medium-sized indels that are often missed by alignment-based indel software
(33). These methods, including de novo alignment and others, function by first identifying
discordant paired-end reads in which one end maps completely to the reference sequence
and the other end does not. The unmapped end of these ”single-end anchored reads” are then
clustered or subjected to de novo alignment to determine the exact sequence of an insertion
(Figure 3B). Using this approach, insertions longer than the read length can be identified, as
such methods do not rely on the initial read mapping step. Split read mapping methods are
particularly suited to identify clinically relevant indels, such as the FLT3-ITD. However,
these methods are also subject to a higher false-positive rate, as they generally do not use
probabilistic models to discriminate between alignment errors and true indel events.
Methods based on paired-end read mapping identify large indel events by comparing the
expected distance between read pairs to the actual mapped distance. Such methods include
PEMer, Hydra, and BreakDancer (25,27). For example, in the case of a 50-bp insertion, if
the distance between read pairs is normally distributed, with mean 200 bp and then multiple
pairs aligning to the same area with a distance between read pairs of approximately 150 bp
would result in an insertion call (Figure 3C). Paired-end read mapping methods are therefore
able to detect medium-sized insertions and deletions from mapped data. However, in most
cases, the exact inserted or deleted sequence will not be known. Another major drawback of
paired-end read mapping methods is that they are insensitive to small insertion or deletion
events, owing to the difficulty in separating small perturbations in read-pair distance from
the normal background variability. Another new class of indel-detection software is those
based on machine learning methods in which insertions and deletions identified by various
methods are filtered against empirically derived training set data to reduce the false-positive
rate (63). These newer methods have yet to be rigorously tested but promise to reduce the
Cancer Genet. Author manuscript; available in PMC 2015 May 23.
low sequence complexity.
Conclusion
A full range of structural variation can be detected from NGS data, including translocations,
CNVs, and indels. It is important to note, however, that there is currently no single
informatic method capable of identifying the full range structural DNA variation, and
multiple complementary tools are required for robust variant detection. Further, the use of
any software for structural variation identification in the clinical laboratory will require
extensive validation, as such methods perform differently depending on assay design
(targeted vs. whole genome) and average DOC.
References
1. Rowley JD. Letter: a new consistent chromosomal abnormality in chronic myelogenous leukaemia
identified by quinacrine fluorescence and Giemsa staining. Nature. 1973; 243:290–293. [PubMed:
4126434]
2. Lejeune J, Gautier M, Turpin R. Study of somatic chromosomes from 9 mongoloid children [in
French]. C R Hebd Seances Acad Sci. 1959; 248:1721–1722.
3. Freeman J, Perry GH, Feuk L, et al. Copy number variation: new insights in genome diversity.
Genome Res. 2006; 16:949–961. [PubMed: 16809666]
4. Cools J, DeAngelo DJ, Gotlib J, et al. A tyrosine kinase created by fusion of the PDGFRA and
FIP1L1 genes as a therapeutic target of imatinib in idiopathic hypereosinophilic syndrome. N Engl J
Med. 2003; 348:1201–1214. [PubMed: 12660384]
5. de Jesus Marques-Salles T, Liehr T, Mkrtchyan H, et al. A new chromosomal three-way
rearrangement involving MLL masked by a t(9;19)(p11;p13) in an infant with acute myeloid
leukemia. Cancer Genet Cytogenet. 2009; 189:59–62. [PubMed: 19167614]
6. Welch JS, Westervelt P, Ding L, et al. Use of whole-genome sequencing to diagnose a cryptic
fusion oncogene. JAMA. 2011; 305:1577–1584. [PubMed: 21505136]
7. Soda M, Choi YL, Enomoto M, et al. Identification of the transforming EML4-ALK fusion gene in
non-small-cell lung cancer. Nature. 2007; 448:561–566. [PubMed: 17625570]
8. Brodeur GM, Seeger RC, Schwab M, et al. Amplification of N-myc in untreated human
neuroblastomas correlates with advanced disease stage. Science. 1984; 224(4653):1121–1124.
[PubMed: 6719137]
9. von Deimling A, Louis DN, von Ammon K, et al. Evidence for a tumor suppressor gene on
chromosome 19q associated with human astrocytomas, oligodendrogliomas, and mixed gliomas.
Cancer Res. 1992; 52:4277–4279. [PubMed: 1353411]
10. Zhou X, Rao NP, Cole SW, et al. Progress in concurrent analysis of loss of heterozygosity and
comparative genomic hybridization utilizing high density single nucleotide polymorphism arrays.
Cancer Genet Cytogenet. 2005; 159:53–57. [PubMed: 15860358]
11. Wiltgen M, Tilz GP. DNA microarray analysis: principles and clinical impact. Hematology. 2007;
12:271–287. [PubMed: 17654053]
12. Mardis ER. New strategies and emerging technologies for massively parallel sequencing:
applications in medical research. Genome Med. 2009; 1:40. [PubMed: 19435481]
13. Mardis ER. Next generation sequencing platforms. Annu Rev Anal Chem (Palo Alto Calif). 2013;
6:287–303. [PubMed: 23560931]
14. Ellis MJ, Ding L, Shen D, et al. Whole-genome analysis informs breast cancer response to
aromatase inhibition. Nature. 2012; 486:353–360. [PubMed: 22722193]
15. Mardis ER, Ding L, Dooling DJ, et al. Recurring mutations found by sequencing an acute myeloid
leukemia genome. N Engl J Med. 2009; 361:1058–1066. [PubMed: 19657110]
Cancer Genet. Author manuscript; available in PMC 2015 May 23.
16. Govindan R, Ding L, Griffith M, et al. Genomic landscape of non-small cell lung cancer in
smokers and never-smokers. Cell. 2012; 150:1121–1134. [PubMed: 22980976]
17. Vignot S, Frampton GM, Soria JC, et al. Next generation sequencing reveals high concordance of
recurrent somatic alterations between primary tumor and metastases from patients with non-small-
cell lung cancer. J Clin Oncol. 2013; 31:2167–2172. [PubMed: 23630207]
18. Worthey EA, Mayer AN, Syverson GD, et al. Making a definitive diagnosis: successful clinical
application of whole exome sequencing in a child with intractable inflammatory bowel disease.
Genet Med. 2010; 13:255–262. [PubMed: 21173700]
19. Pritchard CC, Smith C, Salipante SJ, et al. ColoSeq provides comprehensive lynch and polyposis
syndrome mutational analysis using massively parallel sequencing. J Mol Diagn. 2012; 14:357–
366. [PubMed: 22658618]
20. Clark MJ, Chen R, Lam HY, et al. Performance comparison of exome DNA sequencing
technologies. Nat Biotechnol. 2011; 29:908–914. [PubMed: 21947028]
21. Walter MJ, Shen D, Ding L, et al. Clonal architecture of secondary acute myeloid leukemia. N
Engl J Med. 2012; 366:1090–1098. [PubMed: 22417201]
22. Spencer DH, Abel HJ, Lockwood CM, et al. Detection of FLT3 internal tandem duplication in
targeted, short-read-length, next generation sequencing data. J Mol Diagn. 2012; 15:81–93.
[PubMed: 23159595]
23. Duncavage EJ, Abel HJ, Szankasi P, et al. Targeted next generation sequencing of clinically
significant gene mutations and translocations in leukemia. Mod Pathol. 2012; 25:795–804.
[PubMed: 22425908]
24. Hormozdiari F, Hajirasouliha I, Dao P, et al. Next generation VariationHunter: combinatorial
algorithms for transposon insertion discovery. Bioinformatics. 2010; 26:i350–i357. [PubMed:
20529927]
25. Chen K, Wallis JW, McLellan MD, et al. BreakDancer: an algorithm for high-resolution mapping
of genomic structural variation. Nat Methods. 2009; 6:677–681. [PubMed: 19668202]
26. Quinlan AR, Clark RA, Sokolova S, et al. Genome-wide mapping and assembly of structural
variant breakpoints in the mouse genome. Genome Res. 2010; 20:623–635. [PubMed: 20308636]
27. Korbel JO, Abyzov A, Mu XJ, et al. PEMer: a computational framework with simulation-based
error models for inferring genomic structural variants from massive paired-end sequencing data.
Genome Biol. 2009; 10:R23. [PubMed: 19236709]
28. Sindi SS, Onal S, Peng LC, et al. An integrative probabilistic model for identification of structural
variation in sequencing data. Genome Biol. 13:R22. [PubMed: 22452995]
29. Li H, Durbin R. Fast and accurate long-read alignment with Burrows-Wheeler transform.
Bioinformatics. 26:589–595. [PubMed: 20080505]
30. Wang J, Mullighan CG, Easton J, et al. CREST maps somatic structural variation in cancer
genomes with base-pair resolution. Nat Methods. 8:652–654. [PubMed: 21666668]
31. Suzuki S, Yasuda T, Shiraishi Y, et al. ClipCrop: a tool for detecting structural variations with
single-base resolution using soft-clipping information. BMC Bioinformatics. 2011; 12(Suppl
14):S7. [PubMed: 22373054]
32. Abel HJ, Duncavage EJ, Becker N, et al. SLOPE: a quick and accurate method for locating non-
SNP structural variation from targeted next generation sequence data. Bioinformatics. 2010;
26:2684–2688. [PubMed: 20876606]
33. Ye K, Schulz MH, Long Q, et al. Pindel: a pattern growth approach to detect break points of large
deletions and medium sized insertions from paired-end short reads. Bioinformatics. 2009;
25:2865–2871. [PubMed: 19561018]
34. Yoon S, Xuan Z, Makarov V, et al. Sensitive and accurate detection of copy number variants using
read depth of coverage. Genome Res. 2009; 19:1586–1592. [PubMed: 19657104]
35. Bentley DR, Balasubramanian S, Swerdlow HP, et al. Accurate whole human genome sequencing
using reversible terminator chemistry. Nature. 2008; 456:53–59. [PubMed: 18987734]
36. Chiang DY, Getz G, Jaffe DB, et al. High-resolution mapping of copy-number alterations with
massively parallel sequencing. Nat Methods. 2009; 6(1):99–103. [PubMed: 19043412]
Cancer Genet. Author manuscript; available in PMC 2015 May 23.
37. Abyzov A, Urban AE, Snyder M, et al. CNVnator: an approach to discover, genotype, and
characterize typical and atypical CNVs from family and population genome sequencing. Genome
Res. 2011; 21:974–984. [PubMed: 21324876]
38. Ivakhno S, Royce T, Cox AJ, et al. CNAsegda novel framework for identification of copy number
changes in cancer from second-generation sequencing data. Bioinformatics. 2011; 26:3051–3058.
[PubMed: 20966003]
39. Xie C, Tammi MT. CNV-seq, a new method to detect copy number variation using high-
throughput sequencing. BMC Bioinformatics. 2009; 10:80. [PubMed: 19267900]
40. Olshen AB, Venkatraman ES, Lucito R, et al. Circular binary segmentation for the analysis of
array-based DNA copy number data. Biostatistics. 2004; 5:557–572. [PubMed: 15475419]
41. Nord AS, Lee M, King MC, et al. Accurate and exact CNV identification from targeted high-
throughput sequence data. BMC Genomics. 2011; 12:184. [PubMed: 21486468]
42. Li J, Lupat R, Amarasinghe KC, et al. CONTRA: copy number analysis for targeted resequencing.
Bioinformatics. 2012; 28:1307–1313. [PubMed: 22474122]
43. Amarasinghe KC, Li J, Halgamuge SK. CoNVEX: copy number variation estimation in exome
sequencing data using HMM. BMC Bioinformatics. 2013; 14(Suppl 2):S2. [PubMed: 23368785]
44. Sathirapongsasuti JF, Lee H, Horst BA, et al. Exome sequencing-based copy-number variation and
loss of heterozygosity detection: ExomeCNV. Bioinformatics. 2011; 27:2648–2654. [PubMed:
21828086]
45. Fromer M, Moran JL, Chambert K, et al. Discovery and statistical genotyping of copy-number
variation from whole-exome sequencing depth. Am J Hum Genet. 2012; 91:597–607. [PubMed:
23040492]
46. Krumm N, Sudmant PH, Ko A, et al. Copy number variation detection and genotyping from exome
sequence data. Genome Res. 2012; 22:1525–1532. [PubMed: 22585873]
47. Feuk L, Carson AR, Scherer SW. Structural variation in the human genome. Nat Rev Genet. 2006;
7:85–97. [PubMed: 16418744]
48. Walsh T, McClellan JM, McCarthy SE, et al. Rare structural variants disrupt multiple genes in
neurodevelopmental pathways in schizophrenia. Science. 2008; 320:539–543. [PubMed:
18369103]
49. Sebat J, Lakshmi B, Malhotra D, et al. Strong association of de novo copy number mutations with
autism. Science. 2007; 316:445–449. [PubMed: 17363630]
50. Falini B, Mecucci C, Tiacci E, et al. Cytoplasmic nucleophosmin in acute myelogenous leukemia
with a normal karyotype. N Engl J Med. 2005; 352:254–266. [PubMed: 15659725]
51. Paschka P, Marcucci G, Ruppert AS, et al. Adverse prognostic significance of KIT mutations in
adult acute myeloid leukemia with inv(16) and t(8;21): a Cancer and Leukemia Group B. Study. J
Clin Oncol. 2006; 24:3904–3911. [PubMed: 16921041]
52. Nakao M, Yokota S, Iwai T, et al. Internal tandem duplication of the flt3 gene found in acute
myeloid leukemia. Leukemia. 1996; 10:1911–1918. [PubMed: 8946930]
53. Sequist LV, Martins RG, Spigel D, et al. First-line gefitinib in patients with advanced non-small-
cell lung cancer harboring somatic EGFR mutations. J Clin Oncol. 2008; 26:2442–2449.
[PubMed: 18458038]
54. DePristo MA, Banks E, Poplin R, et al. A framework for variation discovery and genotyping using
next generation DNA sequencing data. Nat Genet. 2011; 43(5):491–498. [PubMed: 21478889]
55. Koboldt DC, Zhang Q, Larson DE, et al. VarScan 2: somatic mutation and copy number alteration
discovery in cancer by exome sequencing. Genome Res. 2012; 22:568–576. [PubMed: 22300766]
56. Li H, Handsaker B, Wysoker A, et al. The Sequence Alignment/Map format and SAMtools.
Bioinformatics. 2009; 25:2078–2079. [PubMed: 19505943]
57. Li H, Ruan J, Durbin R. Mapping short DNA sequencing reads and calling variants using mapping
quality scores. Genome Res. 2008; 18:1851–1858. [PubMed: 18714091]
58. Zhang ZD, Du J, Lam H, et al. Identification of genomic indels and structural variations using split
reads. BMC Genomics. 2011; 12:375. [PubMed: 21787423]
59. Albers CA, Lunter G, MacArthur DG, et al. Dindel: accurate indel calls from short-read data.
Genome Res. 2011; 21:961–973. [PubMed: 20980555]
Cancer Genet. Author manuscript; available in PMC 2015 May 23.
60. Medvedev P, Stanciu M, Brudno M. Computational methods for discovering structural variation
with next generation sequencing. Nat Methods. 2009; 6(11 Suppl):S13–S20. [PubMed: 19844226]
61. Hamada M, Wijaya E, Frith MC, et al. Probabilistic alignments with quality scores: an application
to short-read mapping toward accurate SNP/indel detection. Bioinformatics. 2011; 27:3085–3092.
[PubMed: 21976422]
62. O'Rawe J, Jiang T, Sun G, et al. Low concordance of multiple variant-calling pipelines: practical
implications for exome and genome sequencing. Genome Med. 2013; 5:28. [PubMed: 23537139]
63. Grimm D, Hagmann J, Koenig D, et al. Accurate indel prediction using paired-end short reads.
BMC Genomics. 2013; 14:132. [PubMed: 23442375]
Cancer Genet. Author manuscript; available in PMC 2015 May 23.
Figure 1. Identification of translocations from discordant paired-end reads. (A) In this example, a t(4;11) translocation is identified by discordant paired-end reads. Read pairs are first identified, in which one end maps to the targeted region (in this case the MLL gene on 11q23) and the other end maps to a different chromosome. (B) Discordant paired-end ead methods are subject to high false-positive rates due to sequence-mapping errors and repeat regions in the genome. Most translocation identification software employs filtering criteria to reduce the number of false-positive calls.
Abel and Duncavage Page 12Cancer Genet . Author manuscript; available in PMC 2015 May 23.Author Manuscript
Author Manuscript
Author Manuscript
Author Manuscript
Figure 2. CNV by DOC analysis. In this example, CNV is called by first obtaining the DOC for every position in the targeted sequencing region. Next, DOC data must be normalized, which can be accomplished by a number of approaches, including comparing to paired normal samples (in the case of cancer), pooled normal controls, or the mean sample coverage. Once coverage is normalized, regions of constant CNV are identified, and CNV calls are then made using a variety of probabilistic models.
Abel and Duncavage Page 13Cancer Genet . Author manuscript; available in PMC 2015 May 23.Author Manuscript
Author Manuscript
Author Manuscript
Author Manuscript
Figure 3. Methods for indel detection. (A) In this example, a small insertion is identified by alignment-based calling methods. Such insertions are generally identified during initial read mapping and alignment and are evaluated by indel detection programs using different models to exclude false-positive results due to sequencing or read mapping errors. (B) A
medium-sized insertion is identified by split read mapping methods. In this example, an insertion (red) present in the sequenced DNA is detected by first identifying paired-end
reads in which one end maps and the other (containing the inserted sequence) does not. The inserted sequence is reconstructed from the overlapping, unmapped single-end reads. (C) An insertion detected by paired-end methods. In this example, the sequenced DNA contains an insertion and read pairs mapping to the flanking normal reference sequence show a shorter than expected distance between ends, allowing for an insertion to be inferred.
Abel and Duncavage Page 14
Cancer Genet . Author manuscript; available in PMC 2015 May 23.Author Manuscript
Author Manuscript
Author Manuscript
Author Manuscript
Author Manuscript Author Manuscript Author Manuscript Author Manuscript
Abel and Duncavage Page 15 T
a
b
l
e
1
S
o
f
t
w
a
r
e
t
o
o
l
s
f
o
r
e
v
a
l
u
a
t
i
o
n
o
f
s
t
r
u
c
t
u
r
a
l
v
a
r
i
a
t
i
o
n
i
n
N
G
S
d
a
t
a
C
o
m
m
e
n
t
D
o
w
n
l
o
a
d
l
i
n
k
T
r
a
n
s
l
o
c
a
t
i
o
n
s
a
n
d
I
n
v
e
r
s
i
o
n
s
D
i
s
c
o
r
d
a
n
t
p
a
i
r
e
d
e
n
d
B
r
e
a
k
D
a
n
c
e
r
F
a
s
t
,
s
i
m
p
l
e
t
o
r
u
n
h
t
t
p
:
/
/
b
r
e
a
k
d
a
n
c
e
r
.
s
o
u
r
c
e
f
o
r
g
e
.
n
e
t
H
y
d
r
a
C
o
n
s
i
d
e
r
s
m
u
l
t
i
p
l
e
m
a
p
p
i
n
g
s
o
f
d
i
s
c
o
r
d
a
n
t
p
a
i
r
s
h
t
t
p
s
:
/
/
c
o
d
e
.
g
o
o
g
l
e
.
c
o
m
/
p
/
h
y
d
r
a
-
s
v
/
V
a
r
i
a
t
i
o
n
H
u
n
t
e
r
C
o
n
s
i
d
e
r
s
m
u
l
t
i
p
l
e
m
a
p
p
i
n
g
s
o
f
d
i
s
c
o
r
d
a
n
t
p
a
i
r
s
h
t
t
p
:
/
/
v
a
r
i
a
t
i
o
n
h
u
n
t
e
r
.
s
o
u
r
c
e
f
o
r
g
e
.
n
e
t
/
H
o
m
e
P
E
M
e
r
S
i
m
u
l
a
t
e
s
s
t
r
u
c
t
u
r
a
l
v
a
r
i
a
n
t
s
h
t
t
p
:
/
/
s
v
.
g
e
r
s
t
e
i
n
l
a
b
.
o
r
g
/
p
e
m
e
r
/
i
n
t
r
o
d
u
c
t
i
o
n
.
h
t
m
l
G
A
S
V
P
r
o
I
m
p
r
o
v
e
d
s
p
e
c
i
f
i
c
i
t
y
b
y
c
o
m
b
i
n
i
n
g
i
n
f
o
f
r
o
m
d
i
s
c
o
r
d
a
n
t
p
a
i
r
s
a
n
d
c
o
v
e
r
a
g
e
d
e
p
t
h
h
t
t
p
:
/
/
c
o
m
p
b
i
o
.
c
s
.
b
r
o
w
n
.
e
d
u
/
s
o
f
t
w
a
r
e
.
h
t
m
l
S
p
l
i
t
e
n
d
r
e
a
d
m
e
t
h
o
d
s
C
R
E
S
T
R
e
q
u
i
r
e
s
s
o
f
t
-
c
l
i
p
p
e
d
r
e
a
d
s
g
e
n
e
r
a
t
e
d
d
u
r
i
n
g
a
l
i
g
n
m
e
n
t
h
t
t
p
:
/
/
w
w
w
.
s
t
j
u
d
e
r
e
s
e
a
r
c
h
.
o
r
g
/
s
i
t
e
/
l
a
b
/
z
h
a
n
g
S
l
o
p
e
R
e
p
l
a
c
e
d
b
y
C
l
u
s
t
e
r
F
A
S
T
h
t
t
p
s
:
/
/
g
i
t
h
u
b
.
c
o
m
/
e
d
u
n
c
a
v
a
g
e
/
c
l
u
s
t
e
r
f
a
s
t
C
N
V
R
a
w
c
o
v
e
r
a
g
e
b
a
s
e
d
E
W
T
W
h
o
l
e
g
e
n
o
m
e
o
n
l
y
,
d
o
e
s
n
o
t
r
e
q
u
i
r
e
n
o
r
m
a
l
c
o
n
t
r
o
l
h
t
t
p
:
/
/
r
d
x
p
l
o
r
e
r
.
s
o
u
r
c
e
f
o
r
g
e
.
n
e
t
C
o
v
e
r
a
g
e
r
a
t
i
o
b
a
s
e
d
S
e
q
S
e
q
W
h
o
l
e
g
e
n
o
m
e
o
n
l
y
;
r
e
q
u
i
r
e
s
n
o
r
m
a
l
c
o
n
t
r
o
l
h
t
t
p
:
/
/
w
w
w
.
b
r
o
a
d
i
n
s
t
i
t
u
t
e
.
o
r
g
/
s
o
f
t
w
a
r
e
/
c
p
r
g
/
?
q
=
n
o
d
e
/
3
9
C
N
V
n
a
t
o
r
W
h
o
l
e
g
e
n
o
m
e
o
n
l
y
;
r
e
q
u
i
r
e
s
n
o
r
m
a
l
c
o
n
t
r
o
l
h
t
t
p
:
/
/
s
v
.
g
e
r
s
t
e
i
n
l
a
b
.
o
r
g
C
N
A
s
e
g
W
h
o
l
e
g
e
n
o
m
e
o
n
l
y
;
r
e
q
u
i
r
e
s
n
o
r
m
a
l
c
o
n
t
r
o
l
h
t
t
p
:
/
/
w
w
w
.
c
o
m
p
b
i
o
.
g
r
o
u
p
.
c
a
m
.
a
c
.
u
k
/
s
o
f
t
w
a
r
e
/
c
n
a
s
e
g
C
N
V
-
s
e
q
W
h
o
l
e
g
e
n
o
m
e
o
n
l
y
;
r
e
q
u
i
r
e
s
n
o
r
m
a
l
c
o
n
t
r
o
l
h
t
t
p
:
/
/
t
i
g
e
r
.
d
b
s
.
n
u
s
.
e
d
u
.
s
g
/
c
n
v
-
s
e
q
/
C
O
N
T
R
A
E
x
o
m
e
o
r
t
a
r
g
e
t
d
p
a
n
e
l
s
;
r
e
q
u
i
r
e
s
n
o
r
m
a
l
c
o
n
t
r
o
l
s
h
t
t
p
:
/
/
s
o
u
r
c
e
f
o
r
g
e
.
n
e
t
/
p
r
o
j
e
c
t
s
/
c
o
n
t
r
a
-
c
n
v
/
C
o
N
V
E
X
E
x
o
m
e
;
r
e
q
u
i
r
e
s
n
o
r
m
a
l
c
o
n
t
r
o
l
s
f
t
p
:
/
/
f
t
p
.
s
a
n
g
e
r
.
a
c
.
u
k
/
p
u
b
/
u
s
e
r
s
/
p
v
1
/
C
o
N
V
e
x
/
D
o
c
s
/
C
o
N
V
e
x
.
p
d
f
E
x
o
m
e
C
N
V
E
x
o
m
e
o
r
t
a
r
g
e
t
e
d
p
a
n
e
l
s
;
r
e
q
u
i
r
e
s
n
o
r
m
a
l
c
o
n
t
r
o
l
s
;
e
v
a
l
u
a
t
e
s
B
-
a
l
l
e
l
e
f
r
e
q
u
e
n
c
y
h
t
t
p
s
:
/
/
s
e
c
u
r
e
.
g
e
n
o
m
e
.
u
c
l
a
.
e
d
u
/
i
n
d
e
x
.
p
h
p
/
E
x
o
m
e
C
N
V
_
U
s
e
r
_
G
u
i
d
e
I
n
s
e
r
t
i
o
n
s
a
n
d
D
e
l
e
t
i
o
n
s
P
i
n
d
e
l
U
s
e
s
p
a
t
t
e
r
n
-
g
r
o
w
t
h
a
l
g
o
r
i
t
h
m
t
o
f
i
n
d
m
e
d
i
u
m
a
n
d
l
a
r
g
e
i
n
d
e
l
s
h
t
t
p
:
/
/
g
m
t
.
g
e
n
o
m
e
.
w
u
s
t
l
.
e
d
u
/
p
i
n
d
e
l
/
c
u
r
r
e
n
t
/
G
A
T
K
F
u
l
l
p
a
c
k
a
g
e
f
o
r
S
N
V
a
n
d
i
n
d
e
l
d
e
t
e
c
t
i
o
n
h
t
t
p
:
/
/
w
w
w
.
b
r
o
a
d
i
n
s
t
i
t
u
t
e
.
o
r
g
/
g
a
t
k
/
d
o
w
n
l
o
a
d
V
a
r
S
c
a
n
2
D
e
t
e
c
t
s
S
N
V
s
a
n
d
i
n
d
e
l
s
h
t
t
p
:
/
/
v
a
r
s
c
a
n
.
s
o
u
r
c
e
f
o
r
g
e
.
n
e
t
D
i
n
d
e
l
A
p
p
l
i
e
s
p
r
o
b
a
b
i
l
i
t
y
-
b
a
s
e
d
f
i
l
t
e
r
i
n
g
t
o
r
e
d
u
c
e
f
a
l
s
e
p
o
s
i
t
i
v
e
s
h
t
t
p
s
:
/
/
s
i
t
e
s
.
g
o
o
g
l
e
.
c
o
m
/
s
i
t
e
/
k
e
e
s
a
l
b
e
r
s
/
s
o
f
t
/
d
i
n
d
e
l
S
t
a
m
p
y
L
i
m
i
t
s
f
a
l
s
e
-
p
o
s
i
t
i
v
e
i
n
d
e
l
c
a
l
l
s
h
t
t
p
s
:
/
/
w
i
k
i
.
g
a
c
r
c
.
u
g
a
.
e
d
u
/
w
i
k
i
/
S
T
A
M
P
Y
S
A
M
t
o
o
l
s
G
e
n
e
r
a
l
p
u
r
p
o
s
e
s
u
i
t
e
d
e
t
e
c
t
s
S
N
V
s
a
n
d
i
n
d
e
l
s
h
t
t
p
:
/
/
s
a
m
t
o
o
l
s
.
s
o
u
r
c
e
f
o
r
g
e
.
n
e
t
Cancer Genet. Author manuscript; available in PMC 2015 May 23.