Summing with SAS?
Tatiana Homonoff, MDRC, New York, NY
ABSTRACT
This paper reviews methods used to sum data, including horizontal summation (summing data across variables), vertical summation (summing data across observations), and cumulative summation (summing data across both observations and variables to create running totals). Techniques include the addition operator, the SUM function, PROC PRINT, PROC MEANS, PROC SQL, the RETAIN statement, FIRST./LAST. processing, and the SU M statement. Special attention is paid to how SAS? handles missing values in each technique.
INTRODUCTION
Summing data seems like a simple concept, but there are actually many complexities. Depending on the data set and the analysis question, one should use different methods. This paper presents four analysis questions involving summation and answers them using the most appropriate SAS technique.
SAMPLE DATA SET
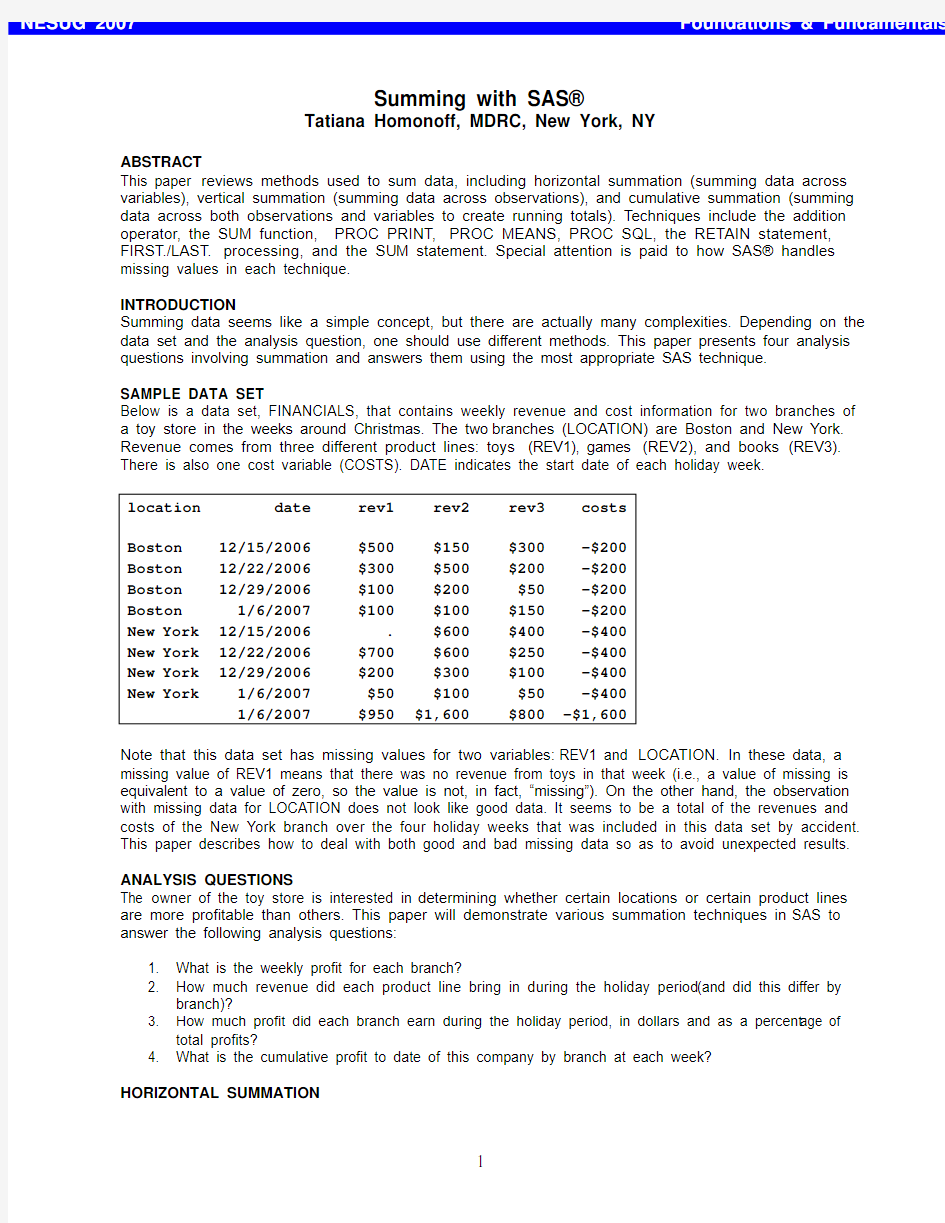
Below is a data set, FINANCIALS, that contains weekly revenue and cost information for two branches of a toy store in the weeks around Christmas. The two branches (LOCATION) are Boston and New York. Revenue comes from three different product lines: toys (REV1), games (REV2), and books (REV3). There is also one cost variable (COSTS). DATE indicates the start date of each holiday week.
location date rev1 rev2 rev3 costs
Boston 12/15/2006 $500 $150 $300 -$200
Boston 12/22/2006 $300 $500 $200 -$200
Boston 12/29/2006 $100 $200 $50 -$200
Boston 1/6/2007 $100 $100 $150 -$200
New York 12/15/2006 . $600 $400 -$400
New York 12/22/2006 $700 $600 $250 -$400
New York 12/29/2006 $200 $300 $100 -$400
New York 1/6/2007 $50 $100 $50 -$400
1/6/2007 $950 $1,600 $800 -$1,600
Note that this data set has missing values for two variables: REV1 and LOCATION. In these data, a missing value of REV1 means that there was no revenue from toys in that week (i.e., a value of missing is equivalent to a value of zero, so the value is not, in fact, “missing”). On the other hand, the observation with missing data for LOCATION does not look like good data. It seems to be a total of the revenues and costs of the New York branch over the four holiday weeks that was included in this data set by accident. This paper describes how to deal with both good and bad missing data so as to avoid unexpected results. ANALYSIS QUESTIONS
The owner of the toy store is interested in determining whether certain locations or certain product lines are more profitable than others. This paper will demonstrate various summation techniques in SAS to answer the following analysis questions:
1. What is the weekly profit for each branch?
2. How much revenue did each product line bring in during the holiday period (and did this differ by
branch)?
3. How much profit did each branch earn during the holiday period, in dollars and as a percent age of
total profits?
4. What is the cumulative profit to date of this company by branch at each week?
HORIZONTAL SUMMATION
Horizontal summation refers to adding values across variables within each observation (or row). Since each observation in our data set has revenue and cost information by week and branch, horizontal summation is used to answer the first question:
?What is the weekly profit for each branch?
The sum of revenue from the three product lines minus costs (which is actually plus in this data set since the “cost” variable stores negative numbers) by observation is the total weekly profit by branch for each branch and week.
THE ADDITION OPERATOR
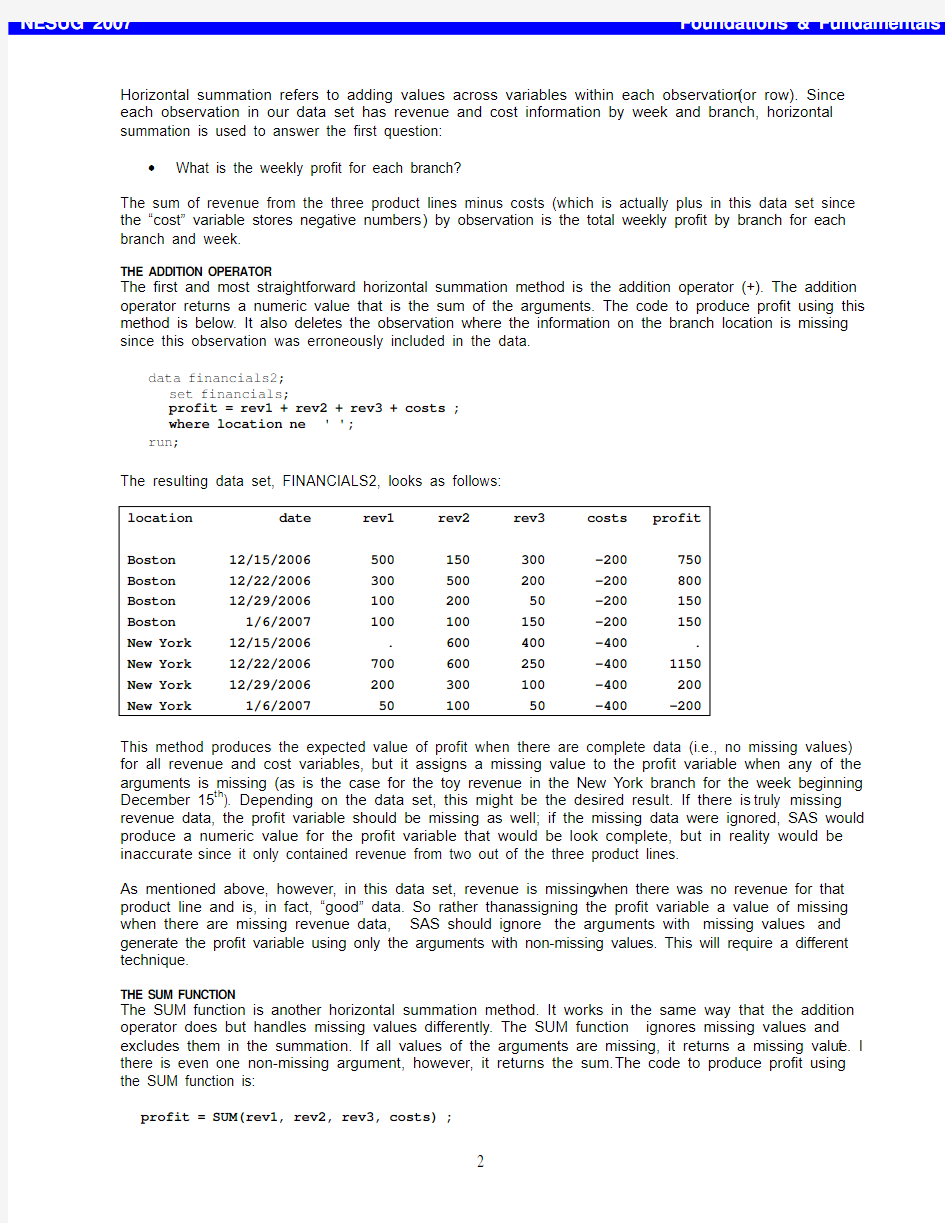
The first and most straightforward horizontal summation method is the addition operator (+). The addition operator returns a numeric value that is the sum of the arguments. The code to produce profit using this method is below. It also deletes the observation where the information on the branch location is missing since this observation was erroneously included in the data.
data financials2;
set financials;
profit = rev1 + rev2 + rev3 + costs ;
where location ne ' ';
run;
The resulting data set, FINANCIALS2, looks as follows:
location date rev1 rev2 rev3 costs profit
Boston 12/15/2006 500 150 300 -200 750
Boston 12/22/2006 300 500 200 -200 800
Boston 12/29/2006 100 200 50 -200 150
Boston 1/6/2007 100 100 150 -200 150
New York 12/15/2006 . 600 400 -400 .
New York 12/22/2006 700 600 250 -400 1150
New York 12/29/2006 200 300 100 -400 200
New York 1/6/2007 50 100 50 -400 -200
This method produces the expected value of profit when there are complete data (i.e., no missing values) for all revenue and cost variables, but it assigns a missing value to the profit variable when any of the arguments is missing (as is the case for the toy revenue in the New York branch for the week beginning December 15th). Depending on the data set, this might be the desired result. If there is truly missing revenue data, the profit variable should be missing as well; if the missing data were ignored, SAS would produce a numeric value for the profit variable that would be look complete, but in reality would be inaccurate since it only contained revenue from two out of the three product lines.
As mentioned above, however, in this data set, revenue is missing when there was no revenue for that product line and is, in fact, “good” data. So rather than assigning the profit variable a value of missing when there are missing revenue data, SAS should ignore the arguments with missing values and generate the profit variable using only the arguments with non-missing values. This will require a different technique.
THE SUM FUNCTION
The SUM function is another horizontal summation method. It works in the same way that the addition operator does but handles missing values differently. The SUM function ignores missing values and excludes them in the summation. If all values of the arguments are missing, it returns a missing value. I f there is even one non-missing argument, however, it returns the sum. The code to produce profit using the SUM function is:
profit = SUM(rev1, rev2, rev3, costs) ;
The resulting data set, FINANCIALS2, looks as follows:
location date rev1 rev2 rev3 costs profit
Boston 12/15/2006 500 150 300 -200 750
Boston 12/22/2006 300 500 200 -200 800
Boston 12/29/2006 100 200 50 -200 150
Boston 1/6/2007 100 100 150 -200 150
New York 12/15/2006 . 600 400 -400 600
New York 12/22/2006 700 600 250 -400 1150
New York 12/29/2006 200 300 100 -400 200
New York 1/6/2007 50 100 50 -400 -200
SAS ignored the argument with a missing values when calculating the profit variable, which is the desired result.
See the appendix for various shortcuts using the SUM function.
VERTICAL SUMMATION
Now that the first analysis question has successfully been answered, we turn to the second: ?How much revenue did each product line bring in during the holiday period (and did this differ by branch)?
While the first analysis question required summation of several variables within observations, the second analysis question requires summation of individual variables across observations. T his is what is called vertical summation.
THE PRINT PROCEDURE
The simplest method of vertical summation is the PRINT procedure. PROC PRINT does not allow for the creation of any new variables nor does it create a data set with summary variables. It does, however, print sums of existing variables that are specified in a SUM statement below the raw data. The WHERE statement excludes observations with missing branch data from being printed and being included in the summation. Missing values of the variables in the SUM statement are ignored; if all values are missing, the total is zero.
proc print data = financials;
sum rev1 rev2 rev3;
where location ne ' ';
run;
SAS prints the following output:
location date rev1 rev2 rev3 costs
Boston 12/15/2006 500 150 300 -200
Boston 12/22/2006 300 500 200 -200
Boston 12/29/2006 100 200 50 -200
Boston 1/6/2007 100 100 150 -200
New York 12/15/2006 . 600 400 -400
New York 12/22/2006 700 600 250 -400
New York 12/29/2006 200 300 100 -400
New York 1/6/2007 50 100 50 -400
==== ==== ====
1950 2550 1500
A BY statement can also be used with PROC PRINT to sum revenue by branch. Both the totals by branch and the grand total are printed. Note that the data must be sorted by the BY variable.
proc sort data=financials;
by location;
run;
proc print data = financials;
sum rev1 rev2 rev3;
where location ne ' ';
by location;
run;
SAS prints the following output:
location=Boston
date rev1 rev2 rev3 costs
12/15/2006 500 150 300 -200
12/22/2006 300 500 200 -200
12/29/2006 100 200 50 -200
1/6/2007 100 100 150 -200
---- ---- ----
1000 950 700
location=New York
date rev1 rev2 rev3 costs
12/15/2006 . 600 400 -400
12/22/2006 700 600 250 -400
12/29/2006 200 300 100 -400
1/6/2007 50 100 50 -400
---- ---- ----
950 1600 800
==== ==== ====
1950 2550 1500
THE MEANS PROCEDURE
The MEANS procedure is a data summarization tool used to calculate descriptive statistics for variables across all observations and within groups of observations. One of these statistics is SUM. This procedure is far more flexible than PROC PRINT, mainly because it can store results in an output data set that can be manipulated.
SUMMATION ACROSS ALL OBSERVATIONS
The first part of question two can be answered by using PROC MEANS to sum each of the three revenue variables across every observation in the data set. Note that without the inclusion of a WHERE statement, the summary variables would include the observation where the branch location was missing, thereby double-counting the revenue from New York.
proc means data=financials noprint;
var rev1 rev2 rev3;
output out=revsum (drop=_type_ _freq_)
sum(rev1-rev3)=revsum1-revsum3;
where location ne ' ';
run;
The resulting data set, REVSUM, looks as follows:
revsum1 revsum2 revsum3
1950 2550 1500
This data set contains the grand total of the revenue of each product line across all branches and weeks. Note that SAS ignores the missing revenue value in the first product line rather than generating a missing value for the total. While there is no option in PROC MEANS that assigns a missing value to the summary variable when there are missing values for the analysis variable, if the NMISS statistic is specified, SAS will create a variable that counts the number of missing v alues in the specified analysis variable. This variable can be inspected to determine whether the summary variable is excluding any observations due to missing data.
SUMMATION BY GROUP USING THE BY STATEMENT
The second part of the second analysis question requires vertical summation by branch rather than across all observations.
?How much revenue did each product line bring in during the holiday period (and did this differ by branch)?
This can be accomplished by adding a BY statement to the MEANS procedure. The input data set must be sorted by the BY group variable – in this case, LOCATION. Note that PROC MEANS considers a missing value to be a legitimate BY group value. Without the WHERE statement, all observations with a missing branch location would be summed together. T his can create unexpected results if there are many observations with missing branch location values.
proc sort data=financials;
by location;
run;
proc means data=financials noprint;
var rev1 rev2 rev3;
output out=revsum_bybranch (drop=_type_ _freq_)
sum(rev1-rev3)=revsum1-revsum3;
by location;
where location ne ' ';
run;
The resulting data set, REVSUM_BYBRANCH looks as follows:
location revsum1 revsum2 revsum3
Boston 1000 950 700
New York 950 1600 800
THE SQL PROCEDURE
The third analysis question is:
?How much profit did each branch earn during the holiday period, in dollars and as a percent of total profits?
This question highlights some of the key limitations of PROC PRINT and PROC MEANS. PROC PRINT prints summary statistics, but cannot store them in a SAS data set; therefore, they are not available for future calculations (e.g., creating branch profits as a percent of total profits). While PROC MEANS does allow summary statistics to be stored in an output data set, it only summarizes variables that already exist in the input data set. Since the PROFIT variable does not exist in the raw data set, it would have to be
created in a DATA step before summing vertically using PROC MEANS. A second DATA step is required to create branch profits as a percent of total profits.
NESTED SUM FUNCTIONS
The SQL procedure provides a way to do all of this in one step. In PROC SQL, when multiple columns are specified in an aggregate function (like the SUM function), the values in each row of the columns are calculated. If that SUM function is then nested in a second SUM function, SAS produces a grand total of the calculated variable across all observations. In other words, the inner SUM function is performing the horizontal summation while the outer SUM function is performing the vertical summation. This method can be used to calculate total profit over all weeks and branches. Note that SQL does not support variable lists in the SUM function. Observations with missing branch data should be removed with a WHERE clause.
proc sql;
create table financials_sum as
select
sum(sum(rev1,rev2,rev3,costs)) as branch_profit
from financials
where location ne ' ';
quit;
The resulting data set, FINANCIALS_SUM, looks as follows:
branch_profit
3600
THE GROUP BY STATEMENT
However, the third analysis question asks for the total profits by branch, not overall profits. PROC SQL can vertically sum profit by branch to create the variable BRANCH_PROFIT, dollar amount of profit by branch, using a GROUP BY statement. As with PROC MEANS, PROC SQL ignores missing values of the analysis variables in the SELECT statement, but it treats missing GROUP BY variables as valid data. Unlike PROC MEANS, PROC SQL does not require data to be sorted by the GROUP BY variable(s).
proc sql;
create table financials_sum as
select
location,
sum(sum(rev1,rev2,rev3,costs)) as branch_profit
from financials
where location ne ' '
group by location;
quit;
The resulting data set, FINANCIALS_SUM, looks as follows:
location branch_profit
Boston 1850
New York 1750
THE SELECT STATEMENT SUBQUERY
The previous step calculated profit by branch in dollars, but the analysis question also asks for profit by branch as a percent of total profits. The first step to do this is to add total profits to the data set created above. In PROC MEANS, this would require a second step; in PROC SQL, this can be done in the same step by using a subquery nested in parentheses.
A subquery is a query that is nested in another query. This subquery is executed first. Note that the variable TOTAL_PROFIT that is created in the subquery must also be referenced in the outer query in
order to be included in the created table. In order to exclude observations with missing branch information when calculating the BRANCH_PROFIT and TOTAL_PROFIT variables, there must be a WHERE clause in the subquery as well in the outer query.
proc sql;
create table financials_sum as
select
location,
sum(sum(rev1,rev2,rev3,costs)) as branch_profit,
total_profit
from financials,
(select
sum(sum(rev1,rev2,rev3,costs)) as total_profit
from financials
where location ne ' ')
where location ne ' '
group by location;
quit;
The resulting data set, FINANCIALS_SUM, looks as follows:
location branch_profit total_profit
Boston 1850 3600
New York 1750 3600
The final step to answering this analysis question is to create the variable BRANCH_PCT – the profits by branch as a percent of total profits. This, too, can be created in the same SQL procedure. Note that since BRANCH_PROFIT is calculated in the outer query, it must be preceded by the word “calculated,” but since TOTAL_PROFIT was calculated in the subquery, it is not. This is because the inner subquery result is added to all rows selected by the outer query.
proc sql;
create table financials_sum as
select
location,
sum(sum(rev1,rev2,rev3,costs)) as branch_profit,
total_profit,
calculated branch_profit/total_profit as branch_pct
format=percent8.2
from financials,
(select
sum(sum(rev1,rev2,rev3,costs)) as total_profit
from financials
where location ne ' ')
where location ne ' '
group by location;
quit;
The resulting data set, FINANCIALS_SUM, looks as follows:
location branch_profit total_profit branch_pct
Boston 1850 3600 51.39%
New York 1750 3600 48.61%
CUMULATIVE SUMMATION
The final analysis question is:
?What is the cumulative profit to date of this company by branch at each week?
The previous section showed that PROC SQL was far more versatile than the DATA step and PROC MEANS for answering the analysis questions. SQL, however, does not process rows (observations) in a particular order. There is no easy way to use PROC SQL to sum data cumulatively (i.e., to sum data across variables and observations to create running totals), as the final analysis question requires.
THE RETAIN STATEMENT AND THE SUM FUNCTION
The SUM function was introduced in the section on horizontal summation in order to sum revenue and costs across variables within an observation to create the profit variable. SAS, however, automatically sets variables that are created within an assignment statement (like the profit variable) to “missing” before each iteration of the DATA step.
The RETAIN statement can be used to prevent SAS from re-initializing the values of created variables before each iteration of the DATA step. In other words, the value calculated in the previous observation is carried down to the following observation. When the SUM function is combined with the RETAIN statement, the sum from the previous observation is carried down and added to the value in the current observation. This method can be used to calculate a running total of profits, CUMPROFIT, at each observation. In the following code, the variable CUMPROFIT is initialized to zero, summed with the PROFIT variable, then carried down to the following observation. If the zero were omitted from the RETAIN statement. CUMPROFIT would be initialized to “missing.”
data financials_cum;
set financials;
if location ne ' ';
profit=sum(rev1,rev2,rev3,costs);
retain cumprofit 0;
cumprofit=sum(cumprofit,profit);
run;
The resulting data set, FINANCIALS_CUM, looks as follows:
location date rev1 rev2 rev3 costs profit cumprofit
Boston 12/15/2006 500 150 300 -200 750 750
Boston 12/22/2006 300 500 200 -200 800 1550
Boston 12/29/2006 100 200 50 -200 150 1700
Boston 1/6/2007 100 100 150 -200 150 1850
New York 12/15/2006 . 600 400 -400 600 2450
New York 12/22/2006 700 600 250 -400 1150 3600
New York 12/29/2006 200 300 100 -400 200 3800
New York 1/6/2007 50 100 50 -400 -200 3600
FIRST./LAST. PROCESSING
The cumulative profit variable created above contains the correct cumulative profits for the Boston branch. T he RETAIN statement, however, carries over the final total profit for the Boston branch to the first observation of the New York branch. In order to obtain the correct cumulative profit for the New York branch, the CUMPROFIT variable must be reset to zero at the first observation of the New York branch. This can be done with FIRST./LAST. processing. The following code sets the cumulative profit variable to zero at the first occurrence of each value of LOCATION. Note that this statement must come before the SUM function in order for the cumulative profit to include the profits from the first week in each branch. Observations are sorted by branch and week. The FIRST./LAST. code would c ause errors if the data were not sorted by the BY variable LOCATION, but it does not require that the dates be in order. However, if the dates were out of order, the cumulative profit variable would be meaningless, or at least would not help answer the final analysis question. The next step adds a PROC SORT to ensure that the data are sorted correctly.
proc sort data=financials;
by location date;
run;
data financials_cum;
set financials;
by location;
if location ne ' ';
profit=sum(rev1,rev2,rev3,costs);
retain cumprofit;
if first.location then cumprofit=0;
cumprofit=sum(cumprofit,profit);
run;
The resulting data set, FINANCIALS_CUM, looks as follows:
location date rev1 rev2 rev3 costs profit cumprofit
Boston 12/15/2006 500 150 300 -200 750 750
Boston 12/22/2006 300 500 200 -200 800 1550
Boston 12/29/2006 100 200 50 -200 150 1700
Boston 1/6/2007 100 100 150 -200 150 1850
New York 12/15/2006 . 600 400 -400 600 600
New York 12/22/2006 700 600 250 -400 1150 1750
New York 12/29/2006 200 300 100 -400 200 1950
New York 1/6/2007 50 100 50 -400 -200 1750
THE SUM STATEMENT
The SUM statement creates the same results as combining the SUM function with the RETAIN statement, but is slightly more efficient. The SUM statement initializes the variable on the left of the plus sign (+) to zero, retains the variable, and adds the value of the expression on the right of the plus sign to the variable. It ignores missing values and treats an expression that produces a missing value as zero. The following code creates the same output as shown above.
proc sort data=financials;
by location date;
run;
data financials_cum;
set financials;
by location;
if location ne ' ';
profit=sum(rev1,rev2,rev3,costs);
if first.location then cumprofit=0;
cumprofit+profit;
run;
CONCLUSION
While there are many methods to sum data in SAS, some may be more appropriate or save more time than others. It is important to think critically about the analysis question before deciding which type of summation (horizontal, vertical, or cumulative) is needed to answer it and which SAS technique is best. It is also important to be aware of missing values in the data and to understand how SAS handles them in each technique.
CONTACT INFORMATION
Tatiana Homonoff
Research Analyst
MDRC
16 East 34th Street, 19th Floor
New York, NY 10016
Phone: (212) 340-8629
Fax: (212) 684-0832
Tatiana.Homonoff@https://www.doczj.com/doc/f29904788.html,
https://www.doczj.com/doc/f29904788.html,
SAS and all other SAS Institute Inc. product or service names are registered trademarks or trademarks of SAS Institute Inc. in the USA and other countries. ? indicates USA registration. Other brand and product names are trademarks of their respective companies.
APPENDIX
While there are only three types of revenue in this data set, suppose there were 50. Creating the profit variable would appear to require a lot of typing, but SAS has a few shortcuts.
NUMERIC VARIABLE LISTS
The three revenue variables all have the same naming convention, “Rev”
profit = SUM(rev1-rev3, costs) ;
The resulting data set, FINANCIALS2, looks as follows:
location date rev1 rev2 rev3 costs profit
Boston 12/15/2006 500 150 300 -200 0
Boston 12/22/2006 300 500 200 -200 -100
Boston 12/29/2006 100 200 50 -200 -150
Boston 1/6/2007 100 100 150 -200 -250
New York 12/15/2006 . 600 400 -400 -400
New York 12/22/2006 700 600 250 -400 50
New York 12/29/2006 200 300 100 -400 -300
New York 1/6/2007 50 100 50 -400 -400
Rather than reading “REV1- REV3” as a numeric list, SAS interprets it as subtraction of REV3 from
REV1. This is not the desired result. If the numeric list is preceded with OF, however, SAS produces the desired result.
profit = SUM(OF rev1-rev3, costs) ;
Note that if there were more than one variable list in the set of arguments, each list would need to be preceded with its own OF.
PREFIX LISTS
A prefix list can be used to shorten the code even further. Specify the variable prefix followed by a semicolon (e.g., REV:). All variables that start with a prefix can be referenced by prefix:. Used without an OF, SAS generates an error. With an OF, SAS produces the desired result.
profit = SUM(OF rev: , costs) ;
POSITIONAL VARIABLE LISTS
In this data set, the three revenue variables have the same naming convention, which allowed the use of the numeric and prefix lists. If that were not the case, but the summation argument variables were still adjacent to one another in the data set, a positional list could be used. Specify the first variable to use, two dashes, and the last variable to use (e.g. REV1--COSTS).
Again, without the use of an OF, SAS produces unexpected results: it treats the double dash as double subtraction, i.e. addition, of REV1 and COSTS, rather than a positional list. SAS evaluates the expression in parentheses first. Since it assumes that the positional list is actually an arithmetic operator, the result of the inner expression is a single argument. If either of the variables in the inner expression is missing, the result of the inner expression is missing. Therefore, since the only argument to the SUM function is missing, the result of the whole expression is missing.
profit = SUM(rev1--costs) ;
The resulting data set, FINANCIALS2, looks as follows:
location date rev1 rev2 rev3 costs profit
Boston 12/15/2006 500 150 300 -200 300
Boston 12/22/2006 300 500 200 -200 100
Boston 12/29/2006 100 200 50 -200 -100
Boston 1/6/2007 100 100 150 -200 -100
New York 12/15/2006 . 600 400 -400 .
New York 12/22/2006 700 600 250 -400 300
New York 12/29/2006 200 300 100 -400 -200
New York 1/6/2007 50 100 50 -400 -350
Use OF to produce the desired results.
profit = SUM(OF rev1--costs) ;
WHERE CAN THESE TECHNIQUES BE USED?
The examples above use the addition operator and the SUM function in assignment statements to create variables in a DATA step. They can also be used to subset data in an IF or WHERE statement in a DATA step or in a WHERE statement in a PROC step. However, while the IF statement supports the variable lists shortcuts described above, the WHERE statement does not.
S A S中的S Q L语句完全教程之一:S Q L简介与基本查询功能本系列全部内容主要以《SQLProcessingwiththeSASSystem(CourseNotes)》为主进行讲解,本书是在网上下载下来的,但忘了是在哪个网上下的,故不能提供下载链接了,需要的话可以发邮件向我索取,我定期邮给大家,最后声明一下所有资料仅用于学习,不得用于商业目的,否则后果自负。 1SQL过程步介绍 过程步可以实现下列功能: 查询SAS数据集、从SAS数据集中生成报表、以不同方式实现数据集合并、创建或删除SAS数据集、视图、索引等、更新已存在的数据集、使得SAS系统可以使用SQL 语句、可以和SAS的数据步进行替换使用。注意,SQL过程步并不是用来代替SAS数据步,也不是一个客户化的报表工具,而是数据处理用到的查询工具。 过程步的特征 SQL过程步并不需要对每一个查询进行重复、每条语句都是单独处理、不需要print 过程步就能打印出查询结果、也不用sort过程步进行排序、不需要run、要quit来结束SQL过程步 过程步语句 SELECT:查询数据表中的数据 ALTER:增加、删除或修改数据表的列 CREATE:创建一个数据表 DELETE:删除数据表中的列 DESCRIBE:列出数据表的属性 DROP:删除数据表、视图或索引
RESET:没用过,不知道什么意思 SELECT:选择列进行打印 UPDATE:对已存在的数据集的列的值进行修改 2SQL基本查询功能 语句基本语法介绍 SELECT
SAS中的SQL语句完全教程之一:SQL简介与基本查询功能 本系列全部内容主要以《SQL Processing with the SAS System (Course Notes)》为主进行讲解,本书是在网上下载下来的,但忘了是在哪个网上下的,故不能提供下载链接了,需要的话可以发邮件向我索取,我定期邮给大家,最后声明一下所有资料仅用于学习,不得用于商业目的,否则后果自负。 1 SQL过程步介绍 SQL过程步可以实现下列功能: 查询SAS数据集、从SAS数据集中生成报表、以不同方式实现数据集合并、创建或删除SAS数据集、视图、索引等、更新已存在的数据集、使得SAS系统可以使用SQL语句、可以和SAS的数据步进行替换使用。注意,SQL过程步并不是用来代替SAS数据步,也不是一个客户化的报表工具,而是数据处理用到的查询工具。 SQL过程步的特征 SQL过程步并不需要对每一个查询进行重复、每条语句都是单独处理、不需要print过程步就能打印出查询结果、也不用sort过程步进行排序、不需要run、要quit来结束SQL 过程步 SQL过程步语句 SELECT:查询数据表中的数据 ALTER:增加、删除或修改数据表的列 CREATE:创建一个数据表 DELETE:删除数据表中的列 DESCRIBE:列出数据表的属性 DROP:删除数据表、视图或索引 INSERT:对数据表插入数据 RESET:没用过,不知道什么意思 SELECT:选择列进行打印 UPDATE:对已存在的数据集的列的值进行修改 2 SQL基本查询功能 SELECT语句基本语法介绍 SELECT
SAS软件知识要点总结 李明 注意:数据集要有名字,变量要有名字,所以 SAS 中对名字(数据集名、变量名、数据库名,等等)有约定:SAS 名字由英文字母、数字、下划线组成,第一个字符必须是字母或下划线,名字最多用8 个字符,大写字母和小写字母不区分。比如,name,abc,aBC,x1,year12,_NULL_等是合法的名字,且abc 和aBC 是同一个名字,而class-1(不能有减号)、a bit(不能有空格)、serial#(不能有特殊字符)、Documents(超长)等不是合法的名字。 二、MODEL 语句 MODEL 语句在一些统计建模过程中用来指定模型的形式。其一般形式为 MODEL 因变量=自变量表 / 选项; 比如 model math=chinese; 即用语文成绩预测数学成绩。 注意:MODEL就是指出谁是因变量,谁是自变量; 三、BY 语句和CLASS 语句 BY语句在过程中一般用来指定一个或几个分组变量,根据这些分组变量值把观测分组,然后对每一组观测分别进行本过程指定的分析。在使用带有BY 语句的过程步之前一般先用 SORT 过程对数据集排序 注意:BY语句就是按某给定指标分类(组) 在一些过程(如方差分析)中,使用CLASS 语句指定一个或几个分类变量,它实际相当于因变量。而在另一些过程(如MEANS)中,CLASS 语句作用与BY 语句类似,可以指 定分类变量,把观测按分类变量分类后分别进行分析。使用CLASS 时不需要先按分类变量 排序。
注意:CLASS语句的作用有两个:1.指定(分类变量),本身就是因变量; 2.与BY类似,指定分类变量并分类; 四、OUTPUT 语句 在过程步中经常用 OUTPUT 语句指定输出结果存放的数据集。不同过程中把输出结果存入数据集的方法各有不同,OUTPUT 语句是用得最多的一种,其一般格式为: OUTPUT OUT=输出数据集名关键字=变量名关键字=变量名?; 其中用OUT=给出了要生成的结果数据集的名字,用“关键字=变量名”的方式指定了输 五、FREQ 语句和WEIGHT 语句 FREQ 语句指定一个重复数变量,每个观测中此变量的值说明这个观测实际代表多少个完全相同的重复观测。FREQ 变量只取整数值。如 freq numcell; WEIGHT 语句指定一个权重变量,在某些允许加权的过程中代表权重,其值与观测对应的方差的倒数成比例。 注意:FREQ是计量频数的;WEIGHT则是计量权重的; 七、WHERE语句(就是条件句) 用WHERE 语句可以选择输入数据集的一个行子集来进行分析,在WHERE 关键字后指定一个条件。比如: where math>=60 and chinese>=60; 指定只分析数学、语文成绩都及格的学生。
常用SAS命令 1. SAS的子窗口主要有浏览器窗口(EXPLORER)、结果窗口(RESULTS)、程序编辑器窗口(program editor)、日志窗口(log)、输出窗口(output); 2.切换至日志窗口的命令是log、热键是F6;切换至输出窗口的命令是output、热键是F7; 3.提交SAS程序的命令是submit; 4. SAS系统是大型集成软件系统,具备完备的数据访问、管理、分析和呈现及应用开发功能; 5. SAS数据集是一类由SAS系统建立、维护和管理的数据文件; 6.为了实现存储和管理面向对象的开发任务,SAS建立目录册(catalog)类型的文件,在这一类文件中可以存储整个应用系统,包括它的界面,源程序和各种对象间的连接; 7. SAS逻辑库是一个逻辑概念,一个逻辑库就是存放在同一文件夹或
几个文件夹中的一组SAS文件; 8.在SAS软件系统的信息组织中,总共只有两个层次:SAS逻辑库是高一级的层次,低一级的层次就是SAS文件本身; 9.在SAS系统中,为便于访问一个SAS文件,要为该SAS文件所在的位置指定一个SAS逻辑库,即赋予一个逻辑库名,在指定逻辑库名后,就可使用两级命名的方式引用SAS文件:逻辑库名.文件名; 10.在每个SAS进程一开始,系统就自动地指定了一些逻辑库供用户使用,它们是WORK、SASHELP和SASUSER; 11.在每个SAS进程开始时系统缺省地创建名为work的SAS逻辑库,它是一个临时逻辑库,在引用WORK库中的SAS文件时,可省略逻辑库名; 12.永久逻辑库是指它的内容在当前SAS进程结束时仍被保留的SAS 逻辑库,在SAS系统中除了库名为WORK以外的逻辑库都是永久库; 13. Sashelp包含所安装SAS系统各个产品有关的SAS文件,运行安装的SAS系统所需要的SAS文件缺省地存储在这个逻辑库中;
Engine(引擎)是一种访问架构,SAS系统通过它迅速地对其它数据库管理系统中文件进行读入和写出。 1.LIBNAME语句 1.1解读 定义SAS 逻辑库。具体地说,它可以 (1)向SAS 标识SAS 逻辑库 (2)将引擎与逻辑库关联 (3)让您指定逻辑库的选项 (4)为逻辑库指定逻辑库引用名 通俗得讲,LIBNAME语句把一个libref(库标记名)和一个目录联系起来,使用户可以在SAS语句中使用库标记来指示这个目录。提交该程序时自动引用该SAS 逻辑库 1.2 语句格式 1、LIBNAME libref
选项说明 2.length语句 SAS变量的基本类型有两种:数值型和字符型。数值型变量在数据集中的存贮一般使用8个字节。SAS的字符型变量缺省的长度是8个英文字符,可以使用LENGTH语句指定变量长度,LENGTH语句一般应出现在定义变量的Input语句之前,格式为:LENGTH 字符型变量名$长度 例如:length name $20 ; 3. input 语句 3.1解读 INPUT语句用于向系统表明如何读入每一条记录。它的主要功能有:读入由语句指定的数据列;为相应
的数据域定义变量名;确定变量的读入模式(共有四种模式:column模式,formatted模式,list模式及named模式)。 input语句执行后,SAS将读取的数据暂时先保存在内存缓冲区,然后执行后面的语句,后面的语句可以对暂存在内存缓冲区中的变量值进行修改,到最后才将整条数据写入数据集,写入数据集的数据就不能在当前data步中再修改。 注意:INFILE语句用于确定一个包含原始数据的外部文件,必须在执行INPUT语句前执行,如果要在程序中直接嵌入数据,就用CARDS语句代替INFILE 语句。 3.2 语句格式(Column模式) INPUT variable <$> start-column<-end-column><.decimals><@|@@>; 说明: variable 变量名 $ 跟在变量后面,表明这个变量是字符型变量 start-column 起始列号 end-column 结束列号,如果变量值只包含一列,则可省略 .decimals 如果输入值中没有包含一个隔开整数部分
蔡泽蕲 Freq 过程: Proc Freq data=dataset; table x*y/option; By var1; Class var2; Weight f; Run; 输出x*y的频数表,by语句的使用要求var1已经排过序. option可为chisp,分析x、y(两独立样本)的不同水平的差异是否显著,卡方检验。当x、y为两配对样本时,option为agree,进行配对样本差异是否显著的检验。 Sort 过程: Proc sort data=dataset out=dataset; By (descending) var1 (descending) var2; Run; 对数据集中的var1、var2变量依次排序,默认从小到大,descending为从大到小。缺失out 时新数据集覆盖原数据集。 Means 过程 Proc means data=dataset option; Var x; By var1; Class var2; Freq var3; /*不能用weight*/ Output out=输出数据集统计量名=自定义名; Run; 输出option统计量,当包含t和prt 时输出x的期望为0的t检验,用于配对样本的t检验。无option时,默认输出N、std、mean、min、max五个统计量。还可输出其它很多统计计量。特别的两个选项:maxdec=n ,alpha=value分别指定结果保留位数和置信度 Univariate 过程 Proc univariate data=dataset option; Var x; By var1; Freq var2; Output out=输出数据集统计量=自定义变量名; Run; Option 可为freq(生成频数表)、normal(检验变量是否服从正态分布)、plot(生成茎叶图、箱线图、正太概率图)、cibasic(计算均值置信区间)、cipctldf(计算中位数置信区间)。 统计量可为:各检验统计量及分位数。 当option为“mu0=scalar”时,计算x的期望(中位数)为scalar的t检验和符号秩和检验。符号秩和检验适用于非正太样本,而t检验则用于正太样本。配对样本计算配对差,独立样本使用class。Cibasic基于正太分布,cipctldf基于非正态分布。
; 循环体 ;end ; SAS 特有的循环语句) =值1,值2,…, end ; 表达式); 循环体 ; 至少执行一次循环表达式); 循环体 在LOG 窗口显示n=0,n=1 ; (n<3); PUT n=; n+1; 循环体 END ; ; (n>=3); PUT n=; ; 循环体 END ; 语句 ; DELETE () , ; 40者的信息 将当前观测送入数据集自动方式和OUTPUT 在数据步程序中不出那么,(一般是RUN 语句)2.利用OUTPUT OUTPUT 语"失效, 通过执行 PROC VAR 变量表; VAR 语句时, 系统依据BY ; BY x ; CLASS 变量表; CLASS 变量1="字符串1" 变量变量n="字符串n" i i 变量; (列)变量; ; 下列程序可以将SAS 数据集又转换dBASE 的库文件: ; ; ; (PLOT) ; ; ; ; ; PROC GPLOT ; PLOT y*x ; RUN ; 过程的格式 选项1; 图形说明1 图形说明2 /选项2; ; 1: 数据集名 指定绘图数据集。 语句后可以有一个或多个图形 为纵轴,x 为横轴,图形用默 "A"形成。 2有: :将PLOT 后的多个图形说明 ;这里的m 和n 是正 m 为指定的每页行数,n 为每行 和n 。 过程格式 选项; 语句;] ; 数据集名 指定被转置的数据 名 数据集被转置后,原 ?本选项中的“SAS”名就是为新变 SAS 名”后接自然数来 数据集名 给定转置后的新数 DATAn 。 名 SAS 名将作为转置后的 其值为原数 _NAME_的变量。 关键字(Keywords 或 Reserve )是系, 如例中PUT 、、FORMAT 、PROC 、 INFILE 和DO 都是SAS 语句除了赋值、累加、注释、 名(SAS Name ) 后跟字母、数字或下 SAS 名中出现。 名可能是变量(32个字符),数据集32个字符),输出格式(C :31 N :),过程(16),数组(32),逻辑库8)和文件逻辑(8)等的名字标识符。 语句是以SAS 关键字开头,由SAS 名、特 一个语句可以写一行或多行,但要以 多条语句可以写在一行, SAS 语句对英文字符不区分大小写。 便于程序阅 格式: 变量=表达式; 而后 格式: 变量+表达式 ;语句的功能是先计算 再将变量的当前值和表达而后将二者之和赋给变量。当为新引入的变量时,语句x=x+1 不能代x+1,因为前者的x 初始值是缺项值0。
第一章SAS系统概况 SAS(Statistic Analysis System)系统是世界领先的信息系统,它由最初的用于统计分析经不断发展和完善而成为大型集成应用软件系统;具有完备的数据存取、管理、分析和显示功能。在数据处理和统计分析领域,SAS系统被誉为国际上的标准软件系统。 SAS系统是一个模块化的集成软件系统。SAS系统提供的二十多个模块(产品)可完成各方面的实际问题,功能非常齐全,用户根据需要可灵活的选择使用。 ●Base SAS Base SAS软件是SAS系统的核心。主要功能是数据管理和数据加工处理,并有报表生成和描述统计的功能。Base SAS软件可以单独使用,也可以同其他软件产品一起组成一个用户化的SAS系统。 ●SAS/AF 这是一个应用开发工具。利用SAS/AF的屏幕设计能力及SCL语言的处理能力可快速开发各种功能强大的应用系统。SAS/AF采用先进的OOP(面向对象编程)的技术,是用户可方便快速的实现各类具有图形用户界面(GUI)的应用系统。 ●SAS/EIS 该软件是SAS系统种采用OOP(面向对象编程)技术的又一个开发工具。该产品也称为行政信息系统或每个人的信息系统。利用该软件可以创建多维数据库(MDDB),并能生成多维报表和图形。 ●SAS/INTRNET ●SAS/ACCESS 该软件是对目前许多流行数据库的接口组成的接口集,它提供的与外部数据库的接口是透明和动态的。 第二章Base SAS软件 第一节SAS编程基础 SAS语言的编程规则与其它过程语言基本相同。 SAS语句 一个SAS语句是有SAS关键词、SAS名字、特殊字符和运算符组成的字符串,并以分号(;)结尾。 注释语句的形式为:/*注释内容*/ 或*注释内容。 二、SAS程序 一序列SAS语句组成一个SAS程序。SAS程序中的语句可分为两类步骤:DA TA步和
第十六课用在PROC步中的通用语句 当我们用DATA步创建好SAS数据集后,可以用SAS的一些PROC过程步来进一步的分析和处理它们。在DATA步中用户可以使用SAS的语句来编写自己的程序,以便能通过读入、处理和描述数据,创建符合自己特殊要求的SAS数据集。而后由一组组PROC步组成的程序进行后续分析和处理。 一、PROC程序的主要作用 ●读出已创建好的SAS数据集 ●用数据集中的数据计算统计量 ●将统计的结果按一定形式输出 在SAS系统中,计算统计量时,对于许多常用的和标准的统计计算方法,并不需要用户自己编写这些复杂的程序,而是通过过程的名字来调用一个已经为用户编写好的程序。用户通常只要编写调用统计过程前的准备处理程序和输出统计结果后的分析和管理程序。只有用户自己非常特殊的统计计算方法才需要用户自己编写相应的计算程序。 二、PROC过程语句 PROC语句用在PROC步的开始,并通过过程名来规定我们所要使用的SAS过程,对于更进一步的分析,用户还可以在PROC语句中使用一些任选项,或者附加其他语句及它们的任选项(如BY语句)来对PROC步规定用户所需要分析的更多细节。PROC语句的格式为: PROC 过程名<选项>; 过程名规定用户想使用的SAS过程的名字。例如,我们在前面常使用的打印过程名PRINT,对数值变量计算简单描述统计量的过程名MEANS。 选项规定这个过程的一个或几个选项。不同的过程规定的选项是不同的,因此,只有知道具体的过程才能确定具体的选项是什么。但是,在各个不同过程中使用选项时,下面三种选项的使用格式是共同的: ●Keyword ●Keyword=数值 ●Keyword=数据集 Keyword是关键字,第一种选项格式是某个具体过程进一步要求某个关键字;第二种选项格式是某个具体过程要求某个关键字的值,值可能是数值或字符串;第三种选项格式是某个具体过程要求输入或输出数据集。例如: PROC Print Data=class ; 过程Print,作用为打印输出数据集中的数据。选项为Data=class,关键字是Data,进一
引言 1. 字符函数 2. 日期和时间函数 3. 数组函数 4. 数学函数 5. 样本描述统计函数 6. 特殊函数 7. 随机数函数 8. 宏函数 9. 变量信息函数 10. 分布密度函数、分布函数 11. 分位数函数
一、字符函数 1. TRIM(s):返回去掉字符串s的尾随空格的结果。 2. UPCASE(s):把字符串s中所有小写字母转换为大写字母后的结果。 3. LOWCASE(s):把字符串s中所有大写字母转换为小写字母后的结果。 4. INDEX(s,s1):查找s1在s中出现的位置。找不到时返回0。 5. RANK(s):字符s的ASCII码值。 6. BYTE(n):第n个ASCII码值的对应字符。 7. REPEAT(s,n):字符表达式s重复n次。 8. SUBSTR(s,p,n):从字符串s中的第p个字符开始抽取n个字符长的子串 9. TRANWRD(s,s1,s2):从字符串s中把所有字符串s1替换成字符串s2后的结果。 10. PROPCASE(s):把字符串s的第一个字母大写。 11. CATX(d,s1,s2):把字符串s1和字符串s2通过d(如'-')连接返回结果。 12. COMPBL(s):把字符串s中的不同长度空格变为长度为1的空格返回结果。 13. COMPRESS(s,c,m):将字符串c(默认为空格)从字符串中移除,m为对d的添加项如下: d增加数字到初始字符里(chars)。 f增加下划线和字母(A-Z,a-z)到初始字符里(chars)。 g增加图形字符到初始字符里(chars)。 k不移除初始字符(chars)而是返回这些字符。 l增加小写字母(a-z)。 n增加数字、下划线和字母(A-Z,a-z)。 p增加标点符号。 s增加空格,包括空格,水平制表符,垂直制表符,回车符,换行符和换页符 u增加大写字母(A-Z)。 a增加(A-Z,a-z)到初始字符里(chars)。 14. ANYALNUM(s,start):查找字符串s中从start位置开始第一个数字或字母的位置。 15. ANYALPHA(s,start):查找字符串s中从start位置开始第一个字母的位置。 16. ANYDIGIT(s,start):查找字符串s中从start位置开始第一个数字的位置。 17. ANYPUNCT(s,start):查找字符串s中从start位置开始第一个特殊标点字符的位置。 18. ANYSPACE(s,start):查找字符串s中从start位置开始第一个空格的位置。 19. ANYUPPER(s,start):查找字符串s中从start位置开始第一个大写字母的位置。 20. NOTALNUM(s,start):查找字符串s中从start位置开始第一个非数字和字母的位置。 21. NOTALPHA(s,start):查找字符串s中从start位置开始第一个非字母的位置。 22. NOTUPPER(s,start):查找字符串s中从start位置开始第一个非大写字母的位置。 23. FIND(s,c,m,start):查找字符串s中从start开始字符串c第一次出现的位置,m为i时忽略大小写。 24. FINDC(s,c,m,start):查找字符串s中从start开始字符串c中任何一个字符第一次出现得的位置,m为对d的添加项如下: i忽略大小写 t忽略字符串两边首尾的空格 k查找除c中的任何字符 a增加大写和小写字母(a-z)(A-Z) d增加数字 25. FINDW(s,w,m,start):查找字符串s中以w为分隔符(默认为空格)从start位置开始第一个出现字符串整体w的位置。 26. INDEXC(s,s1,s2,sn):查找多个字符串s1,s2,s3在s中出现的位置。找不到时返回0。 27. VERIFY(s,s1):查找字符串s中第一个非字符串s1中任何字符的位置,找不到时返回0。 28. CALL CATS(s,s1,s2,sn):把字符串S1-Sn去除首尾空格连接后赋值给变量s。 29. CALL CATX(d,s,s1,s2,sn):把字符串S1-Sn去除首尾空格通过d连接后赋值给变量s 30. LEFT(s):去除字符串s的左边空格。
07. IF和WHERE语句 (一)IF-THEN语句 一、基础语法 做选择时需要用到条件语句:若满足……条件,则执行…… 语法: if 条件then 执行语句; 若有多个执行语句,则用 if 条件then DO; 执行语句1; 执行语句2; END; 多选择分支,则用 if 条件then 执行语句; else if 条件then 执行语句; else 执行语句; SAS中常用的比较、逻辑算符(也见系列02):
二、数据步中使用IF-THEN语句赋值 数据步中经常需要有选择地赋值新变量或修改原数值。 例1稀有古董汽车拍卖的数据文件(C:\MyRawData\Auction.dat)包含了品牌、型号、制造年份、座位数、价格(百万美元): 使用IF-THEN语句填满缺失值,并创建一个新变量Veteran. 代码: data oldcars; infile'c:\MyRawData\Auction.dat'; input Make $ 1-13 Model $ 15-29 YearMade Seats MillionsPaid; if YearMade < 1890then Veteran = 'Yes'; if Model = 'F-88'then DO; Make = 'Oldsmobile'; Seats = 2; end;
run; proc print data = oldcars; title'Cars Sold at Auction'; run; 运行结果: 二、数据步中使用IF-THEN语句创建子数据集(也见系列03) 1.数据步读入数据时,用IF-THEN语句选择满足条件的数据读入。 语法: if 条件; 如果“条件”为真,则数据步将继续执行。还可以使用DELETE 语句,来删除哪些不要的数据:下面这两句话是等价的: if Sex='f'; if Sex='m' then DELETE; 例2莎士比亚歌剧的清单(C:\MyRawData\Shakespeare.dat),包含歌剧名、首次表演年份、类型:
一、DATA语句 DATA语句的作用是表明数据步的开始并给出数据集 的名称。 DATA语句的格式为: DATA 数据集的名称; 数据集的名称必须以英文字母开始,最长不超过8个字符。 二、CARDS语句 CARDS语句的作用是与“;”呼应,标志数据行的开始与结束。 CARDS语句的格式为: CARDS; 数据行 ; 如果使用CARS语句,在CARDS的后面必须紧跟数据行,并且在一个数据步中最多只能使用一个CARDS语句。 三、INPUT 语句 INPUT语句的作用是描述输入记录中的数据,并把输入值赋给相应的变量。INPUT语句的格式为: INPUT 数据的变量名、顺序及类型; 用INPUT语句是为了读取外部文件的数据或跟在CARDS语句后面的数据。 SAS默认用INPUT语句读取的是数值类型变量的值。若在变量后加’$’,则该变量为字符串类型变量。 为从一行读入多个观测值,应使用行保持符’@@’限制度数指针,使其保持在这一行上读数,知道数据读完为止。 例如: Input x y@@; Cards; 2 3 4 5 6 7 8 ; 四、INFILE语句 Infile语句的作用是指明外部数据文件的名称,并从这个外部数据文件中读取数据。 INFILE语句的格式为: INFILE ‘外部数据文件名’; 例如,在D盘上有一个名称为xiao.txt的数据文件, 其中数据排列为: A 3.16 B 2.9 B 5.8 B 3 A 4.9 A 4.17 用INFILE语句读取数据的代码为: Data ex; Infile ‘D:xiao.txt’; Input z$ x@@; Proc print;
第一章 SAS编程操作预备知识 一、SAS系统简介 SAS是一个庞大的系统,它目前的版本可以在多种操作系统中运行。当前在国内被广泛使用的最新版本是8.2版,功能很强大,我深有体会。 据说9.0版已在国外面世,已经有一些有关它的抢先报道在网络上广为流传,说它如何如何美妙,令人不禁充满期待。 SAS8.2的完整版本包含以下数十个模块。 BASE,GRAPH,ETS,FSP,AF,OR,IML,SHARE,QC,STAT,INSIGHT,ANALYST,ASSIST, CONNECT,CPE,LAB,EIS,WAREHOUSE,PC File Formats,GIS,SPECTRAVIEW,SHARE*NET, R/3,OnlineTutor: SAS Programming,MDDB Server,IT Service Vision Client, IntrNet Compute Services,Enterprise Reporter,MDDB Server common products,Enterprise Miner,AppDev Studio,Integration Technologies 等。 所谓模块,我的理解是将功能相近的程序、代码等集中起来组成相对独立的部分,就称之为模块,类似于办公软件系统office中包含的word、excel、access 等。各模块具有相对独立的功能范围,我们常用的模块有base,graph,stat,insight,assist,analyst模块等,分别执行基本数据处理、绘图、统计分析、数据探索、可视化数据处理等功能。其余模块我用得很少,知道得也很少,所以也就不多说了。 SAS系统的长处,体现于它的编程操作功能的无比强大。SAS一直以来也是注重于其编程语言的发展,对于可视化方式的菜单操作投入较少,其较早的版本仅有很少的菜单操作功能,使用起来也是非常的别扭。这很可能就是在windows 人机交互式操作系统占统治地位的今天,SAS较少被人问津的原因之一。 到了最新的几个版本,SAS也对可视化操作方法投入了一定的关注。从8.0版以后,出现了几个功能强大的可视化操作的模块,如insight模块和analyst 模块等,其菜单操作的方便程度以及人机界面的亲和性绝不亚于SPSS等著名的可视化统计分析软件。 然而要想完全发挥SAS系统强大的功能,充分利用其提供的丰富资源,掌握SAS的编程操作是必要的,也只有这样才能体现出SAS在各个方面的杰出才能。
SAS数据分析完整笔记。[收藏] 2013-08-11ice数据分析数据分析 1. SAS INSIGHT启动: 方法1:Solution→Analysis→Interactive Date Analysis 方法2:在命令栏内输入insight 方法3:程序编辑窗口输入以下代码,然后单击 Submit按钮; Proc insight; Run; 1.1 一维数据分析 用 sas insight做直方图、盒形图、马赛克图。 直方图:Analysis→Histogram/Bar Chart 盒形图:Analysis→Box plot 马赛克图:Analysis→Box plot/Mosaic plot(Y) 1.2 二维数据分析 散点图:Analysis→Scattery plot(Y X) 曲线图:Analysis→Line plot( Y X) 1.3 三维数据分析 旋转图:Analysis→Rotationg Plot 曲面图:Analysis→Rotationg Plot设置 Fit Surface 等高线图:Analysis→Countor plot 1.4 分布分析 包括:直方图、盒形图、各阶矩、分位数表,直方图拟合密度曲线,对特定分布进行检验。 1.4. 1 Analysis→Distribution(Y) 第一部分为盒形图,第二部分为直方图,第三部分为各阶矩,第四部分为分位数表。 1.4.2 添加密度估计 A:参数估计:给出各种已知分布(正态,指数等),只需要对其中参数进行估计; Curves→Parametric Density
B:核估计:对密度函数没有做假设,曲线性状完全依赖于数据;Curves→Kernel Density 1.4.3 分布检验 Curves→CDF confidence band Curves→Test for Distribution 1.5 曲线拟合 Analysis→Fit(Y X):分析两个变量之间的关系 1.6 多变量回归 Analysis→Fit(Y X) 1.7 方差分析 Analysis→Fit(Y X) 1.8 相关系数计算 Analysis→Multivariate 1.9 主成分分析 Analysis→Multivariate 2.SAS ANALYST启动: 方法1:Solution→Analysis→Analyst 方法2:在命令栏内输入analyst 2.1 分类计算统计量:Data→Summarize by group 2.2 随机抽样:Data→Random Sample 2.3 生成报表:Report→Tables 2.4 变量计算:Date→Transform 2.5 绘制统计图 2.5.1 条形图:Graph→Bar Chart→Horizontal 2.5.2 饼图:Graph→Pie Chart 2.5.3 直方图:Graph→Histogram 2.5.4 概率图:Graph→Probality plot 2.5.5 散点图:Graph→Scatter plot
SAS过程步简介 SAS过程步的一般形式为: PROC 过程名 [ DATA=输入数据集] [选项];过程语句1 [/ 选项 ];过程语句2 [/ 选项];……RUN; 1.VAR语句 VAR语句在过程步中用于指定分析变量。 VAR语句的语法格式为: VAR 变量名1 变量名2 … 变量名n; 变量名列表可以使用省略的形式,如x1-x3 等。 应用实例: var math chinese; 2.MODEL语句 MODEL语句在统计建模过程中用来指定模型的形式。语法格式为:MODEL 因变量 = 自变量列表 / 选项; 应用实例: model y=x1 x2 x3 ; 3.BY语句 BY语句在过程步中用来指定一个或几个分组变量,根据这些分组变量值可以把观测记录分组,然后对每一组观测分别进行指定的分析。在使用带有BY语句的过程步之前,应先用SORT过程按BY语句指定的变量对数据集排序。例如,假设我们已经把class1数据集按性别排序,则下面PRINT 过程可以把男、女生分别列出: proc print data=class1 ; by sex;run; 4.OUTPUT语句 过程步中经常用OUTPUT语句指定输出结果存放的数据集。不同过程中把输出结果存入数据集的方法各有不同,OUTPUT语句是使用频繁的语句之一。其语法格式为: OUTPUT OUT=输出数据集名关键字=变量名关键字=变量名…; 其中用OUT=给出了存放结果数据集的名字,关键字用于定义输出变量名,用“关键字=变量名”的方式指定了系统自动输出变量与存储变量之间的 对应关系。等号后面的变量名指定了输出数据集中的存储变量名称。例如:proc means data=data_prg.class1; var math; output out=result02 n=n mean=meanmath var=varmath;run;proc print data=result02; run;
研究生统计软件课总结 马林茂 中国疾病预防控制中心 公共卫生监测与信息服务中心卫生统计室 2012年4月10日
目录 一、SAS的运算符 (3) 二、数据集命令 (4) 三、SAS函数 (12) 四、SAS过程 (12) 1. MEANS过程(统计量、OUTPUT) (12) 2、UNIVARIATE过程(统计量、NORMAL) .............................. 错误!未定义书签。 3、CORR过程(SPEARMAN、KENDALL、NOSIMPLE) (14) 4、FREQ过程(CHISQ、NOPERCENT、NOROW、NOCOL、EXACT) (15) 5、FORMAT过程 (18) 6、APPEND过程(BASE、DATA、FORCE) (18) 7、SORT过程(BY、OUT、DESCENDING) (19) 8、PRINT过程(DATA、N、NOOBS、ROUND) (19) 9、TTEST过程(DATA、CLASS、VAR、BY) (21) 10、NPAR1WA Y过程 (22) 11、CONTENTS过程 (22)
一、S AS软件的几个基本窗口 1.增强型程序编辑器窗口 ●文本输入和编辑功能 ●语法检查,大大的方便程序的阅读和查错。 ●程序段的展开和收缩功能,便于从宏观上了解程序的结构。 ●程序输入时自动支持缩进格式。 ●支持输入的字符串自定义为宏。 ●支持键盘快捷方式(将Alt键或Shift键与其他键同时使用) 2.日志窗口 输出程序在运行时的各种有关信息 3.输出窗口 输出SAS程序运行的结果 4.结果窗口 浏览和管理所提交所提交的SAS程序的输出结果。 5.SAS资源管理器窗口 浏览和管理SAS系统中的各种文件 二、F ILE菜单基本的文件管理功能 ●新建、打开、保存、另存文件 ●页面设置、打印、打印预览等文件打印相关功能。 ●使用Send Mail菜单项将当前文件作为E-mail附件发送。 ●列出了最近使用过的SAS文件(默认为4个),方便用户调用。 ●数据导入和导出(Import、Export)功能,用于SAS数据集和其他数据格式间的转 换。 ●打开对象或存储为对象:该功能可以直接打开存储在SAS目录中的各种对象,或者 将程序、Log和Output的结果存储在某个目录文件中。 三、S AS的运算符 1、比较算符 等于= 或EQ 不等于~= NE 大于> 或 GT 小于< 或 LT 小于等于<= 或 LE 大于等于>= 或 GE 等于列表中的一个IN 2、逻辑运算符 AND OR ^NOT 3、其他算符 <> (MAX) ><(MIN) || (JOIN)
SAS软件知识要点总结 李 明 注意:数据集要有名字,变量要有名字,所以 SAS中对名字(数据集名、变量名、数据库名,等等)有约定:SAS 名字由英文字母、数字、下划线组成,第一个字符必须就是字母或下划线,名字最多用8 个字符,大写字母与小写字母不区分。比如,name,abc,aBC,x1,year12,_NULL_等就是合法得名字,且abc 与aBC 就是同一个名字,而class—1(不能有减号)、a bit(不能有空格)、serial#(不能有特殊字符)、Documents(超长)等不就是合法得名字. 二、MODEL 语句 MODEL语句在一些统计建模过程中用来指定模型得形式。其一般形式为 MODEL 因变量=自变量表/选项; 比如 model math=chinese; 即用语文成绩预测数学成绩。 注意:MODEL就就是指出谁就是因变量,谁就是自变量; 三、BY语句与CLASS 语句 BY语句在过程中一般用来指定一个或几个分组变量,根据这些分组变量值把观测分组,然后对每一组观测分别进行本过程指定得分析。在使用带有BY 语句得过程步之前一般先用 SORT过程对数据集排序 注意:BY语句就就是按某给定指标分类(组) 在一些过程(如方差分析)中,使用CLASS 语句指定一个或几个分类变量,它实际相当于因变量.而在另一些过程(如MEANS)中,CLASS 语句作用与BY语句类似,可以指 定分类变量,把观测按分类变量分类后分别进行分析。使用CLASS时不需要先按分类变量 排序。 注意:CLASS语句得作用有两个:1、指定(分类变量),本身就就是因变量; 2、与BY类似,指定分类变量并分类; 四、OUTPUT 语句 在过程步中经常用OUTPUT 语句指定输出结果存放得数据集.不同过程中把输出结果
SAS应用讲义 (中高级教材) Statistical Analysis System简称为SAS,可用来分析数据和编写报告。它是美国SAS研究所的产品,在国际上被誉为标准软件,在我国深受医学、农林、财经、社会科学、行政管理等众多领域的专业工作者的好评。 有关SAS的最新信息,可以查看。 SAS采用积木式模块结构,其中的SAS/STAT模块是目前功能最强的多元统计分析程序集,可以做回归分析、聚类分析、判别分析、主成分分析、因子分析、典型相关分析以及各种试验设计的方差分析和协方差分析。 本讲义围绕SAS的应用,讲述以下八部分内容: (1)SAS应用基础;(2)SAS常用语句; (3)SAS服务过程;(4)描述性统计程式; (5)方差分析程式;(6)回归分析程式; (7)聚类分析及判别分析程式;(8)互依性分析程式。 第一讲SAS应用基础 1.1SAS的显示管理系统 启动计算机,点击SAS图标后,即可进入SAS的显示管理系统DMS。 DMS是Display Manager System的缩写。在DMS中有四个主要的窗口: (1)编辑窗口(PROGRAM EDITOR)——编辑程式和数据文件; (2)日志窗口(LOG)——记录运行情况,显示ERROR信息; (3)输出窗口(OUTPUT)——输出运行的结果; (4)图形窗口(GRAPH)——输出图形。 点击Globals 菜单中的Program editor、Log、Output、Graph 命令可以进入编辑、日志、输出及图形窗口。 按功能键F5、F6、F7也可以进入编辑、日志及输出窗口。 退出DMS有两种方法: (1)点击File 菜单中的Exit 命令; (2)点击窗口右上角的×。 1.2 SAS的功能键 用功能键可以代替对菜单的点击,有时比较方便。 最常用的功能键有F1 :显示帮助信息(HELP); F4 :显示已经运行的程式(RECALL); F5 :进入编辑窗口(PGM);