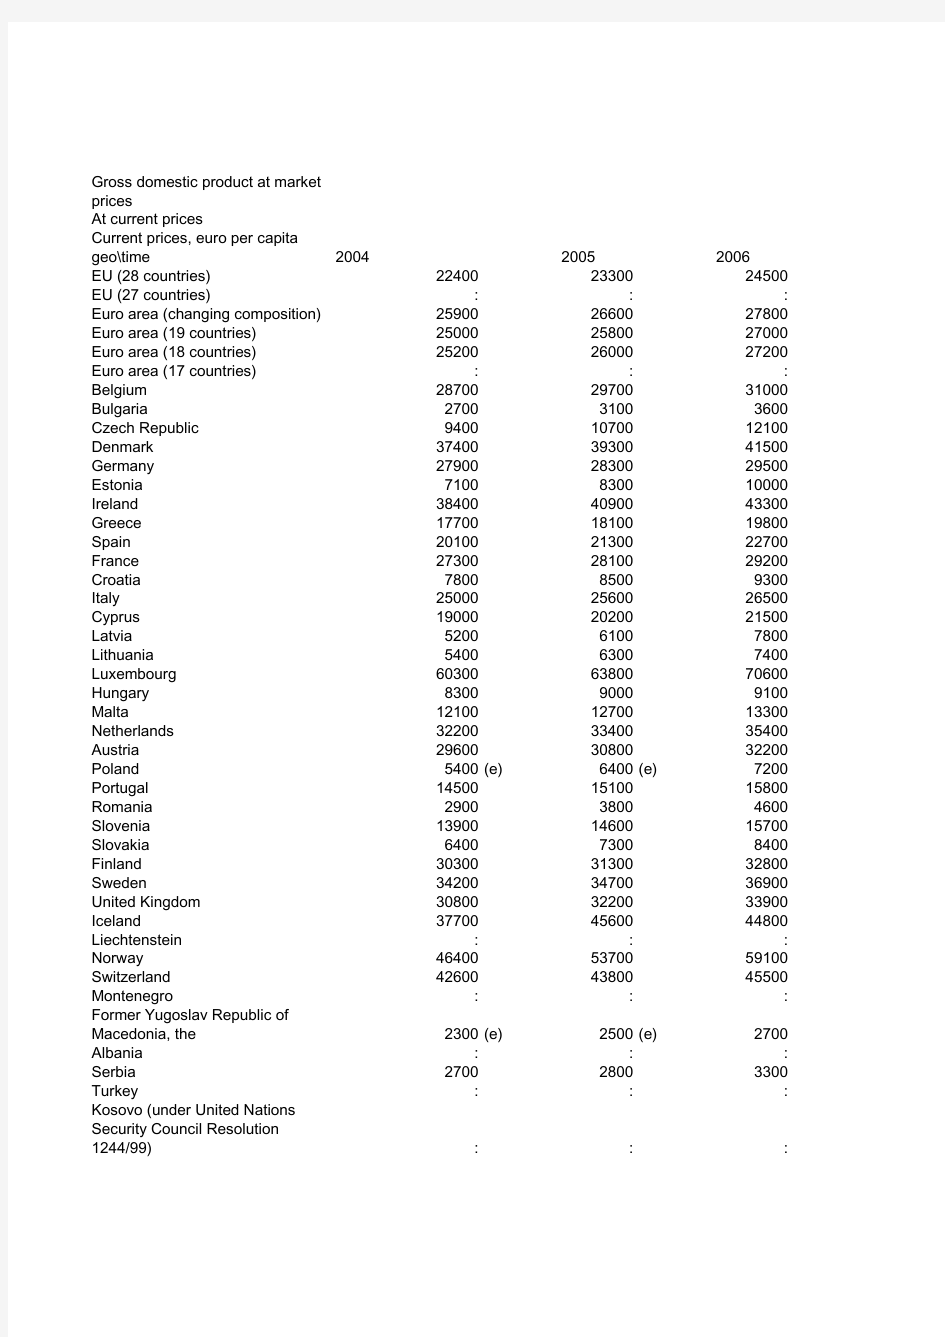
Gross domestic product at market prices
At current prices
Current prices, euro per capita
geo\time200420052006
EU (28 countries)224002330024500 EU (27 countries)::: Euro area (changing composition)259002660027800 Euro area (19 countries)250002580027000 Euro area (18 countries)252002600027200 Euro area (17 countries)::: Belgium287002970031000 Bulgaria270031003600 Czech Republic94001070012100 Denmark374003930041500 Germany279002830029500 Estonia7100830010000 Ireland384004090043300 Greece177001810019800 Spain201002130022700 France273002810029200 Croatia780085009300 Italy250002560026500 Cyprus190002020021500 Latvia520061007800 Lithuania540063007400 Luxembourg603006380070600 Hungary830090009100 Malta121001270013300 Netherlands322003340035400 Austria296003080032200 Poland5400(e)6400(e)7200 Portugal145001510015800 Romania290038004600 Slovenia139001460015700 Slovakia640073008400 Finland303003130032800 Sweden342003470036900 United Kingdom308003220033900 Iceland377004560044800 Liechtenstein::: Norway464005370059100 Switzerland426004380045500 Montenegro::: Former Yugoslav Republic of Macedo2300(e)2500(e)2700 Albania::: Serbia270028003300 Turkey::: Kosovo (under United Nations Securit::: :=not available p=provisional e=estimated b=break in time series
:
Source of Data:Eurostat
Last update:08.04.2016
Date of extraction:12 Apr 2016 14:40:50 CEST
Hyperlink to the table:http://ec.europa.eu/eurostat/tgm/table.do?tab=table&init=1&plugin=1&language=en&pcode=t General Disclaimer of the EC website:http://ec.europa.eu/geninfo/legal_notices_en.htm
Short Description:GDP (gross domestic product) is an indicator for a nation′s economic situation. It reflects the Code:tec00001
2007200820092010
25900260002440025400
:::: 29100296002820028900
28400289002780028500
28600291002800028700
:::: 32500331003230033500
4300500050005100
13400154001410014900
42800439004170043500
31000317003060032100
12100123001060011000
44800417003730036400
21100218002140020300
23900243002330023200
30400310003000030800
10200112001050010500
27400276002640026800
22800239002290023000
103001120087008500
90001020085009000
76500770007280077900
101001070093009800
14200150001490015900
37400389003740038000
34000351003430035200 (e)8200(e)9500(e)8200(e)9400(e)
16600169001660017000
6000690059006300
1740018800(b)1770017700
10400122001180012400
35300365003390034900
39000382003330039400
35400309002680028900
50000336002880031400
:::: 62200664005760066200
46000490005000055900
:::: (e)3000(e)3300(e)3300(e)3500(e)
:::: 4000460042004100
::::
::::
n=1&language=en&pcode=tec00001
ion′s economic situation. It reflects the total value of all goods and services produced less the value of goods and services used for intermedia
20112012201320142015 26100265002670027500: ::::: 29500295002970030100: 29200292002950029900: 29400294002960030100: ::::: 3450035000354003590036500 5600570058005900(p)6100 15600153001490014700: 4420045200455004620046900 3370034300350003600037100 1250013600144001520015600 3800038100390004100046200 18600(p)17300(p)16500(p)16300(p)16200 2290022300(p)22100(p)22400(p)23300 31500318003210032200: 1040010300102001020010400 2730026700265002650026900 23000225002100020400(p)20600 980010800113001180012300 1030011200118001240012800 8130082000853008760091600 1010010000102001060011100 1650017200181001890020400 385003850038700(p)39300(p)40100 3680037600381003850039100 9900(e)10100(e)10200(e)10700(e)11100 16700160001630016700(e)17300 66006700(b)72007500(p)8100 1800017500174001810018700 1300013400136001390014400 3650036900374003760037800 4290044500454004440045300 2950032200319003490039500 3300034500359003950045500 ::::: 7230079000774007350067600 634006470063700(p)64600(p): ::::: 3700(e)3700(e)3900(e):: ::::: 4600440048004700: ::::: :::::
services used for intermediate consumption in their production. Expressing GDP in PPS (purchasing power
(p)
(p) (p)
(p)
(p) (e) (e) (p)
ower standards) eliminates differences in price levels between countries, and calculations on a per head bas
d basis allows for th
e comparison o
f economies significantly different in absolute size.