I.J.Modern Education and Computer Science, 2011, 5, 54-60
Published Online August 2011 in MECS (https://www.doczj.com/doc/c116932885.html,/)
Study on Overburden’s Destructive Rules Based on Similar Material Simulation
Ruyu Zheng
School of Environmental Science and Spatial Informatics China University of Mining and Technology
Xuzhou, China
guandadao@https://www.doczj.com/doc/c116932885.html,
Kan Wu, Ru Li
School of Environmental Science and Spatial Informatics China University of Mining and Technology
Xuzhou, China
wukan6899@https://www.doczj.com/doc/c116932885.html,, cumtliru05@https://www.doczj.com/doc/c116932885.html,
Abstract—Analysis on the current research status, this article studies on the dynamic subsidence principles of overburden rock strata during coal mining based on similar material simulation test. Close ranged industrial photogram metric system was introduced to collect data. After coordinate transformation, matching and model amendment, dynamic subsidence curves which can be used
to analyze the continuity characteristics of overburden subsidence, changes of boundary angle and displacement angle, volume transferring law from rock to surface, etc. were got. The result is useful in further study of the dynamic rule of overburden strata and enriches mining subsidence principles.
Index Terms—similar material simulation; close ranged industrial photogram metric; subsidence curve;dynamic subsidence; the failure of overburden strata
I.I NTRODUCTION
Similar material simulation based on the similar theory study the practical problem with the model combined with some physical parameters structured by certain similar material and practical similar material model. We can get usual laws and deformation mechanism with the theory and field parameters during the simulation test of study [1]. Because of the rock body quality of mine is a complicated composite medium, strata and ground movement caused by mining is also a complicated mechanical process. Different strata in different time may produce different deformation during the mining active process. This phenomenon is invisible, non-contact, cause great difficult to theoretical research and practical observation of overburden deformation and movement. Study deformation and movement of overburden in actual mining process, the workload is heavy, cost is expensive and need longer time. Sometimes the mining parameter, order and process are limited. Test measures and observation methods may be invalid. Consequently, in the laboratory through similar material simulation test simulated mining process is an important means to study deformation and movement of overburden.
Similar material simulation test is proposed by Cuznetov in Soviet in the In the 1930s. It first adopted by BHNMN in 1937 to study deformation and movement of ground. After the World War Two this method is widely used and developed, become a key measurement to study deformation and movement of overburden indoor. Meanwhile this method is used in Poland, Czech, Germany and so on. In China, the institute of coal in TangShan first carried out this aspect research in 1958. Subsequently, some research institution such as Beijing Mining College establish laboratory to study strata movement. In recent years, many domestic research institution study overburden strata movement use this method, provided theoretical basis for design of mining. Because of its outstanding characteristics, similar material simulation adapts to some areas on the mining and slowly become the effective method on the laws of the mine pressure and rock. Similar material simulation becomes the qualitative research from quantitative research [2-4]. This paper studies the laws of the rock mass dynamic subsidence.
Researchers in abroad and domestic have made many studies on the mining subsidence steady prediction, and proposed many applicable theories and methods such as continuum theory, stochastic medium theory, probability integral method, curve prediction method and profile function prediction method. But in dynamic prediction there still no good theory. Professor Kan Wu and Yue Han Wang have applied mined rock mass dynamic mechanical model to study the space-time low of overburden deformation and movement accused by mining [5-6]. In addition they have studied the settlement regularity and strata movement both in overburden and ground during mining and subsidence dynamic prediction used time series analysis method [7-10]. Researcher Guang Ming Yu has made study on fractal increasing law of dynamic subsidence of ground point [11]. Researcher Jian Rong Tang proposed function relations between the maximum subsidence speed and mining area based on study of overburden movement and deformation used similar material simulation test [12].
Sponsored by State Environmental Projection Fund for Non-profit Industry specific (Project number:200809128) and Qing Lan Project.
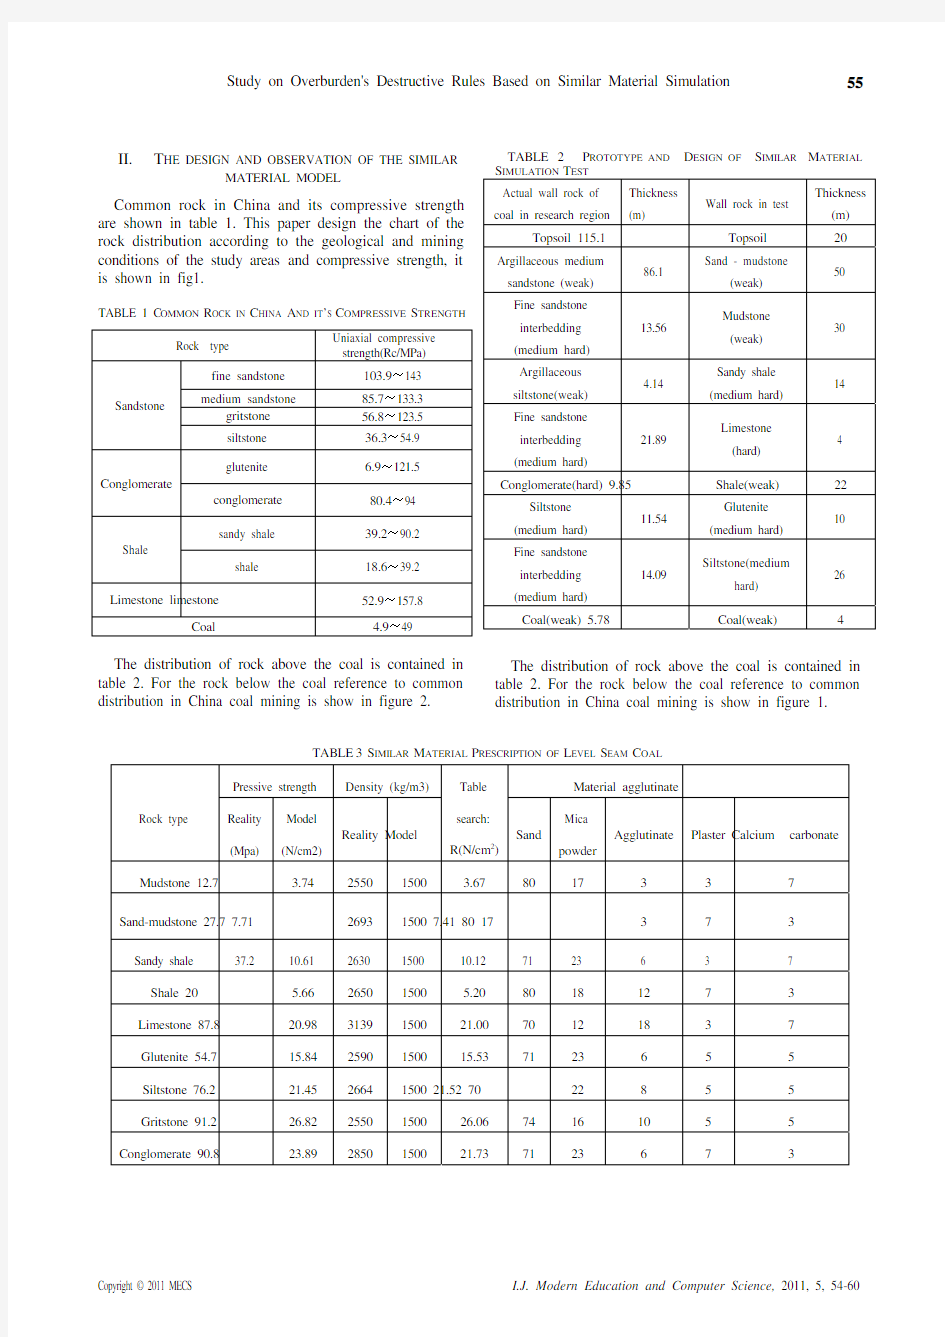
TABLE 3 S IMILAR M ATERIAL P RESCRIPTION OF L EVEL S EAM C OAL
Rock type
Pressive strength
Density (kg/m3)Table search:
R(N/cm 2
)
Material agglutinate Reality (Mpa)
Model
(N/cm2)
Reality Model
Sand
Mica
powder
Agglutinate
Plaster Calcium carbonate
Mudstone 12.7 3.74 2550 1500 3.67 80 17 3 3 7 Sand-mudstone 27.7 7.71 2693 1500 7.41 80 17 3 7 3 Sandy shale
37.2
10.61
2630
1500
10.12
71
23
6
3
7
Shale 20 5.66 2650 1500 5.20 80 18 12 7 3 Limestone 87.8 20.98 3139 1500 21.00 70 12 18 3 7 Glutenite 54.7 15.84 2590 1500 15.53 71 23 6 5 5 Siltstone 76.2 21.45 2664 1500 21.52 70 22
8
5
5 Gritstone 91.2 26.82 2550 1500 26.0
6 74 16 10 5 5 Conglomerate 90.8 23.89 2850 1500 21.73 71 23
6
7
3
II.
T HE DESIGN AND OBSERVATION OF THE SIMILAR
MATERIAL MODEL
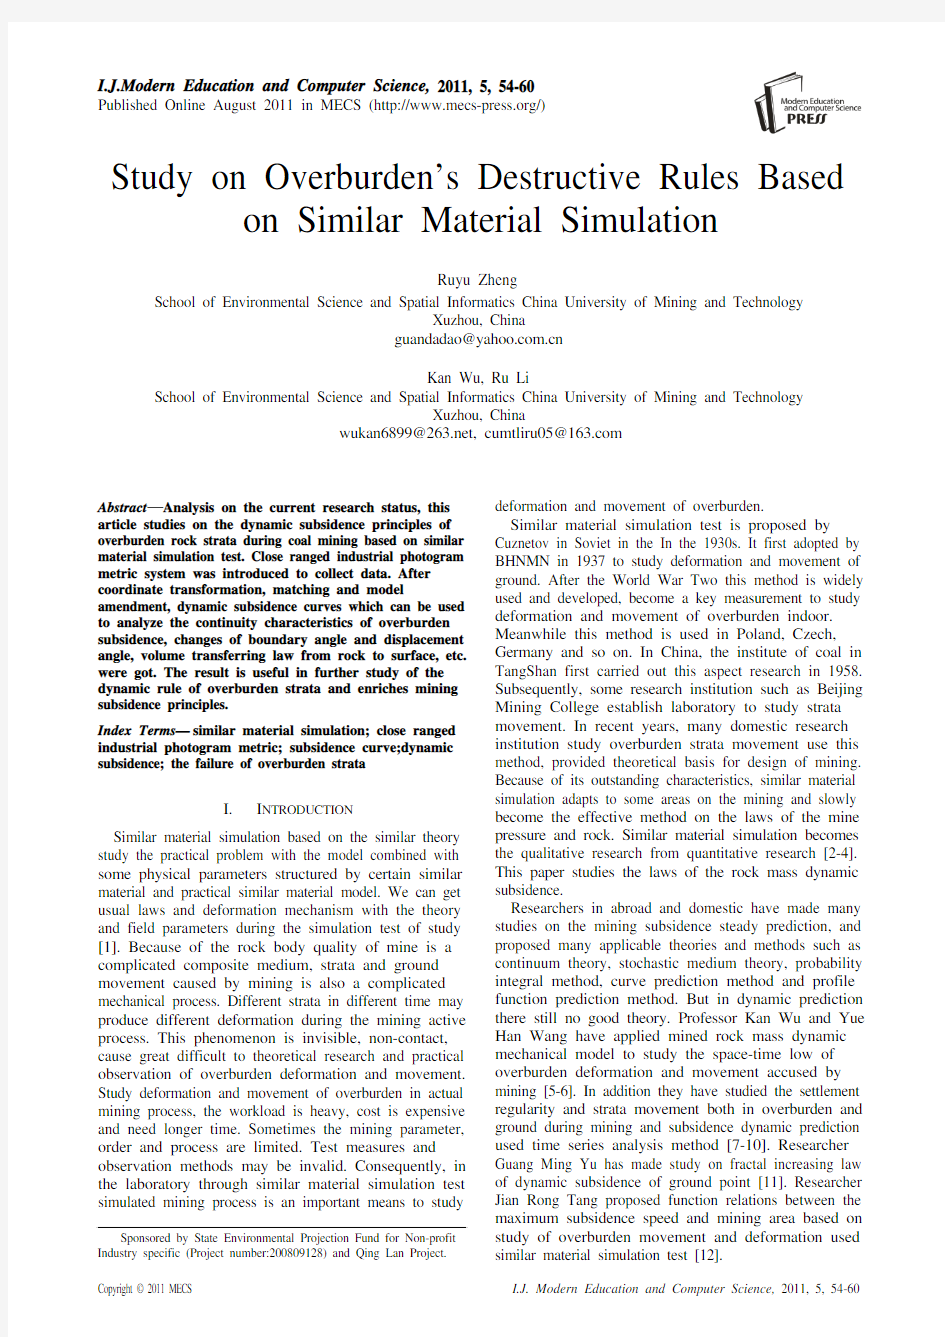
Common rock in China and its compressive strength are shown in table 1. This paper design the chart of the rock distribution according to the geological and mining conditions of the study areas and compressive strength, it is shown in fig1.
TABLE 1 C OMMON R OCK IN C HINA A ND IT ’S C OMPRESSIVE S TRENGTH
Rock type
Uniaxial compressive strength(Rc/MPa)
Sandstone
fine sandstone
103.9~143 medium sandstone
85.7~133.3 gritstone
56.8~123.5 siltstone 36.3~54.9 Conglomerate
glutenite
6.9~121.5
conglomerate 80.4~94 Shale
sandy shale
39.2~90.2
shale
18.6~39.2 Limestone limestone
52.9~157.8 Coal
4.9~49
The distribution of rock above the coal is contained in table 2. For the rock below the coal reference to common distribution in China coal mining is show in figure 2.
TABLE 2 P ROTOTYPE AND D ESIGN OF S IMILAR M ATERIAL S IMULATION T EST Actual wall rock of coal in research region
Thickness (m)
Wall rock in test
Thickness (m)
Topsoil 115.1 Topsoil 20 Argillaceous medium sandstone (weak) 86.1
Sand - mudstone
(weak) 50
Fine sandstone interbedding (medium hard) 13.56 Mudstone (weak) 30
Argillaceous siltstone(weak) 4.14 Sandy shale (medium hard) 14
Fine sandstone interbedding (medium hard)
21.89 Limestone (hard)
4 Conglomerate(hard) 9.8
5 Shale(weak)
22 Siltstone (medium hard) 11.54
Glutenite (medium hard) 10
Fine sandstone interbedding (medium hard)
14.09 Siltstone(medium
hard)
26
Coal(weak) 5.78 Coal(weak) 4
The distribution of rock above the coal is contained in table 2. For the rock below the coal reference to common distribution in China coal mining is show in figure 1.
The similarity coefficient is 1:200 between model and prototype. The length of the model support is 4m. The height and thickness of the model is 1.39m and 30cm. We can get the relationship between the time proportion and the model proportion according to the Newton laws
movement:t αtime proportion is 1:14. Its mining progress is 20cm/d, the length of mining is 2m and coal thickness is 2cm according to the mining progress 2.8m/d. The prescription of similar material is defined according to the quality and compressive strength of the main rock. The prescription of similar material is shown in table 3.
This paper get the monitor data with 3D optical points measurement system called Digital close ranged industrial photogram metric, the composition is shown in Figure 3. The principle of close range industry photogram metric is use a high resolution digital camera take several photos for the workpiece, through survey software
calculate 3-d coordinate of key points in on the
workpiece. When be used to observe motional objects digital close range industry photogram metric is called video photogram metric, such as video photogram metric model deformation can survey dynamic movement, deformation and attitude. It includes single cameral and two cameral two forms; it has virtue of high precision, non-contact and portable. What’s more, it’s rapid, efficient and slow to interference of temperature change
Fig.1 Similar material simulation experiment of horizontal coal seam
Fig.2 Surveying point distribution map on similar material simulation
model
Fig.3 The composition of XJTUDP III. T HE DYNAMIC RESULT OF OVERLYING STRATA SUBSIDENCE Draw the subsidence curve with observation result and plot the charts selecting 5 different mining progresses when mining progress are 72m, 140m, 206m, 272m and 374m from fig.1.
Fig.4 The subsidence curve of each surveying line when mining 72m
Fig.5 The subsidence curve of each surveying line when mining 140m
Fig.6 The subsidence curve of each surveying line when mining 206m
Fig.7 The subsidence curve of each surveying line when mining
272m
Fig.8 The subsidence curve of each surveying line when mining
374m
See fig 4-8. Chart 8 is the final subsidence curve and the other 4 charts express representative mining progress according to the rock destruction characteristics and adjacent observation periods when it is mining. From the charts, we can get 8 different curve based on the different dynamic subsidence laws. Through the dynamic subsidence curve, we can get the laws of the continuity, boundary angle, displacement angle change, and subsidence basin change laws.
IV.T HE DYNAMIC SUBSIDENCE LAWS ANALYSIS OF
THE INTERNAL OVERLYING STRATA
A.The subsidence continuity analysis
According to different subsidence curve of each terrene, if the curve is smooth the subsidence is continuous; the rock of this part exist cross and fracture if the curve has mutation. Therefore, High degree of fault can be determined. For example, in the chart 4, when mining progress is 72m, a small part points of the curve 1 appear great subsidence and this appearance show that falling fault zone arrive at this position; from the chart 5, when mining progress is 140m, the height of the crack arrive at the second observation line and the other curves above the fourth curve is the typically symmetric subsidence curves; from the other charts, when mining progress is 206m, 272m, 374m, their subsidence value become bigger and bigger gradually, the subsidence of the observation line close to the mined areas is abnormal, and the subsidence value of the integral rock mass is abnormal and decreasing from bottom to top. The area close to the mined-out area appears greatly loose that the value of the subsidence is abnormal; the integral movement show well in the upper areas of the overlying strata. But the height of the crack is increasing along with the mining progress. For example, when mining progress is 206m, the height of the crack appear on the seven observation line; when mining progress is 272m and 374m, the height of the crack appear on the nine observation line. The table 4 show the different crack height at the different mining progresses (from the roof of coal seam).
TABLE 4 T HE H IGH OF C AVING Z ONE AT D IFFERENT M INING
L ENGTH (F ROM C OAL S EAM R OOF)
Mining
position
The subsidence curve with
abrupt change fast from
coal seam roof
The high of caving
zone (from coal
seam roof) 72m The first surveying line 14m
140m The second surveying line 26m
206m The seventh surveying line 76m
272m The ninth surveying line 106m
374m The ninth surveying line 106m
B.The analysis of boundary angle and traveling angle The factors influencing the boundary angle and traveling angle are many and complex when it is mining. The main factors are lithology, mining height, coal thickness, mined-out area, mining progress, coal inclination, mining methods, roof managerial approach and times of repeated mining. The study emphasis is laws of the mining length, boundary below angle and angle of critical deformation in this paper. The main factor about dynamic analysis is mining progress and the extent of the
cover rock on different mining length show greatly different. The stability of the cover rock has time effect when coal is mined so the boundary angle, moving angle and the mining progress are coterminous.
The boundary angle(0δ): the included angle of the wired line about boundary point and mined-out area border and the level about virgin coal in the major cross-section of subsidence trough[1]. According to the dynamic subsidence curves, we can get boundary angle of different mining progress in different mining horizon. See table 5:
TABLE 5 B OUNDARY A NGLE WITH D IFFERENT M INING L ENGTH AT
E ACH H ORIZON
The fourteenth surveying line 69° 56° 54° 53° 53° The twelfth surveying line 71° 58° 55° 55° 55° The ninth surveying line 63° 52° 51° 51° 50° The seventh surveying line 80° 48° 47° 47° 47° The fifth surveying line 76° 51° 50° 49° 49° The third surveying line 85° 43° 42° 42° 42° The boundary angle on the different observation lines go smaller with the mining progress and the value of the boundary angle go steady when the surface go full subsidence which is in accordance with the formerly experience. The connected curve by subsidence boundary points in the different horizon and same moment is not straight related to the rock lithology and rock thickness. The hard parts of rock mass are aleurolite, glutenite, arenaceous shale, and tithonian. The soft parts of the rock
mass are mudstone, sand shale, arenaceous shale and shale. The Specific interpretation is chart 1. From bottom to the top the rock mass go harder and the horizon boundary angle goes bigger. The above conclusions show that the softer boundary angle has smaller boundary angle. The boundary angles of the second observation line closed to the mined-out area appear mutation because of the Layer thickness ratio of the adjacent horizon. Rock mass nearer to the mined-out areas appear greatly destruction. The location on the fifth and twelfth observation line has small boundary angle and smaller destruction because they approach to the mined-out areas. The boundary angles of the different horizon and different moment show on fig.9.
Displacement angle (δ): find three
points 3/i m m m =,30.210/K m ?=×,2/m m m ε=, at inclined, curvature, horizontal deformation curve on main section, the angle between line connection the outside point with the goaf and the horizontal line is displacement angle[1].according to calculate methods of three deformation and definition of displacement angle, calculating three critical deformation value using the observation data of horizontal deformation, subsidence and distance between two point, we can determine the displacement angle and its value is show in table 6.
Fig.9 Curve line of boundary angle with different mining time at each horizon
TABLE 6 D ISPLACEMENT ANGLE WITH DIFFERENT MINING LENGTH
AT EACH HORIZON
Mining length
72m 140m 206m 272m 374m The fourteenth surveying line — 75° 67° 65° 61° The twelfth surveying line — 72° 65° 61° 61° The ninth surveying line — 76° 63° 58° 58° The seventh surveying line — 68° 59° 56° 56° The fifth surveying line — 73° 62° 56° 56° The third surveying line — 69° 58° 54° 53° The second surveying line — 79° 72° 72° 71° The first surveying line
74° 66°
58°
52°
52°
each horizon From the table 6, the moving angles of the different horizon go smaller with the mining progress. The moving angle of different horizon has some changes at the same moment but the integral trend is very close. See the visual
fig.10. The rock moving angles are got by the all observation lines so the destroyed extent of the rock mass is little and the moving angle of the first observation is 74°when mining progress is 72m and the angle of the other horizon can not be got. With the greater extent of the rock mass the moving angle go smaller but the laws of the moving angle is in accordance with the boundary angle above this subsection.
C.Volume of subsidence basin analysis
The subsidence basin’s formatting is a dynamic process, during the underground mining the subsidence basin is constantly expanding. As to the end of mining, the surface is still sinking, after a time the subsidence is formed. For the bedded ore-body, It’s goaf roughly like a regular rectangle, when full mining the subsidence basin is locate on the goaf, and it’s range much large than goaf;
the ground movement and deformation on main section is biggest; in horizontal core seam mining the contour of surface subsidence is to goaf symmetry center ellipse[1];
in this paper the similar material model is plane, the length of model is 4 m, the height if mode is 1.39m,the width of model is 0.3 m, and we select the main section to do our research. According to subsidence curves, drawing with AutoCAD, we can get the volume of rock in different surveying line. The result of compare it with corresponding goaf volume is follow as Table 7.
TABLE7T HE C OMP A RISON T ABLE OF T HE V OLUME OF S UBSIDENCE
B ASIN AND G OAF AT D IFFERENT P OSITION
Mining
length 72m 140m 206m 272m374m
The volume of goaf/m317280 33600 49440 6528089760
The volume of
strata subsidence
on surveying
line
14th
line/m3664 5508 16111 33315 55451 12th line
/m3596 4840 15415 32399 54481 9th line /m3715 4921 16186 32059 54267 7th line /m3349 4521 15367 32235 53635 5th line/m3393 4995 19361 33071 52888 3th line/m3249 4796 20246 37120 53698 2th line/m3334 11264 21403 36530 49539 1th line/m32718 17949 28905 46867 64320
TABLE 8 R ATIONS OF T HE V OLUME OF S TRATA S UBSIDENCE
AND G OAF OF E ACH S URVEYING L INE AT D IFFERENT T IME (%) Mining
length 72m 140m206m 272m 374m The volume of goaf/m317280 3360049440 65280 89760
Rations of the volume of strata subsidence and goaf on surveying
line 14th line 3.8% 16.4%32.6% 51.0% 61.8%
12th line 3.5% 14.4%31.2% 49.6% 60.7%
9th line 4.1% 14.7%32.7% 49.1% 60.5%
7th line 2.0% 13.5%31.1% 49.4% 59.8%
5th line 2.3% 14.9%39.2% 50.7% 58.9%
3th line 1.4% 14.3%41.0% 56.9% 59.8%
2th line 1.9% 33.5%43.3% 56.0% 55.2%
1th line 15.7% 53.4%58.5% 71.8% 71.7%
From table 7 we can get that the volume of goaf, the
failure of overburden strata is increased with the mining,
and gradually transmission to ground, as the result the
volume of rock subsidence is increased in order. Affected
by the large range of subsidence basin, at the same
surveying time on the first observation line the
subsidence volume is largest, on different line the
subsidence volume is different and especially on the 14th
surveying line the ground sink volume is largest. The
Rations of the volume of strata subsidence and goaf of
each surveying line at different moments (%) is following
in Table 8.
From table 8, the rations of the volume of subsidence
basin and goaf of surface are from 3.84% to 61.78%. The
rations acceleration was from slow increase in prophase
to active subsidence stage in middle, and tends to become
smaller then close to stable at the end. The other change
law of the volume of different strata subsidence at
different time is the same with it. When mining 374m,
the rations of the volume of strata subsidence and goaf of
1 and
2 surveying line was less than it when mining
272m, it show that caving zone appeared gap and
compacted later. All of these show that the degree of
overburden strata failure and broken expand compaction
of strata in the process of coal mining.
According to the subsidence curve distribution of each
surveying at different time, selected rations of the volume
of strata subsidence and goaf of each surveying line when
mining 206m to analyze. The ration was from 58.47% at
the most deep horizon to about 32% at bend zone horizon.
All the volume of strata subsidence which close to the
surface have not difference, because the strata movement
was tend to integrity, each of maximum subsidence and
the range of subsidence boundary are all minimal
difference, so this part of rations are all minimal
difference. And the rations of the volume of strata
subsidence and goaf of some surveying line which close
to the goaf are change greatly, it show that overburden
strata which the closer to the goaf the destructiveness
more violent, and broken expand compaction of strata is
more stronger. The other change law at different time is
the same with it.
V.C ONCLUSIONS
According to the study area of the similar material
simulation, analysis on the subsidence curve of
overburden strata, as the conclusions follow:
(1) With coal seam mining, overburden destruction
belt progressive development upward. Finally, the height
of fracture development is 108m.
(2) Under the influence of the speed of the coal mining,
the boundary angle and displacement angle with different
mining length at each horizon have wave properties, but
maintain the overall trend: boundary angle was from 70°
to 55°, displacement angle was from nothing to the end
of 63°.
(3) The rations of the volume of subsidence basin and goaf of surface are from 3.84% to 61.78%. Because the influence of the speed of the coal mining, the volume of strata subsidence each surveying line in turn larger.
(4) The rations of the volume of strata subsidence and goaf of each surveying line was from 58.47% at the most deep horizon to about 32% at bend zone horizon when mining 206m, and tended to be stable. The other change law of the volume of different strata subsidence at different time is the same with it.
R EFERENCES
[1]HE Guo-qing,YANG Lun and LING Geng-di,etc, Mining
Subsidence Study,China University of Mining and Technology Press.1991,4.
[2]CHAI Jing, DUAN Shu-wu,“Study on internal
displacement testing of simulation model,” Ground Pressure and Strata Control, 2003,3, pp.93-94.
[3]WANG Su-hua,GAO Yan-fa, LIAO Jun-zhan, “The theory
of error offset in the course of equivalent materuls
simulation experiment, ” Journal of Shandong Agricultural
University,2005,36(3), pp.411-414. FU Zhi-liang, NIU
Xue-liang, WANG Su-hua and GAO Yan-fa,etc, “Quantitative study on equivalent materials testing, ” Acta
Mechanica Solida Sinica,2006,12, pp.169-172.
[4]WU Kan, WANG Yue-han, DENG Ka-zhong. Application
of Dynamic Mechanics Model of Overlying Strata Movement and Damage Above Goaf [J].Journal of China
University of Mining & Technolgy,2000,29(1), pp.34-36. [5]WU Kan, WANG Yue-han, DENG Ka-zhong. Application
of Dynamic Mechanics Model of Overlying Strata Movement and Damage Above Goaf [J].Journal of China
University of Mining & Technolgy,2000,29(1):34-36.
[6] Wang Yue-han, Deng Ka-zhong, Wu Kan. On The
Dynamic Mechanics Model of Mining Subsidence [J]Chinese Journal of Rock Mechanics and Engineering,2003,22(3),pp.352-357.
[7] WU Kan, JIN Jian-ming, WANG Juan-le. The Technique
of Time Series Prediction on Mining Subsidence [J].
Engineering of Surveying and Mapping,2001,10(4),pp.20-
23.
[8] Jin Jian-ming, Wu Kan. The Real time Prediction System
of the Subsidence [J]. Surveying and Mapping of
Geology and Mineral Resources, 2001, 10(14), pp.3-5. [9] WU Kan; JIN Jian-ming. Prediction of Dynamic Mining
Subsidence Parameters by Time Series Analysis Method
[J]. Journal of China University of Mining & Technology,
2000, 29(4), pp.413-415.
[10] Chen Ting-wu, Hou Qing-ming, Chen Zhuo.Application
of Time Series Analysis and Nonlinear Regression in
Settlement Modeling and Prediction [J]. Geotechnical
Investigation & Surveying, 2008, (10), pp.63-67.
[11] Yu Guang-ming, Sun Hong-quan,Zhao Jian-feng. The
Farctal Increment of Dynamic Subsidence of The Ground
Surface Point Induced by Mining [J].Chinese Journal of
Rock Mechanics and Engineering, 2001, 20(1), pp.34-37. [12] Kang Jianrong Wang Jinzhuang. Analysis of Dynamic
Subsidence of Mining Overburden Strata [J].Journal of
Taiyuan University of Technology, 2000, 31(4), pp.364-
366.
Ruyu Zheng, was born in YunXiao
county in China’s province FuJian in
1986 April 28th. From September 2005 to
September 2009 he was studied in School
of Environmental Science and spatial
Informatics of China University of
Mining and Technology and got the bachelor’s degree of Surveying and Mapping. He Pursuing the Master degree of Geodesy and Survey in the same University begin from September 2009.
Ru Li, was born in PingChuan country
in China’s province GaSu in 1987 April
19th. From September 2005 to September
2009 he was studied in School of
Environmental Science and spatial
Informatics of China University of Mining and Technology and got the bachelor’s degree of Geographic Information System. In September 2009 he became a Master in the same University to endeavor the degree of Cartography and Geographic Information Engineering.
实验十:相似材料模拟实验 1 相似原理 相似材料模拟是科学实验的一种,它是人们探讨和认识地压规律的途径之一。用与天然岩石物理力学性质相似的人工材料,按矿山实际原型,遵循一定比例缩小做成的模型,然后在模型中开挖巷道或模拟采场工作,观察模型的变形,位移,破坏和压力等情况,据以分析,推测原型中所发生的情况,这种方法称为相似材料模拟方法。它被用来研究采场和巷道的某些地压问题,例如估计地压大小,顶底板相对位移,冒落拱形状和大小,支架对地压底影响,地下开采对地表底影响,以及影响地压底各种因素。 要使模型中所发生的情况,能如实反映原型中所发生的情况,就必须根据问题的性质,找出主要矛盾,并根据主要矛盾,去确定原型与模型之间的相似关系和相似准则,原型与模型相似必须具备下面几个条件。 1.1 几何相似 要求模型与原型的几何形状相似。为此,必须将原型的尺寸,包括长,宽,高等都按一定比例缩小或放大,以做成模型。设以H L 和M L 分别代表原型和模型长度,脚标M 表示模型,L α代表H L 和M L 的比值,称长度比尺,则几何相似要求,L α为常数。 常数== M H L L L α (1) 因面积是长度二次方,所以面积比尺为 2 L M H A A α= (2) 因体积是长度三次方,所以体积比尺为 3 L M H V V α= (3) 一般来说,模型越大,越能反映原型的实际情况,原型实际上1=L α,但是由于各方面条件限制。模型又不能做的太大。通常模拟采场用 100~50=L α,即原型缩小 1001~501,模型巷道用50~20=L α;即原型缩小为50 1~201。 1.2 运动相似 要求模型与原型中,所有各对应点的运动情况相似,即要求各对应点的速度,加速度,运动时间等都成一定比例。设以H t 和M t 分别表示原型和模型中对应点完成沿几何相似的轨迹所需的时间,以t α代表H t 和M t 的比值,称为时间比尺,则运动相似要求t α为常数。 即 常数=== L M H t t t αα (4)
河南理工大学硕士研究生 《相似理论与模拟试验》课程论文 2014-2015学年第二学期 题目:关于《采场覆岩“三带”演化特性的 相似模拟实验及分析》的意见与看法 姓名:冯好收 学号:xxxxxxxxxxxxxxx 专业:xxxxxxxxxxxxxx
本文主要是对发表在“矿业安全与环保”期刊上的一篇文章——《采场覆岩“三带”演化特性的相似模拟实验及分析》提出的一些个人见解与看法。 一、文献简介 这篇文章是从三个方面来研究分析采场覆岩“三带”的高度的。第一,通过对覆岩采动裂隙发育特征进行相似材料模拟实验分析,研究采场覆岩裂隙的测点层位下沉量裂隙密度及离层率,得出覆岩“三带”的高度;第二,利用钻孔探测仪实测垮落带高度,对相似模拟实验结果进行验证;第三,根据理论分析对上两种方法得出的结果进行比较分析,确定“三带”的高度范围。 相似模拟实验以某矿综采放顶煤40108工作面为基本原型,工作面长度180m,走向长度1917m,平均采深384m。煤层平均倾角5°,平均厚度11.5m,其中割煤高度3.4m,预留底煤厚度平均2.0m,放顶煤厚度平均6.1m。 二、所提意见与看法 1、对垮落带理论分析的不同见解 随着工作面的推进,煤层内的采空空间将有其上覆岩层垮落、填充,由于岩层破碎后体积膨胀,当采空区上方岩层垮落一定高度后将填满采空空间,其上方的岩层由于受下部垮落岩石的支撑不再垮落,但因压力过大和受力不均匀将产生裂隙。 文章中提到,垮落带高度即是垮落后能把采空空间填满的岩层厚度与煤层开采厚度之和,亦是垮落岩层膨胀的高度。并给出下列关系式: H=lk=h+l(1)由式(1)得: l=h/(k-1) (2)将式(2)代入式(1)得: H=kh/(k-1) (3)式中:H——垮落带高度,m; l——垮落带岩层厚度,m; h——煤层采高,m; k——煤层顶板岩层的膨胀系数。 并据此得出,放顶煤开采条件下的垮落带高度的关系式:
岩层及地表移动的各种参数(08-12-2修订) 通过地表移动观测确定地表移动参数: 边界角:在充分采动或接近充分采动条件下,地表移动盆地主断面上盆地边界点(下沉值为10mm)至采空区边界的连线与水平线在煤柱一侧的夹角。考虑松散层时,还要根据松散层移动角确定。 移动角:在充分采动或接近充分采动条件下,地表移动盆地主断面上三个临界变形值中最外边的一个临界变形值点至采空区边界的连线与水平线在煤柱一侧的夹角。考虑松散层时,还要根据松散层移动角确定。 三个临界变形值为:倾斜变形3mm/m;水平变形2mm/m;曲率变形0.2mm/m2。 裂缝角:在充分采动或接近充分采动条件下,地表移动盆地内最外侧的地表裂缝至采空区边界的连线与水平线在煤柱一侧的夹角。 充分采动角:在充分采动条件下,地表移动盆地平地边缘点至采空区边界连线与煤层在采空区一侧的夹角。 以上各角又都分为上山、下山和走向三角。 最大下沉角:非充分采动时,地表移动盆地中心区的最大下沉点至采空区中心点的连线与水平线在下山方向的夹角。充分采动
时,在松散层不厚情况下,可依据上下山充分采动角作两直线,其交点至采空区中点连线与水平线在下山一侧的夹角。 开采影响传播角:充分采动时,倾向主断面上地表最大下沉值与该点水平移动值的比值的反正切值。 关于最大下沉角和开采影响传播角,有些书和文章不加区分,其实从以上《规程》中的定义来看,一个通过作图得到,一个通过计算得到,二者从数值上是很可能不同的。 地表移动计算参数: 下沉系数:充分采动时,地表最大下沉值与煤层法线采厚在铅垂方向投影长度的比值。 水平移动系数:充分采动时,走向主断面上地表最大水平移动值与地表最大下沉值的比值。 主要影响角正切:走向主断面上走向边界采深与其主要影响半径之比。在概率积分法预计时,不用边界角、移动角和裂缝角作为预计参数而一般采用主要影响角正切作为预计参数。 注意:主要影响角与下山移动角是不同的概念。 拐点偏距:下沉曲线的几何拐点与煤壁在水平方向上的偏离距离(偏向采空区)。 对于以上计算参数,《规程》给出了根据地表移动观测站数据计算的方法。对于缺少实际观测资料的矿区,可采用覆岩综合评价系数P及地质、开采技术条件来确定地表移动计算参数(见《规程》)。《规程》还给出了煤层群条件下,如果下层煤开采的影
第三章上覆岩层运动与矿山压力及其显现的关系 采场矿山压力研究的基本任务,一是为回采工作面顶板控制服务,解决顶板控制方案及支护选型计算等方面的问题,二是为回采工作面周围巷道矿山压力控制服务,解决巷道布置和维护方面的问题。 除直接顶外,其它岩层的运动很难在井下直接看到,但是可以通过回采工作面和采场周围巷道中比较容易观测到的顶底板位移和支架承载等压力显现,根据矿压显现,可以推断矿山压力的分布、上覆岩层运动,为采场矿山压力控制设计提供基础。因此,“上覆岩层运动与矿山压力及其显现的关系”是“反演”和“正演”岩层运动及其运动结果的理论基础。 第一节矿山压力与矿山压力显现[2] 正确地建立“矿山压力”及“矿山压力显现”的基本概念,弄清它们之间的联系及区别,是正确进行矿山压力控制研究和实践的基础。 一、矿山压力 在煤或岩层中开掘巷道和进行回采工作称为对煤(或岩)层的“采动”。采动后在煤(或岩)层中形成的空间称为“采动空间”。采动空间周围岩体(包括顶板、底板及两帮的岩层),统称为“围岩”。 煤及岩层采动前,一般都在覆盖重力、构造运动作用力等作用下,处于三向受力的原始平衡状态。煤及岩层采动后,由于支承条件的改变,其原始平衡即遭破坏,各岩层边界上的作用力及分布在各点的应力(包括大小及方向)随之改变。采动后重新分布于围岩各个层面边界上的力及岩层中各点的应力将促使该部分岩体产生变形或遭到破坏,从而向已采空间运动。采动后作用于岩层边界上或存在于岩层之中的这种促使围岩向已采空间运动的力(采动后促使围岩运动的力),称为矿山压力。 二、矿山压力显现 (一)矿山压力显现的概念 采动后,在矿山压力的作用下通过围岩运动与支架受力等形式所表现出来的矿山压力现象,称为“矿山压力显现”。 (二)矿山压力与矿山压力显现间的关系[2] 研究与实践充分证明,矿山压力的存在是客观的、绝对的,它存在于采动空间的周围岩体中。但矿山压力显现则是相对的、有条件的,它是矿山压力作用的结果。然而围岩中有
第三章采煤工作面上覆岩层移动规律 第一节概述 一、煤层顶底板岩层的构成 煤层处于各种岩层的包围之中。处于煤层之上的岩层称为煤层的顶扳;处于煤层之下的岩层称为煤层的底板。 根据顶、底板岩层离煤层的距离及对开采工作的影响程度不同,煤层的顶、底板岩层可分为: (l)伪顶。紧贴在煤层之上,极易垮落的薄岩层称为伪顶。通常由炭质页岩等软弱岩层组成,厚度一般小于0.5m,随采随冒。 (2)直接顶。位于伪顶或煤层之上,具有一定的稳定性,移架或回柱后能自行垮落的岩层称为直接顶。通常由泥质页岩、页岩、砂质页岩等不稳定岩层组成,具有随回柱放顶而垮落的特征。直接顶的厚度一般相当于冒落带内的岩层的厚度。 (3)老顶。位于直接顶或煤层之上坚硬而难垮落的岩层称为老顶。常由砂岩、石灰岩、砂砾岩等坚硬岩石组成。 (4)直接底。直接位于煤层下面的岩层。如为较坚硬的岩石时,可作为采煤工作面支柱的良好支座;如为泥质页岩等松软岩层时,则常造成底臌和支柱插入底板等现象。 二、采煤工作面上覆岩层移动及其破坏 在采用长壁采煤法时,随着采工作面的不断向前推进,暴露出来的上覆岩层在矿山压力的作用下,将产生变形、移动和破坏。根据破坏状态不同,上覆岩层可划分为三个带(图3-l)。 冒落带。指采用全部垮落法管理顶板时,采煤工作面放顶后引起的煤层直接顶的破坏范围(图3-l,Ⅰ)。该部分岩层在采空区内已经垮落,而且越靠近煤层的岩石就越紊乱、破碎。在采煤工作面内这部分岩层由支架暂时支撑。 裂隙带。指位于冒落带之上、弯曲带之下的岩层。这部分岩层的特点是岩层产生垂直于层面的裂缝或断开,但仍能整齐排列(图3-l,Ⅱ)。 弯曲下沉带。一般是指位于裂隙带之上的岩层,向上可发展到地表。此带内
本科生科研训练 相似材料模拟实验 姓名:胡立龙 学号: 0809040107 院系:土木与交通学院 班级:灾防08-1班 学时: 成绩:
实验目的:了解相似材料模拟掩饰的基本原理和基本过程。 基本原理:相似材料模拟实验是采用与原理物理力学性质相似的材料,按一定的几何相似常数缩制成试验模型进行相应的目的的研究的一种试验方法。采用这种方法模拟覆岩采动过程,研究其变形破坏规律可以节省大量的观测费用,而且结果更加直观。 仪器设备:相似材料模拟实验台。 实验步骤: 1、了解配比变化对材料的物理力学性质的影响,包括骨胶比、灰膏比和用水量的影响; 2、根据试验要求,按比例配比,制作模拟材料,选定并准备好适应的骨料,胶结料,水等,制作出不同配比的材料试件,并进行编号; 3、待试件干燥后,对试件进行强度测试,根据强度相似指标要求,选定相似材料,按表中形式记录好相似材料配比及主要物理力学参数; 4、根据模型尺寸,按每分层厚度计算不同配比材料的用量(层厚度为20mm)。 实验数据:1、工作面的设计长度200m,推进尺度130m,煤层埋深51m,煤层平均厚度5m,用全部垮落法管理顶板,煤层一次采煤深度5m,表1-1为煤岩物理力学性质指标: 岩断厚度主要岩石容重(kg/m3)抗压强度风化段10-50 泥岩26 3-5
2、相似条件确定 (1)实验设备与材料:实验台尺寸200mm ×2000mm×2000mm ,实验材料:硅砂(Φ =0.1~0.35mm )、石灰、石膏、软木屑、四硼酸钠等; (2)主要相似 参数:αL =L H /L M ,L M -模型强度,L H -模型厚度 根据模拟工作面煤层厚度等参数,结合试验台几何尺寸,选几何相似常数αL =0.01; (3)容度相似常数:αL =γH /γM ,γH -原型容重,γM -模型容重工作面不同岩段岩石平均容重为26kg/m 3,,石灰,石膏,硅砂试验材料平均容重为17kg/m 3,容重相似常数为αr =26/17=1.5; (4) 强度相似常数:α,-原型强度,-模型强度 砂岩 26 6-10 未风化软岩 带 60-100 泥岩 26 12 砂岩 26 3 硬岩带 110-240 砂质页岩 26 10-17 砂质页岩 26 10-40 煤 层 段 顶板 油页岩 22 20-23 泥岩 26 10-15 煤层 煤 15 3 底板 砂岩 26 25-65(多30左右) 泥岩 26 26-30
Vol.38No.4Jul.2011水文地质工程地质 HYDROGEOLOGY &ENGINEERING GEOLOGY 第38卷第4期 2011年7月 多煤层开采覆岩移动及地表变形规律的 相似模拟实验研究 张志祥1,张永波1,赵志怀1,张利民 2 (1.太原理工大学水利科学与工程学院,太原030024;2.山西省交通设计研究院,太原030012) 摘要:以离石—军渡高速公路下伏康家沟煤矿采矿地质条件为原型,采用相似材料模拟实验方法,对多煤层开采引起的覆岩移动及地表变形规律进行了研究。相似模拟实验结果表明:多煤层开采条件下,随着煤层累计采厚的增加,采空区“三带”覆岩下沉量和采空区地表沉降量、地表倾斜变形、地表水平位移及地表曲率变形都呈增大趋势,采空区上覆岩体更加破碎, 地表变形更加强烈。研究成果可为高速公路下伏多煤层采空区的治理设计提供依据。关键词:多煤层开采;覆岩;相似模拟;采空区;变形 中图分类号:TD325.+ 2 文献标识码:A 文章编号:1000- 3665(2011)04-0130-05收稿日期:2010-07-13;修订日期:2010-10-28基金项目:国家自然科学基金资助项目(30470269) 作者简介:张志祥(1970-),男,硕士,讲师,主要从事工程地质 和岩土工程方面的教学和研究工作。E-mail :zhangzx666666@126.com 煤炭开采过程中产生的一系列覆岩移动及地表变形规律,受到了学者们的高度重视,如刘秀英等[1] 采 用相似模拟实验研究了辛置煤矿2204工作面采空区 覆岩的移动规律;刘瑾等[2] 进行了采深和松散层厚度 对开采沉陷地表移动变形影响的数值模拟研究;孙光 中等 [3] 采用数值模拟和相似材料模拟对巨厚煤层开 采覆岩运动规律进行了研究。以上研究主要是针对单一煤层开采进行的, 得出了许多有益的经验与结论,为指导单煤层开采及采空区地基处理等提供了参考。 近年来,随着我国煤炭开采强度的增大及开采深度的增加, 许多矿区形成了多煤层采空区。由于我国土地资源有限,许多高速公路不可避免地要通过多煤层采空区, 在建设过程中,有可能使原本相对稳定的采空区覆岩平衡遭到破坏,地表再次产生沉陷变形,危及公路的安全。由于单煤层开采覆岩移动及地表变形规律不同于多煤层开采, 加上各地采矿地质条件的差异,其成果对于多煤层来说,就失去了普适性。因此,研究多煤层开采覆岩移动及地表变形规律对保护高速公路的安全有重要的意义。已有学者对多煤层开采给予关注, 并取得一定成果。李全生等[4] 利用相似材料模拟 和数值模拟研究了多煤层开采相互采动的影响规律,为煤柱留设及确保巷道安全提供了参考;夏筱红等 [5] 进行了多煤层开采覆岩破断过程的模型试验与数值模拟研究,为安全回收煤炭资源提供了依据。二者都是以指导采煤为目的,对高速公路下伏多煤层覆岩移动研究有一定的借鉴, 但由于没有考虑采空区的地表变形,不便于具体指导高速公路下伏采空区治理。目前,高速公路下伏多煤层开采覆岩移动及地表变形规律研究成果仍然很少。为确保高速公路的安全,非常有必要开展这项研究。离石—军渡高速公路LK21+340 LK21+900段通过康家沟煤矿采空区,该矿主要开采4号、5号和10号煤层。本文采用相似材料模拟实验方法,对康家沟煤矿多煤层开采覆岩移动及地表变形规律进行了研究,以期为高速公路下伏多煤层采空区治理设计提供依据。 1研究区地质概况 研究区位于吕梁山脉中段西侧黄土丘陵区,地表 由黄土覆盖。地层自上而下为第四系、二叠系和石炭系,简述如下: (1)第四系中更新统离石组(Q 2l ):分布于塬、梁、峁及冲沟两侧,为风积及冲积形成,岩性以黄土为主,棕黄色、浅棕红色亚粘土,夹数层棕色古土壤层、钙质结核层及透镜状砂卵石层,硬塑-坚硬状态,柱状节理发育,多层结构类型。厚20 50m 。 (2)二叠系上统上石盒子组(P 2s ):岩性为灰绿、黄绿、灰紫色页岩与灰绿色长石石英杂砂岩互层,由下向上紫色页岩逐渐增多,浅黄、灰黄、浅灰色中细砂岩和泥岩组成。其底部标志层岩性为紫红色、灰黄色铝土质鲕粒泥岩,含丰富的铁锰质。本组厚度约390m 。
1.2. 2上覆岩层结构及运动规律研究现状 自采用长壁开采技术以来,回采工作面上覆岩层的结构及运动规律一直是采矿学科研究的核心问题之一。许多学者结合现场实测,通过理论分析、实验室模拟和数值分析等方法研究了上覆岩层的结构及运动规律,提出了许多有价值的理论和围岩控制技术。由于地质条件的差异较大、研究人员切入点的不同,形成了许多的假说和理论体系。这些研究成果都以不同方式回答了上覆岩层结构的形式问题,用以解释采场各种矿山压力现象,因此,这些假说和理论研究成果对岩层控制都具有一定的指导意义。 1916年德国的K. Stock提出悬臂梁假说,假说认为:工作面和采空区上方的顶板可被视为梁,它是一端固定于岩体内,另一端则处于悬升状态,当顶板由几个岩层组成时,形成组合悬臂梁,弯曲下沉后,受已垮落岩石的支撑,当组合悬臂梁的悬臂长度达到某个极限时,发生有规律的周期性折断,从而引起周期来压。此假说可以很好地解释工作面顶板下沉量和支架载荷随煤壁由近及远逐渐增大,同时还可以解释工作面的周期来压现象。该假说不足之处是计算的顶板下沉量和支架载荷与实际相差较大。 1928年,德国人哈克(w. Hack)和吉果策尔(G. Gilicer)提出了压力拱假说,假说认为:长壁工作面自开切眼起形成了压力拱,前拱脚位于煤壁前方,后拱脚位于采空区,在拱脚处形成应力增高区,拱内为应力降低区。压力拱随着工作面的推进而向前移动。压力拱假说能很好的解释围岩的卸载过程和原因,但不能解释上覆岩层的运动、变形
和破坏过程。 原苏联的r. H.库兹涅佐夫于1950--1954年提出了铰接岩块假说。此假说认为:上覆岩层的破坏可分为垮落带和规则移动带。垮落带又可分为整齐排列的上部分和杂乱无章的下部分,并且垮落带无水平方向有规律的挤压力。岩块之间相互铰合形成了一个多环节的铰链,并且有规则地在采空区上方逐渐下沉。该假说认为:工作面支架处于“给定载荷状态”和“给定变形状态”两种工作状态。所谓“给定载荷状态”就是当规则移动带下部岩层变形较小且未折断时,垮落带岩层和规则移动带可能发生离层,支架承受折断的垮落带岩层的全部重量的状态;所谓“给定变形状态”就是当直接顶受基本顶影响折断时,随着岩块的下沉支架所受的载荷和变形逐渐增大,直至岩块受到已垮落岩石的支承达到平衡为止,支架所的处的状态。该假说的不足之处是缺乏岩块间的力学分析。 50年代比利时学者A.拉巴斯提出了预成裂隙假说,该假说认为:回采工作面上覆岩层的连续性遭到破坏而成为非连续体,在工作面周围出现了应力降低区,应力增加区和采动影响区。随着工作面推进,三个区域相应的向前推移。由于上覆岩层内存在着各种裂隙,使岩体的变形类似于塑性体,这些岩石处于相互挤紧的状态形成了类似梁的平衡。在自重和上覆岩层作用下发生假塑性弯曲,当下部岩层下沉量大于上部岩层时便出现了离层。 70-80年代初,钱鸣高院士提出了岩体结构的“砌体梁”力学模型。该模型认为:回采工作面上覆岩层形成了垮落带、规则移动带、
万方数据
万方数据
万方数据
采矿工程相似材料模拟技术的发展及问题 作者:张羽强, 黄庆享, 严茂荣, ZHANG Yu-qiang, HUANG Qing-xiang, YAN Mao-rong 作者单位:西安科技大学,西安,710000 刊名: 煤炭技术 英文刊名:COAL TECHNOLOGY 年,卷(期):2008,27(1) 被引用次数:6次 参考文献(9条) 1.刘长武;郭永蜂;姚精明采矿相似模拟试验技术的发展与问题[期刊论文]-中国矿业 2003(08) 2.李鸿昌矿山压力的相似模拟试验 1988 3.任晓鹏;李志强;吕希富龙马矿相似材料模拟实验[期刊论文]-煤炭技术 2007(08) 4.蔡美峰;刘相寿;黄志彬岩石力学与工程 2002 5.赵保太;林柏泉;林传兵三软不稳定煤层覆岩裂隙演化规律实验[期刊论文]-采矿与安全工程学报 2007(02) 6.顾大钊相似材料与相似模型 1995 7.吴钰应岩体结构面的模拟研究 1997(02) 8.催广心相似理论与模型研究 1990 9.林韵梅实验岩石力学模拟研究 1984 本文读者也读过(10条) 1.刘长武.郭永峰.姚精明采矿相似模拟试验技术的发展与问题--论发展三维采矿物理模拟试验的意义[期刊论文]-中国矿业2003,12(8) 2.夏小刚.黄庆享.XIA Xiao-gang.HUANG Qing-xiang基于弹性薄板的不规则采动地表沉陷预计模型[期刊论文]-中国地质灾害与防治学报2009,20(2) 3.黄庆享浅埋煤层采动厚砂土层破坏规律模拟[期刊论文]-长安大学学报(自然科学版)2003,23(4) 4.黄庆享.李冬.秦晓强.胡耀.樊树康.吕荣辉急倾斜临界角沿空回采巷道矿压显现规律[期刊论文]-建井技术2005,26(6) 5.黄庆享.陈杰.杨宗义浅埋厚煤层分层开采合理隔离煤柱尺寸模拟研究[期刊论文]-西安科技学院学报 2001,21(3) 6.黄庆享.刘玉卫.HUANG Qing-xiang.LIU Yu-wei高地应力软岩巷道变形机理与对策[期刊论文]-陕西煤炭 2009(2) 7.黄庆享.严茂荣.张沛.张羽强铁路下综放全厚开采的模拟研究[期刊论文]-陕西煤炭2008,27(4) 8.王双明.范立民.黄庆享.侯恩科生态脆弱矿区大型煤炭基地建设的新思路[期刊论文]-科学中国人2009(11) 9.黄庆享.蔚保宁.胡火明.HUANG Qing-xiang.WEI Bao-ning.HU Huo-ming榆树湾首采面保水开采矿压规律[期刊论文]-陕西煤炭2009,28(1) 10.李虎威.黄庆享.高杨.LI Hu-wei.HUANG Qing-xiang.GAO yang基于ZigBee和以太网的矿山安全监测系统[期刊论文]-陕西煤炭2009(3) 引证文献(6条) 1.陈南南.吕磊缓倾斜煤层相似材料模拟试验研究[期刊论文]-陕西煤炭 2012(2) 2.张飞.巴蕾.岑旺路天煤矿1604综放工作面的相似材料模拟[期刊论文]-现代矿业 2010(4) 3.汪锐.李路锚索减跨效果模拟试验研究[期刊论文]-中国矿业 2013(6) 4.胡鹏瑞.李航空.赵亮黄玉川矿首采工作面相似材料模拟研究[期刊论文]-黑龙江科技信息 2012(36)
相似材料模拟实验
实验十:相似材料模拟实验 1 相似原理 相似材料模拟是科学实验的一种,它是人们探讨和认识地压规律的途径之一。用与天然岩石物理力学性质相似的人工材料,按矿山实际原型,遵循一定比例缩小做成的模型,然后在模型中开挖巷道或模拟采场工作,观察模型的变形,位移,破坏和压力等情况,据以分析,推测原型中所发生的情况,这种方法称为相似材料模拟方法。它被用来研究采场和巷道的某些地压问题,例如估计地压大小,顶底板相对位移,冒落拱形状和大小,支架对地压底影响,地下开采对地表底影响,以及影响地压底各种因素。 要使模型中所发生的情况,能如实反映原型中所发生的情况,就必须根据问题的性质,找出主要矛盾,并根据主要矛盾,去确定原型与模型之间的相似关系和相似准则,原型与模型相似必须具备下面几个条件。 1.1 几何相似 要求模型与原型的几何形状相似。为此,必须将原型的尺寸,包括长,宽,高等都按一定比例缩小或放大,以做成模型。设以H L 和M L 分别代表原型和模型长度,脚标M 表示模型,L α代表H L 和M L 的比值,称长度比尺,则几何相似要求,L α为常数。 常数== M H L L L α (1) 因面积是长度二次方,所以面积比尺为 2 L M H A A α= (2) 因体积是长度三次方,所以体积比尺为
3 L M H V V α= (3) 一般来说,模型越大,越能反映原型的实际情况,原型实际上1 =L α ,但是由于各方面条件限制。 模型又不能做的太大。通常模拟采场用100 ~50=L α , 即原型缩小1001 ~ 501,模型巷道用50 ~20=L α;即原型缩 小为50 1 ~ 201。 1.2 运动相似 要求模型与原型中,所有各对应点的运动情况相似,即要求各对应点的速度,加速度,运动时间等都成一定比例。设以H t 和M t 分别表示原型和模型中对应点完成沿几何相似的轨迹所需的时间,以t α代表H t 和M t 的比值,称为时间比尺,则运动相似要求t α为常数。即 常数=== L M H t t t αα (4) 1.3 动力相似 要求模型与原型的所有作用力都相似 对于地压问题,按抓主要矛盾的观点进行分析,主要是考虑重力作用,要求重力相似设以H H H V r P ,,和M M M V r P ,,分别表示原型与模型对应部分的重力,视密度和体积,因为 H H H V r P ?= (5) M M M V r P ?= (6) 则: 3L M H M r r P P α?=
工作面相似模拟实验方案研究 1 试验研究内容 (1)顶板的初次来压步距、冒落带裂隙带高度及分布形态; (2)煤层上山煤柱的留设。 (3)沿煤层推进方向支承压力的分布曲线。 2 相似模拟试验原理 相似材料模拟试验结果的可靠性取决于模型与原型之间的相似程度。相似材料模拟试验的基本原理是相似理论,其主要原理是三个基本相似定律:(1)相似第一定律(相似定律):对于两个相似的力学系统,在任一力学过程中,它们对应的长度、时间、力和质量等基本物理量应当具有:几何相似、动力相似和运动相似。 (2)相似第二定律(Π定律):两个相似现象的基本物理方程可以用量纲分析的方法进行转换。对于所研究的对象,尚无法建立描述其特性的表达式,但知道决定其意义的物理量,就可以通过量纲分析的方法,确定相似判据,从而为建立模型与原型之间的相似关系提供依据。 (3)相似第三定律(相似存在定律):只有具有相同的单值条件和相同的主导相似判据时,现象才互相相似。其中,单值条件为:①原型与模型的几何条件相似;②在所研究的过程中具有显著意义的物理常数成比例;③二个系统的初始状态相似;④在研究期间两个系统的边界条件相似。主导相似判据为系统中具有重要意义的物理常数和几何性质组成的判据。 本方案依据相似定律,对于两个相似的力学系统,在任一过程中,它们相对应的长度、时间、力及质量的基本物理量满足如下关系: 在同一特征和现象中,如表征现象的所有物理量在空间上所对应的各点和在时间上对应的瞬间各自互成一定比例,则现象相似。相似现象的基本性质和被研究对象之间的相似特征可以用相似定理或理论来表示。 鉴于相似材料模拟的特点,模拟试验应满足:几何相似、运动相似、动力相似、边界条件相似、对应的物理量成比例,因此: (1) 岩石的变形特征相似,即模型上任一点、任一时刻的应变与原型上的点应变相似。 (2) 根据试验目的,在选择相似材料的要求上,由于条件限制,仅以强度(抗拉或抗压)指标作为主导特征。 (3) 模型线比
1、充分采动的概念防治煤矿开采引起地表沉陷的主要措施有哪些? 什么是充分采动?防治煤矿开采引起地表沉陷的主要措施有哪些? 充分采动:当采空区尺寸(长度和宽度)相当大时,地表最大下沉值达到该地质条件下应有的最大值,不再随开采范围扩大而增加,此时的采动称为充分采动。 1、留煤柱开采。 1)部分开采。 (1)条带开采。沿煤层走向或倾向,将开采区域划分为若干个宽度相等或不等的条带,开采一条,保留一条,利用留下的煤柱支撑顶板,以达到减小地表沉陷的目的。成功关键在于合理设计采宽与留宽,确保覆岩主关键层和留设煤柱的稳定性。 (2)房柱式开采。在煤层内开掘一些列煤房,留下近似于矩形的煤柱来支承顶板,达到控制顶板和减轻地表沉降的目的。 2)留设保护煤柱。地面存在重要的需要保护建(构)筑物时,在其下部对应煤层的合理位置预留一定尺寸的煤柱,使岩层移动影响边界达不到该建(构)筑物。煤柱留设主要根据具体矿井条件和岩层移动角等参数进行设计。 2、充填开采。 1)采空区充填。即用充填料充填已采空间,相当于减小煤层开采厚度。按运送充填物料动力的不同分水力、风力、机械和自溜充填;按充填材料分为水砂、矸石、膏体充填。 2)覆岩离层区充填。利用岩移过程中覆岩内形成的离层空洞,总钻孔向离层空洞充填外来材料来支撑覆岩,从而减缓覆岩移动往地表的传播。 3、调整开采工艺和参数。 1)协调开采:根据开采引起地表移动与变形的分布规律,通过合理的开采布局、开采顺序、方向、时间等方法减缓和减少开采引起的地表变形。 ①减小开采边界影响的叠加。 ②多工作面协调开采。 ③对称背向开采。 2)控制开采 ①限厚开采。 ②分层间歇开采。 2、简述岩层移动规律 采用全部垮落法管理采空区的情况下,根据采空区覆岩移动破坏特点,可以分为“三带”,即垮落带、裂隙带、弯曲带。其特点如下 垮落带:破断后的岩块呈不规则垮落,排列也极不整齐,松散系数比较大,一般可达1.3之1.5.经重新压实后,碎胀系数可降到1.03左右。 裂隙带:岩层破断后,岩块仍整齐排列的区域即为裂隙带。它位于冒落带之上,由于排列比较整齐,因此碎胀系数比较小。关键层破断块体有可能形成“砌体梁”结构。垮落带与裂隙带合称为“两带”又称“导水裂隙带”,意指上覆岩层含水层位于“两带”范围内,将会导致岩体水通过岩体破断后的裂缝流入采空区和回采工作面。 “两带”高度与岩性和煤层采高有关,覆岩岩性越坚硬,高度越大。 弯曲带:自裂缝带顶界到地表的所有岩层称为弯曲带。弯曲带内岩层移动的显著特点是,岩层移动过程的连续和整体性,即裂缝带顶界以上至地表的岩层移动是成层地、整体性地发生的,在垂直刨面上,其上下各部分的下沉值很小。若存在厚硬的关键层,则可能在弯曲带内出现离层区。
采场上覆岩层垮落步距计算方法 摘要:影响采场的运动岩层由直接顶和老顶组成。本文主要利用“板”模型和“梁”模型对直接顶初次垮落步距、老顶初次来压步距和老顶周期来压步距进行推算,为工作面顶板管理提供技术支持,确保采煤工作面安全生产。 关键词:板模型;梁模型;直接顶初次垮落步距;老顶初次来压步距;老顶中期来压步距 1 直接顶初次垮落步距 初次运动阶段,直接顶将首先垮落。工作面从开切眼开始推进,直接顶悬露跨度增大,当达到其极限跨度时直接顶将垮落。直接顶初次垮落标志是:直接顶垮落长度达工作面长度一半,垮落高度达1m 以上。直接顶初次垮落时,从开切眼到支架后排放顶线的距离叫做直接顶初次垮落步距。 直接顶初次垮落又称工作面初次放顶。直接顶初次垮落步距是衡量顶板完整程度的重要指标。直接顶的初次垮落现象是一种典型的矿压显现。 1.1 利用“板”模型计算 将直接顶视为工作面上方的“板”,利用弹性力学理论推导得到的“板”极限破坏步距公式进行计算求解。 b L oz /23ββ -= ,α γσβcos 3.14km t = (1) 式中,oz L 为直接顶初次垮落步距;t σ为岩层抗拉强度;k 为岩层的龟裂系数,k =0.25~0.75;m 为岩层厚度;b 为工作面斜长,;γ为岩层容重;α为工作面倾角。根据具体工作面几何尺寸、直接顶厚度以及岩性,取得式中参数,计算出结果。 1.2 利用“砌体梁”结构模型计算 1.2.1 按固支梁计算 q R h L t 21= (2) 1.2.2 按简支梁计算 q R h L t 321= (3)
1.2.3 考虑最大剪应力计算 q hR L s 341= (4) 式中,1L 为直接顶初次垮落步距;h 为直接顶厚度;t R 为岩层抗拉强度;s R 为岩层抗剪强度;q 为直接顶所承受的载荷。 采场覆岩中的任一岩层所承受载荷除自重外,一般还受上覆临近岩层的相互作用所产生的载荷。一般来说,采动岩层的载荷是非均匀分布的,但为了分析问题的方便,假设岩层载荷为均匀分布。 假设煤层上方共有m 层岩层,如图1所示。 考虑第n 层对第1层影响形成的载荷,按下式计算: () ()3 32 23 1 122113111 n n n n n h E h E h E h h h h E q +?+++?++= γγγ (5) 式中,i E 为岩层的弹性模量;i h 为岩层的厚度;i γ为岩层的容重。 当()11+n q <()1n q 时,说明第n+1层对第1层载荷不起作用。此时,直接顶所承受载荷为q =1q +()1n q 。 q m n 21 …… 图1 岩层载荷计算图 显然,在同样的条件下,由简支梁计算所得直接顶初次垮落步距要比由固支梁计算所得的小。在一般情况下,由于弯矩形成的极限跨度要比剪切应力形成的极限跨度小,因此常按弯矩来计算直接顶初次垮落步距。在什么条件下应按简支梁或按固支梁计算,需根据煤层赋存深度及边界煤柱两侧采空的情况来定。 1.3 利用“传递岩梁”理论计算
2010年《开采损害学实验》 一、实验名称:蒲白矿务局马村矿西固镇下煤层开采 二、实验目的:本次实验以马村矿西固镇下煤层开采为模拟对象,本次实验的主要目的是测定煤柱所受压力及其煤柱的稳定性和地表的沉陷情况。 三、主要实验仪器、设备 XKY021型应变桥智能数据采集仪,电脑,YHD-50型位移计,BW型箔式微型压力盒,数据转换仪,P20R-17型预调平衡箱,YJD-17型静动态电阻应变仪 四、实验模型采用的相似条件及原理 ⑴相似条件 根据模拟开采长度和煤层的埋深,本次的实验采用3m长,2.5m高,20cm宽的模型架。模拟煤层的埋深为238.7m,从地表至煤层底板共29个岩层,其中有些岩层厚度较小或有的岩层和相邻岩层的岩性相近按同一岩层计算,模型比例1:150,模型顶板高度为1.6m。 ⑵模型材料的配比原理 模型材料配比的理论根据是相似三大定律。其中运动学相似在本次模拟中很显然满足,不再加以赘述。 根据以上要求,本次实验所采用的主要材料如下:主料砂;辅料大白粉、熟石膏、云母、水,其中煤层的配比时要加入粉煤灰。由于模型材料的主料是砂,辅料占比重较少,不影响模型材料的比重,所以,除煤层外,其它各层的比重均按1600kg/m3计算。 根据以上相似比计算公式和各岩层的岩石物理力学性质,可计算出模拟实验各岩层相似材料配比具体见表1。
表1 模拟实验各岩层相似材料配比 注:其中煤的配比中,需加入17.28kg的粉煤灰 五、模拟实验现象及数据分析 ⑴实验现象 在开采过程中下沉数据和煤柱应力的记录应考虑气温的变化所引起的模型支架钢梁的
伸缩对测量数据的影响,所以本次实验规定在中上午11:00记录数据,且在开采过程中记录模型岩层所发生的变化。 ⑵数据分析 模拟实验数据分析,可分为两大部分,煤柱稳定性、煤柱所受应力分析和地表沉陷分析。通过分析确定煤柱的稳定性、分布的合理性及控制覆岩变形破坏程度的能力。 ①煤柱稳定性、煤柱所受应力数据分析 煤柱应力采用两组共10个应变块测定,采用应变桥智能数据采集仪采集,以数据库的形式保存。p0~p4的一组应变片放在第三个煤柱下,p5~p9的一组应变片放在第五个煤柱下。p0~p4这一组应变片从开采第一个工作面到开采第四个工作面的压力变化如下图所示,由应力图1可知,在开采第一个工作面时,第三个煤柱的应力分布已发生了变化,但变化很小;当开采到第二个工作面时,第三个煤柱的压力分布又重新发生分布,较第一次分布变化要大;当开采到第三个工作面时,第三个煤柱的压力分布发生了明显的变化,靠近工作面一边的煤柱边缘已产生了塑性区,压力值已降到均值以下,只有残余强度提供支承顶板的力,第二个应变片的压力值显著增加,第三、四、五个应变片的应力值又逐渐向原岩应力值过渡,但比原岩应力值稍高;当开采到第四个工作面时第一组应变片的压力分布值又发生大的变化,出现两个峰值区,两个塑性区,压力分布图呈马鞍形。 第二组应变片置于第五个煤柱下,当回采第三个工作面时,压力分布开始发生变化,对应于每一阶段的应力曲线图和第一组的应力曲线图类似,不同的一点是第二组的应力曲线图的峰值比第一阶段的峰值稍大。这种不同是由于每个开采条带的宽度不同而引起的(图2)。 根据模拟实验的现场观测和实验数据的分析,可以确定所留煤柱具有足够的稳定性和强度支撑顶板。但根据应力曲线图也可以断定,就所观测的这两个煤柱都不同程度的出现了塑性区。但就目前塑性区宽度的测量还没有很好的方法。塑性区宽度的确定,可按照英国A.H.威尔逊分式计算。屈服区宽度Y与开采深度H和开采厚度m有关,其关系式为: Y=0.0049mH,最后可估算得一边塑性区的宽度为5.22m,两边的塑性区的宽度和为10.44m,核区宽度为14.36m。
中盛上行开采相似模拟实验报告 1.相似模拟实验的目的 根据横向课题《近距离煤层群上行复采薄煤层可行性研究》的研究需要,并结合现场的实际要求,针对山西汾西矿业中盛煤矿的煤层地质赋存条件,进行近距离煤层群上行开采的三维相似材料模拟实验。 主要研究目的是: ●分析10#煤开采对上部9#、7#煤层的影响,判断上部煤层的整体性及可采性。 ●测定10#煤开采过程中上部煤层的应力变化规律和位移变化,分析极近距离煤层群 上行开采的卸压特征。 实验时间:3D相似模型于2011年11月日开始铺设,历时日完成,2011年11月日进行模拟开挖实验。 主要实验设备: 3D模拟实验台 7V14数据自动采集系统及数据处理系统 位移计和应力传感器(压力盒和直角应变花) 照相机 实验原型基本条件:实验原型为山西汾西矿业中盛煤矿7#、9#、10#煤层。 1、7#煤层 位于太原组中部,K4与K3石灰岩之间,下距9#煤层19.50~26.30m,平均22.60m。煤层厚0.10~1.95m,平均1.11m。一般含0~1层夹石,局部达2层,结构简单,属不稳定的局部可采煤层。顶板一般为泥岩,底板多为中粒砂岩。 2、9#煤层 位于太原组下部,下距10#煤层4.80~7.83m,平均6.45m。煤层厚0~1.10m,平均0.90m,不含夹石,结构简单,该煤层可采范围分布于井田中东部,可采面积 2.139km2,属较稳定的局部可采煤层。顶板为石灰岩,底板一般为泥岩。 3、10#煤层 位于太原组下部,下距11#煤层6.76~13.82m,平均11.20m。煤层厚0.85~2.62m,平均1.86m。一般含0~1层夹石,局部达两层,结构简单。顶板一般为泥岩,底板为泥岩或细粒砂岩,属全区稳定可采煤层。该煤层于原矿区内已大部采空,仅西南部有小部分未开采地段。 复采煤层特征见表1所示。 表1复采煤层特征表
第十三章岩层移动与保护煤柱 一、学习目的与要求 1.了确岩层与地表移动概念。 2.掌握保护煤柱的留设方法 二、课程内容与知识点 第一节岩层与地表移动概念 一、概述 当采空区范围很大时,岩层移动过程发展到地表,在地表形成一个范围较大的洼地。这个洼地就是通常所说的地表移动盆地。 影响岩层与地表移动的因素很多,主要有岩石的物理力学性质;煤层的倾角、开采煤层的厚度及开采深度;采空区的形状、大小及采煤方法;地表的地形条件以及地质构造、水文地质条件,等等。它们综合影响着岩层与地表移动过程。为了工程上的需要,人们把上覆岩层的移动形态划分为冒落带Ⅰ、裂隙带Ⅱ和弯曲带Ⅲ(图13-1)。 根据岩层与地表移动的规律,研究建筑物下、铁路下、水体下(简称三下)的采煤方法与措施,以便安全、合理地开采出地下煤炭资源。 二、地表移动盆地与移动角 研究岩层与地表移动的主要任务,就是观测移动盆地的变形规律,确定各种移动参数。 1.移动盆地的特征 移动盆地的形状,主要取决于采空区的形状和煤层的倾角。当采空区为长方形时,移动盆地大致车工椭圆形,其面积总是大于采空区的面积。当开采水平煤层时,移动盆地的中心即为采空区的中心;当开采倾斜煤层时,移动盆地向下山方向便宜,地表移动盆地和采空区的位置互不对称(图13-2和13-3)。
2.移动盆地的主断面 为了表示移动盆地的特征,通过移动盆地的最大下沉点,分别作平行于煤层走向和倾向的断面,称为走向主断面和倾向主断面。主断面上既可以反映出移动盆地的最大范围,又可以反映出地表的最大移动量。这样,我们就可以沿主断面设置地表移动观测站,研究移动盆地的变形规律。 倾向主断面的位置在采空区的中央;走向主断面的位置,可由图13-3中的θ角来决定,θ角为倾向主断面舢板感最大下沉点与采空区中心连线的倾角,称为最大下沉角。 θ角值可以从实际观测资料中求得,也可以按下列近似公式计算: 当α<45°时,θ=90°-0.5α 当α>45°时,θ=90°-(0.4~0.2)α 式中α——煤层倾角。
相似材料模拟实验精选 文档 TTMS system office room 【TTMS16H-TTMS2A-TTMS8Q8-
实验十:相似材料模拟实验 1 相似原理 相似材料模拟是科学实验的一种,它是人们探讨和认识地压规律的途径之一。用与天然岩石物理力学性质相似的人工材料,按矿山实际原型,遵循一定比例缩小做成的模型,然后在模型中开挖巷道或模拟采场工作,观察模型的变形,位移,破坏和压力等情况,据以分析,推测原型中所发生的情况,这种方法称为相似材料模拟方法。它被用来研究采场和巷道的某些地压问题,例如估计地压大小,顶底板相对位移,冒落拱形状和大小,支架对地压底影响,地下开采对地表底影响,以及影响地压底各种因素。 要使模型中所发生的情况,能如实反映原型中所发生的情况,就必须根据问题的性质,找出主要矛盾,并根据主要矛盾,去确定原型与模型之间的相似关系和相似准则,原型与模型相似必须具备下面几个条件。 几何相似 要求模型与原型的几何形状相似。为此,必须将原型的尺寸,包括长,宽,高等都按一定比例缩小或放大,以做成模型。设以H L 和M L 分别代表原型和模型长度,脚标M 表示模型,L α代表H L 和M L 的比值,称长度比尺,则几何相似要求,L α为常数。 常数== M H L L L α (1) 因面积是长度二次方,所以面积比尺为 2 L M H A A α= (2) 因体积是长度三次方,所以体积比尺为 3 L M H V V α= (3) 一般来说,模型越大,越能反映原型的实际情况,原型实际上1=L α,但是由于各方面条件限制。模型又不能做的太大。通常模拟采场用 100~50=L α,即原型缩小 100 1 ~ 501,模型巷道用50~20=L α;即原型缩小为50 1 ~ 201。 运动相似 要求模型与原型中,所有各对应点的运动情况相似,即要求各对应点的速度,加速度,运动时间等都成一定比例。设以H t 和M t 分别表示原型和模型中对应点完成沿几何相似的轨迹所需的时间,以 t α代表H t 和M t 的比值,称为时间比尺,则运动相似要求t α