
TOPICAL REVIEW—Magnetism,magnetic materials and interdisplinary research
Magnetocaloric effects in RT X intermetallic compounds (R=Gd–Tm,T=Fe–Cu and Pd,X=Al and Si)
Zhang Hu(张虎)a)b)?and Shen Bao-Gen(沈保根)b)?
a)School of Materials Science and Engineering,University of Science and Technology of Beijing,Beijing100083,China
b)State Key Laboratory for Magnetism,Institute of Physics,Chinese Academy of Sciences,Beijing100190,China
(Received11October2015;revised manuscript received20October2015;published online10November2015) The magnetocaloric effect(MCE)of RT Si and RT Al systems with R=Gd–Tm,T=Fe–Cu and Pd,which have been widely investigated in recent years,is reviewed.It is found that these RT X compounds exhibit various crystal structures and magnetic properties,which then result in different https://www.doczj.com/doc/c011179092.html,rge MCE has been observed not only in the typical fer-romagnetic materials but also in the antiferromagnetic materials.The magnetic properties have been studied in detail to discuss the physical mechanism of large MCE in RT X compounds.Particularly,some RT X compounds such as ErFeSi, HoCuSi,HoCuAl exhibit large reversible MCE under low magnetic?eld change,which suggests that these compounds could be promising materials for magnetic refrigeration in a low temperature range.
Keywords:rare-earth compounds,magnetocaloric effect,magnetic entropy change,magnetic property
PACS:75.30.Sg,https://www.doczj.com/doc/c011179092.html,,75.50.Ee DOI:10.1088/1674-1056/24/12/127504
1.Introduction
Nowadays,magnetic materials have been widely used and impact almost every aspect in our society from household ap-pliances to aerospace sciences.The functional magnetic ma-terials,in particular,such as permanent magnets,soft mag-nets,and magnetic shape memory alloys,have played an es-sential role in the development of modern society.In recent years,magnetic refrigeration based on the magnetocaloric ef-fect(MCE)has been demonstrated to be a novel application of functional magnetic https://www.doczj.com/doc/c011179092.html,pared with conventional gas compression-expansion refrigeration,magnetic refrigera-tion has attracted considerable attention due to its great advan-tages in many aspects such as energy saving and environmen-tal friendliness.[1–3]As the core part of magnetic refrigeration technique,the magnetocaloric properties of magnetic materi-als greatly affect the performance of a magnetic refrigerator, and thus,it is important to develop magnetic refrigerants with large MCE.
Since the discovery of giant MCE in Gd5(Si1?x Gex)4,[4] a great deal of effort has been made to?nd suitable refrig-erants for room temperature magnetic refrigeration.[5–13]On the other hand,it is also signi?cant to search for suitable materials exhibiting large MCE at low temperature,due to their potential applications in gas liquefaction and scienti?c research.[2,14]Usually,the magnitude of MCE can be charac-terized by magnetic entropy change(?S M)and/or adiabatic temperature change(?T ad)upon the variation of magnetic ?eld.Thermodynamic analysis reveals that the maximum magnetic entropy value(S M)per mole of magnetic ions is equal to S M=R ln(2J+1),where R is the universal gas con-stant and J is the total angular momentum of a magnetic ion.[1] Therefore,a large?S M can be usually expected in the heavy rare earth-based materials due to the high magnetic moments of heavy rare-earth atoms.
In the past few years,many different rare earth(R)—transition metal(T)intermetallic systems have been reported to exhibit large MCE in a wide temperature range.[14–16] Among them,the ternary intermetallic RT X compounds(R =rare earth,T=transitional metal,X=p-block metal)have been studied extensively due to their interesting physical prop-erties and large MCE.It has been found that the magnetic mo-ments of RT X compounds are mainly contributed by the rare earth atoms,while the T and X atoms hardly contribute to the magnetic moments due to the hybridization between d states of T and p states of X atoms.However,the crystallographic structure would change with the variation of either T or X atoms,thus also affecting the magnetic properties and MCE of RT X compounds.Very recently,Gupta et al.[17]reviewed the magnetic and related properties of RT X compounds,and brie?y discussed the MCE.In the present paper,we give a comprehensive overview of the studies on the MCE of RT X intermetallic compounds(R=Gd–Tm,T=Fe–Cu and Pd,X =Al and Si),and this would be highly bene?cial for the future research on the MCE of RT X compounds.
?Project supported by the National Natural Science Foundation of China(Grant Nos.51371026,11274357,and51327806)and the Fundamental Research Funds for the Central Universities(Grant Nos.FRF-TP-14-011A2and FRF-TP-15-002A3).
?Corresponding author.E-mail:zhanghu@https://www.doczj.com/doc/c011179092.html,
?Corresponding author.E-mail:shenbg@https://www.doczj.com/doc/c011179092.html,
?2015Chinese Physical Society and IOP Publishing Ltd https://www.doczj.com/doc/c011179092.html,/cpb https://www.doczj.com/doc/c011179092.html,
2.MCE in RT Si compounds
Table1lists the nature of magnetic ground state,the or-dering temperature T ord,and the magnetocaloric properties for RT Si(R=Gd–Er,T=Fe–Cu)compounds.It is seen that the R FeSi and R CoSi compounds order ferromagnetically except HoFeSi,while the R NiSi and R CuSi compounds exhibit anti-ferromagnetic(AFM)ground state.The ordering temperature T ord decreases with the rare earth atom sweeping from Gd to Er.In contrast,the MCE increases greatly with the variation of rare earth atom from Gd to Er.It is interesting that large MCE can be observed not only in ferromagnetic(FM)RT Si but also in AFM RT Si compounds,which show?eld-induced metamagneic transition from AFM to FM states.
Table1.Magnetocaloric properties of RT Si(R=Gd–Er,T=Fe–Cu)compounds.
Materials Ground state T ord/K ??S M(J/kg·K)T ad/K RC/(J/kg)
Refs. 2T5T2T5T5T
GdFeSi FM130 6.011.3––373this work TbFeSi FM1109.817.5 4.18.2311[21] DyFeSi FM709.217.4 3.47.1308[21] HoFeSi FM+297.116.2––309[22] AFM/FIM20–5.6–6.0–––50[22] ErFeSi FM2214.223.1 2.9 5.7365[14] HoCoSi FM141320.5 3.1–410[33] ErCoSi FM 5.518.725.0––372[32] TbNiSi AFM14.8 1.79.4––182this work DyNiSi AFM8.812.122.9––434[37] HoNiSi AFM 3.817.526.0 4.58.5471[36] ErNiSi AFM 3.28.819.0 2.5[38]–309this work GdCuSi AFM14 2.69.2––194a[54] TbCuSi AFM11 2.710.0––246a[54] DyCuSi AFM1010.524.0––381[53] HoCuSi AFM716.733.1––385[15] ErCuSi AFM714.523.1–-471a[54]
a The RC values were estimated from the temperature dependence of?S M in the referenced literature.
In the following sections,the magnetocaloric properties of RT Si compounds,especially the ones with large MCE,will be discussed in detail.
2.1.R FeSi compounds
The crystal structure of CeFeSi and related compounds was?rst investigated by Bodak et al.in1970,[18]and they found that these compounds crystallize in the tetragonal CeFeSi-type structure(space group P4/nmm).In1992,Welter et al.[19]studied the magnetic properties of R FeSi(R=La–Sm, Gd–Dy)compounds by susceptibility measurements and neu-tron diffraction studies.It was found that the R FeSi(R=Gd, Tb,and Dy)exhibit the FM state below their respective T C. Later,Napoletano et al.[20]reported that GdFeSi undergoes a FM-paramagnetic(PM)transition around118K and presents a large–?S M of22.3J/kg·K and?T ad of4.5K for a high?eld change of9T.Especially,it shows a giant refrigerant capacity (RC)value of1940J/kg in the10K–160K temperature range for a?eld change of9T.Recently,Zhang et al.[14,21,22]inves-tigated the magnetic properties and MCE of R FeSi(R=Gd–Er)compounds systematically.The maximum–?S M values of GdFeSi are6.0J/kg·K and11.3J/kg·K for the?eld changes of2T and5T,respectively.In addition,the RC value,cal-culated by integrating numerically the area under the?S M–T curve with de?ning the temperatures at half maximum of peak as the integration limits,[23]is obtained to be373J/kg for a ?eld change of5T.
T K
T K
M
(
A
.
m
2
/
k
g
)
M
(
A
.
m
2
/
k
g
)
0306090120150
80120160200 35
30
25
20
15
10
5
4
3
2
1
GdFeSi
TbFeSi
DyFeSi
HoFeSi
ErFeSi
μ0H/ T
TbFeSi
DyFeSi
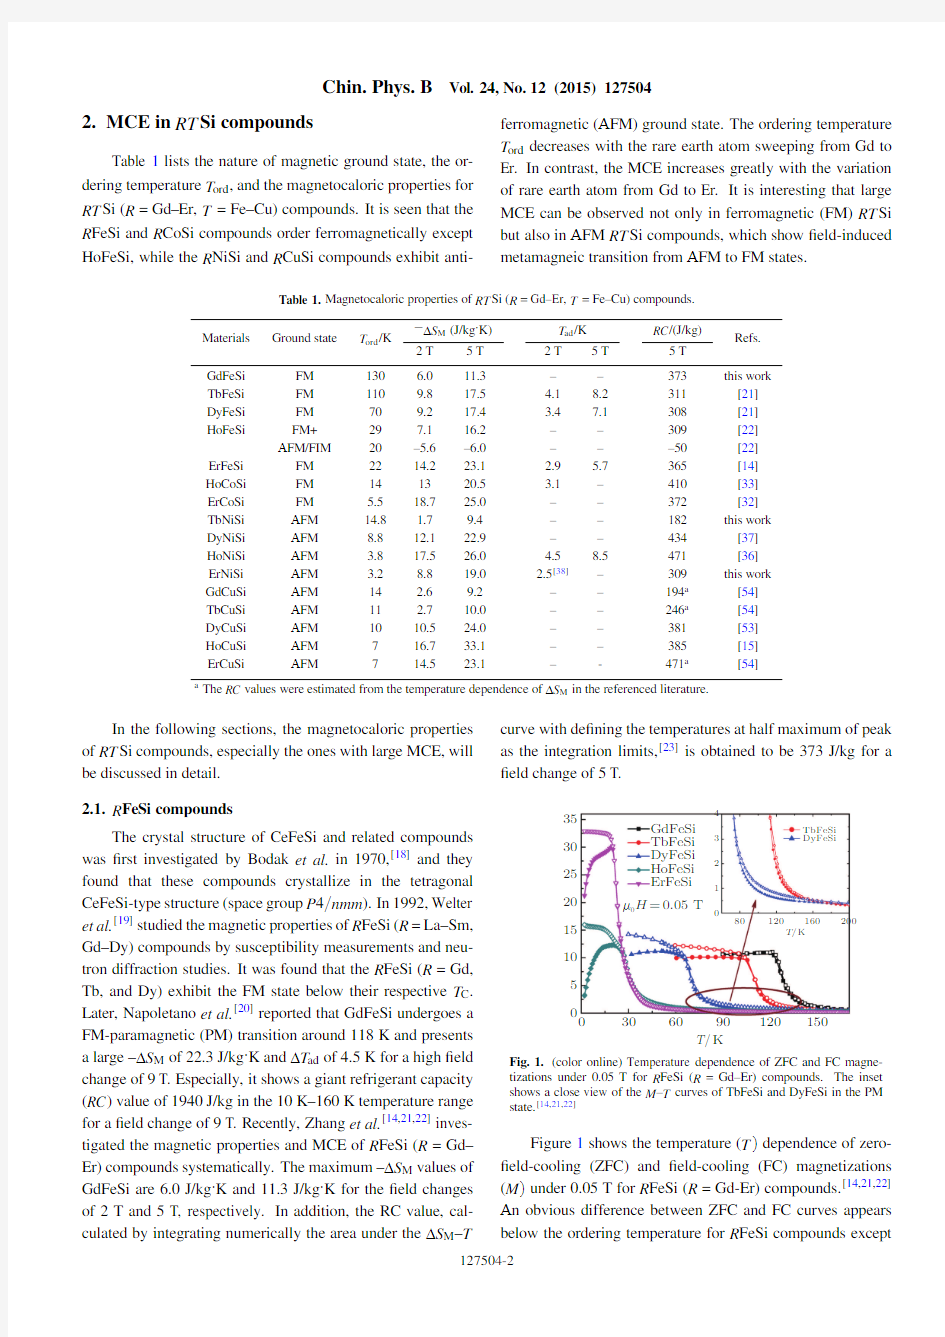
Fig.1.(color online)Temperature dependence of ZFC and FC magne-tizations under0.05T for R FeSi(R=Gd–Er)compounds.The inset shows a close view of the M–T curves of TbFeSi and DyFeSi in the PM state.[14,21,22]
Figure1shows the temperature(T)dependence of zero-?eld-cooling(ZFC)and?eld-cooling(FC)magnetizations (M)under0.05T for R FeSi(R=Gd-Er)compounds.[14,21,22] An obvious difference between ZFC and FC curves appears below the ordering temperature for R FeSi compounds except
GdFeSi,which may be due to the domain-wall-pinning ef-fect as usually observed in materials with low ordering tem-perature and high anisotropy.[14,24]The R FeSi (R =Tb and Dy)compounds experience a second-order FM–PM transition around the respective T C of 110K and 70K for TbFeSi and DyFeSi,which are quite close to the liquefaction tempera-tures of natural gas (111K)and nitrogen (77K).[21]In ad-dition,an unusual discrepancy between ZFC and FC curves can be observed in PM state of R FeSi (R =Tb and Dy)com-pounds,suggesting the existence of short-range FM correla-tions just above T C .[25]The magnetic entropy change S M of R FeSi (R =Tb and Dy)was calculated from the magnetiza-tion isotherms by using the Maxwell relation ?S M (T ,H )=μ0
H 0(?M /?T )H d H ,[26]and the temperature dependence of ?S M for TbFeSi and DyFeSi under different magnetic ?eld changes are shown in Fig.2(a).[21]It can be seen that TbFeSi and DyFeSi present large ??S M values of 5.3J/kg ·K and 4.8J/kg ·K for a low ?eld change of 1T,respectively.This large MCE under a low ?eld change is favorable to practical applications since the maximum ?eld of permanent magnets in market is usually lower than 2T.In addition,it is worth not-ing that the magnitude of MCE is nearly same for TbFeSi and DyFeSi.Therefore,a series of (Tb 1?x Dy x )FeSi compounds can be predicted theoretically to exhibit continuous ordering temperatures with similar magnitude of MCE.
T K
60
80
100120
T K
60
80
100
120
140
18
15129630
-D S M (J /k g .K )
6
54
321
-D S M (J /k g .K )
DyFeSi TbFeSi
1 T
2 T
3 T
4 T
5 T (a)
(b)
(Tb x Dy x )FeSi
composite
x/
x/ D x/
D 1 T μ0H/Fig.2.(color online)(a)Temperature dependence of ?S M for R FeSi (R =Tb and Dy)under different magnetic ?eld changes up to 5T.(b)Tem-perature dependence of calculated ?S M for (Tb 1?x Dy x )FeSi (x =0–1)compounds and the composite material under a magnetic ?eld change of 1T.[21]
Figure 2(b)shows the temperature dependence of calcu-lated ?S M of (Tb 1?x Dy x )FeSi compounds for a ?eld change of 1T.[21]Furthermore,a composite material can be formed based on this series of (Tb 1?x Dy x )FeSi compounds and the op-timum mass ratio y i of each component,determined by using a numerical method,[27]is as follows:y 1=19.43wt%,y 2=13.32wt%,y 3=13.47wt%,y 4=13.74wt%,y 5=15.08wt%,and y 6=24.96wt%for x =0,0.2,0.4,0.6,0.8,and 1.0,re-spectively.The ?S M of this composite is estimated by using
the equation ?S com =∑6i =1y i ?S i and is shown in Fig.2(b).
[21]The composite exhibits a constant ??S com of ~1.4J/kg ·K in a wide temperature range,thus resulting in a large RC of 64J/kg for a ?eld change of 1T,which is 49%and 64%higher than those of TbFeSi (43J/kg)and DyFeSi (39J/kg).Thermody-namic analysis indicates that a magnetic refrigeration system based on an ideal Ericsson cycle requires constant ?S M over a wide temperature range.[1]Therefore,the above result sug-gests that the composite of (Tb 1?x Dy x )FeSi can be a good can-didate for magnetic refrigerants for the Ericsson cycle over the liquefaction temperatures of nitrogen and natural https://www.doczj.com/doc/c011179092.html,rge reversible MCE for a relatively low magnetic ?eld change has also been observed in ErFeSi compound.[14]
010203040506070
T K
10
2030
405060
T K
25
20
15
1050
-D S (J /k g .K )
1 T
2 T
3 T
4 T
5 T (a)
(b)
ErFeSi
ErFeSi
6543210D T a d K
2 T 5 T
Fig.3.(color online)Temperature dependence of (a)?S M and (b)?T ad for ErFeSi under different magnetic ?eld changes.[14]
Figure 3shows the temperature dependence of ?S M and ?T ad of ErFeSi for different magnetic ?eld changes.[14]Here,the ?T ad was calculated from the heat capacity (C P )curves by using the equation ?T ad (?H ,T )=[T (S )H ?T (S )0]S .[26]For a magnetic ?eld change of 5T,the maximum values of ??S M and ?T ad around the T C =22K are 23.1J/kg ·K and 5.7K,re-spectively.Particularly,the ??S M and RC reach as high as
14.2J/kg ·K and 130J/kg,respectively,for a relatively low ?eld change of 2T.This large MCE around liquid hydrogen temperature (20.3K)indicates that ErFeSi could be a promis-ing material for magnetic refrigeration of hydrogen liquefac-tion.
Unlike other R FeSi compounds with FM ground state,HoFeSi exhibits a complex magnetic structure with FM and AFM/ferrimagnetic (FIM)moments at low temperatures.With the decrease of temperature,HoFeSi undergoes a PM–FM transition at T C =29K.Besides,another anomaly is found at T t =20K,which indicates that some magnetic moments in HoFeSi may experience an FM–AFM/FIM transition around T t .[22]
10203040506070
T K
123456
T K
K K K K K K 200160
120804001612
8
40-4-81009080
M (A .m 2/k g )
(a)
T T T T T (b)8
12
1620
24
P e r c e n t a g e o f F M p h a s e
-D S M (J /k g .K )
μ0H T
Fig.4.(color online)(a)Magnetization isotherms of HoFeSi compound in the temperature range of 8K–24K.The inset shows the fraction of FM phase as a function of temperature estimated from magnetization isotherms.(b)Temperature dependence of magnetic entropy change ?S M for HoFeSi compound under different magnetic ?eld changes up to 5T.[22]
Figure 4(a)shows the magnetization isotherms of HoFeSi in the temperature range of 8K–24K.[22]It is seen that the magnetization below 20K increases greatly at ?rst with in-creasing magnetic ?eld,corresponding to the typical FM be-havior.A ?eld-induced metamagnetic transition occurs at crit-ical ?eld with further increase of ?eld,suggesting the possi-ble presence of AFM or FIM components at low temperatures in HoFeSi compound.The fraction of FM components,es-timated by extrapolating the plateau of FM state to 5T,is about 79%at 8K and reaches nearly 100%when tempera-ture increases to 24K (see inset of Fig.4(a)).The tempera-ture dependence of ?S M for HoFeSi under different magnetic
?eld changes is shown in Fig.4(b).[22]It is noted that HoFeSi presents negative ?S M peak (normal MCE)around T C as well as positive ?S M (inverse MCE)around T t .For a relatively low ?eld change of 2T,the ?S M values are 5.6J/kg ·K at T t and ?7.1J/kg ·K at T C ,respectively.This special feature of succes-sive inverse and normal MCE in HoFeSi could be applied in some refrigerators with special designs and functions,which other materials with only normal MCE cannot satisfy.[28]2.2.R CoSi compounds
The crystal structures and magnetic properties of R CoSi compounds vary with the rare earth elements.Neutron diffrac-tion studies reveal that R CoSi (R =Gd and Tb)crystallize in the tetragonal structure of CeFeSi-type (space group P 4/nmm )and order antiferromagnetically below T N of 175K and 140K for R =Gd and Tb,respectively.[29]However,R CoSi (R =Dy,Ho,and Er)compounds have been reported to crystallize in the orthorhombic TiNiSi-type crystal structure and exhibit PM–FM transition at low temperatures.[30–32]Leciejewicz et al.[31]investigated the magnetic structure of HoCoSi by neu-tron diffraction and found that the magnetic moments order ferromagnetically below T C =13K.Besides,the magnetic moments of Ho atoms form a conical spiral at 1.7K,leading to the coexistence of the collinear FM structure and helicoidal structure.
0102030405060
T K
120100806040200
C P (J /k g .K )
12
8400
1020304050
T K
M (A .m 2/k g )
T t / K
T C / K
ZFC FC T
0 T 1 T 2 T 5 T
HoCoSi
Fig.5.(color online)Heat capacity (C P )curves for HoCoSi under differ-ent magnetic ?elds.The inset shows the temperature dependence of ZFC and FC curves for HoCoSi under the magnetic ?eld of 0.01T.[32]
In 2012,Xu et al.[32]further investigated the MCE of HoCoSi compound systematically by magnetization and heat capacity measurements.Figure 5displays the heat capacity (C P )curves for HoCoSi under different magnetic ?elds.[32]A distinct λ-type peak is observed around 11.2K in zero ?eld,corresponding to the second-order FM–PM transition.In addition,another anomaly is observed at T t =4K in the thermomagnetic curve (inset of Fig.5),corresponding to the critical temperature of the coexistence of the collinear FM structure and helicoidal structure.With the increase of mag-netic ?eld,the peak gradually becomes broader and lower
while it also moves to a slightly higher temperature,sug-gesting the typical characteristic of ferromagnet.[1]Based on the theory of thermodynamics,the ?S M and ?T ad val-ues can be calculated from the C P curves by using the fol-lowing equations ?S M (T )=
T 0[C H (T )?C 0(T )]/T d T and ?T ad (?H ,T )=[T (S )H ?T (S )0]S ,respectively.Figure 6shows the temperature dependence of ?S M and ?T ad for Ho-CoSi under different magnetic ?eld changes.[32]It is found that the ??S M and ?T ad reach as high as 26.3J/kg ·K and 11.0K for a magnetic ?eld change of 5T.Moreover,for a relatively low ?eld change of 2T,HoCoSi compound exhibits a giant MCE around T C =15K with the maximum ??S M of 17.3J/kg ·K and T ad of 6.2K.Very recently,Gupta et al.[33]also reported the MCE of HoCoSi compound and observed a large MCE without hysteresis loss around the T C of 14K.For a magnetic ?eld change of 5T,the maximum ??S M and RC values of HoCoSi are 20.5J/kg ·K and 410J/kg,respectively.
10
20
304050
T K
2824201612840121086420-D S M (J /k g .K )
D T a d K
1 T
2 T 5 T 1 T 2 T 5 T HoCoSi
HoCoSi
Fig.6.(color online)Temperature dependence of (a)?S M and (b)?T ad for HoCoSi under different magnetic ?eld changes.[32]
Xu et al.[32]further studied the effect of Er substi-tution on the magnetic and magnetocaloric properties in (Ho 1?x Er x )CoSi compounds.Figure 7shows the tempera-ture dependence of ZFC and FC magnetizations under 0.01T for (Ho 1?x Er x )CoSi compounds.[32]In addition to the FM–PM transition around T C ,all (Ho 1?x Er x )CoSi compounds ex-cept ErCoSi exhibit another anomaly at lower temperature T t ,which is related to the presence of magnetic helicoidal struc-ture.It is clearly seen that the transition temperatures de-crease linearly with the Er content increasing from 0to 1(in-set of Fig.7).Figure 8shows the temperature dependence of
?S M for (Ho 1?x Er x )CoSi compounds under a ?eld change of 2T.[32]For a ?eld change of 2T,the maximum ??S M values are 17.9,17.9,18.2,18.0,18.5,and 18.7J/kg ·K for x =0,0.2,0.4,0.6,0.8,and 1,respectively.It can be seen that (Ho 1?x Er x )CoSi compounds exhibit nearly the same magni-tude of MCE with increasing Er content.Meanwhile,the T C decreases from 15K to 5.5K with the variation of x from 0to 1.Therefore,a composite material can be constructed based on this series of (Ho 1?x Er x )CoSi compounds and ex-hibits a constant ?S M in the temperature range of 5.5K–15K,satisfying the requirement of Ericsson-cycle magnetic refrigeration.Similar research has also been carried out in (Ho 1?x Dy x )CoSi compounds.[32]However,single phase with tetragonal CeFeSi-type structure can not be obtained when Dy content is higher than 0.4,due to the presence of DyCo 2Si 2phase impurity.It is found that the T C decreases from 15K for x =0to 5K for x =0.4in (Ho 1?x Dy x )CoSi compounds.
01020
0.5
1.0
30
30
20
10
16
1284
40
50
T K
T K M (A .m 2/k g )
FC ZFC
x
T C
T t
μ0H/ T Ho x Er x CoSi
x/ x/ x/ x/ x/ x/
Fig.7.(color online)Temperature dependence of ZFC and FC magnetiza-tions under 0.01T for (Ho 1?x Er x )CoSi compounds.The inset shows the transition temperatures as a function of as a function of x .[32]
10
20
30
T K
20
15
10
5
0-D S M (J /k g .K )
D μ0H/ T
Ho x Er x CoSi
x/ x/ x/ x/ x/ x/
Fig.8.(color online)The temperature dependence of ?S M for (Ho 1?x Er x )CoSi compounds under a magnetic ?eld change of 2T.[32]
Figure 9shows the temperature dependence of ?S M for Ho 0.8Dy 0.2CoSi compound under different magnetic ?eld changes.[32]For a magnetic ?eld change of 5T,Ho 0.8Dy 0.2CoSi exhibits a maximum ??S M value of 20.2J/kg ·K around T C =12K.The reduction of MCE is due
to the fact that the introduction of Dy atoms would result in the competition of FM coupling of Ho moments and AFM coupling of Dy moments,thus lowering the saturation mag-netization and MCE of (Ho 1?x Dy x )CoSi compounds.
102030405060
T K
20161284
0-D S M (J /k g .K )
Ho Dy CoSi
T T T T T
Fig.9.(color online)Temperature dependence of ?S M for Ho 0.8Dy 0.2CoSi under different magnetic ?eld changes.[32]
2.3.R NiSi compounds
In 1974,Bodak et al.[34]reported that all R NiSi (R =Gd–Lu)compounds crystallize in the orthorhombic TiNiSi-type crystal structure.In 1999,Szytula et al.[35]further investigated the magnetic properties of R NiSi (R =Tb–Er)compounds by neutron diffraction and magnetometric measurement studies.It was found that all R NiSi (R =Tb–Er)compounds show AFM ordering with strong magnetocrystalline anisotropy at low temperatures.In addition,the neutron diffraction studies reveal that another ordering change of magnetic moments from sine to square-modulated structure occurs below T N .Very recently,the MCE of R NiSi (R =Tb–Er)compounds have been investigated by different researchers.[36–38]Among these materials,HoNiSi exhibits the largest MCE due to the ?eld-induced metamagnetic transition.[36]
Zhang et al.[37]recently reported giant rotating MCE in textured DyNiSi polycrystalline material that is larger than those of most rotating magnetic refrigerants reported so far.Figure 10shows the temperature dependence of ZFC and FC magnetizations for DyNiSi at 0.05T along the parallel and per-pendicular directions,respectively.[37]It is seen that both ther-momagnetic curves show similar trend but with different mag-netizations.With the decrease of temperature,DyNiSi under-goes a PM–AFM transition at T N of 8.8K.In addition,another anomaly is found around the transition temperature T t =4K,which is likely attributable to the ordering change of magnetic moments from sine to square-modulated structure,based on neutron diffraction studies.[35]The magnetization was mea-sured by rotating the DyNiSi sample in the magnetic ?eld of 0.05T as shown in the inset of Fig.10.Here,the rotation angle θis de?ned as 0?when the longitudinal direction of columnar grains is parallel to the magnetic ?eld.It can be
clearly seen that the magnetization decreases gradually by ro-tating the sample from parallel to perpendicular direction,in-dicating that the easy magnetization axis is consistent with the preferred crystalline orientation.
0104
3
2
1
2030405060
2.0
1.61.20.80.4120
240360
T K
M (A .m 2/k g )
s i n e -A F M
s q u a r e -A F M
PM
T N / K
T t / K H
H
u H
u H
μ0H/ T
μ0H/ T
ZFC FC
θ/(Ο)
M (A .m 2/k g )
20 K
Fig.10.(color online)Temperature dependence of ZFC and FC magne-tizations for DyNiSi at 0.05T along the parallel and perpendicular direc-tions,respectively.The inset shows the magnetization as a function of rotation angle at 20K under 0.05T.[37]
10
20
30
40
50
T K
10
20
30
40
50
T K
242016128406543210-D S (J /k g .K )
-D S (J /k g .K )
H
u H
T T T T T T T T T T (a)
(b)
T T T T T (c)
1612840-D S d i f f (J /k g .K )
Fig.11.(color online)Temperature dependence of ?S for DyNiSi for different magnetic ?eld changes along (a)parallel and (b)perpendicular directions,respectively.(c)The difference of ?S for DyNiSi between dif-ferent directions as a function of temperature for different magnetic ?eld changes.[37]
Figures 11(a)and 11(b)show the temperature dependence of ?S for DyNiSi for different magnetic ?eld changes along parallel and perpendicular directions,respectively.[37]It can be seen that DyNiSi exhibits a giant anisotropic MCE,e.g.,the maximum ??S values are 22.9J/kg ·K and 5.9J/kg ·K for a ?eld change of 5T along parallel and perpendicular direc-tions,respectively.A small negative ??S value (inverse MCE)is observed below T N at 1T along the parallel direction be-cause of the presence of the AFM state,while it becomes pos-itive with the increase of magnetic ?eld.Such a sign change of ??S is due to the ?eld-induced AFM–FM metamagnetic transition.[39]In addition,another ??S peak is found around T t for both directions.It is speculated that the transition from sine to square-modulated structure may lead to some unstable moments below T t .Therefore,an applied magnetic ?eld will turn these AFM components into FM ordering,which exhibits a magnetically more ordered con?guration,and then result in a positive ??S peak.Figure 11(c)shows the difference of ?S for DyNiSi between different directions as a function of tem-perature for different magnetic ?eld changes.[37]For the ?eld changes of 2T and 5T,the ??S diff peak reaches as high as 11.1J/kg ·K at 8.5K and 17.6J/kg ·K at 13K due to the giant
anisotropy of MCE.This result indicates that a large rotating MCE can be obtained by rotating the sample from perpendic-ular to parallel.
θ/(Ο)
0152 T
1.5 T
1 T
T/ K
30
45607590
8
642
-D S R (θ) (J /k g .K )
H
u H
S
N
Fig.12.(color online)The ?S R (θ)
of DyNiSi as a function of rotation angle for different magnetic ?eld changes.The inset describes the rotation of sample from perpendicular (90?)to parallel (0?)direction in magnetic ?eld.[37]
Furthermore,the isothermal magnetization curves at 8K and 9K were measured for DyNiSi under applied ?elds up to 2T by rotating the sample from perpendicular (90?)to paral-lel (0?)
with a step of
10?
as shown in the inset of Fig.
12.[37]
By de?ning the rotating entropy change
?S R (90?)
as zero,the
?S R (θ)value at 8.5K can be obtained based on the magneti-
zation curves by using the following equation:
?S R (θ)=?S (θ)??S (90?)
=μ0 H 0
?M (θ)
?T H
d H
?μ0 H 0
?M (90?)
?T H
d H .
(1)
Figure 12shows the ?S R (θ)as a function of rotation an-gle for different magnetic ?eld changes.[37]It is noted that
small negative ??S R (θ)value is observed under relatively low ?elds near the perpendicular direction.This can be un-derstood that the disordering of magnetic moments in AFM sublattice is enhanced under low ?elds when the rotation just starts,and thus it leads to a positive entropy change.Further rotating the sample closer to parallel,the majority of spins in the AFM sublattice could orient along the ?eld direction,which then increases the spin ordering and results in the pos-itive ??S R (θ)value.Under the magnetic ?eld of 2T,the ??S R (θ)value increases gradually and reaches a maximum value of 7.9J/kg ·K as the sample is rotated from perpendicu-lar to parallel.
10
8
6
4
2
200160
1208040
0M (A .m 2/k g )
3.53.02.5
2.01.51.00.50
M (A .m 2/k g )
010203040
50
60
70
HoNiSi
T K
10
20
3040506070
T K
1020
304050
T K
01020
304050
T K
M (A .m 2/k g )
160
120
80
40
M (A .m 2/k g )
T T T T T
T T T T T
ZFC FC
μ0H/ T ErNiSi
ZFC FC μ0H/ T (a)
(b)
T T T T T
T T T T T Fig.13.(color online)Temperature dependence of ZFC and FC magne-tizations for (a)HoNiSi [36]and (b)ErNiSi under 0.05T.Inset shows the temperature dependence of magnetization in various magnetic ?elds for HoNiSi [36]and ErNiSi,respectively.
Figures 13(a)and 13(b)show the temperature dependence of ZFC and FC magnetizations for HoNiSi [36]and ErNiSi under 0.05T.It is seen that HoNiSi and ErNiSi undergo an
AFM–PM transition around the N′e el temperature T N =3.8K and 4K,respectively,which are just around the critical tem-perature of liquid helium (4K),suggesting the potential ap-plication of R NiSi (R =Ho and Er)for helium liquefaction.Besides,no obvious discrepancy between ZFC and FC curves is observed,indicating good thermomagnetic reversibility of the magnetic transition.The temperature dependence of mag-netization in various magnetic ?elds is shown in the inset of Figs.13(a)and 13(b).It can be seen that R NiSi (R =Ho and Er)exhibit typical AFM–PM transition under low ?elds.However,the magnetization at low temperatures in-creases greatly with increasing ?eld,revealing the occurrence of a ?eld-induced AFM–FM metamagnetic transition below T N .In addition,a step-like behavior of M –T curves above T N is also observed when ?eld is larger than 0.3T for HoNiSi and 0.7T for ErNiSi,respectively,corresponding to the FM–PM transition.[40]
Figures 14(a)and 14(b)show the temperature depen-dence of ?S M for HoNiSi [36]and ErNiSi under different mag-netic ?eld changes up to 5T.It is well known that the ?S M values can be calculated either from the magnetiza-tion isotherms by using the Maxwell relation ?S M (T ,H )=μ0
H
(?M /?T )H d H or from the heat capacity by using
the equation ?S M (T )=
T
[C H (T )?C 0(T )]/T d T ,[26]respec-
tively.However,sometimes the values of ?S M calculated from heat capacity may be much lower than those obtained from magnetization isotherms,which is likely due to either an er-roneous calculation of the Maxwell relation in the vicinity of FOPT or poor contact between the sample and the measuring platform during heat capacity measurement.[14,41]For com-parison,the ?S M values were estimated from both methods as shown in Fig.14(a),and it can be clearly seen that the ?S M curves obtained from two methods match well with each other.For a ?eld change of 2T,the maximum ??S M values for HoN-iSi and ErNiSi around T N are 17.5J/kg ·K and 8.8J/kg ·K,re-spectively.Besides,a large positive ?S M (inverse MCE)can be observed below T N ,which is caused by the presence of AFM ordering at low temperatures.For example,the ?S M of HoN-iSi below T N reaches 7.2J/kg ·K for a low ?eld change of 0.5T,and the maximum ?S M of ErNiSi below T N is 6.5J/kg ·K for a low ?eld change of 1T.These large normal and inverse MCE under low ?eld change indicate that R NiSi (R =Ho and Er)could be applied in magnetic refrigeration with either adia-batic magnetization or adiabatic demagnetization.
10
20
30
40
50
-4-2
24
6
8
T K
10
2030
40
T K
2824201612840201612840-4-8
1.00.80.60.40.20
-D S (J /k g .K )
D S '
HoNiSi
ErNiSi
θ
T T T T T T T
T T T T T T T
T
T T T T
T
T
(a)
(b)
-D S M (J /k g .K )
Fig.14.(color online)Temperature dependence of ?S M for (a)HoNiSi [36]and (b)ErNiSi under different magnetic ?eld changes up to 5T.The ?S M of HoNiSi was calculated from magnetizations (open symbols)and heat capacity measurements (full symbols).Inset shows the universal curve of ?S M for HoNiSi compound under various magnetic ?eld changes.
Recently,Franco et al.[42,43]proposed a phenomenologi-cal procedure to construct the universal curve of ?S M for ma-terials with second-order FM–PM transition.However,the ap-plicability of this universal curve has not been proven for AFM materials.As shown in the inset of Fig.14(a),Zhang et al.[36]were ?rst to construct the universal curve of ?S M for HoNiSi by using this phenomenological procedure.The normalized
?S is de?ned as ?S (T ,H max )=?S M (T ,H max )/?S pk
M (H max ).The temperature axis has been rescaled in a different way be-low and above T pk ,by imposing that the positions of two ref-erence points in the curve correspond to θ=±1,
θ=
?(T ?T pk )/(T r1?T pk ),T ≤T pk ,(T ?T pk )/(T r2?T pk ),T >T pk .(2)
where T r1and T r2are the temperatures of the two reference
points which correspond to ?S pk
M /2.All the curves under dif-ferent ?eld changes collapse onto the same universal curve,though the ground state changes from AFM to FM with the increase of magnetic ?eld.This result reveals that the univer-sal ?S M curve could also be applied in AFM or at least weak AFM materials.
Figure 15displays the temperature dependence of ?T ad for HoNiSi under different magnetic ?eld changes.[36]HoN-iSi exhibits large ?T ad values of 4.5K and 8.5K for the ?eld changes of 2T and 5T,respectively,which is attributed to the ?eld-induced metamagnetic transition from weak AFM to FM states.[15]In addition,it is found that both ?S M and ?T ad peaks for HoNiSi compound broaden asymmetrically towards high temperatures with increasing ?eld,indicating the presence of FM ordering above T N induced by magnetic ?eld.[44]More-over,this broad distribution of ?S M peak of HoNiSi leads to a high RC value of 471J/kg for a ?eld change of 5T.
10
208
64
2
03040
T K
HoNiSi
T T
D T a d K
Fig.15.(color online)Temperature dependence of ?T ad for HoNiSi under different magnetic ?eld changes.[36]
2.4.R CuSi compounds
The series of ternary intermetallic R CuSi compounds have been investigated extensively in the past few decades due to the interesting physical properties.It has been reported that these compounds crystallize within two types of crys-tal structure depending on the annealing temperature.The high-temperature phase crystallizes in the AlB 2-type struc-ture (space group P 6/mmm )with R atoms at 1a :(0,0,0)and Cu/Si atoms statistically at 2d :(1/3,2/3,1/2).[45]The low-temperature phase adopts the Ni 2In-type structure (space group P 63/mmc )with R at 2a :(0,0,0),Cu at 2c :(1/3,2/3,1/4),and Si at 2d :(1/3,2/3,3/4),respectively.[46,47]The mag-netic properties of R CuSi vary greatly with the change of crys-tal structure and rare earth element.According to the magnetic susceptibility measurements,Kido et al.[48]suggested that the AlB 2-type R CuSi compounds with R =Ce,Nd order antiferro-magnetically while those with R =Gd,Ho order ferromagneti-cally.As for the R CuSi compounds with Ni 2In-type structure,neutron diffraction studies reveal that R CuSi compounds with R =Tb,Dy,Ho,and Er orders antiferromagnetically below T N =16K,11K,9K,and 6.8K respectively.[49–52]
In 2010,Chen et al.[15,53,54]investigated systematically the magnetic properties and MCE of R CuSi (R =Gd–Er)with Ni 2In-type structure.It was found that these compounds show
weak AFM ground state at low temperatures,which could be easily induced into FM state by magnetic ?eld,and thus lead to large MCE.Figure 16shows the temperature dependence of ZFC and FC magnetizations under the magnetic ?eld of 0.01T for R CuSi (R =Gd,Tb,Dy,and Er)compounds.[54]It can be found that the R CuSi compounds undergo an AFM–PM transition at T N =14,11,10,and 7K for R =Gd,Tb,Dy,and Er,respectively.The ZFC and FC curves are com-pletely reversible above T N ,suggesting good thermomagnetic reversibility of the magnetic transition.However,a small dis-crepancy is observed below T N ,which is likely related to the domain-wall-pinning effect.In ZFC mode,the domain walls are pinned and the thermal energy is not strong enough to over-come the energy barriers,and this leads to the low magnetiza-tion at low temperatures.However,in FC mode,the magnetic ?eld during the cooling prevents the pinning effect and there-fore,the magnetization at low temperatures is higher than that in ZFC mode.Figure 17shows the temperature dependence of ?S M for R CuSi (R =Gd,Tb,Dy,and Er)compounds un-der different magnetic ?eld changes.[54]It is clearly seen that that R CuSi (R =Gd,and Tb)compounds exhibit a small neg-ative ?S M value at a lower temperature,but the ?S M changes to positive value with increasing magnetic ?eld,correspond-ing to the ?eld-induced metamagnetic transition from AFM to FM states.This sign change of ?S M is not observed in Dy-CuSi and ErCuSi,indicating that the weak AFM coupling in R CuSi (R =Dy and Er)could be easily induced into FM state under lower ?eld.Moreover,a large MCE can be obtained due to the ?eld-induced metamagnetic transition.For a magnetic ?eld change of 5T,the maximum ??S M values are 9.2,10.0,24.0,and 23.1J/kg ·K for R =Gd,Tb,Dy,and Er,respectively.
Figure 18shows the temperature dependence of magneti-zation for HoCuSi under various magnetic ?elds.[15]It is seen that HoCuSi undergoes an AFM to PM transition around T N of 7K under low ?elds.With the increase of magnetic ?eld,the magnetization at low temperatures increases greatly,indicat-ing the occurrence of a ?eld-induced metamagnetic transition from AFM to FM states.In addition,a stepwise behavior of the M –T curves above T N is observed when the ?eld is higher than 0.3T,corresponding to the FM–PM transition.The ?S M of HoCuSi as a function of temperature for different magnetic ?eld changes is shown in Fig.19.[15]The maximum ??S M and RC values are obtained to be 33.1J/kg ·K and 385J/kg,re-spectively for a magnetic ?eld change of 5T,which are com-parable with or even higher than those of other refrigerant ma-terials in a similar temperature range.Particularly,the ??S M reaches as high as 16.7J/kg ·K for a relatively low ?eld change of 2T,making HoCuSi attractive candidate for magnetic re-frigeration materials in the low temperature range.
20
0.6
0.40.2040
60
80
100
T K
M (A .m 2/k g )
(a)(b)
(c)
(d)T N / K GdCuSi
ZFC FC T
20
0.6
0.4
0.2
040
60
80
100
T K
M (A .m 2/k g )
T N / K
TbCuSi
ZFC FC T
020
1.0
0.80.60.40.20406080
T K
M (A .m 2/k g )
T N / K DyCuSi
ZFC FC T
20
3.0
2.52.01.51.00.5
4060
80
T K
M (A .m 2/k g )
T N / K
ErCuSi
ZFC FC T
Fig.16.(color online)Temperature dependence of ZFC and FC magnetizations under the magnetic ?eld of 0.01T for R CuSi (R =Gd,Tb,Dy,and Er)compounds.[54]
15
3045T K
015
3045
T K
105024168010
5
02416
8
-D S M (J /k g .K )
-D S M (J /k g .K )
-D S M (J /k g .K )
-D S M (J /k g .K )
(a)GdCuSi
DyCuSi
TbCuSi
ErCuSi
(b)
(c)(d)
? T ? T ? T ? T ? T
? T ? T ? T ? T ? T
? T ? T ? T ? T ? T
? T ? T ? T ? T ? T
Fig.17.(color online)Temperature dependence of ?S M for R CuSi (R =Gd,Tb,Dy,and Er)compounds under different magnetic ?eld changes.[54]
The large MCE in HoCuSi compound is mainly attributed to the following reasons:(i)the high saturation magnetiza-tion (M S ~9.47~μB ),[15](ii)the ?eld-induced metamag-netic transition from AFM to FM states,[55]and (iii)the large change in lattice volume around T N .[51]In order to investi-gate the change of lattice volume,the thermal expansion data (?L /L (50K ))under different ?elds has been measured by the means of strain gauge method [56]and is shown in Fig.20.[54]The (?L /L (50K ))value decreases linearly with decreasing temperature above T N but drops abruptly around T N in zero
20
4060
T K
20016012080400M (A .m 2/k g )
T
T
T
T
T T T T HoCuSi
Fig.18.(color online)Temperature dependence of magnetization for Ho-CuSi under various magnetic ?elds.[15]
010
2030
T K
32
24
16
8
-D S M (J /k g .K )
HoCuSi
? T ? T
Fig.19.(color online)The ?S M of HoCuSi as a function of temperature for different magnetic ?eld changes.[15]
10
20
3040
50
T K
0-100-200-300
-400-500-600
D L L 50 K /10-6
T N
T T T
HoCuSi
Fig.20.(color online)Temperature dependence of thermal expansion data (?L /L (50K ))under different ?elds for HoCuSi.[54]
magnetic ?eld.This result con?rms the occurrence of abrupt thermal expansion around T N ,which is caused by the change of lattice constants.In addition,it is noted that the abrupt ther-mal expansion shifts to higher temperature with the increase of ?eld,leading to the asymmetrical broadening of the ??S M peak.
3.MCE in RT Al compounds
The nature of magnetic ground state,the ordering tem-perature T ord ,and the magnetocaloric properties for RT Al (R =Gd–Tm,T =Fe–Cu and Pd)compounds are summarized in Table 2.Similar to the RT Si compounds with T =Fe,Co,Ni,R FeAl and R CoAl compounds order ferri-/ferro-magnetically,and R NiAl compounds exhibit AFM or AFM +FM ground state.Unlike R CuSi compounds exhibiting AFM ground state,R CuAl compounds order ferromagnetically at low tempera-tures.It is worth noting that RT Al (T =Fe and Pd)compounds could exist in various crystallographic structures depending on the different heat treatment techniques,and that would result in rich variety of magnetic properties and MCE.Among these materials,the largest MCE can be often observed in RT Al compounds with R =Ho due to the high value of total angular momentum J .In the following sections,the magnetocaloric properties of different series of RT Al compounds will be dis-cussed in detail.3.1.R FeAl compounds
It has been reported that all R FeAl (R =Gd–Dy)com-pounds crystallize in the hexagonal MgZn 2-type structure (space group P 63/mmc )when quenched after annealing.[57–60]However,Klimczak et al.[57]found that GdFeAl crystallizes in cubic MgCu 2-type structure (space group F d3m )when cooled slowly,which exhibits lower saturation magnetic moments than that of GdFeAl with MgZn 2-type structure.In 1973,Oesterreicher et al.[61]reported that both GdFeAl and TbFeAl with MgZn 2-type structure order ferrimagnetically below the transition temperatures of 260K and 195K,respectively.In addition,an S-shape of the M –H curve is observed in TbFeAl compound at low temperatures,which was ascribed to the par-tial chemical disorder of Fe and Al atoms as well as high mag-netocrystalline anisotropy.[61,62]Similar results have also been observed by Kastil et al.[59]In recent years,the MCE of R FeAl (R =Gd–Dy)have been reported by different researchers,and it is found that these compounds show reversible MCE in a wide temperature range,leading to a high RC value.[58–60]
In 2009,Dong et al.[58]were ?rst to investigate the MCE of GdFeAl compound with MgZn 2-type structure.Fig-ure 21(a)shows the temperature dependence of magnetization for GdFeAl under 0.1T.[58]The transition temperature T C is 265K,de?ned as the minimum value of d M /d T curve.This T C is close to room temperature,indicating the possible appli-cation of GdFeAl compound for magnetic refrigeration near room temperature.The isothermal magnetization at 5K is presented in Fig.21(b).[58]The saturation magnetization μS is determined to be 5.8μB per formula,which is lower than the theoretical gJ value of 7μB for a free Gd 3+ion.This lower value of μS is attributed to the AFM coupling between the magnetic moments of Gd and Fe sublattices.[63]
Table 2.Magnetocaloric properties of RT Al (R =Gd–Tm,T =Fe–Cu and Pd)compounds.
Materials Ground state
T ord /K ??S M /(J/kg ·K)T ad /K
RC /(J/kg)Refs.2T 5T 2T 5T 5T GdFeAl FIM 265 1.8 3.7––420[58]TbFeAl FIM 196– 3.3a 0.8 1.6a 268a [59]DyFeAl FM 129 3.1 6.4––457b [60]HoFeAl FM 80 3.47.5––435[64]ErFeAl FM 55 2.4 6.1––240[64]GdCoAl FM 100 4.910.4––590b [67]TbCoAl FM 70 5.310.5––407b [67]DyCoAl FM 379.216.3––487b [67]HoCoAl FM 1012.521.5––454b [67]TmCoAl FM 7.510.218.2––211[70]GdNiAl FM+AFM 68,30.4+15 5.410.9– 4.172534b [74]TbNiAl FM+AFM 48237.113.8––494[77]DyNiAl FM+AFM 30,1510.019.0 3.5c 7.0c 492b [78]HoNiAl FM+AFM 14,512.323.648.7421b [79]ErNiAl AFM 6–21.6– 6.3230b [72]TmNiAl AFM 4 5.512.7––109b [80,81]GdCuAl FM 81 5.210.1––460[89]TbCuAl FM 52 6.214.4––401b [90]DyCuAl FM 2810.920.4 3.67.7423[85]HoCuAl FM 11.217.530.6––486[91]ErCuAl FM 714.722.9––321[86]TmCuAl FM 2.817.224.3 4.6c 9.4c 372[16]HTM–GdPdAl FM 49 5.3 6.2––362[100]HTM–TbPdAl AFM 43 5.811.4––350[97]HTM–DyPdAl FM 227.814.7––304[100]LTM–HoPdAl AFM 10 2.613.7––174b [100,101]HTM–HoPdAl AFM 1212.820.6––386[100,101]LTM–ErPdAl AFM 10 2.011.6––139b [100]HTM–ErPdAl
AFM
5
12.0
24.3
–
–
299
[100]a
μ0H =4T.b The RC values were estimated from the temperature dependence of ?S M in the referenced literature.c
The ?T ad values
were calculated by using the equation ?T ad =??S (T ,H )×T /C P (T ,H 0),where C P (T ,H 0)is zero-?eld heat capacity.
050
100
150
60
50403020100200
250
0.1 T
GdFeAl
(a)
(b)
300
350
T K
M (A .m 2/k g )
6.0
4.53.01.5
0M (μB /f .u .)
1
2
34
5
μ0H T
Fig.21.(color online)(a)Temperature dependence of magnetization for GdFeAl under a ?eld of 0.1T.(b)The magnetization curve at 5K for GdFeAl compound.[58]
Figure 22displays the temperature dependence of ?S M for GdFeAl under the magnetic ?eld changes of 2T and 5T,respectively.[58]The maximum ??S M value is 3.7J/kg ·K for a ?eld change of 5T,which is lower than those of most magnetic refrigerants in the same temperature range.However,the ?S M peak spreads out over a wide temperature range and the full width at half maximum of the peak is 159K.This broad dis-tribution of ?S M peak results in a high RC value of 420J/kg for a ?eld change of 5T.In addition,a perfect magnetic reversibil-ity around the transition temperature is observed in the M –H curves with the ?eld increasing and decreasing modes,corre-sponding to the typical second-order magnetic transition.This result indicates that the detrimental effects for fast-cycling re-frigerators of hysteresis losses and slow kinetics do not exist in
GdFeAl.Very recently,Kastil et al.[59]also studied the MCE of R FeAl (R =Gd,Tb)and observed large relative cooling power (RCP)of 348J/kg and 350J/kg over a wide temperature region for GdFeAl and TbFeAl,respectively.Li et al.[60,64]re-ported the MCE of R FeAl (R =Dy,Ho,and Er)and found that the RC of DyFeAl reaches the largest value of 832J/kg for a ?eld change of 7T in this series of compounds.
100150
200250
300350
T K
3.62.7
1.80.90
-D S M (J /k g .K )
GdFeAl
T T
Fig.22.(color online)Temperature dependence of ?S M for GdFeAl under the magnetic ?eld changes of 2T and 5T,respectively.[58]
3.2.R CoAl compounds
R CoAl compounds have been reported to crystallize in the hexagonal MgZn 2-type structure (space group P 63/mmc )which is a close-packed Laves phase.[65]In 2000,Jarosz et al.[66]investigated the crystallographic,electronic structure and magnetic properties of GdCoAl compound systematically,and reported that GdCoAl undergoes a typical FM–PM tran-sition at T C =https://www.doczj.com/doc/c011179092.html,ter,Zhang et al.[67]studied the mag-netic entropy change of R CoAl (R =Gd -Ho)compounds in the temperature range of 10K–100K.Figure 23presents the T C and ?S M for a ?eld change of 5T as a function of R atom type.It is found that the T C decreases linearly with the rare earth atom varying from Gd to Tm.In contrast,the ?S M has been reported to increase with the R atom changing from Gd to Tm.For a ?eld change of 5T,the HoCoAl exhibits the largest ??S M of 21.5J/kg ·K around T C =10K.In addition,a table-like ?S M peak was observed over the temperature range of 70K–105K in GdCoAl compound.Although the ??S M of 10.4J/kg ·K is relatively low for GdCoAl,this ?at ?S M peak over a wide temperature range satis?es the requirement of a magnetic refrigerator based on an ideal Ericsson cycle,and also makes GdCoAl an attractive candidate material to ?ll the gap near 100K in the ?S M –T pro?le required by an eight-stage magnetic refrigerator.[68]In 2010,Chelvane et al.[69]also investigated the magnetic and magnetocaloric properties of DyCoAl compound by magnetization and neutron diffrac-tion measurements.It was found that DyCoAl has a collinear ferromagnetic structure where Dy moments lie in the ab plane
at 10K.A reversible MCE with ??S M of 18J/kg ·K for a ?eld change of 9T is obtained in DyCoAl around 37
K.
Tb
Dy Ho
Tm
2015
10
Gd
100
80
604020
R atom
T C K
-D S M (J /k g .K )
Fig.23.(color online)The T C and S M for a ?eld change of 5T as a func-tion of R atom for R CoAl compounds.
Very recently,Mo et al.[70]further studied the MCE of TmCoAl.Figure 24(a)shows the temperature dependence of magnetization under the magnetic ?eld of 0.01T for TmCoAl.[70]It can be found that TmCoAl undergoes a typ-ical second-order magnetic transition from FM to PM states around T C =6K,which is just above the boiling tempera-ture of helium.A signi?cant thermomagnetic irreversibility
10
20
304050
T K
2.5
2.01.51.00.5
025*******
0(a)
TmCoAl
exp. data Curie-Weisse fit
(b)
M (A .m 2/k g )
(1/χ)/(10-2 T .k g /A .m 2)
T C / K
μ0H/ T
ZFC FC Fig.24.(color online)(a)Temperature dependence of ZFC and FC mag-netizations for TmCoAl compound under the magnetic ?eld of 0.01T.(b)Temperature variation of the inverse dc susceptibility ?tted to the Curie–Weiss law for TmCoAl.[70]
can be clearly seen below T C ,which likely arises from the narrow domain-wall-pinning effect.The inverse dc suscep-tibility (χ?1)under 0.01T and the Curie–Weiss ?t to the ex-perimental data for TmCoAl are plotted in the Fig.24(b).[70]The inverse susceptibility above T C obeys the Curie–Weiss law χ?1=(T ?θP )/C ,where θP is the paramagnetic Curie temperature and C is the Curie–Weiss constant.Based on the calculation of Curie–Weiss ?t,the values of θP and effective magnetic moment (μeff )for TmCoAl are obtained to be 4K and 5.93μB /Tm 3+,respectively.The μeff value is lower than
the theoretical magnetic moment (g
J (J +1)=7.57μB )of Tm 3+free ion,which is likely due to the crystal ?eld effects and magnetic anisotropy.Figure 25shows the temperature de-pendence of ?S M for TmCoAl under different magnetic ?eld changes.[70]It is seen that TmCoAl exhibits a large ??S M value of 10.2J/kg ·K for a low magnetic ?eld change of 2T,comparable with or larger than those of most potential mag-netic refrigerants with a similar magnetic transition tempera-ture.Moreover,no thermal and magnetic hysteresis loss has been observed in TmCoAl.Therefore,the large reversible MCE suggests that TmCoAl could be a promising candidate for a magnetic refrigeration at low temperatures.
0510
1520TmCoAl
20
15
10
5
25
1 T
2 T
3 T
4 T
5 T
T K
-D S M (J /k g .K )
Fig.25.(color online)Temperature dependence of ?S M for TmCoAl un-der different magnetic ?eld changes.[70]
3.3.R NiAl compounds
The R NiAl alloys have been intensively studied for their complex magnetic structures and related interesting physical properties.[66,71–74]All R NiAl compounds crystallize in the ZrNiAl-type hexagonal structure (space group P 62m ).Neu-tron diffraction experiments revealed the coexistence of FM and AFM states in isostructural R NiAl compounds (R =Tb,Dy,and Ho)compounds.[71,75,76]Korte et al.[72]reported that GdNiAl compound experiences three transitions with FM or-dering of the Gd spins at T C =58K accompanied by AFM pro-cesses at T 1=28K and T 2=23K,respectively.A similar re-sult has also been observed by Si et al.in the study of annealed GdNiAl ribbon.[74]The successive magnetic transitions lead to a broad ?S M peak over a wide temperature range.By sub-
stituting Gd with Er,all transition temperatures shift to lower temperature while the MCE increases gradually.Singh et al.[77–79]investigated the magnetic and magnetocaloric prop-erties of R NiAl (R =Tb,Dy,and Ho)in detail,and found that these compounds undergo two successive transitions with the decrease of temperature.For example,HoNiAl experiences an PM–FM transition at T C =14K followed by a FM–AFM tran-sition at T 1=5K,and exhibits a large ??S M of 12.3J/kg ·K around T C for a ?eld change of 2T.[79]Mo et al.[80]further reported that TmNiAl orders antiferromagnetically below 4K,and shows a maximum ??S M of 12.7J/kg ·K for a ?eld change of 5T due to the metamagnetic transition from AFM to FM states.
In order to investigate the effect of Cu doping on the mag-netic and magnetocaloric properties in the TmNiAl compound,Mo et al.[81]also studied the TmNi 1?x Cu x Al compounds.Figure 26displays the isothermal magnetization curves of TmNi 1?x Cu x Al compounds as a function of magnetic ?eld measured at 2K in applied ?elds up to 5T.[81]The magne-tization increases linearly with increasing magnetic ?eld in low-?eld ranges when x <0.3,suggesting the existence of AFM ground state,and then exhibits a sharp increase at a critical ?eld,con?rming the ?eld-induced metamagnetic tran-sition from AFM to FM states.However,with increasing Cu-concentration in the x ≥0.3,the magnetization increases rapidly with magnetic ?eld and tends to be saturated at 5T,which corresponds to the typical FM nature.The variation of ground state is attributed to the rotation of Tm magnetic moments from basal plane to c axis,and thus leading to the canted AFM structure with larger projected moments along the c axis near T ord .Meanwhile,the T ord decreases from 4K for x =0to 2.8K for x =1.Figure 27shows the ?S M as a function of temperature for TmNi 1?x Cu x Al compounds under a magnetic ?eld change of 2T.[81]It is found that the ??S M value increases largely with the increase of Cu content, e.g.,
1
2
34
00.10.30.50.70.915
76543210μ0H T
μ ( B /f .u .)
T/ K TmNi x Cu x Al
Fig.26.(color online)Isothermal magnetization curves of TmNi 1?x Cu x Al compounds as a function of magnetic ?eld measured at 2K in applied ?elds up to 5T.[81]
0510
15202530
T K
20
15
10
5
-D S M (J /k g .K )
TmNi x Cu x Al
D μ0H/ T
x/ x/ x/ x/ x/ x/ x/
Fig.27.(color online)The ?S M as a function of temperature for TmNi 1?x Cu x Al compounds under a magnetic ?eld change of 2T.[81]
the ??S M value of 10.7J/kg ·K for TmNi 0.7Cu 0.3Al compound is almost twice that of TmNiAl compound (5.5J/kg ·K).The MCE of TmNi 1?x Cu x Al compounds with x ≥0.3are much higher than those of many magnetic refrigerant materials with a similar transition temperature.
In 2015,Cui et al.[82]reported the magnetic properties and MCE in HoNi 1?x Cu x Al compounds.The temperature dependence of magnetization for HoNi 1?x Cu x Al compounds under the magnetic ?eld of 0.01T is displayed in Fig.28.The HoNi 1?x Cu x Al compounds with x ≤0.1exhibit two mag-netic transitions,which are speculated to be a PM–FM +AFM transition followed by an AFM–AFM transition.These com-plex magnetic transitions are induced by the combination and competition between FM and AFM orderings.Increasing Cu
01020
304050T K
01020
304050
T K
01020
304050T K
01020
304050
T K
01020
304050T K
01020
304050
T K
2.01.61.20.80.40
M (A .m 2/k g )
2.01.61.20.80.40
M (A .m 2/k g )
1.00.80.60.40.20
M (A .m 2/k g )
10
86420
M (A .m 2/k g )
0.80.60.40.20
M (A .m 2/k g )
1.61.20.80.40
M (A .m 2/k g )
x/
ZFC FC
T x/
ZFC FC
T x/
ZFC FC
T x/
ZFC FC
T x/
ZFC FC
T x/
ZFC FC
T Fig.28.(color online)Temperature dependence of magnetization for HoNi 1?x Cu x Al compounds under the magnetic ?eld of 0.01T.[82]
content further,the compounds with x =0.2–0.7undergo a single AFM–PM transition,and the ones with x =0.8~1are found to show a FM ground state at low temperatures.For comparison,Figure 29shows the ?S M as a function of temper-ature for HoNi 1?x Cu x Al with x =0.3and 0.8under different magnetic ?eld changes.[82]A small negative value of ??S M was observed for a low magnetic ?eld change of 1T in x =0.3compound,corresponding to the presence of AFM state at low temperatures.In contrast,the compound with x =0.8ex-hibits positive ??S M for all magnetic ?eld changes,which is due to the typical FM–PM https://www.doczj.com/doc/c011179092.html,rge ??S M values of 12.3J/kg ·K and 9.4J/kg ·K for a low ?eld change of 2T are obtained in HoNi 1?x Cu x Al with x =0.3and 0.8,respectively.
10
203030
20
10
040
T K 010
203040
T K
-D S M (J /k g .K )
20
161284
-D S M (J /k g .K )
HoNi x Cu x Al
x/
HoNi x Cu x Al
x/
1 T
2 T
3 T
4 T
5 T
1 T
2 T
3 T
4 T
5 T
(a)
(b)
Fig.29.(color online)Temperature dependence of S M for HoNi 1?x Cu x Al with x =(a)0.3and (b)0.8under different magnetic ?eld changes.[82]
Wang et al.[83,84]also reported similar work on ErNi 1?x Cu x Al compounds.Figure 30shows the temperature dependence of magnetization for ErNi 1?x Cu x Al compounds with x =0.2,0.5,and 0.8,respectively.[83]It is found that the sample with x =0.2orders antiferromagnetically below the T N =4.6K,while the one with x =0.5orders ferromagneti-cally around the T C =5.8K.A quasi Curie-like magnetic tran-sition is observed at T trs =5.5K for the x =0.8sample.In or-der to further investigate the nature of this magnetic transition,the ac susceptibilities in different frequencies for the samples with x =0.5and 0.8were measured and plotted in Fig.31.[83]It is clearly seen that the peak position of ac susceptibilities for 04812161612
8410
20
T K
M /a r b . u n i t s
ErNi x Cu x Al
x/ x/ x/
Fig.30.(color online)Temperature dependence of magnetization for ErNi 1?x Cu x Al compounds with x =0.2,0.5,and 0.8,respectively.[83]
2
3
4
0.12
0.08
0.16
0.12
0.08
5678
T K
4.0
4.5
5.0 5.5
T K
χ' (e m u /g )
χ' (e m u /g )
0.16
0.14
χ' (e m u /g )
x/
(a)x/
(b)10 Hz
47 Hz 97 Hz 197 Hz
10 Hz 47 Hz 97 Hz 197 Hz
297 Hz 497 Hz 997 Hz
10 Hz 47 Hz 97 Hz 197 Hz
297 Hz 497 Hz 997 Hz 2997 Hz
297 Hz 497 Hz 997 Hz Fig.31.(color online)Temperature dependences of real part of ac mag-netic susceptibility for (a)x =0.5and (b)x =0.8samples,respectively.The inset shows the corresponding enlarged part of peak position at differ-ent frequencies for x =0.8sample.[83]
x =0.5is independent of frequency.On the contrary,the peak for x =0.8shifts toward higher temperatures with increasing the frequency as shown in the inset of Fig.31(b),which sug-gests the possible existence of short-range order.Figure 32shows temperature dependence of ??S M under different mag-netic ?eld changes for ErNi 1?x Cu x Al with x =0.2,0.5,and 0.8,respectively.[83]The sample with x =0.2presents a small negative value of ??S M below T N under a low magnetic ?eld change of 1T,corresponding to the nature of AFM state at low temperatures.With the increase of magnetic ?eld,the ?eld-induced metamagnetic transition leads to a large positive ??S M for compound with x =0.2.For a relatively low ?eld
change of 2T,the maximum ??S M values are 10.1,14.7,and 15.7J/kg ·K for x =0.2,0.5,and 0.8,respectively,and this large MCE under low ?eld change is favorable for practical applications.
10
20304025
201510502520151050
252015105050
T K
-D S M (J /k g .K )
x/
x/
x/
b T b T b T b T b T
b T b T b T b T b T b T b T b T b T b T
Fig.32.(color online)Temperature dependence of ?S M under differ-ent magnetic ?eld changes for ErNi 1?x Cu x Al with x =0.2,0.5,and 0.8,respectively.[83]
3.4.R CuAl compounds
The R CuAl compounds,like R NiAl compounds,crys-tallize in the ZrNiAl-type hexagonal structure (space group P 62m ).[66,85,86]However,unlike R NiAl compounds,all heavy rare-earth R CuAl compounds exhibit an FM ground state.[87]There are two types of basal plane layers distributed along the c axis:one contains all the R atoms and one-third of Cu atoms,and the other contains a nonmagnetic layer formed by all the Al atoms and two-third of Cu atoms.This layered charac-ter of the crystalline structure leads to large uniaxial magnetic anisotropies in GdCuAl,DyCuAl,and ErCuAl,and a basal-plane type of magnetic anisotropy in HoCuAl.[88]
Recently,Dong et al.[85,86,89–91]studied the MCE of R CuAl compounds systematically.Figure 33shows the tem-perature dependence of ZFC and FC magnetizations for crys-talline R CuAl (R =Gd–Er)compounds under 0.1T and 0.05T.These compounds undergo a typical FM–PM transition,and the T C decreases monotonically with the R atom-type varying from Gd to Er as usually seen in other RT X compounds.Fig-ure 34displays the temperature dependence of ?S M for crys-talline R CuAl (R =Gd–Er)compounds under a magnetic ?eld
40
80
120160
200
T K
T K
M (A .m 2/k g )
120100806040200M (A .m 2/k g )
60
50403020100GdCuAl TbCuAl μ0H/ T
DyCuAl HoCuAl ErCuAl μ0H/ T
10
20
30405060
Fig.33.(color online)Temperature dependence of ZFC and FC mag-netizations for crystalline R CuAl (R =Gd–Er)compounds under 0.1and 0.05T.[85,86,89,90]
04080120160
T K
-D S M (J /k g .K )
24
16
8
GdCuAl TbCuAl DyCuAl HoCuAl ErCuAl D μ0H/ T
Fig.34.(color online)Temperature dependence of ?S M for crys-talline R CuAl (R =Gd–Er)compounds under a magnetic ?eld change of 5T.[85,86,89,90]
change of 5T.It can be seen that the ?S M value increases grad-ually with the R atom changing from Gd to Er,and reaches the maximum as high as 23.9J/kg ·K for HoCuAl.The large MCE of R CuAl (R =Gd–Er)compounds suggests them as promising candidates of magnetocaloric materials in the low temperature range.In addition,Dong et al.[89,90]compared the magnetic and magnetocaloric properties of amorphous and crystalline R CuAl (R =Gd,Tb)alloys.Figure 35shows the temperature dependence of magnetization for (a)amorphous and (b)crystalline TbCuAl alloy under 0.1T.[90]The crys-talline TbCuAl undergoes an FM–PM transition at T C =52K while the amorphous counterpart shows a small cusp centered at 20K,which is attributed to a spin-glass transition.Differ-ent MCE was also observed in the amorphous and crystalline TbCuAl alloys due to the different nature of magnetic transi-tions.As shown in Fig.36,[90]the maximum ??S M value is obtained to be 4.5J/kg ·K around 36K under a ?eld change of 5T for amorphous TbCuAl alloy.However,??S M peak reaches 14.4J/kg ·K around 52K under the same ?eld change for crystalline TbCuAl alloy,which is much larger than that of amorphous alloy.
20
40
6080100
T K
10
86
42
M (A .m 2/k g )
M (A .m 2/k g )
40
3020
10
0amorphous TbCuAl
crystalline TbCuAl
μ0H/ T
ZFC
FC
μ0H/ T
ZFC FC
(a)(b)Fig.35.(color online)The temperature dependence of magnetization for (a)amorphous and (b)crystalline TbCuAl alloys under 0.1T.[90]
Since Dong et al.[86]did not obtain the pure HoCuAl compound,and therefore,the existence of impurity phase may in?uence the https://www.doczj.com/doc/c011179092.html,ter,Wang et al.[91]successfully syn-thesized pure HoCuAl compound and studied the magnetic properties and MCE in detail.Figure 37(a)shows the tem-perature dependence of magnetization for HoCuAl compound
20
406080100
T K
-D S M (J /k g .K )
16
12
8
4
0amorphous crystalline
TbCuAl
T T T T
Fig.36.(color online)Temperature dependence of ?S M for amorphous and crystalline TbCuAl alloys under different magnetic ?eld changes.[90]
10
20
304050
T K
01020
304050
T K
10
8642
0M (A .m 2/k g )
μ0H/ T
ZFC FC
HoCuAl
HoCuAl
30
20
10
-D S M (J /k g .K )
T T T T T
(a)
(b)
Fig.37.(color online)(a)Temperature dependence of magnetization for HoCuAl compound under 0.01T.(b)The S M as a function of temperature for HoCuAl under different magnetic ?eld changes.[91]
under 0.01T.[91]The HoCuAl experiences an FM to PM tran-sition around T C =11.2K,which is consistent with the data from an impure sample (12K).[86]The ZFC and FC curves show a distinct discrepancy below T C as often observed in other RT X compounds.Taking into account the magnetic anisotropy and low T C for HoCuAl,this thermomagnetic ir-reversibility is likely attributable to the domain-wall-pinning effect.Figure 37(b)shows the ?S M as a function of temper-ature for HoCuAl under different magnetic ?eld changes.[91]For a relatively low ?eld change of 2T,the maximum ??S M value for the pure HoCuAl compound is as high as 17.5J/kg ·K at T C =11.2K,which is 25%higher than that of an impure
sample (14.0J/kg ·K).This large ??S M is also deemed as the highest ??S M value in RT Al (R =Gd–Tm)system reported so far.
In 2013,Mo et al.[16]reported a low-?eld induced giant MCE in TmCuAl compound.With the decrease of temper-ature,TmCuAl exhibits a transition from PM to FM state at T C =2.8K,which likely corresponds to the presence of a lon-gitudinal spin wave magnetic structure according to the neu-tron diffraction studies.[92]Figure 38displays the temperature dependence of ??S M and ?T ad for TmCuAl under different magnetic ?eld changes.[16]Large reversible MCE under low ?eld change can be observed around the T C ,e.g.,the ??S M and ?T ad values of TmCuAl are 17.2J/kg ·K and 4.6K for a ?eld change of 2T,respectively.Particularly,the ??S M reaches as high as 12.2J/kg ·K for a low ?eld change of 1T,which can be applied by a permanent magnet.This giant MCE without thermal and magnetic hysteresis indicates that Tm-CuAl could be an attractive magnetic refrigerant around the helium liquefaction temperature.
0510********
T K
108
642
25
2015105-D S M (J /k g .K )
D T a d K
TmCuAl
T T T T T TmCuAl
T T (a)
(b)
Fig.38.(color online)Temperature dependence of (a)?S M and (b)?T ad for TmCuAl under different magnetic ?eld changes.[16]
3.5.R PdAl compounds
It has been found that different crystal structures can be formed in R PdAl compounds depending on the varia-tion of heat treatment technique.R PdAl compounds crystal-lize in a hexagonal ZrNiAl-type structure as metastable high-temperature modi?cation (HTM)through a high-temperature (~1050?C)annealing and rapid cooling process,while they
crystallize in an orthorhombic TiNiSi-type structure as sta-ble low-temperature modi?cation (LTM)by a low-temperature (~750?C)annealing process.[93]In addition,an isostructural phase transition from a high-temperature HTM I phase to a low-temperature HTM II phase was observed in GdPdAl and TbPdAl with a metastable HTM.[94,95]
The R PdAl (R =Gd,Tb,Dy)compounds with the hexag-onal ZrNiAl-type HTM were reported to exhibit two mag-netic transitions with the variation of temperature.[94–96]Shen et al.[97]studied the MCE of HTM-TbPdAl compound by magnetization measurements.Figure 39(a)shows the tem-perature dependence of ZFC and FC magnetizations under a magnetic ?eld of 0.05T for HTM-TbPdAl compound.It can be seen that the TbPdAl undergoes a PM–AFM transition around T N =43K.In addition,another anomaly is observed at T t =22K,which is associated with an AFM structure transition of frustrated Tb moments from purely commensu-rate AFM to incommensurate AFM magnetic structure.[98,99]Moreover,the discrepancy between ZFC and FC curves be-low 30K is likely related to the frustration effects of the magnetic structures.Figure 39(b)shows the temperature de-pendence of ?S M for HTM-TbPdAl under different magnetic ?eld changes.[97]A small positive ?S M value can be observed
50
100
150200250300
T K
2.0
1.51.0
0.5
0-D S M (J /k g .K )
12
8
4
0M (A .m 2/k g )
HTM -TbPdAl
HTM -TbPdAl T T T T T μ0H/ T
ZFC FC
T N / K
T t / K (a)
(b)
20
406080100
T K
Fig.39.(color online)(a)Temperature dependence of ZFC and FC magne-tizations under a magnetic ?eld of 0.05T for HTM-TbPdAl compound.(b)Temperature dependence of ?S M for HTM-TbPdAl under different mag-netic ?eld changes.[97]
below T N under relatively low magnetic ?eld changes,which is due to the disordered magnetic sublattices antiparallel to the applied magnetic ?eld.But the ?S M gradually changes to negative value with the increase of magnetic ?eld.Such a sign change of ?S M indicates the occurrence of ?eld-induced AFM–FM magnetic transition,which leads to a more ordered magnetic con?guration.It is found that the ?S M –T curve shows a small peak around T t ,which is associated with AFM structure transition of frustrated Tb moments.In addition,a large ??S M value of 11.4J/kg ·K for a ?eld change of 5T is obtained around T N ,which is due to the ?eld-induced AFM–FM transition.Moreover,the ?S M peak expands in a wide temperature range,leading to a high RC value of 350J/kg for a ?eld change of 5T.
Recently,Xu et al.[100,101]systematically investigated the magnetic properties and MCE of R PdAl (R =Gd–Er)compounds with different crystal structures,and found that the magnetic properties and MCE could be affected signif-icantly by the variation of crystal structure.Two series of R PdAl compounds were annealed at 750?C for 50days and at 1050?C ~1080?C for 10~12days,respectively.Fig-ure 40shows the XRD patterns and crystal structures of these two series of R PdAl compounds at room temperature.[32,100]The XRD measurements con?rm that the low-temperature an-nealed samples crystallize in an orthorhombic TiNiSi-type structure as stable LTM (space group Pnma )while the high-temperature annealed compounds crystallize in a hexago-nal ZrNiAl-type structure as metastable HTM (space group P 62m ).In addition,it is noted that both series of R PdAl crystallize in a purely single phase.The lattice parameters and unit cell volumes determined from the Rietveld re?ne-ment are summarized in Table 3.[32,100]It is found that the LTM-R PdAl compounds exhibit larger unit volume than that of HTM-R PdAl.Moreover,the lattice constants and unit cell volumes decrease linearly with the R atom type sweeping from Gd to Er,which is attributed to the lanthanide contraction.
1020304050607080902θ/(Ο)
I n t e n s i t y /a r b . u n i t s
I n t e n s i t y /a r b . u n i t s
(a)
(b)
102030405060708090
2θ/(Ο)
LTM -ErPdAl
LTM -HoPdAl
LTM -DyPdAl
LTM -TbPdAl
LTM -GdPdAl
HTM -ErPdAl
HTM -HoPdAl
HTM -DyPdAl
HTM -TbPdAl
HTM -GdPdAl
Fig.40.(color online)XRD patterns and crystal structures of (a)LTM-R PdAl and (b)HTM-R PdAl compounds at room temperature,respectively.[32,100]
Table 3.The lattice parameters and unit cell volumes of LTM-and HTM-R PdAl compounds determined from the Rietveld re?nement.[32,100]
R PdAl a /nm b /nm c /nm V /nm 3R =Gd LTM 0.69668(0)0.44477(9)0.77586(1)0.2404(1)HTM 0.72002(2)0.40265(1)0.1807(8)R =Tb LTM 0.69152(7)0.44274(6)0.77422(5)0.2370(4)HTM 0.71816(8)0.39973(9)0.1785(5)R =Dy LTM 0.68823(5)0.44153(4)0.77332(8)0.2349(9)HTM 0.71893(4)0.39593(1)0.1772(2)R =Ho LTM 0.68527(4)0.44037(9)0.77242(8)0.2331(0)HTM 0.71857(5)0.39320(9)0.1758(3)R =Er
LTM 0.68142(7)0.43868(5)
0.77087(9)0.2304(4)HTM
0.71830(0)
0.39080(4)
0.1746(2)
放射科制度、职责、流程 目录 一、制度: 1、放射科工作制度 (3) 2、放射科管理制度 (4) 3、放射科会议制度 (5) 4、24小时值班制度 (5) 5、放射科交接班制度 (6) 6、放射科值班人员紧急替代制度 (6) 7、业务学习及考核制度 (7) 8、会诊制度 (8) 9、外出进修、学习及短期考察制度 (8) 10、进修人员管理制度 (9) 11、工作登记制度 (10) 12、特殊检查预约制度 (10) 13、放射介入、血管造影前讨论制度 (11) 14、放射科报告书写制度 (11) 15、放射科报告审核制度 (12) 16、查对制度 (12) 17、疑难病例片讨论制度 (13) 18、阅片、评片(图像质量评价)制度 (13) 19、抢救工作制度 (14)
20、辐射安全防护管理制度 (15) 21、设备使用管理、维修保养制度 (15) 22、医疗安全教育、管理制度 (16) 23、危急重症患者诊断报告制度 (16) 24、错误报告及时更正及签字制度 (17) 25、病例随访制度 (17) 26、放射科安全保卫制度 (18) 27、缺陷管理制度 (18) 28、危急值报告制度 (19) 29、保护患者隐私制度 (19) 30、放射科质量管理制度 (20) 31、放射科医患沟通制度 (21) 二、职责 1、主任(副主任)职责 (21) 2、主任(副主任)医师职责 (22) 3、主治医师岗位职责 (23) 4、医师岗位职责 (23) 5、主任(副主任)技师职责 (23) 6、主管技师岗位职责 (24) 7、技师(士)岗位职责 (24) 8、医疗质量安全管理小组职责 (25) 9、医疗质量安全管理员职责 (26)
RTX2006正式版腾讯通(RTX)方案技术白皮书 腾讯通技术支持服务中心 2011年4月
目录 一、需求概要 (3) 二、系统概述 (5) 三、腾讯通(RTX)产品介绍 (7) 1、什么是RTX (7) 2、RTX的优点 (8) 四、腾讯通(RTX)的主体功能介绍 (9) 五、与短信的融合管理 (12) 六、与腾讯通RTX视频会议插件完美融合 (15) 1视频会议与RTX集成的原理 (16) 2、集成说明 (16) 3、即时会议: (17) 4、与RTX集成功能 (18) 七、腾讯通(RTX)与其它应用系统的集成 (19) 1、集成思路(以下皆以“办公自动化系统”举例) (19) 2、“办公自动化系统”到RTX的单点登陆 (19) 3、RTX到“办公自动化系统”的单点登陆 (20) 4、流程消息提醒 (22) 5、用户数据同步 (23) 6、RTX用户状态感知 (24) 八、部分企业用户名录 (25) 2
腾讯通方案 第 3 页 共 34 页 腾讯通技术服务中心 一、需求概要 根据用户的需求,企业级即时通讯软件――腾讯通(RTX )从功能上来说必须满足以下要求: 1、可以在局域网内,自行架设服务器。 2、文件以及信息传输过程中必须进行加密。 3、必须有完整的组织结构,并且实名制。 4、可以由管理员自己进行用户管理。 5、可以进行即时文本信息、图片等内容的交流,支持离线收发。 6、可以在用户之间传输文件,支持离线收发。 7、可以进行语音以及视频方面的交流,并使用USBPhone 进行通话。 8、支持短信的发送。 9、界面友好,使用方便,符合国内的使用习惯。 10、 必须可以与“办公自动化系统(OA )”进行集成。 腾讯通(RTX )软件从应用角度看,也分为以下三个部分: 1、 腾讯通(RTX )软件的主体功能。 通过部署腾讯通(RTX )软件,即可以使用腾讯通(RTX )的主体功能。可以轻松地通过服务器所配置的组织架构查找需要进行通讯的人员,并采用丰富的沟通方式进行实时沟通。文本消息、文件传输、直接语音会话或者视频的形式满足不同办公环境下的沟通需求。 2、 腾讯通(RTX )与其它系统集成。 腾讯通(RTX )通过开发可以与其它应用系统集成,如与“办公自动化系统(OA)”进行集成。通过集成能够实现“状态感知”、“邮件提醒”、“流程提醒”、“单点登录”等功能,可以让日常办公人员在第一时间接收到消息提醒,大大提升工作效率。 与“办公自动化系统(OA )”集成可以实现以下功能: 状态感知 可以在OA 系统的IE 页面中展现用户是否在线,并可以点击标记直接使用RTX 的相关功能。
神州数码一体化融合指挥平台 解决方案 北京神州数码有限公司 2016年4月
目录 1.概述 (4) 2.方案设计 (5) 3.业务描述 (6) 3.1.可视化GIS调度 (6) 3.1.1.多种地图模式 (6) 3.1.2.人员实时定位 (7) 3.1.3.运行轨迹回放 (7) 3.1.4.快速检索查询 (8) 3.1.5.一键指挥调度 (8) 3.1.6.圈选指挥调度 (9) 3.2.可视化视频调度 (10) 3.2.1.一键视频预览 (10) 3.2.2.多路图像轮循 (10) 3.2.3.多路窗口切换 (11) 3.2.4.视频图像推送 (11) 3.2.5.视频图像分发 (12) 3.2.6.音视频联动调度 (13) 3.2.7.视频图像录制 (13) 3.2.8.视频图像抓拍 (13) 3.3.可视化语音调度 (13) 3.3.1.一键语音呼叫 (13) 3.3.2.多路来电队列 (14) 3.3.3.紧急报警来电 (14) 3.3.4.紧急电话会议 (15) 3.3.5.紧急混合广播 (16) 3.3.6.集群对讲调度 (16) 3.3.7.文本数据调度 (17) 3.3.8.其他调度功能 (18)
3.4.手持终端调度 (18) 3.4.1.通信录 (18) 3.4.2.视频采集回传 (19) 3.4.3.集群对讲 (20) 3.4.4.呼叫业务 (20) 3.4.5.即时通讯(含文字、图片、音视频) (21) 3.4.6.实时音视频通信 (21) 3.4.7.图片拍传 (21) 3.4.8.地图定位 (22) 3.4.9.语音会议 (23) 3.4.10.视频调阅 (23) 3.5.可视化预案调度 (24) 3.5.1.自定义预案类型 (24) 3.5.2.自定义触发方式 (24) 3.5.3.查询预案执行结果 (24)
中兴石油石化小区综合通信解决方案 2010-05-25 石油石化是我国重要的基础产业,它为国民经济的运行提供能源和基础原材料,石化行业的地位不仅体现在其占国民经济的比重上,也体现在其对整个国民经济提供的基础性作用上。石油石化企业均为人员众多的特大型驻地单位,往往在驻地内或者周边区域中还建有较大规模的职工家属住宅小区,这些小区住户的通信业务的开展也直接关乎着企业员工的生活质量,甚至也联系着和谐社会、和谐家庭的建设。 这些石油石化驻地小区的通信系统往往由企业自行采购设备建网,只需要在网络出口接入到运营商系统。此方式能有效降低住户内部语音通话费与宽带月租费,也是大部分石油石化小区普遍采用的方式。 另外随着社会的发展,人们对于通信业务的需求不断增长,通信业务的需求呈多样化、差异化和多媒体化发展,除了传统的话音等窄带业务外,对于宽带数据业务、多媒体业务和视频通讯业务的需求也迅速增长,更多用户开始关注基于宽带的新业务如3D网络游戏、远程教育、视频会议、可视电话、视频点播和IPTV等,这些宽带业务的开展都离不开足够的带宽保证。同时,以宽带IP技术为基础,利用数据网络搭建的NGN软交换平台,也逐步在替代传统的程控交换机。NGN网络不但与数据网络融合实现了VOIP语音业务,而且可以提供多媒体、视频等各种丰富的业务、具有附加功能和充足的发展空间,并能和工业信息化、办公自动化等系统有机结合,一套NGN平台不但可以家属区和办公区共用,也为企业今后的网络发展奠定了良好基础。 2. 石油石化小区综合通信解决方案 2.1 总体解决方案 石油石化小区作为企业的生活区与家属区,对于通信方面最主要的需求体现在固定语音电话和宽带接入两个方面,随着技术的发展,传统的程控交换与单纯DSLAM宽带接入方式已经逐步面临淘汰,而基于IP 的软交换技术和基于无源光网络PON的宽带接入技术已日益成为主流,其具有高带宽、多业务、扩展性强等多种优势。基于这两种技术的石油石化小区的总体解决方案如下图所示: 整个方案以企业内部数据承载网为基础,通过设置软交换SS、接入网关AG、以及归属位置寄存器SHLR 和业务应用服务器来实现用户的语音、多媒体通话的功能,以及相应的一些增值服务。在用户接入侧,使用EPON接入,根据小区的情况不同,可灵活选用EPON+LAN,EPON+xDSL,EPON+EOC等方式,EPON接入方案可综合提供语音、数据、视频、CATV等全方位业务。 2.2 软交换语音解决方案 依托于IP宽带数据网的传输、路由及带宽资源,通过灵活的组网方式可实现全新的多媒体本地端到端的综合业务,组网方式如下图所示: 该方案中,软交换核心控制设备(软交换)、中继网关(TG)、信令网关(SG)、业务服务器、综合网管等设备均放置于数据网的核心节点。软交换主要完成用户的呼叫控制、信令处理、资源管理、业务代理、协议适配、CDR文件生成等;TG主要完成PSTN网与IP网媒体的转换;SG主要完成PSTN网与IP网七号信令的转换;业务服务器通过标准的API与软交换互通,提供基于中兴软交换系统的新型智能业务与增值业务;综合网管系统对全网进行实时、有效的管理。软交换与TG之间采用H.248、MGCP协议,与SG之间采用Sigtran协议,与业务服务器之间采用Parlay或SIP协议。 用户的接入可根据不同用户具体网络环境与用户需求,选择采用xPON、MSAG、IAD、IP智能电话、IP 视频电话及软PHONE等设备实现接入。 2.3 EPON接入解决方案 EPON接入方案非常灵活,根据小区的情况不同,可以选择如下几种方案: 1)、EPON+LAN方案 2)、EPON+xDSL方案
im,解决方案 篇一:IM系统介绍 IM系列产品介绍 IM产品系列 一、IM生产制造管理系统 1) IM生产制造系统核心流程图 2)流程讲解 生产制造型管理系统以客户订单为主线,客户订单结合当前物料库存信息和物料清单信息经过系统客户订单分解后,生成采购需求单和车间排产单两种计划单据。采购需求单经过确认后直接生成采购订单,根据采购订单生成采购入库单,并更新库存信息。车间排产单结合当然库存信息经过确认后直接生成车间领料单,根据排产状况,经由领料单生成领料出库单,并且更新库存信息。经过车间作业,车间排产单结合领料信息生成生产入库单,并更新当前库存信息,经过循环的生产过程直至最后客户订单商品入库,最后根据客户订单出货,完成整个生产制造过程。 3)系统特点 ①物料清单采用树型结构,清晰且容易维护
②客户订单BOM分解时,可以考虑当前库存的安全库存信息 ③客户订单BOM分解时,可以考虑采购周期,检验周期和准备周期因素④客户订单BOM分解时,可以考虑生产周期因素,重新安排排产 ⑤ BOM分解后的采购需求单可以自动转换为采购订单 ⑥ BOM分解后的生产排产单可以自动转换为车间领料单 ⑦生产入库时成本采用实际用料成本均衡分摊 ⑧入库出库必须严格匹配订单数量 ⑨严格跟踪订单状态和用户系统操作处理日志 ⑩采用事务控制机制,确保系统操作完整、安全、可靠、可恢复 ? 生产入库和损耗计算严格根据BOM清单进行约束 ? 采购和领料订单可以通过电子流程严格监控管理 ? 严格的库存管控,库存预警系统,用来警报库存积压等信息 ? 自由、自主的规则定义可以定制生产系统完全符合企业本身特点而运行
医学影像科检查流程及操作规范
医学影像科(放射科)检查流程 1、登记工作站登记并核对X线检查的者信息,安排受检者到相应检查室检查。 2、检查室医生核对被检查者信息后,带领者至检查室按检查要求,摆好相应体位;并告知受检者检查注意事项。 3、检查室医生再次核对检查者信息、检查部位及检查要求,完成对受检者的检查;并告知取报告时间。 4、诊断医师核对受检查信息、检查部位及检查要求;完成诊断报告,急诊、病情危重者及时发出报告。 5、上级医师审核并发出报告;疑难病例经科室集体阅片后发出报告。
祥云县中医医院放射科DR检查操作规 范 一、接到已交费申请单,核对姓名、检查项目及收费情况;并 告知受检者到候检区等候检查。 二、登记工作站录入受检者检查相关信息。 三、检查工作站选择受检者并核对姓名、年龄、检查部位、摄 片体位(平台或立式)。 四、呼叫受检者姓名并核对年龄,告知被检者及家属X线检查 注意事项,需要家属陪同时为家属及受检者提供必要的防护用品。 五、按检查要求,协助受检者摆好相应体位;并告知受检者相 关检查注意事项。 六、检查结束后核对检查信息,告知受检者或家属取检查报告 的时间和地点。
七、检查中遇到危急值及时打出胶片,并告知诊断医生。 祥云县中医医院放射科CT检查操作规范 一、接到已交费申请单,核对姓名、检查项目及收费情况;并告知受检者到候检区等候检查。 二、登记工作站录入受检者检查相关信息。 三、检查工作站选择受检者并核对姓名、年龄、检查部位、检查时的体位。 四、呼叫受检者姓名并核对年龄,告知被检者及家属检查注意事项,需要家属陪同时为家属及受检者提供必要的防护用品。 五、按检查要求,协助受检者摆好相应体位;并告知受检者相关检查注意事项。 六、检查结束后核对检查信息,告知受检者或家属取检查报告的时间和地点。
摘要 近一、两年来,即时通讯软件(InstantMessenger)的发展突飞猛进。在短短的几年内,网络即时通信大有取代传统通信方式之势。继电子邮件之后,即时通讯对我们的通信方式又进行了一场革命,这种革命甚至延续到了我们的感情领域,只要双方都在互联网上。即时通讯所拥有的实时性、跨平台性、成本低、效率高等诸多优势,使之日益受到网民们的喜爱。随着互联网成长起来的“e一代”,在交换联系方式时已经习惯了交换QQ号。 本文介绍了网络即时通讯软件的发展过程及现状,五种最常用的即时通讯软件,以及即时通讯软件的最新发展。 关键字:即时通讯;网络发展;软件
目录 摘要 (1) 一、即时通讯 (3) (一)概要 (3) (二)即时通讯软体 (4) 二、国内常用的五种即时通讯软件 (4) (一)QQ (4) (二)MSN (5) (三)阿里旺旺 (6) (四)百度hi (6) (五)POPO (7) 三、即时通信软件的现状 (8) 四、即时通信行业发展趋势 (9) 五、总结 (10)
一、即时通讯 即时通讯(Instant messaging,简称IM)是一个终端服务,允许两人或多人使用网路即时的传递文字讯息、档案、语音与视频交流。分电话即时通讯手机和网站即时通讯代表百问https://www.doczj.com/doc/c011179092.html,,手机即时通讯代表是短信,视频即时通讯如QQ,MSN,百度hi等应用形式。 (一) 概要 即时通讯是一个终端连往一个即时通讯网路的服务。即时通讯不同於e-mail在於它的交谈是即时的。大部分的即时通讯服务提供了presence awareness的特性──显示联络人名单,联络人是否在缐上与能否与联络人交谈。 在早期的即时通讯程式中,使用者输入的每一个字元都会即时显示在双方的萤幕,且每一个字元的删除与修改都会即时的反应在萤幕上。这种模式比起使用e-mail更像是电话交谈。在现在的即时通讯程式中,交谈中的另一方通常只会在本地端按下送出键(Enter或是Ctrl+Enter)後才会看到讯息。 在网际网路上受欢迎的即时通讯服务包含了MSN Messenger、AOL Instant Messenger、Yahoo! Messenger、NET Messenger Service、Jabber、ICQ与QQ。这些服务有赖於许多想法更久的(与普遍)的缐上聊天媒介,如Internet Relay Chat一样知名。 1970年代早期,一种更早的即时通讯形式是柏拉图系统(PLATO system)。之後在1980年代,UNIX/Linux的交谈即时讯息被广泛的使用於工程师与学术界,1990年代即时通讯更跨越了网际网路交流。1996年11月,ICQ是首个广泛被非
放射科 基本技术操作常规 放射检查(DR、CT)患者须知 1、放射检查是临床应用普遍的常规检查,可应用于人体各部位,是对疾病进行诊断的重要方法。 放射检查由医师根据患者病情需要提出检查申请,经放射科审核无误,按规定计费后进行检查。 2、如过去在我院进行过放射检查,再次检查时请提供检查号码,尽可能提供以往老片或其它影像资料,以利病情的对比观察。 3、检查按医疗规程进行,应满足临床诊疗需要,重视对患者的防护并保护患者的隐私。 放射检查有放射性,我院严格执行国家法律法规,机房、设备及医务人员均符合国家规定,在我院进行的放射检查能保证患者所受照射在国家允许的安全范围内。 有放射线的场所均有明显通用的放射线警示标志,患者应在有防护的区域候诊,禁止在机房内候诊。 X线可能对胎儿产生不利的影响,非特殊必要孕妇禁忌放射检查,对育龄妇女及婴幼儿严格掌握适应证,避免不必要的曝光。 4、检查完毕,检查医生告知患者出报告时间,急诊 30-60分钟,普通下一个正常工作时段到窗口签收检查报告
及取DR或CT片,然后到相应临床科室就诊。 5、我院引进的世界先进设备西门子CT,中科美伦DR。诊断质量及检查范围明显提高和扩大,工作流程简化,扫描速度快,射线量低,影像清晰,对比度高,为患者提供更加优质的放射检查服务。 检查室工作制度 一、保持摄片室整洁卫生,室内温度控制为25°、湿度控制在35%~55%之间,机器、器械和用具处于工作和使用状态。 二、机器设备由专人负责,严格交接班制度。机器发生故障,机器使用者及时向技术组长和维修人员报告,并向维修人员详细说明故障的现象,共同分析故障的原因,并详细记录 三、严格管理、提高机器的使用效益,建立机器使用登记制度。 四、仔细阅读申请单,根据接诊临床及本科医师要求,选择最佳的投照方法和投照体位,必要时与当班医师联系,共同研究确定检查方法。 五、热情接待患者,耐心解释检查方法和注意事项。更衣或去除金属或X线不透明装饰物,并详细地回答患者的询问。 六、工作应认真仔细,摄影要做到三查四对。
即时通讯优化方案
目录 前言 (3) 第1章当前平台IM技术介绍 (4) WebRTC简介 (4) WebRTC优劣 (4) 第2章当前平台IM的突破方向 (5) 2.1视音频编解码技术 (5) 2.2设备对恶劣网络环境的适应能力 (6) 2.3音频处理技术 (8) 2.4 IM主流应用功能的开发 (9) 研发风险评估 (9) 第3章第三方IM方案分析 (10) 使用第三方IM流程图 (10) 主流的第三方平台 (11) 使用第三方平台的优势 (11) 环信IM平台 (12) 第4章总结 (14)
前言 本方案产生的背景是纺织服装平台已经初步搭建即时通讯服务,实现Web 视频聊天功能,并经过一段时间的使用测试,对所发现的用户体验问题、多客户端互通问题和技术问题的描述,针对这些问题及对即时通讯功能后续发展规划,做出此优化方案。 IM是(Instant Messaging) 的英文缩写,全称为即时通讯技术,现在比较有名的产品有:腾讯QQ、MSN、微信、中国飞信等等产品,即时通讯是一整套解决方案,其中包括了IM后端服务、IM客户端、硬件配置。后端的服务由众多的业务系统组成,如:Session存储、用户信息系统、文件管理系统、实时音视频服务、消息处理、推送系统等等构成,是一套业务复杂、流程大的处理方案。
第1章当前平台IM技术介绍 当前平台的IM实现是基于WebRTC技术进行构建的,与传统的中心服务型IM技术有根本的不同。 WebRTC简介 WebRTC是HTML5支持的重要特性之一,Web开发者能够基于浏览器(Chrome\FireFox\...)轻易快捷开发出丰富的实时多媒体应用,而无需下载安装任何插件,Web开发者也无需关注多媒体的数字信号处理过程,只需编写简单的Javascript程序即可实现。 终端用户通过本机浏览器与信令服务器进行信令信息交换,在获取到足够的信息,自动与其他终端建立通讯链接,实现P2P视频聊天。 WebRTC优劣 WebRTC优势 WebRTC是HTML5的主要特性,是国际组织W3C制定的行业标准。目前WebRTC已经得到谷歌、微软、苹果等公司的大力发展并且在普及推广应用。让苹果、安卓手机使用浏览器进行视频会议成为可能。WebRTC使用的是P2P技术不占用服务器资源,节省了大笔服务器部署费用。
应急通信解决方案 篇一:通信应急系统的方案 车载通信系统解决方案 一、背景 应急通信是为应对自然或人为突发性紧急情况,综合利用各种通信资源,为保障紧急救援和必要通信而提供的一种快速响应的特殊通信机制。在各种自然灾害和突发事件对电力设施产生破坏时,当正常通信不能保障时,为了能可靠有效地进行应急通信,指挥抢救任务,组建一套车载通信系统是保障我们电力抢修效率的重要保障。 根据我单位工作性质及实际情况,我们要能在佛山基本实现可靠的语音通信,要求能覆盖半径100KM,在现有的技术条件之下,经过筛选采用短波车载通信电台来实现上述要求。 二、通信应急系统解决方案 1、图示: 2、基本配置要求: (1)应急抢修车 (2)短波通信电台
(3)单兵背负式短波通信电台 (4)相应规格天线 3、备选的电台型号:(1)柯顿NGT SR短波自适应电台参考价格:45000/台 理论通信距离:3000KM 主要特点: 新型手持台:这种便携式手持台能以一种方便与连贯的方式进入编程和过程调用。它提供先进的人机界面,更高效的操作和更简易的网络管理。该手持台支持从传统的简便话音操作,到具有自带CALM的复杂呼叫过程在内的各种需求。 用户可以按照自己的需求把信道,功能和地址等信息编进机器里去。进入这些功能只需通过一系列热键。 内置的地址本能够贮存多达10个地址,并能很容易地通过菜单调用。这种便携式手持台能够安装在易见的任何地方,提供全面的信息显示。紧急选呼:NGT SR电台具有一种独特的紧急情况呼叫装置。求救信号能够自动地发送到选定的站址。 多信道:NGT SR电台具有400个信道的能力。
简易安装:在各个方面NGT SR电台都被设计成很容易安装,无论是在固定的还是在移动的环境中。设备很小,能够安装在便利的任何地方。 智能化监控:当电台处于静噪状态时,各种信道都能被监视到。任何被扫描到的信道,呼叫就可以被收到测试与保护所有的Codan电台都被全面地保护,以免诸如天线损坏、电压过压、反向极化等带来的系统失效,而这些故障常常能够损害别的品牌的电台。每一个注册用户都能够得到为期一半年的保修单。 高级功能特性:CODAN自动链路管理CALM/ALE( 可选)CODAN 自动链路管理CALM 与现用的FED-STD-1045ALE系统兼容。CALM通过发现最好的可用频道从而使系统性能最佳化。CALM收集一个频道的轮廓,以便电台能选择到最佳频道,即使是刚开始启动或切换上的电台。 新站能够自动地被网络管理系统所识别。CALM根据它所知道的台站类型(固定台或者移动台)优化频道选择。每秒钟可以扫描多至10个频道。 轻松交谈Easitalk:NGT SR采用数字信号处理技术处理接收到的语音信号,以使干扰最小化及减小噪音。Easitalk操作简便,充分的测试表明,它的性能不会因使用者语言不同而受影响。
RTX2006快速部署方法 一、最新版本及相关资料下载 RTX2006安装包及使用手册等详细资料除了从安装光盘获取外,也可以通过如下网址下载安装或阅读: https://www.doczj.com/doc/c011179092.html,/download/RTX2006SP120070124.rar 把下载的文件解压缩到本地硬盘目录中,获得4个文件: 服务端软件RTX2006SP1Server.exe 客户端软件RTX2006SP1Client.exe 如想对RTX进行二次开发,请使用如下两个SDK开发包: 服务端SDK开发包软件RTX2006SP1ServerSDK.exe 客户端SDK开发包软件RTX2006SP1ClientSDK.exe 二、软件安装部署 本部分内容将一步一步指导您进行RTX的安装,设置部门、添加用户,本指引主要是指导用户顺利使用RTX,并不是详细的使用手册,相关手册到RTX官方网站下载。 注意:RTX只支持Windows2000以上操作系统,请确保你的操作系统符合要求。 a)安装服务器 1)双击运行RTX2006SP1Server.exe服务端安装包文件; 2)阅读说明按下一步,跳过引导页; 3)仔细阅读RTX的许可协议说明,确认后,按我同意,跳过许可协议页; 4)选择安装路径,按安装按钮,耐心等待几分钟(时间长短以系统性能而定); 5)出现安装完成页面,按完成按钮,完成服务端软件的安装操作; b)配置组织架构及用户 1)点击开始菜单,指向所有程序,指向腾讯通,并选择腾讯通RTX管理器; 2)在左边选择用户管理组,选择组织架构页,如下图: 3)点击添加部门,输入部门名称(如开发组),按确定; 4)重复步骤3,添加多个部门;
xx汇联智能客服系统 解决方案 一、背景 随着移动互联网时代的到来,终端设备从传统的PC、电视、电话到新的智能手机、pad、穿戴设备等层出不穷,接入渠道从传统的网点、电话、网站、邮件到即时通讯、微博、微信、SNS等不断涌现,网络信息呈现出碎片化、移动化、实时化、个性化、多媒体化、大数据化的特点。一方面,对于信息服务提供商:全渠道的信息及资源,需要快速梳理并形成知识库,以便更好更及时的为客户服务;另一方面,对于信息的使用者:越来越快节奏的生活,价值移动互联全媒体时代来袭,使得人们对于服务提出了更高的要求:要求及时、快速、准确的全渠道服务。这就给信息管理和服务带来全新的挑战,传统的呼叫中心、客服中心已经面临无法承受之重。 与此同时,人工智能领域的智能机器人技术,在近年取得长足发展,与基因工程、纳米科学一起被称为21世纪三大尖端技术,是基础性、战略性的技术,能够对生产生活方式产生革命性的影响。 基于在政府、企业、金融等行业的多年行业经验积累,xx汇联采用多种人工智能技术,专门针对政府、企业、金融等特定领域,成功
开发出微喂智能机器人系统。系统支持自然语言人机交互,支持面向互联网、微信、移动APP等全渠道,支持语音识别和语音合成等技术。 二、系统特点介绍 丰富的行业背景,服务更专业 依托xx汇联领先的行业内容管理解决方案,借助三千多家行业客户项目的交付运维经验积淀,xx汇联智能机器人凭借预置的领域知识,应用多种人工智能技术和知识工程方法,深入理解用户问题的内在语义,挖掘用户真正关心的答案,xx推荐用户可能感兴趣的相关知识,可以跟用户进行各种语境下的多轮对话,与同类产品相比,更加专业,更加智能。 本体类方法,知识库构建更敏捷 xx汇联智能机器人,凭借新一代的知识本体类方法,从更符合人类思维的角度,将现实世界中的概念及概念之间的关系抽象为实体和方法,通过实体完成知识实例的积累,通过方法实现知识表达的丰富,能够基于客户历史数据更快速地完成知识库构建,相比同类产品,知识库构建周期缩短30%。 全方位问题解答,答案更丰富
放射科操作规程 一、开机前巡查机房、控制室、电源很有等,做好准备工作;开启通风设备,保持机房内良好的通风。 二、正确佩带个人剂量计。 三、认真核对患者姓名,明确检查目的和要求,做好登记。 四、选择适宜工作条件实施投照。透视时,必须做好充分的暗适应,在不影响诊断的原则下,应尽可能使用“高电压、低电流、厚滤过、小照射野、间歇式曝光”进行操作;在摄影时,根据不同的管电压更换附加铝过滤板,将照射野限制在实际需要的范围内,放射工作人员必须在屏蔽室内进行曝光。 五、对患者进行检查时,非投照部位进行屏蔽防护,其他人员不应留在机房内,如确需陪伴,均应提供必要的防护用品。 六、根据放射影像专业知识及有关标准,做出临床诊断,出具诊断结果报告单。 七、在使用过程中如发现放射诊断设备异常情况或故障时应立即停止使用,在查明原因,设备恢复正常后方可从新工作,并将故障和维修情况登记备查。
岗位职责 一、放射医、技师应熟悉并遵守国家有关放射诊疗管理的有关规定和要求,认真做好自身及有关人群的放射卫生防护工作。 二、爱护放射诊疗设备,进行经常性保养,及时调整机房温、湿度,保证设备正常运行,各种仪器设备及附属用品使用完毕后必须归还原位。 三、放射医、技师应熟悉放射诊疗设备的性能及各部件的使用方法,业务技能熟练。严格遵守操作规程,不擅自更改设备的性能参数,避免工作的随意性。 四、进行放射诊疗操作前应事先告知受检者辐射对齐健康的影响。扫描前仔细阅读申请单,了解病情及检查要求,合理选择胶片大小及投照条件,查对号码姓名,检查完后详细填写各有关项目,特检需记载造影剂名称,用量、反应及处理过程。 五、增强防护意识,开展放射诊疗工作时,尽量使用小照射野,对换者敏感部位进行必要的防护。 六、对病人热情耐心,检查中随时注意病人情况,发现问题立即停止检查并及时处理;对陪护人员应事先告知辐射对健康的影响和提供必要的防护措施。 七、爱护设备及室内设施,及时整理机房,清洁设备,保持室内整洁,下班前切断电源关好门窗。
即时通讯解决方案 需求分析: 在办公和商务领域,随着各大企事业单位规模的进一步扩展,员工通常并不处于同一办公室中,这样,电话、即时通讯工具就成了日常工作中最常用的沟通工具。 据权威调查数据显示,即时通讯已经成为继电话、电子邮件之后,使用频率极高的沟通工具之一。目前,市面上流行的即时通讯工具有娱乐性较强的QQ、倾向于日常商务应用的MSN、倾向网络语音功能的Skype等。这些软件,大都侧重于某一方面的功能,比如文字消息、语音聊天等,尽管能够满足普通的办公需要,但在互动性方面,仍然具有先天性的缺陷,无法提供面对面沟通时真实的体验。 我们需要寻求一种既能满足随时随地的在线沟通、又能提供身临其境的体验,并且节省时间、节省费用的即时通讯工具。 应用分析: ?网络环境: 即时通讯的应用普遍对网络环境要求不高,只要具备普通的宽带即可进行沟通。目前,各大企事业单位都建立有各自的局域网,由局域网再通过各种方式接入Internet,这样,总部和各分子机构之间就形成紧密连接的网络环境,可以十分方便地进行即时通讯应用。 ?系统部署: 支持视频应用的即时通讯系统能快速帮助用户加强紧密协作,大幅度提高工作效率,简化流程;并且部署简单,能适应所有网络,综合性价比十分出色,安全性高,已经成为最具前瞻性的即时通讯软件。 视高视频会议服务平台可以根据应用环境、应用形式的不同灵活进行配置,平台由遍布全国的100多台高性能服务器联结高速网络形成,为用户提供稳定、安全的企业级数据和网络管理中心,使您无论身处何方都能方便快捷地登录服务平台进行即时通讯应用。 此外,服务平台还为用户提供高质量的视频和语音,并且还内嵌丰富的数据协作功能,支持在线协同办公和网络存储,极大地提升服务平台的功能性、可用性、易用性和移动性。 ?系统配置: 桌面应用:只需选配网络摄像头和耳麦即可。 会议室应用:可以有选择性地选配视频采集卡、模拟摄像头、投影仪或液晶显示器作为视频设备,选择麦克风和音箱作为音频设备。
腾讯通RTX方案
RTX 正式版 腾讯通(RTX)方案 技术白皮书 腾讯通技术支持服务中心 4月
目录 一、需求概要 ...................................................................... 错误!未定义书签。 二、系统概述 ...................................................................... 错误!未定义书签。 三、腾讯通(RTX)产品介绍............................................. 错误!未定义书签。 1、什么是RTX ............................................................... 错误!未定义书签。 2、RTX的优点............................................................... 错误!未定义书签。 四、腾讯通(RTX)的主体功能介绍 ................................. 错误!未定义书签。 五、与短信的融合管理....................................................... 错误!未定义书签。 六、与腾讯通RTX视频会议插件完美融合...................... 错误!未定义书签。 1视频会议与RTX集成的原理 .................................. 错误!未定义书签。 2、集成说明 ............................................................... 错误!未定义书签。 3、即时会议: ........................................................... 错误!未定义书签。 4、与RTX集成功能 ................................................... 错误!未定义书签。 七、腾讯通(RTX)与其它应用系统的集成 ..................... 错误!未定义书签。 1、集成思路(以下皆以“办公自动化系统”举例)错误!未定义书签。 2、“办公自动化系统”到RTX的单点登陆............... 错误!未定义书签。 3、RTX到“办公自动化系统”的单点登陆................ 错误!未定义书签。 4、流程消息提醒.......................................................... 错误!未定义书签。 5、用户数据同步.......................................................... 错误!未定义书签。 6、RTX用户状态感知................................................... 错误!未定义书签。
第一章技术方案 3.1.工程概述 ?工程名: ?建设单位及项目负责人: 3.1.1.工程背景 随着移动互联网的爆发式发展,手机上的沟通变得越来越重要,即时通讯作为当 今互联网时代的一个重要通信手段,互联网时代的人、企业等已基本接受和习惯即时 通讯带来的各种便捷服务,各种即时通讯工具、聊天软件应用也如雨后春笋层出不穷,用户也越来越习惯利用在手机APP中植入的即时通讯功能服务进行在线即时聊天互动,获取产品或服务的信息,或进行人与人之间的沟通互动,当前四川电信通过积极探索 实践,在移动互联网领域也创新地开发出一些行业重量级的业务应用,对即时通讯能 力服务需求非常急迫,无专属即时沟通工具,买家与卖家间无即时沟通,订单及物流 通知未及时送达;QQ、微信等第三方即时通讯工具,只能解决交流的问题,而无法对 用户体验和平台无缝性带来帮助,没有与自身产品线进行的深度集成,应用需求无法 真正满足。 因此建立一套统一的IM平台以及专属的聊天产品,对应用的推广与发展有非常重要的意义。 3.1.2.需求概述 鉴于电信自主运营应用对IM即时通讯能力服务有相应的集成需求,需要构建一套云即时通讯服务平台,为需要IM即时通讯的应用提供基础的即时通讯能力服务,支持嵌入到电信自主运营开发的业务应用中提供即时通讯服务,实现即时通讯基础服 务能力平台化、SDK类型丰富化,支持多应用接入。 同时基于IM即时通讯平台可以定制一套专属于自己的IM通讯软件,对数据的保密性、安全性以及功能的多样性都能很好的满足。
3.2.建设目的及原则 构建一套云即时通讯服务平台,为需要IM即时通讯的应用提供基础的即时通讯能力服务。同时基于IM即时通讯平台可以定制一套专属于自己的IM通讯软件,对数据的保密性、安全性以及功能的多样性都能很好的满足。 3.2.1.总体建设原则 11.2.1.1系统可用性原则 系统可用性(Availability)是用来衡量一个平台系统能提供持续服务的能力,它表示的是在给定时间系统或者系统某一能力在特定环境中能够满意工作的概率。 采用先进的技术和方法,满足和适应移动互联网技术更新速度,在满足开发时间 节点的要求下,满足用户的交互体验和功能需求,采用智能化的处理特色,满足运营 管理的效率要求。 在系统运行当中可能会影响到系统可用性的因素: 1.操作人员和组织 其实这个地方平台在使用中的管理员,他是否重视运维?组织是否已经认识平台带来的价值,把平台的可用性当作自己的一个核心能力来看待。是否把面向用户的业 务能力和运维很好的对接?是否建立起用户质量的组织文化。 2.业务流程 业务管理平台的流程梳理多个角色自己的关系和职责。我们第一个要去看这个流 程在面对故障的是否起到了积极的作用,比如说能够确保故障信息的准确送达,同时 保证处理人的角色和职责是清晰的。其次不断去检查流程是否可以自动化驱动,而非 人为驱动。人是不可靠之源!我们最终希望形成是一个自动化、标准化的流程,这样 的流程不容易被异化,且能保证预期执行结果一致。 3.后期的运维技术
智能客服系统解决方案 The manuscript was revised on the evening of 2021
中科汇联智能客服系统 解决方案 一、背景 随着移动互联网时代的到来,终端设备从传统的PC、电视、电话到新的智能手机、pad、穿戴设备等层出不穷,接入渠道从传统的网点、电话、网站、邮件到即时通讯、微博、微信、SNS等不断涌现,网络信息呈现出碎片化、移动化、实时化、个性化、多媒体化、大数据化的特点。一方面,对于信息服务提供商:全渠道的信息及资源,需要快速梳理并形成知识库,以便更好更及时的为客户服务;另一方面,对于信息的使用者:越来越快节奏的生活,价值移动互联全媒体时代来袭,使得人们对于服务提出了更高的要求:要求及时、快速、准确的全渠道服务。这就给信息管理和服务带来全新的挑战,传统的呼叫中心、客服中心已经面临无法承受之重。 与此同时,人工智能领域的智能机器人技术,在近年取得长足发展,与基因工程、纳米科学一起被称为21世纪三大尖端技术,是基础性、战略性的技术,能够对生产生活方式产生革命性的影响。 基于在政府、企业、金融等行业的多年行业经验积累,中科汇联采用多种人工智能技术,专门针对政府、企业、金融等特定领域,成功开发出微喂智能机器人系统。系统支持自然语言人机交互,支持面向互联网、微信、移动APP 等全渠道,支持语音识别和语音合成等技术。 二、系统特点介绍 ●丰富的行业背景,服务更专业 依托中科汇联领先的行业内容管理解决方案,借助三千多家行业客户项目的交付运维经验积淀,中科汇联智能机器人凭借预置的领域知识,应用多种人工智能技术和知识工程方法,深入理解用户问题的内在语义,挖掘用户真正关心的答案,关联推荐用户可能感兴趣的相关知识,可以跟用户进行各种语境下的多轮对话,与同类产品相比,更加专业,更加智能。 ●本体类方法,知识库构建更敏捷
放射科设备使用制度 1.使用前应详细了解机器的性能特点,熟练掌握操作规程及注意事项,保证正确安全使用机器设备。 2.开机前必须检查电源质量及设备外观是否正常,严禁机器带病使用。 3.严格遵守操作规程,确实保障机器安全运行及被检者的人身安全;严禁过载使用,尽量避免不必要的曝光。 4.使用过程中要求谨慎细心,准确操作,不可粗枝大叶,草率从事。发现问题立即停止。 5.对新上岗医技人员及进修、实习人员应先进行设备操作培训,由技师长考核合格后方可上机操作。 6.非本科室人员使用机器设备需经科主任同意,并有本科室技术人员在场,方可使用。 7.机器设备开机后,操作人员不得擅离岗位。 8.机器设备在使用过程中发现故障时操作人员应立即关机、关闭电源,及时向技术组长和科主任汇报,以便及时组织检修。 9.病人检查结束后及时清理机器及机房的污物,保持机器整洁。 10.每日记录机器设备的运行情况。
数字化X光机日常使用维护规程 一. DR仪器注意事项 1. 探测器亮红灯时,请立即关机,然后联系厂家; 2. 若工作站软件出现不能关闭,可能是提前关闭硬件所致,或者其他原因,可以在任务管理器的进程中进行关闭,多次关闭不行时,请重启电脑; 3. 拍片时尽量缩窗,腰椎侧位时,请让病人左手靠近探测器(即病人面向立柱); 4. 请不要更改系统时间!如果更改会导致系统无法使用,对此造成的损失由当事人负责; 5. 更改工作站软件设置后,请重新登陆,保证更改生效。 二、DR操作注意事项 1. 只有拍胸片距离为米,其余部位均为1米; 2. 拍腰椎、腹部、骨盆、胸椎时需要加滤线杉;其余部位均不需要加滤线杉; 3. 拍片时注意缩窗; 4. 每天早上值班人员需打扫卫生,开机进入拍片状态; 5. 仪器每天中午下班需要关机,下午上班后再开机; 6. 晚班时间有病人时再开机,没有病人时请将整个DR系统关闭; 7. DR系统工作站电脑禁止插U盘和可移动存储设备,否则
即时通讯系统方案
目录 1.客户端功能说明 (5) 1.1.多组织架构展现 (5) 1.1.1.个人群管理 (5) 1.1.2.联系人分组管理 (5) 1.1.3.部门互访 (6) 1.2.即时通讯 (6) 1.2.1.实时沟通 (7) 1.2.2.文件/目录传输 (7) 1.2.3.远程控制 (8) 1.2.4.语音视频 (9) 1.2.5.通知公告 (10) 1.2.6.视频会议 (11) 1.2.7.文档管理 (12) 1.3.手机客户端 (13) 1.3.1.组织架构展现 (14) 1.3.2.即时通讯 (15) 1.3.3.消息中心 (16) 1.3.4.文档中心 (18) 1.4.Web客户端 (18) 1.5.在线客服系统 (19) 2.服务端功能说明 (21) 2.1.组织架构管理 (21) 2.1.1.组织结构设定 (21) 2.1.2.管理用户信息 (21) 2.1.3.群设置 (22) 2.1.4.角色管理(权限控制) (22) 2.1.5.分级管理 (24) 2.2.系统工具 (25)
2.2.1.服务控制 (25) 2.2.2.自动升级设置 (25) 2.2.3.系统管理 (26) 2.2.4.系统检测 (26) 2.3.查询与统计 (27) 2.3.1.消息查询 (27) 2.3.2.登陆日志查询 (27) 2.3.3.消息统计 (28) 2.3.4.在线用户查询 (28) 2.3.5.公告信息查询 (29) 2.4.文档管理 (29) 2.4.1.文档存储管理 (29) 2.4.2.文档权限管理 (29) 2.4.3.文档日志 (30) 2.5.短信平台集成 (30) 3.即时通讯系统技术说明 (31) 3.1.体系架构 (31) 3.1.1.应用示意图 (32) 3.1.2.软件部署 (32) 3.2.软件安全机制 (33) 3.2.1.权限管理体系 (33) 3.2.2.用户登录验证 (35) 3.2.3.高效安全数据加密传输 (36) 3.3.系统性能保障机制 (36) 3.3.1.异步通信 (36) 3.3.2.负载均衡集群 (38) 3.3.3.数据缓存机制 (38) 3.3.4.支持服务的分布式部署 (39) 3.3.5.支持多服务器互联部署 (39)