
China’s industrial revolution:challenges
for a macroeconomic agenda $
M.Dutta *
Department of Economics,Rutgers—The State University of New Jersey,
75Hamilton Street,New Brunswick,NJ 08901-1248,USA
Received 23August 2004;received in revised form 1September 2004;accepted 3November 2004
Abstract
China’s industrialization over the past 30years has been an epochal event.As of 2000,the industrial sector’s share of GDP has grown to be about two-third of the total.The share of agricultural sector of GDP has expectedly declined from 42.2%in 1970to 11.9%in 2000.The sector’s total output however continues to grow as productivity increases.Has the service sector grown enough to support the overall growth of the Chinese economy?
China has earned her recognition as a foreign investment friendly economy.Foreign direct investment with 100%foreign ownership came in plenty,supported by a robust system of pro?t repatriation based on earnings in convertible currencies of exports of a part of newly manufactured products in China.China imported capital and paid for it by exports.China demonstrates a clear case of the import-export led model of industrialization and economic growth,not the simple export-led growth model,as discussed by some.
This paper discusses that challenges ahead of China are overwhelming.We present three issues for immediate attention,(a)Can China sustain a rate of growth of GDP at an annual rate of 10%for an inde?nite period?(b)How can China address the issues of income distribution across her 31province and also amongst the various income groups in a given industrialized province/region?(c)Can China ensure progressive augmentation of high-tech oriented productivity of her workforce by way of ensuring building up of necessary human capital?
$
An earlier version was an invited presentation at the international conference,sponsored by the Peking University jointly with the Beijing Forum at the university’s campus,Beijing,China,23–25August 2004,as published in the conference program.A Chinese language version is forthcoming.*Tel.:+17329327054;fax:+17329321558.
E-mail addresses:mdutta@https://www.doczj.com/doc/b718766048.html,,dutta@https://www.doczj.com/doc/b718766048.html,.1049-0078/$–see front matter #2004Elsevier Inc.All rights reserved.doi:10.1016/j.asieco.2004.11.006
It is argued that much of this can be accomplished by developing a macroeconomic framework with monetary and ?scal policy guidelines,well speci ?ed and transparent.Can China restructure its central bank,the Peoples Bank of China (PBOC)?A progressive money,banking and ?nancial sector with ability to absorb shocks of an industrial economy must be in order.How about the ?scal policy management by the Government of China —its Ministry of Finance?
Finally this paper argues that China ’s economic presence will help optimize the economic gains for the rest of the world.China has joined her Asian neighbors toward sponsoring Asian economic cooperation.Let the European Union paradigm be a learning model,and China has a leadership role to play in further developing Asia ’s continental economic regional model.#2004Elsevier Inc.All rights reserved.
JEL classi?cation:E3;E5;FO;F3;F4
Keywords:China ’s industrialization;Softening of the economy by economic policy management;Macro-economic framework to resolve the issues of income-distribution;Asian continental economic regional model
1.Understanding China’s economy
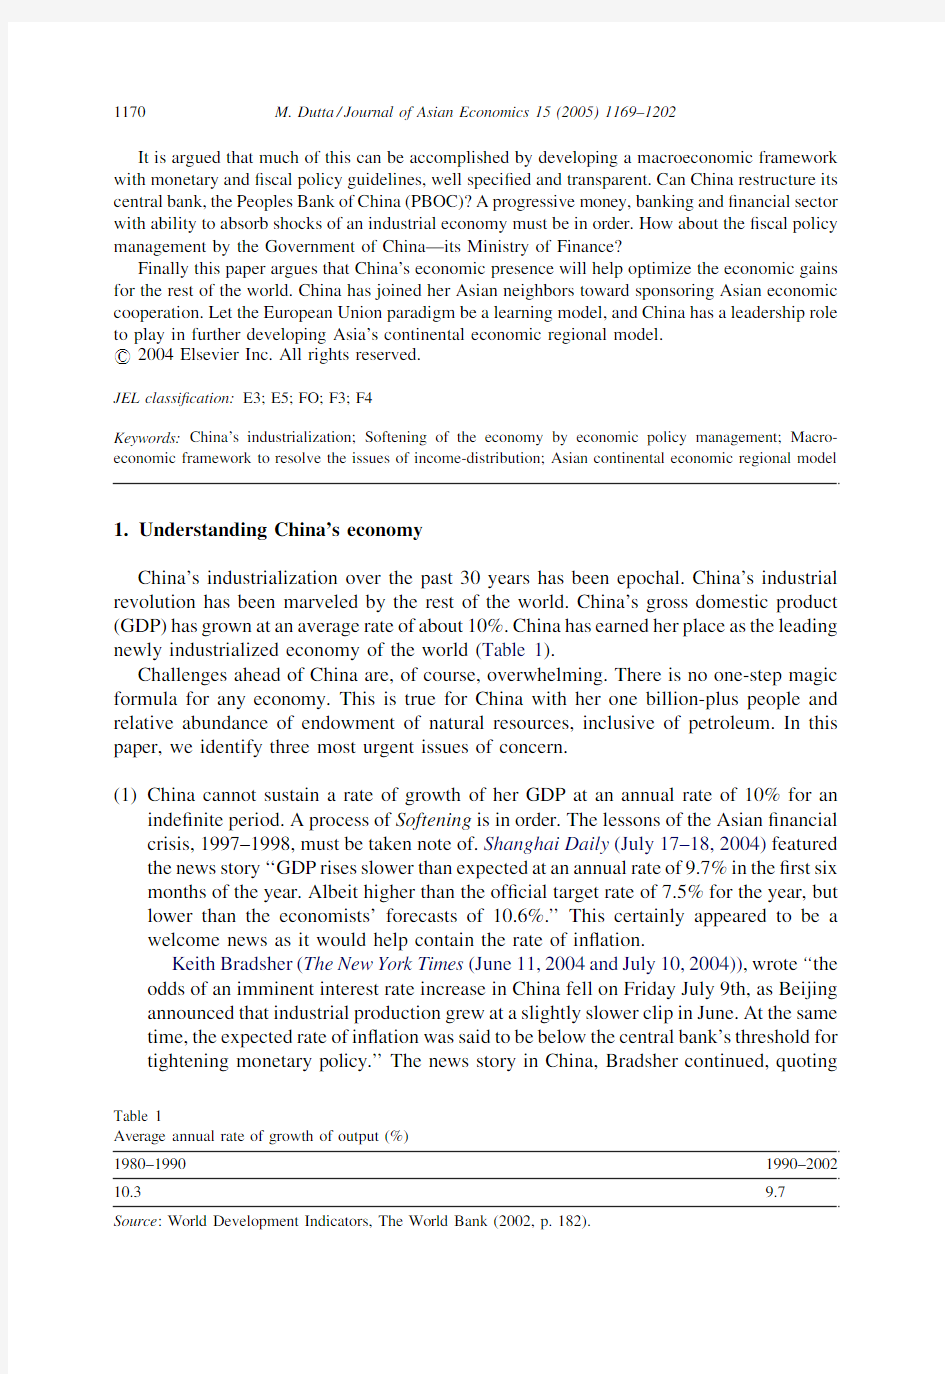
China ’s industrialization over the past 30years has been epochal.China ’s industrial revolution has been marveled by the rest of the world.China ’s gross domestic product (GDP)has grown at an average rate of about 10%.China has earned her place as the leading newly industrialized economy of the world (Table 1).
Challenges ahead of China are,of course,overwhelming.There is no one-step magic formula for any economy.This is true for China with her one billion-plus people and relative abundance of endowment of natural resources,inclusive of petroleum.In this paper,we identify three most urgent issues of concern.
(1)China cannot sustain a rate of growth of her GDP at an annual rate of 10%for an
inde ?nite period.A process of Softening is in order.The lessons of the Asian ?nancial crisis,1997–1998,must be taken note of.Shanghai Daily (July 17–18,2004)featured the news story ‘‘GDP rises slower than expected at an annual rate of 9.7%in the ?rst six months of the year.Albeit higher than the of ?cial target rate of 7.5%for the year,but lower than the economists ’forecasts of 10.6%.’’This certainly appeared to be a welcome news as it would help contain the rate of in ?ation.
Keith Bradsher (The New York Times (June 11,2004and July 10,2004)),wrote ‘‘the odds of an imminent interest rate increase in China fell on Friday July 9th,as Beijing announced that industrial production grew at a slightly slower clip in June.At the same time,the expected rate of in ?ation was said to be below the central bank ’s threshold for tightening monetary policy.’’The news story in China,Bradsher continued,quoting
M.Dutta /Journal of Asian Economics 15(2005)1169–1202
1170Table 1
Average annual rate of growth of output (%)1980–19901990–200210.3
9.7
Source :World Development Indicators,The World Bank (2002,p.182).
M.Dutta/Journal of Asian Economics15(2005)1169–12021171 The China Daily,that‘‘administrative measures’’had slowed growth in the economy threatening signs of economy’s‘‘overheating and rising in?ation.’’The issue of softening is in recognition.The choice of‘‘administrative measures’’vis-a`-vis monetary policy as a macroeconomic control tool remains open for China.
(2)Income distribution in its two facets—(a)inter-regional across China’s31provinces
and(b)intra-regional amongst income classes within a given province or a region, remains to be addressed to.
(3)Progressive augmentation of high-tech oriented productivity of the Chinese manpower
to minimize cyclical?uctuations in the process of progression of China’s industrial revolution merits serious attention.In addition,the Chinese economy must continue to remain competitive in the global market as other competing economies will successfully make high-tech productivity gains.
The three issues are inter-related and they can be managed by a well-speci?ed macr-oeconomic agenda,appropriately designed.Monetary and?scal policies are the core agenda of an economy’s macroeconomic policy,be it a capitalist market economy or a socialist market economy.In China’s socialist market economy,monetary and?scal policies must be lawfully de?ned and operationally transparent.It does take a village to raise a child.Market economy of any description can function successfully only with well-structured macroe-conomic parameters.Restructuring of People’s Bank of China(PBOC)warrants a review. Management of?scal policy and national budgetary policy merits a review too.
The macroeconomic framework will provide tools to soften the economy and contain exposure to possible?nancial crisis,as experienced by several Asian economies in1997–1998.Macroeconomic policies may appropriately be managed to minimize inter-regional income distribution,while?scal policies can be used to adjust income distribution across diverse income classes in a given region.Macroeconomic policies can also be managed to plan for upgrading China’s human capital by way of providing progressively better education and health care.Reallocation of available limited resources must focus on higher education and advanced research.
As a permanent member of the Security Council,China has a leadership position in the United Nations Organization with its present membership of191sovereign nation states. China has earned her membership of the International Monetary Fund and The World Bank,each with a current membership of184sovereign nation state economies—often referred to as the Breton Woods Institutions.China recently became a member of The World Trade Organization(WTO),at present a148member-nation group with an agenda of global free trade.Of course,China is a member of the World economic community.No sovereign nation–state economy can maximize its economic gain in splendid isolation.The European Union paradigm based on the emerging concept of continental economic regionalization will be a learning model for China and her fellow Asian economies. 2.China’s economic reform:industrialization and internationlization
‘‘To be rich is glorious.’’The proclamation was loud and clear.In the late1970s,the fact that China’s communist economy failed to deliver what it promised to China’s one billion-
plus people became pronounced.An agenda for economic reform was formulated.The new Communist Party leadership successfully won the challenge of the Gang of Four.The new leadership took full responsibility for the implementation of China ’s economic reform https://www.doczj.com/doc/b718766048.html,mitment was total and they went on to implement the agenda (Chow,1994,2004;Dutta,Chang &Lin,1990;Dutta &Zhang,1991;Dutta &Tantum,1988;Dutta &Merva,1990;Hooley &Yoo,2002;Jefferson,1990;Lardy,1983;Perkins,1975,1986,1988,1990;Tsao,1985;Wiemer &Cao,2004;Wu,Liang &Zhang,1995;Zhang et al.,1991,1995).
The immediate focus on agricultural reform was pragmatic.The food supply for a billion-plus people was an urgent consideration.The commune system of the earlier regime was replaced by the Family Responsibility System .Land now belonged to the family of a farmer,not to the Commune,as was the case in earlier communist regime under which the farmer worked and got a share of the output,the rest going to the government.Under the family responsibility system,the land belonged to the family of the farmer as long as the family continued to assume the responsibility of delivering the output as expected.Did the family own the land?So many issues came up for consideration and the leadership responded to them by a series of what we might call executive orders.And it worked to give incentive,market incentive,to farmers and the value-added in agricultural sector output became a record.It became a success story.The Green Revolution came to China as it did in many other economies at earlier decades (Table 2).
Fig.1a –f point to the fact that in earlier decades of reform the value added in the agricultural sector was more pronounced.In the later decades,the emphasis shifted progressively to the industrial sector.The service sector,which includes ?nancial markets did not appear to have expanded to match the demand of the immensely growing industry sector.
Table 3presents the sectoral shares of GDP.As of 2000,the industrial sector ’s share of GDP has grown to be about two-third of the total.China has emerged as a leading industrial economy.The share of the agricultural sector of GDP has expectedly declined from 42.2%in 1970to 11.9%in 2000.China ’s economic development pro ?le has been what it should be.The agricultural sector ’s total output continues to grow as productivity has increased.Be it noted that the decline in the agricultural sector ’s share of GDP follows from the fact that China ’s total GDP due to the expansion of its industrial sector has immensely increased.Has the service sector grown enough to support the overall growth of the Chinese economy?
Fig.2below presents China ’s sectoral employment pro ?le.China began as an agriculture-dominant,pre-industrial economy.In 1980,68.7%of employment was in its agricultural sector,declining to 53.5%in 1990and to 46.9%in 2000.Employment in the industrial sector over the same time period has been around a ?fth of the total employment;18.2,19.0and 17.5%in 1980,1990and 2000,respectively.The pro ?le of employment in the service sector has been 11.7%in 1980,9.5%in 1990and 12.3%in 2000.A vast majority of the Chinese continues to depend on the agricultural sector for their employment and https://www.doczj.com/doc/b718766048.html,pared with the employment pro ?le of the mature industrialized economies of the world,China continues to be too much dependent on its agricultural sector.China ’s industrial progress has yet to cover her one billion-plus people across the vast territory.(Note :Percentages in Fig.2do not add up to 100.)
M.Dutta /Journal of Asian Economics 15(2005)1169–1202
1172
M.Dutta/Journal of Asian Economics15(2005)1169–12021173 Table2
Sectoral shares of GDP,value added
Year Agriculture(%of GDP)Industry(%of GDP)Services,etc.(%of GDP) 196022.3244.8932.80
196135.5132.5931.90
196239.2932.0028.71
196339.9333.1526.92
196438.5735.3326.09
196537.9435.0926.97
196637.5937.9824.43
196740.2633.9825.76
196842.1531.1826.67
196937.9935.5626.45
197035.2240.4924.29
197134.0542.1523.79
197232.8643.0624.09
197333.3543.1123.54
197433.8842.7323.40
197532.4045.7221.88
197632.8545.4321.72
197729.4247.1323.45
197828.1048.1623.74
197931.1747.3821.44
198030.0948.5221.39
198131.7946.3921.83
198233.2745.0121.72
198333.0444.5922.37
198432.0143.3124.68
198528.3543.1328.52
198627.0944.0428.87
198726.7943.9029.31
198825.6644.1330.21
198925.0043.0431.95
199027.0541.6131.34
199124.4642.1133.43
199221.7743.9234.31
199319.8747.4332.70
199420.2347.8531.93
199520.5148.8030.69
199620.3949.5130.09
199719.0949.9930.93
199818.5749.2932.13
199917.6349.4232.95
200016.3550.2233.42
200115.8450.1034.07
200215.3851.0933.53
Source:World Development Indicators,The World Bank.
The reform agenda for the manufacturing/industrial sector based on the Enterprise Responsibility System failed to accomplish parallel success.Indeed,two simple reasons stood in the way:(1)The scale of production became an important factor for the minimization of unit cost of a product and make the products cost and quality competitive.
(2)Production in the industrial sector is relatively more capital intensive,and the situation was further challenged by the fact that competitively modern and productive machines and equipments,call it the physical stock of capital (K ),was to be imported from abroad.Successful reform in the agricultural sector made two substantive contributions to the reform in the manufacturing sector.First,the value-added in the agricultural sector pointed to the productivity gain per unit of labor (N ).More was produced by a lesser number of farmers.Surplus farmers now became available to migrate to the manufacturing sector and eased the labor demand.Secondly,success of the reform plans in the agricultural sector augmented farmers ’incomes and they were ready to spend money on consumption of goods and services,produced by the manufacturing sector and offered for sale in the market.Both the supply and demand levers became features of China ’s emerging socialist market economy.
The challenge for China to implement its agenda for reform in the manufacturing sector was to import capital goods from the world market.The preliminary efforts to invite contractual joint ventures (CJV),with contractual pro ?t,then with equity joint ventures (EJV)without any such pro ?t commitment failed to work mainly because entrepreneurial
M.Dutta /Journal of Asian Economics 15(2005)1169–1202
1174Fig.1.Sectoral Share of GDP,value added (a)1960,(b)1970,(c)1980,(d)1990,(e)2000,and (f)2002.
cooperation between China ’s state enterprises,owned and managed one hundred percent by the Chinese Government,and foreign investors from the capitalist market economies abroad failed to materialize.
M.Dutta /Journal of Asian Economics 15(2005)1169–1202
1175
Fig.1.(Continued ).
Special arrangements apart for petroleum,Foreign Direct Investment (FDI),owned and managed by foreign investors one hundred percent,resolved the situation.Foreign investors were attracted by relatively abundant labor supply at a consequently low wage rate and relatively abundant endowment of natural resources waiting to be exploited plus the potential market of one billion-plus consumers in China.China wanted a successful in ?ow of foreign investment as their domestic savings,given the low-income base,could not do the job.They needed employment and income and broadening of the Chinese economy.It could not be done without substantive reform of the manufacturing sector.Be it noted that the in ?ow of FDI into China over the past 25years has surpassed US$400billion (see Table 7).A marriage between China ’s socialist market economy and the savings-rich,high-income capitalist market economies of the world happily came to take place.China is perceived to be one of the most foreign investment friendly economies of the world.Foreign investors were able to repatriate pro ?t from their investments in China home by way of exporting a part of their Chinese products to the world market and earning export revenues in convertible currencies.Repatriation of pro ?t home encouraged further investment in China by foreign investors.Indeed,it became a win –win game plan.At this phase of China ’s industrial revolution,China imported technology and know-how from abroad.They were available in mature industrialized economies and their importation,a la FDI,and their adaptation to the indigenous resources,labor —both unskilled as well as skilled,especially in engineering —plus natural resources,became the
M.Dutta /Journal of Asian Economics 15(2005)1169–1202
1176Fig.1.(Continued ).
Table 3
Sectoral shares of GDP
1970
198019912000Agriculture 42.225.611.811.9Industry 44.651.775.964.0Service 13.222.712.324.1Total
100.0
100.0
100.0
100.0
Source :Asian Development Outlook,Asian Development Bank,Manila (1998,p.239);?gures for 2000ibid.,p.213;?gures for 1991ibid.,p.293.
key to China ’s industrial success.Indeed,much of the success story of Asia ’s newly industrialized economies followed this paradigm.I have referred to it as the paradigm of ‘‘adaptive innovation ’’(see Dutta &Tantum,1988,pp.17–46).The focus was on innovation,so that adaptation of imported technology could contribute to the industrial progress,enabling the pre-industrial,agriculture-dominant economies of Asia to manufacture cost and quality competitive products,part of which could be exported to the world market.They earned export revenues in convertible currencies,which became the resource pool for repatriation of pro ?ts home by the foreign investors and also for their continuation of investments in China.Klein (1990)emphasized the fact that the growth model was truly ‘‘import –export led ’’while others referred to it as the export-led growth model.The perspective of China ’s contemporary economic development,references must be carefully appreciated (Jefferson,1990;Perkins,1990).
China has successfully accomplished her present phase of industrial revolution.China now must be ready to accept the challenge of the next phase.Progression of industrial revolution is a process and the process can be sustained only by proper augmentation of human capital of China.In this presentation I argue that one of China ’s three challenges is necessary resource allocation toward human capital,with necessary and suf ?cient provisions for education,health care,and environmental protection for its manpower.Progression of industrial revolution is a process of the global economies and for China to sustain her competitive ability in the world market,participation in the process is a challenge.
Table 4presents average annual growth rates of China ’s GDP,10-year averages as well as 5-year averages.The process of progress as of 1970s must be noted.The ?ve-year period of 1990–1994recorded an annual average rate of growth of 10.66%,followed by
M.Dutta /Journal of Asian Economics 15(2005)1169–1202
1177
Fig.2.Sectoral share of total employment in China.Source :World Development Indicators,The World Bank.
subsequent years of moderation.Overheating of the economy and consequent in ?ationary threats had to be contained by administrative measures,softening the rate of growth of GDP.
Table 5and Fig.3a and b present the historical pro ?le of China ’s GDP growth rate from 1960through 2002.One notes the economic turmoil of the 1960s and 1970s,and the pattern that followed the economic reform agenda of the later years.
Table 6presents China ’s employment growth pro ?le for 1960–2002and demonstrates the contributions made by the country ’s female labor force.In 1960,the labor force was 52.6%of the total population and females constituted 40.5%of the total labor force.In 2002,the percentages were 60.1and 45.2%,respectively.
Table 7relates the in ?ow of FDI into China to the growth GDP from 1981through 2002.During 1981–1992,the share was relatively marginal.In 1993,the share moved up to 6.4%from the low of 2.8%in 1992.For 1996–1998,the share declined to about 5%,while for 1999–2002it further declined to a share of about 4%.
Fig.4shows the correlation amongst GDP growth,net in ?ows of FDI,Gross Domestic Savings,Gross Capital Formation,and Employment Growth.The pro ?le demonstrates that China ’s socialist market economy is in general following the patterns of a market economy.Table 8presents the relevant data set used for Fig.4.
In Table 9,we offer to calculate the relationship between capital formation and FDI.The exercise will have to be further continued once a disaggregation of in ?ows from ‘‘Other Sources ’’are possible.
Table 10extends the analysis to correlate Gross Domestic Savings and Gross Domestic Capital Formation.(Note :Gross Domestic Savings in Table 10are calculated:GDP ?Gross Domestic Savings Percentage.)
M.Dutta /Journal of Asian Economics 15(2005)1169–1202
1178Table 4
Period averages of growth rate Time period GDP growth (average %)Period average 7.4310-year averages 1960–1969 2.711970–19797.441980–19899.751990–19999.712000–20027.835-year averages 1960–1964à1.411965–1969 6.831970–19748.081975–1979 6.801980–19849.641985–19899.861990–199410.661995–19998.762000–2002
7.83
*
Calculated from GDP and annual growth rate,Table 5.
M.Dutta/Journal of Asian Economics15(2005)1169–12021179 Table5
GDP and annual growth rate(%)
Year GDP(constant1995US$,in billions)GDP growth(annual%) 196062.92
196145.87à27.10
196243.07à6.11
196347.5210.34
196455.0415.84
196564.0516.36
196670.9110.70
196766.86à5.70
196864.12à4.10
196974.9616.90
197089.5019.40
197195.777.00
197299.41 3.80
1973107.267.90
1974109.73 2.30
1975119.278.70
1976117.36à1.60
1977126.287.60
1978141.0611.70
1979151.787.60
1980163.627.80
1981172.13 5.20
1982187.799.10
1983208.2610.90
1984239.9115.20
1985272.3013.50
1986296.268.80
1987330.6311.60
1988367.9911.30
1989383.08 4.10
1990397.64 3.80
1991434.229.20
1992495.8814.20
1993562.8213.50
1994633.7412.60
1995700.2810.50
1996767.509.60
1997835.048.80
1998900.187.80
1999964.097.10
20001,041.228.00
20011,119.317.50
20021,208.858.00
Source:World Development Indicators,The World Bank.
China’s rate of industrialization and GDP growth rate became spectacularly high and China became a competitor in the world economy.Countries that invested in China made pro?ts at a market rate and experienced economic growth without in?ation.Much to the surprise of many,the traditional Phillips Curve came to be held in abeyance and no inverse
relationship between higher rate of employment and growth,and the price level became evident in USA in late 1990s.
Joint ventures are operationally more problematic unless the cooperating economies with joint ventures are at parallel level of industrialization with competitive ability to absorb market shocks.Paradigms that worked for the reconstruction of WWII-ravaged economies in Europe and Asia must remain out of our discussion.In ?ow of joint ventures into several other Asian countries in the post-WWII decades under one or another mutual pact also do not belong to our discussion.
Joint ventures between corporate units from mature industrialized rich economies and corporations in newly industrializing economies will have to overcome pragmatic
M.Dutta /Journal of Asian Economics 15(2005)1169–1202
1180Fig.3.(a)GDP and (b)GDP annual growth.
M.Dutta/Journal of Asian Economics15(2005)1169–12021181 Table6
Employment growth pro?le
Year Labor force
(total,in
millions)Female labor
force(total,
in millions)a
Labor force
(%of population)a
Female labor
force(%of
total labor)
Females willing
and able to work
(%of female population)a
196035114252.6140.5043.92 196134714152.5140.6243.96 196234914252.4040.7443.99 196335714652.3040.8644.02 196436414952.1940.9844.05 196537315352.0941.1044.09 196638215851.9841.2244.13 196739116251.8841.3444.17 196840116651.7741.4644.21 196941117151.6741.5844.25 197042217651.5641.7044.28 197143618351.8941.8544.74 197245018952.2342.0045.20 197346419552.5642.1545.66 197447620152.9042.3046.13 197548820753.2342.4546.59 197649821253.5642.6047.05 197750921753.9042.7547.52 197851922254.2342.9047.99 197952922854.5743.0548.46 198053923354.9043.2048.93 198155023855.3343.3749.50 198256224555.7643.5450.08 198357525156.2043.7150.67 198458725856.6343.8851.25 198560026457.0644.0551.84 198661327157.4944.2252.45 198762827957.9244.3953.06 198864328658.3644.5653.68 198965829458.7944.7354.30 199067230259.2244.9054.92 199168330759.3344.9455.05 199269231159.4344.9855.18 199370231659.5445.0255.31 199471132059.6445.0655.44 199572032559.7545.1055.58 199672832859.7945.1255.62 199773633259.8345.1455.66 199874433659.8745.1655.70 199975133959.9145.1855.74 200075734259.9545.2055.99 200176334560.0145.1955.34 200276934860.0845.1856.06 Source:World Development Indicators,The World Bank.
a Calculated from World Development Indicators.
M.Dutta/Journal of Asian Economics15(2005)1169–1202 1182
Table7
GDP and foreign direct investment in?ows
Year GDP(constant1995
US$,in billions)Foreign direct investment,net
(BOP,constant1995$,in millions)a
Foreign direct investment,
net in?ows(%of GDP)
198********.14 198********.21 198********.28 19842401,1780.49 19852721,4820.54 19862961,8780.63 19873312,8520.86 19883683,826 1.04 19893833,7970.99 19903983,9100.98 19914345,034 1.16 199249613,229 2.67 199356335,865 6.37 199463439,467 6.23 199570035,849 5.12 199676837,769 4.92 199783541,125 4.92 199890041,619 4.62 199996437,687 3.91 20001,04136,995 3.55 20011,11942,119 3.76 20021,20947,080 3.89 Source:World Development Indicators,The World Bank.
a Calculated.Total FDI for period(BOP,constant1995$,in millions):433,980.
Fig.4.Impact of FDI.
considerations.What will be the basis of partnership?If the foreign investors will be allowed to own more than 50%of the investment,the domestic business leaders who built up the industry to begin with will be reduced to a position of junior partnership.If the foreign investors will be invited to own less than 50%,they will remain condemned to junior partnership forever.A 50–50partnership may be a novel paradigm of non-action.Let me restate the six points I have argued in support of foreign direct investment (see Dutta,1991,1999,2000;Dutta and Merva,1990):
(1)With commitment to pro ?t maximization,FDI will bring with it optimum technology
and management style.They will have to compete with foreign investors in China from other investing countries.Since the ownership is 100%,technology and management style will remain 100%under the investing corporate leadership.
(2)To begin with foreign investments from mature industrialized countries where
employment rate is high,wage rate is consequently high,foreign investors will depend on local labor;ordinary labor will ?nd jobs and earn relatively higher incomes.Foreign investors could not bring all skilled workers:engineers,accountants,economists,research scientists,managers from their respective home countries.Costs would be too high.They will search for talent in China and create jobs for them at competitively high salaries.
M.Dutta /Journal of Asian Economics 15(2005)1169–1202
1183
Table 8
Impact of FDI Year
FDI,net in ?ows (%of GDP)GDP growth (annual %)Employment growth
(annual %)a Gross capital formation (%of GDP)Gross domestic savings (%of GDP)19810.14 5.20 3.2632.5132.8619820.219.10 2.9133.2434.8019830.2810.90 3.2133.7934.5419840.4915.20 2.5134.4234.3819850.5413.50 2.2437.7733.6419860.638.80 2.0637.7034.8219870.8611.60 2.3836.1336.101988 1.0411.30 2.4036.8135.7519890.99 4.10 1.6736.0535.2719900.98 3.80 2.3334.7437.951991 1.169.20 1.7734.7738.111992 2.6714.20 1.4036.1737.721993 6.3713.50 1.0343.3041.781994 6.2312.60 1.1041.1943.061995 5.1210.50 1.1740.8343.131996 4.929.60 1.0239.5841.731997 4.928.80 1.1038.2242.981998 4.627.800.9337.7142.341999 3.917.10 1.0237.4140.502000 3.558.000.78
36.3339.002001 3.767.5038.4940.882002
3.89
8.00
40.42
43.37
Source :World Development Indicators,The World Bank.a
Calculated.
(3)Foreign investors will have an interest to repatriate pro ?ts home,at least a part of it.To
do so,they will export some of their products manufactured in China to the world market to earn export revenue in convertible foreign currencies.In the process,the manufactured products in China will be introduced to the world market and win consumer acceptance globally.The net result is China ’s emergence as a member of the world economy.
(4)As China ’s exports grow,her foreign exchange reserve grows and contributes to her
international credit rating.China ’s ability to offer credit instruments in the international market warrants recognition.By the end of 2003,China ’s foreign exchange reserves have reached the benchmark of US$434billion.
(5)In the process,the volume of world trade has expanded enabling China to make a
contribution to global economic welfare.China ’s economic gain is essentially a component of the world economic gain.
(6)Competition from foreign investors will contribute to the upgrading of ef ?ciency of
China ’s state enterprises by way of inducing them to produce cost and quality competitive products for the Chinese consumers.If they fail to do so,they will be required to accept the market decision and accept insolvency and/or liquidation.Protection of state enterprises from market competition became responsible for the poor performance of the Chinese https://www.doczj.com/doc/b718766048.html,petition from the foreign investors will correct the situation and contribute to the overall ef ?ciency of the Chinese
M.Dutta /Journal of Asian Economics 15(2005)1169–1202
1184Table 9
Capital formation and FDI Year Savings —capital formation (in millions)Gross foreign direct investment (in millions)Difference (in millions)1982727.03440.461,167.491983131.44667.70799.151984à2,888.151,303.98à1,584.171985à18,083.482,043.29à16,040.181986à14,321.142,329.30à11,991.831987à5,043.293,647.54à1,395.751988à7,429.264,844.78à2,584.481989à5,544.584,670.25à874.34199010,542.654,840.3215,382.97199113,629.606,086.3919,715.98199215,564.8217,971.9233,536.75199321,021.3241,600.7962,622.11199425,357.1541,802.8767,160.02199516,092.0537,849.2053,941.25199611,642.2239,756.5751,398.78199734,708.4745,742.0980,450.56199836,272.8747,725.6783,998.54199924,032.8843,811.0167,843.89200021,771.2744,999.1866,770.45200119,849.1754,026.4373,875.602002
27,882.90
56,675.98
84,558.88
Source :World Development Indicators,The World Bank.All data calculated,S àI ,FDI in ?ows ?GDP,(S àI )+FDI.
M.Dutta/Journal of Asian Economics15(2005)1169–12021185 Table10
Gross domestic savings and gross capital formation
Year Gross capital
formation
(constant1995
US$,in billions)Gross capital
formation
(%of GDP)
Gross capital
formation
(annual%
growth)
Gross domestic
savings(%of
GDP)
*Gross domestic
savings(constant
1995US$,in
billions)
196024.4535.54
19619.6818.11à60.40
1962 5.0810.51à47.53
19638.6716.4870.61
196412.5820.1045.21
196518.0723.1743.59
196622.6227.1325.20
196717.2219.44à23.90
196818.2819.13 6.20
196920.7919.8413.70
197031.8929.0253.4028.9625.92 197134.8229.559.2029.3728.13 197233.3327.40à4.3027.2227.06 197338.1229.4414.4029.9132.08 197439.3429.01 3.2028.7631.56 197544.1030.1712.1030.1936.01 197641.0627.93à6.9028.2333.13 197744.9628.499.5028.8436.42 197856.2538.0225.1037.7053.17 197958.1636.51 3.4035.8254.37 198061.3635.19 5.5034.9357.16 198159.4032.51à3.2032.8656.56 198264.6233.248.8034.8065.35 198371.8033.7911.1034.5471.93 198485.3734.4218.9034.3882.48 1985109.6937.7728.5033.6491.61 1986117.4837.707.1034.82103.16 1987124.4136.13 5.9036.10119.37 1988138.9736.8111.7035.75131.54 1989140.6436.05 1.2035.27135.09 1990140.3634.74à0.2037.95150.90 1991151.8734.778.2038.11165.50 1992171.4636.1712.9037.72187.02 1993214.1543.3024.9041.78235.17 1994247.5641.1915.6043.06272.91 1995285.9340.8315.5043.13302.02 1996308.6239.587.9441.73320.26 1997324.2338.22 5.0642.98358.94 1998344.9137.71 6.3842.34381.18 1999366.4337.41 6.2440.50390.47 2000384.2736.33 4.8739.00406.05 2001437.7638.4913.9240.88457.61 2002496.4240.4213.4043.37524.30 Source:World Development Indicators,The World Bank.
*Calculated.
M.Dutta/Journal of Asian Economics15(2005)1169–1202
1186
economy in general(see Wen-Hui Wei,2004),for a survey of of?cial studies by various Ministries of the Chinese Government in support of the above six points.) (Note:The policy of marketization of state enterprises has been in progress.)
2.1.Sources of FDI:a digression
A review is in order.In?ows of FDI into China have come from mature industrialized countries:USA,Canada(North America),Japan,Korea,and European Union(EU), supplemented by in?ows from Taiwan,Hong Kong,Free Trade Ports(Virgin Islands, Cayman Islands,and Samoan Islands),and Association of South East Asian Nations (ASEAN)(Fig.5and Tables11and12).
In2002,28.8%of FDI into China came from North America,Japan,Korea and EU. Taiwan had a share of7.4%.Be it noted that Taiwan became a high-income industrialized economy with a history of its own.Principals of pre-communist market economy of main land China migrated to Taiwan with their entrepreneurial leadership,and global market access plus capital funds.They offered an integrated strategy for economic development and industrialization with the rest of the world,especially with the USA.Successful management of the macroeconomic policy enabled Taiwan to escape from the Asian ?nancial crisis of1997–1998.Taiwan became a savings surplus country and investment opportunities in China were not missed.Independent of hostile political relationship between Taiwan and China,the economic relationship between the two economies has been so very productive.It has been pointed out that Taiwan’s investment in China have been pro?t oriented,given the shared ethnicity,language,culture,religion,and understanding of the Chinese business procedures which is often too complex for other foreign investors(see Dutta,1999).China does not consider FDI from Taiwan as foreign investment while Taiwan enjoys the freedom to make its investments in special zones designated for foreign direct investments and bene?t from consequent foreign investment privileges effective in these special zones.It is to the economic gain of all the peoples on both sides of the Channel.(Note:China is demanding investors from Taiwan to employ more local labor at all levels.However,given the level of industrialization of Taiwan,
which approximates the level of mature industrialized economies,Taiwan’s wage level is
Fig.5.Source-country composition of FDI stock by the end of2002.Source:Ministry of Commerce of PR China. China Statistical Yearbook,various issues.Note:Free Trade Ports include:Virgin Islands,Cayman Islands and Samoan.North America includes USA and Canada.Adapted from the Doctoral Dissertation by Wen-Hui Wei (2004).
M.Dutta /Journal of Asian Economics 15(2005)1169–1202
1187
Table 11
Realized FDI in ?ow into China by selected countries/regions (1986–2003)
Hong Kong Taiwan Korea Free Trade Ports USA Japan EU ASEAN Amount
%Amount
%
Amount
%
Amount
%
Amount %Amount %Amount %Amount %1986 1.3359.30.3314.70.2611.60.15 6.70.020.91987 1.5968.70.2611.20.229.50.05 2.20.04 1.71988 2.0764.80.247.50.5116.00.18 5.60.04 1.31989 2.0460.10.15 4.40.288.30.3610.60.18 5.30.10 2.91990 2.0257.90.22 6.30.4613.20.5014.30.17 4.90.06 1.71991 2.5859.20.4710.8<0.01<0.10.327.30.5312.20.26 6.00.09 2.119927.7170.0 1.059.50.12 1.1<0.01<0.10.51 4.60.71 6.50.25 2.30.27 2.5199317.4463.4 3.1411.40.38 1.40.01<0.1 2.067.5 1.32 4.80.65 2.4 1.01 3.7199419.8258.7 3.3910.00.73 2.20.130.4 2.497.4 2.08 6.2 1.51 4.5 1.87 5.5199520.1953.8 3.168.4 1.05 2.80.38 1.0 3.088.2 3.118.3 2.14 5.7 2.627.0199620.8550.0 3.478.3 1.50 3.60.66 1.6 3.448.2 3.688.8 2.74 6.6 3.187.6199721.5547.6 3.297.3 2.23 4.9 2.06 4.5 3.247.2 4.339.6 4.199.3 3.427.6199818.5140.6 2.92 6.4 1.80 4.0 4.489.8 3.908.6 3.407.5 3.988.7 4.219.2199916.3640.5 2.60 6.4 1.27 3.2 3.248.0 4.2210.4 2.977.4 4.4811.1 3.298.1200015.5038.1 2.30 5.6 1.49 3.7 4.7411.6 4.3810.8 2.927.2 4.4811.0 2.847.0200116.7235.7 2.98 6.4 2.15 4.6 6.6514.2 4.439.5 4.359.3 4.188.9 2.98 6.4200217.8633.9 3.987.5 2.72 5.28.1815.5 5.4210.3 4.197.9 3.717.0 3.20 6.12003
17.70
33.1
3.777.0
4.498.4
7.6314.3
4.20
7.8
5.05
9.4
3.93
7.3
n.a.
n.a.
Unit:US$billion.Source :Ministry of Commerce of the PR China,China Statistical Yearbook,various issues.Free Trade Ports includes:Cayman Islands,Virgin Islands and Samoan.FDI reported prior to 1988include other foreign investment.
very high and the Taiwanese investors in China cannot afford to bring workers from home for employment in China.)
It is to be noted that in 2002,as much as 53.6%of FDI came from Hong Kong/Macao and Free Trade Ports.ASEAN share in the year was 6.5%.It has been suggested by some that 60.1%of FDI into China came from the Chinese diaspora .Is this an overstatement?Hong Kong and Macao and Singapore in ASEAN have historically been outposts of world ?nancial centers under the British imperial regime.One points out to the fact the ownership of the Hong Kong Shanghai Banking Corporation (HSBC)belongs neither to Hong Kong nor to Shanghai.There is no easy way to obtain data for the speci ?c ownership of FDI ?ows from these sources into China or for that matter into any other country.National ownership of the FDI ?ows into China from Free Trade Ports ,which offer tax shelters to all foreign nationals,remains to be carefully analyzed.Exclusivity of national ownership of all FDI in ?ows into China from all these sources can at best be rationalized by the fact that their destination is China .China is a very FDI friendly economy with competitively high pro ?t earnings and provisions for repatriation of pro ?ts home a la exports of at least a part of products manufactured in China to the world market and earning of export revenues in convertible currencies.More research remains to be done.China is an attraction for foreign direct investments (Hsiao &Hsiao,2004).
I beg your indulgence to suggest that what is important for an economy in its plan for accelerated rate of industrialization and economic growth is to be perceived by the rest of the world as a foreign investment friendly country,especially FDI —friendly,without making a case for in ?ows of investments from the speci ?c country ’s diaspora .Do we know of another economy with a Hong Kong –Macao –Taiwan trio to help facilitate FDI in ?ows?In ?ow of FDI from mature industrialized economies will have substantial impact for the 6-point scores we have stated earlier.In 2002,China received a little more that 50%of FDI in ?ows from such countries.2.2.Challenges ahead
Let us review the three arguments we have stated to begin with:
(1)No economy can continue to grow at an average annual rate of 10%inde ?nitely.
Bottlenecks in terms of shortages of labor,speci ?c skill of the labor,physical capital,and technology emerge in the process and crisis management will be in order.We do
M.Dutta /Journal of Asian Economics 15(2005)1169–1202
1188Table 12
Share of FDI stock in China by the end of 2002Hong Kong and Macao (%)46.8Taiwan (%)7.4Japan (%)8.1ASEAN (%) 6.5Korea (%) 3.4EU (%)
7.6North America (%)9.7Free Trade Ports (%)
6.8Other countries/regions (%)
3.7
篇一:高中语文说课模板通稿 各位评委老师:大家好,我是几号考生,我今天说课的题目是《》。下面,我将会从说教材、说教法、说学法、说教学过程等部分来进行我的说课。 一、说教材 教材简析:本篇课文是人教版高中语文课本必修几第几册第几单元第几课的课文,是一篇什么体裁的文章。文章主要叙述的容是什么,表现了作者什么样的思想感情。本篇课文具有什么样的地位,和什么特色。学习教材的目的是为了让学生能够触类旁通,举一反三,能将知识由课向课外延伸。通过对本篇课文学习,能够更好的培养学生的鉴赏能力和归纳总结能力。 教学目标: (一)诗歌:根据教学大纲的要求,诗歌教学要以诵读为主,在诵读中使学生领悟诗的思想感情,鉴赏文学作品能够感受形象,品味语言。同时,本篇诗歌通过典型意象创造出优美的意境,巧妙的将诗人的情感融入其中。确立教学目标如下: 我的知识目标是:品味诗的意象美,领悟诗的意境,体会诗人的真情。 能力目标是:培养学生鉴赏诗歌的能力。 德育目标是:体悟作者情怀,引发共鸣,逐渐养成良好的审美情趣,培养审美能力。 本节课的教学重点是:领反复诵读,鉴赏诗歌意象,体会诗歌的意境美,体悟诗情,获得情感体验。教学难点是:把握诗歌的思想感情,以及意象的体味与把握。 (二)文言文:根据教学大纲的要求,文言文教学要求培养学生阅读浅显文言文的能力,把握文章的思想容,积累语言知识。同时本课情节、结构、语言等的特点,确立教学目标如下: 知识与能力目标:了解作者的基本常识;理解文中所出现的生僻词以及意义特殊的词语;把握文中的主要思想感情,初步鉴赏文中的形象与个性。 过程与方法:通过诵读质疑、自主探究、合作解决,培养学生借助注释和工具书阅读浅显文言文,理解重点词句的含义以及初步的研究分析能力并积累文言文实词、虚词和句式,培养学生的自学能力和翻译能力。情感态度与价值观目标:理解作者在作品中所流露出的情感,培养正确的审美观/价值观/人生观。 我确定以上的三个目标是体现新课标所提倡的“知识与能力、过程与方法、情感与态度”并重的教学理念。教学重点:诵读课文,在把握文意的基础上理解词句,积累一些文言实词、虚词和句式。 教学难点:掌握文章的写作风格和特点;深入分析文章涵,并作出评价,激发学生的学习兴趣。 (三)现代文:新课标强调了要全面提升高中学生的语文素养,初步形成正确的人生观、世界观、价值观,并学会收集判断、处理信息,具有人文素养、创新精神与实践能力。同时本篇课文,感情真挚,感悟深刻,具有典型的人文性,结合本单元的教学目标以及本篇课文在语言,结构设置等方面的特点,确立本课的教学目标如下: 知识能力目标:领悟本文的写作手法,揣摩语言,体会语言的感情和特色,学习作者运用语言的技巧。同时学习本文对比喻、拟人等修辞手法的运用。 过程与方法目标:在教师恰当的提升引导下,培养学生“自主、合作、探究”的学习方式,并掌握一定的赏析语言的能力与方法。 情感与态度目标:理解作者在作品中所流露出的情感,培养正确的审美观/价值观/人生观。 我确定以上的三个目标是体现新课标所提倡的“知识与能力、过程与方法、情感与态度”并重的教学理念。我的教学重点是:理清本篇文章的思路,领会课文的思想感情。教学难点
中国各城市的古称谓及得名由来 华北和东北: 天津——意为“天子的津渡”,明代永乐帝朱棣在这里率领大军渡过海河南下推翻建文帝 邯郸——城市名押an韵,邯郸意为“邯山至此而尽”,郸同单,“单”意思是山脉的尽头,邯郸是中国沿用最古老的地名之一 秦皇岛——秦始皇求仙入海之岛,秦皇岛是中国唯一用古代帝王称号来命名的城市 太原——取“广大的平原”之意 大同——取自“天下大同之地”,“大同”是古代政治上的最高理想 长治——长治古称上党,明代在此地设置长治县,取“长治久安”之意 赤峰——得名于城东北的褐色孤峰 包头——包头由蒙古语“包克图”演化而来,意思是“有鹿的地方”,包头由此别称为鹿城乌海——乌达与海勃湾的合称 大连——大连旧称青泥洼,青泥洼大部分都是山东移民,在山东有一种很流行的事物叫做褡裢,大连就是由褡裢演变而来,另一说大连来自俄语“达里尼” 阜新——取“物阜民丰,焕然一新”之意 盘锦——盘山和锦州各取一字而成,也取“盘根错节,锦上添花”之意 本溪——本溪得名于境内的本溪湖,本溪湖古称杯犀湖,杯犀湖因“湖底上阔下窄,状如犀牛之角”而得名,清代雍正年间因杯犀湖名称过雅又难写难辨,故取其谐音改称为本溪湖 长春——意为“长年春色的城市”,东北的春天是非常寒冷的,以长春命名城市说明了该城的气候特点是寒冷占据主导
吉林——吉林全称吉林乌拉,满语意思是“沿江的城市”,吉林市是中国唯一省市同名的城市 佳木斯——佳木斯清代又称“嘉木寺”,在满语是“驿丞”的意思,因为佳木斯在古代地处松花江通往黑龙江江口的驿道 华东: 烟台——意为“狼烟升起的炮台” 青岛——因岛上“山岩耸秀,林木蓊郁”而得名,且与“琴岛”谐音 威海——明代在此地设威海卫,取“威震东海”之意 日照——取“日出初光先照”之意 淄博——淄川与博山的合称 莱芜——莱是植物名,俗称灰菜,芜指田野荒芜,古时这里是一片荒凉的地方,故名莱芜菏泽——城市名押e韵,菏山与雷泽的合称,菏泽也是中国沿用最古老的地名之一 合肥——因东淝河与南淝河在此汇合而得名 蚌埠——意为“盛产蚌珠的港埠”,蚌埠由此别称为珠城 宿迁——春秋时为钟吾子国,后宿国迁都于此,宿迁由此得名 连云港——意为“在连岛与云台山之间的港湾”,云台山是江苏省的最高峰 镇江——唐代为镇海军节度使的驻地,到了宋代因地理环境的变化,此地距大海较远,故而更名为镇江,取“镇守长江”之意 无锡——先秦锡山产锡,至汉朝锡尽,故名无锡 上海——得名于松江(即苏州河)的一条支流上海浦,上海意为“通向大海的地方” 金华——意为“金星与婺女争华之地” 宁波——宁波古称明州,宁波得名于“海定则波宁”
古今名人名字的由来含义 姓名是中华文化的脉承之一,它是人们以血脉传承为根基的社会人文标识。历史上名字起得好的名人,人也惊艳,名也惊艳。下面让我们一起品味中国的名字艺术。 1、子,神国公嘉的后代,公嘉字文。我国古人有的以祖先的“字”为姓,如公子牙字叔,他的子就叫叔得臣。子也是近这种式为姓的。故姓。 为什么人们叫子为“老二”呢?原来,子的父亲叔梁纥,是国的一个将军,他原有九个女儿和一个儿子。这仅有的一个儿子是个瘸子。在当时男尊女卑的情况下,叔梁纥当然很不满意。于是,他就和妻子一起到曲阜东南的尼丘山求天神另赐一子。后来,果然又生下了子,叙梁纥以为这是在尼丘山上求来的,就给他取名为丘,字仲尼。“仲”字是排行,表示“第二”的意思,因为子是叔梁纥的第二个儿子,所以人们又叫子为“老二”。 2、白,相传白到七岁时还没有正式的名字。原因是他在“抓”时,抓了《诗经》这本书,这不但喜坏了他父亲,而且也难坏了他父亲。他想:如果儿子长大成了诗人,若没有一个叫得响的好名字岂不遗憾?于是,越往诗人的名声面想,越发对儿子取名之事慎之又慎了,故此一拖多年没有定名。这年春天,白一家在家院中游玩,他父亲想作一首春日的七绝诗,有意考考儿子的本事。他咏了两句:“春风送暖百花开,迎春绽金它先来”后就说:“后面的诗句我想不出来了,由你们母子二人续上吧。”白的母亲想了一会道:“火烧杏林红霞
落”,她的话音刚落,白就用手指树,脱白说道:“花怒放一树白。”他父亲听后,连声叫好,忽然心里一动:这句诗的头一个字不正是自家的姓吗?这最后一个“白”字不正说出了花圣洁高雅吗?于是,他当即决定儿子的名字就叫白。 3、,1896年9月,日本青年宫崎滔天、平山,经过多曲折,在日本横滨中国革命志士少白的寓所,见到了文。文谈及革命时,其慷慨激昂之情,犹如深山虎啸。他俩被文的革命热情、见识和抱负深深感动,决心帮助文,并为他的生命安全担忧,劝他暂时留驻日本。 文同意后,宫崎和平山就陪同文找旅馆。他们绕过日比谷公园,路过候爵府邸,来到“对鹤馆”旅馆,并由平山替文代笔登记。当时,文处于流亡之中,不便公开姓名身份。填写什么好呢?平山执笔踌躇一番,忽然想起刚才走过候爵府时看见的那块牌匾,于是就在旅馆簿上写下了“”两字。但按日本习俗,只是个姓,还得有一个适当的名字才好,平山又踌躇起来了。正在这时,文接过登记簿,在“”两字下面添上了一个“樵”字,笑着对平山说:“我是中国的山樵。”这就是名字的由来。 4、迅,著名史学家候外庐同志在一篇文章中,对迅之所以取名迅,作了如下解释:一般人把迅字解释为“快迅”,是不确切的。迅字《尔雅?释兽》云:“牝狼,其子激,绝有力,迅。”注云:“狼子绝有力者,曰迅。”“缴”即激,从犬言兽性,从水言水性。都是激烈的意思。迅的,取自迅的母亲的姓。迅,古义的狼子。迅的字义可理解为牝狼一个有勇力的儿子。迅为什么要以狼子自居?他曾说过自己甘做封建制
记忆各省简称 京津沪渝直辖市蒙宁新藏桂自治 一国两制台港澳东北三省黑吉辽 冀鲁晋归华北苏浙皖赣在华东 湘鄂豫归华中华南还有粤闽琼 川滇黔归西南西北还有陕甘青 记忆我国的行政区域省份名称 两湖两广两河山五江云贵福吉安 四西二宁青甘陕海内台北上重天 香港澳门和台湾爱我祖国好河山 第1句:湖南,湖北,广东,广西,河南,河北,山东,山西 第2句:新疆,黑龙江,江西,浙江,江苏,云南,贵州,福建,吉林,安徽第3句:四川,西藏,宁夏,辽宁,青海,甘肃,陕西 第4句:海南,内蒙古,台湾,北京,上海,重庆,天津
23个省份
中国各省简称的由来 一、四个直辖市 1、北京(京)北京有据可查的第一个名称为“蓟”,是春秋战国时燕国的都城。辽金是将北京作为陪都,称为燕京。金灭辽后,迁都于此,称中都。元代改称大都。明成祖朱棣从南京迁都于此,改称“北京”。名称一直沿用至今。1949年设为直辖市。取全称中的“京”字作为简称。 2、天津(津)唐宋以前,天津称为直沽。金代形成集市称“直沽寨”。元代设津海镇,这是天津建城的开始。明永乐2年(1404年)筑城设卫,始称天津卫,取“天子经过的渡口”之意。1949年设为直辖市。取全称中的“津”字作为简称。 3、上海(沪)上海之称始于宋代,当时上海已成为我国的一个新兴贸易港口,那时的上海地区有十八大浦,其中一条叫上海浦,它的西岸设有上海镇。1292年,上海改镇为县。这是上海这一名称的由来。1949年,上海设为直辖市。古时,上海地区的渔民发明了一种竹编的捕鱼工具“扈”,当时还没有上海这一地名,因此,这一带被称为“沪渎”,故上海简称“沪”。春秋战国时上海是楚春申君黄歇封邑的一部分,故上海别称“申”。 4、重庆(渝)重庆古称“巴”。秦时称江州。隋称渝州。北宋称恭州。重庆之名始于1190年,因南宋光宗赵敦先封恭王,后登帝位,遂将恭州升为
目录 1、《荷塘月色》说课稿 (3) 2、《故都的秋》说课稿1 (6) 2、《故都的秋》说课稿2 (8) 3、《囚绿记》说课稿 (11) 4、诗经两首《氓》说课稿 (12) 5、《离骚》说课稿 (15) 6、孔雀东南飞说课稿 (17) 7《涉江采芙蓉》说课稿一. (18) 7、短歌行说课稿 (19) 8、归园田居其一说课稿 (20) 9、兰亭集序》说课 (23) 10、赤壁赋说课稿 (24) 11、《游褒禅山记》说课稿(2则) (26) 12、就任北京大学校长之演说 (30) 13、我有一个梦想说课稿 (35) 14、《在马克思墓前的讲话》说课稿 (38) 15、林黛玉进贾府说课稿 (39) 16、《祝福》说课稿 (43) 17、《老人与海》说课稿 (45) 18蜀道难说课稿 (46) 19、《秋兴八首》(其一)教案 (48) 20、杜甫诗三首》说课稿 (49) 21、琵琶行说课稿 (51) 22、李商隐诗2首 (53) 23、《寡人之于国也》说课稿 (55) 24、《劝学》说课稿 (58) 24《劝学》创新课说课稿 (59) 25、过秦论说课稿 (61) 26、师说》说课稿 (63) 27、动物游戏之谜 (65) 27-1动物游戏之谜 (67) 28、《宇宙的边疆》 (69) 13-1、宇宙的边疆 (70) 29、一名物理学家的教育历程》说课稿 (71) 30、《窦娥冤》说课稿 (75) 30-1、《窦娥冤》说课稿 (76) 30-2《窦娥冤》说课稿 (77) 31、《雷雨》说课稿 (79) 32、《哈姆雷特》说课稿 (81) 33、《望海潮》说课稿 (82) 34、《雨霖铃》说课稿 (83) 35、《苏轼词两首》说课稿 (84) 36、《念奴娇赤壁怀古》说课稿 (86) 37、《水龙吟》教案 (89)
中国各省名称的由来 我国幅员辽阔,人口众多,具有悠久的历史文化。各个省(直辖市)名称和别称的由来源远流长,各具特色,读来使人对祖国的秀丽山川倍感亲切。 一、四个直辖市 1、北京(京) 北京有据可查的第一个名称为“蓟”,是春秋战国时燕国的都城。辽金是将北京作为陪都,称为燕京。金灭辽后,迁都于此,称中都。元代改称大都。明成祖朱棣登基后,从南京迁都于此,改称当时的“北平”为“北京”,意与南京相对之意,名称一直沿用至今。 取全称中的“京”字作为简称。 2、天津(津) 唐宋以前,天津称为直沽。金代形成集市称“直沽寨”。元代设津海镇,这是天津建城的开始。明永乐2年(1404年)筑城设卫,始称天津卫,取“天子经过的渡口”之意。1949年设为直辖市。 取全称中的“津”字作为简称。 3、上海(沪)
上海之称始于宋代,当时上海已成为我国的一个新兴贸易港口,那时的上海地区有十八大浦,其中一条叫上海浦,它的西岸设有上海镇。1292年,上海改镇为县。这是上海这一名称的由来。1949年,上海设为直辖市。 古时,上海地区的渔民发明了一种竹编的捕鱼工具“扈”,当时还没有上海这一地名,因此,这一带被称为“沪渎”,故上海简称“沪”。春秋战国时上海是楚春申君黄歇封邑的一部分,故上海别称“申”。 4、重庆(渝) 重庆古称“巴”。秦时称江州。隋称渝州。北宋称恭州。重庆之名始于1190年,因南宋光宗赵敦先封恭王,后登帝位,遂将恭州升为重庆府,取“双重喜庆”之意。1997年,重庆设为直辖市。 隋时,嘉陵江称渝水,重庆因位于嘉陵江畔而置渝州,故重庆简称“渝”。 二、五个自治区 1、内蒙古自治区(内蒙古) 蒙古原为部落名,始见于唐代记载。1206年,成吉思汗统一蒙古各部,建立蒙古国。元灭后,蒙古族退居塞北。明清形成内、外蒙古之称。晚清以后,泛指大漠以南、长城以北、东起哲里木盟、西至套西厄鲁特所以盟旗为内蒙古。 取全称中“内蒙古”三字作为简称。 2、维吾尔自治区(新) 辖区古称西域。西汉设西域都护府。东汉魏晋改都护为长史。唐代设伊、西、庭三州和安西、北庭两个都护府。17世纪中叶以后,清朝平定了准噶尔部叛乱,在天山南北设伊犁将军。清光绪10年(1884年),改为新疆省,意为“故土新归”。1955年,设新疆维吾尔自治区。 取全称中的“新”字作为简称。 3、西藏自治区(藏)
一、四个直辖市 1、北京(京) 北京有据可查的第一个名称为“蓟”,是春秋战国时燕国的都城。辽金是将北京作为陪都,称为燕京。金灭辽后,迁都于此,称中都。元代改称大都。明成祖朱棣从南京迁都于此,改称“北京”。名称一直沿用至今。1949年设为直辖市。 取全称中的“京”字作为简称。 2、天津(津) 唐宋以前,天津称为直沽。金代形成集市称“直沽寨”。元代设津海镇,这是天津建城的开始。明永乐2年(1404年)筑城设卫,始称天津卫,取“天子经过的渡口”之意。1949年设为直辖市。 取全称中的“津”字作为简称。 3、上海(沪) 上海之称始于宋代,当时上海已成为我国的一个新兴贸易港口,那时的上海地区有十八大浦,其中一条叫上海浦,它的西岸设有上海镇。1292年,上海改镇为县。这是上海这一名称的由来。1949年,上海设为直辖市。 古时,上海地区的渔民发明了一种竹编的捕鱼工具“扈”,当时还没有上海这一地名,因此,这一带被称为“沪渎”,故上海简称“沪”。春秋战国时上海是楚春申君黄歇封邑的一部分,故上海别称“申”。 4、重庆(渝) 重庆古称“巴”。秦时称江州。隋称渝州。北宋称恭州。重庆之名始于1190年,因南宋光宗赵敦先封恭王,后登帝位,遂将恭州升为重庆府,取“双重喜庆”之意。1997年,重庆设为直辖市。 隋时,嘉陵江称渝水,重庆因位于嘉陵江畔而置渝州,故重庆简称“渝”。 二、五个自治区
1、内蒙古自治区(内蒙古) 蒙古原为部落名,始见于唐代记载。1206年,成吉思汗统一蒙古各部,建立蒙古国。元灭后,蒙古族退居塞北。明清形成内、外蒙古之称。晚清以后,泛指大漠以南、长城以北、东起哲里木盟、西至套西厄鲁特所以盟旗为内蒙古。 取全称中“内蒙古”三字作为简称。 2、维吾尔自治区(新) 辖区古称西域。西汉设西域都护府。东汉魏晋改都护为长史。唐代设伊、西、庭三州和安西、北庭两个都护府。17世纪中叶以后,清朝平定了准噶尔部叛乱,在天山南北设伊犁将军。清光绪10年(1884年),改为新疆省,意为“故土新归”。1955年,设新疆维吾尔自治区。 取全称中的“新”字作为简称。 3、西藏自治区(藏) 元时称西藏地区为“乌思藏”。“乌思”是藏语“中央”的意思,“藏”是“圣洁”的意思。明代设立两个都指挥使司。清代称西藏东部为“康”(喀木),中部为“卫”,西部日喀则一带为“藏”(包括阿里),因其在中国西部,故称西藏。1965年设立西藏自治区。 取全称中的“藏”字作为简称。另一说认为简称源于故称“乌思藏”。 4、宁夏回族自治区(宁) 公元5世纪处,匈奴贵族赫连勃勃自以为是夏后氏后裔,故将建立的割据政权定国号为“夏”。宋代,党项族拓拔氏首领李元昊称帝,定都兴庆府(今银川),立国号“夏”,创立文字,建西夏王朝。13世纪,元灭西夏,取“平定西夏永远安宁”之意,在这里设宁夏行省,始有宁夏之名。1958年设宁夏回族自治区。 取全称中的“宁”字作为简称。 5、广西壮族自治区(桂) 宋设广南西路,简称广西路,“广西”一名产生。元设广西两江道。明设广西省。1958年设广西僮族自治区,1965年改为广西壮族自治区。
《永远的校园》 教学目的: 1.了解北大,走近北大,感受北大,思考北大 2. 借助演讲、辩论等形式培养学生思辨说理的能力 3.对比谢冕心中的北大与现实中北大的差异,并揣摩这种差异的根源,从而树立正确的大学观、人生观 教学难点: 如何看待理想中北大与现实中北大的差异 教法与学法: 1.课型:讲读课、公开课、研讨课、活动课 2.教法:质疑、讨论、辩论 3.教具及能力培养方向:多媒体课件(包括图片、音频、视频及文字材料);培养学生思辨能力 课时安排:2课时(第一课时主要诵读文章,感知大意;第二课时主要展开拓展、延伸的活动) 教学过程: 一、新课导入 2003年2月25日,在首都北京发生了二起震惊中外的爆炸案,先后发生在清华大学的荷园餐厅和北京大学的农园餐厅,虽然比不上恐怖份子驾机撞毁世贸大楼那样引人注目,但在很少发生恐怖流血冲突的中国大陆来说,这的确也算得上是惊天动地的事情了,最引人深
思的是:恐怖份子为什么要选择清华和北大进行作案呢?案情侦破之后,答案浮出水面,而这个答案竟让人哭笑不得,因为犯罪谷子声称:“制造爆炸案的目的是为了出名。” 对于这起事件,我不想多作分析了,我只是想说:为什么炸清华、北大就能出名呢?那是因为这两所大学太有名了,本身就是名望的象征。我们这就容易理解了:为什么从古至今那些杀人的罪犯很少留下姓名,而刺客荆轲的故事却被广为传诵,不仅仅是因为荆轲的大义凛然、高风亮节,还因为他刺杀的对象是权倾天下、赫赫有名的秦王。 的确,清华、北大太有名气了,不仅是每一位莘莘学子梦寐以求的地方,就连没有丁点儿文化常识的人可能也会对他们肃然起敬。江泽民同志作为一国主席,日理万机,我不知道他曾去过哪些大学,但我知道北大他是去过的,就在北大建校一百周年的校庆典礼上,还作了热情扬溢的讲话,因此,才有了我们课本上这篇文章。 大凡有名望的人、事、物都难得一见:比如卢浮宫珍藏的那些传世珍品;比如我们的局长、县长、市长或者更高的官员。于是我们容易对那些有名望的东西产生神秘感,认为他们与众不同,认为他们超凡脱俗,认为他们高不可攀,或许真的如此,或许未必竟然。那么,今天,我们就一起走进北大著名学者、中国当代著名诗歌理论家、朦胧诗派的倡导者谢冕先生用他的眼、他的手、他的心为我们搭建的北大校园,去感受北大的那一份脱俗和平凡吧! 二、感受北大
北京(京)天津(津)上海(沪)重庆(渝)内蒙古自治区(内蒙古)维吾尔自治区(新)西藏自治区(藏)宁夏回族自治区(宁)广西壮族自治区(桂)香港特别行政区(港)澳门特别行政区(澳)黑龙江省(黑)吉林省(吉)辽宁省(辽)河北省(冀)山西省(晋)青海省(青)山东省(鲁)河南省(豫)江苏省(苏)安徽省(皖)浙江省(浙)福建省(闽)江西省(赣)湖南省(湘)湖北省(鄂)广东省(粤)台湾省(台)海南省(琼)甘肃省(甘或陇)陕西省(陕或秦)四川省(川或蜀)贵州省(贵或黔)云南省(云或滇)dian 华东:山东、江苏、江西、安徽、浙江、上海 华南:湖南、广东、广西、福建 华北:北京、天津、河北、内蒙、山西 西南:云南、贵州、四川、重庆、西藏 西北:陕西、甘肃、宁夏、新疆、青海 中国各省份简称的由来 四个直辖市 1、北京(京)北京有据可查的第一个名称为“蓟”(ji),是春秋战国时燕国的都城。辽金是将北京作为陪都,称为燕京。金灭辽后,迁都于此,
称中都。元代改称大都。明成祖朱棣从南京迁都于此,改称“北京”。名称一直沿用至今。1949 年设为直辖市。取全称中的“京”字作为简称。 2、天津(津)唐宋以前,天津称为直沽。金代形成集市称“直沽寨”。元代设津海镇,这是天津建城的开始。明永乐 2 年(1404 年)筑城设卫,始称天津卫,取“天子经过的渡口”之意。1949 年设为直辖市。取全称中的“津”字作为简称。 3、上海(沪)上海之称始于宋代,当时上海已成为我国的一个新兴贸易港口,那时的上海地区有十八大浦,其中一条叫上海浦,它的西岸设有上海镇。1292 年,上海改镇为县。这是上海这一名称的由来。1949 年,上海设为直辖市。古时,上海地区的渔民发明了一种竹编的捕鱼工具“扈”,当时还没有上海这一地名,因此,这一带被称为“沪渎”,故上海简称“沪”。春秋战国时上海是楚春申君黄歇封邑的一部分,故上海别称“申”。 4、重庆(渝)重庆古称“巴”。秦时称江州。隋称渝州。北宋称恭州。重庆之名始于1190 年,因南宋光宗赵敦先封恭王,后登帝位,遂将恭州升为重庆府,取“双重喜庆”之意。1997 年,重庆设为直辖市。隋时,嘉陵江称渝水,重庆因位于嘉陵江畔而置渝州,故重庆简称“渝”。 五个自治区 1、内蒙古自治区(内蒙古)(呼和浩特市) 蒙古原为部落名,始见于唐代记载。1206 年,成吉思汗统一蒙古各部,建立蒙古国。元灭后,蒙古族退居塞北。明清形成内、外蒙古之称。晚清以后,泛指大漠以南、长城以北、东起哲里木盟、西至套西厄鲁特所以盟旗为内蒙古。取全称中“内蒙古”三字作为简称。
高中语文新课程标准教材 语文教案( 2019 — 2020学年度第二学期 ) 学校: 年级: 任课教师: 说课稿 / 高中说课稿 / 高中说课稿范文 编订:XX文讯教育机构
高中语文《鸿门宴》说课稿模板 教材简介:本教材主要用途为通过学习语文的内容,培养学生的阅读能力、交流能力,学习语文是为了更好的学习和工作,为了满足人类发展和实现自我价值的需要,本说课稿资料适用于高中语文科目, 学习后学生能得到全面的发展和提高。本内容是按照教材的内容进行的编写,可以放心修改调整或直接进行教学使用。 各位评委,各位同仁: 大家好!今天我说课的题目是《鸿门宴》。下面我将从:教材、教法、学法、课时安排、教学过程五个方面来进行我的说课。 一、说教材 1、教材简析及该课所处的地位作用: 《鸿门宴》是人教版新教材高一年级《语文》必修1第二单元 第6课,节选自《史记》。所选情节描写的是刘邦、项羽在推翻秦王朝后,为争夺天下而进行的一场惊心动魄的政治斗争。鸿门宴是项羽在新丰鸿门设下的一个富有杀机的宴会,是刘、项之间政治矛盾由潜滋暗长到公开化的表现,是长达五年的楚汉相争的序幕,名为宴会,实则是一场激烈的政治斗争。作者以娴熟的艺术技巧,生动地刻画了不同性格的人物形象,描绘了众多富有戏剧性的令人难忘的场面,情节波澜起伏,扣人心弦。鸿门宴一文充分展示了刘、项之间不可调和的矛盾,并预示了胜负的必然结局。因此具有很高的史学价值和
文学价值。如何通过本课激起学生学习的兴趣,树立学生学好文言文的信心和领悟我国传统文化的精髓,这是一个关键所在。 2、教学目标: 高中语文教学大纲对文言文学习的要求是:诵读古典诗词和浅易文言文,背诵一定数量的名篇。掌握文中常见的文言实词、虚词和句式,能理解词句含义,读懂课文,学习用现代观念审视作品的内容和思想倾向。 根据课文特点,结合大纲要求,我确立了如下教学目标:(课件展示) 板书一二三 (1)知识和能力目标:一个巨匠,一部巨著:了解作家作品及相关史实,积累文言词句知识,学习创造性阅读。 (2)过程和方法目标:两个英雄,两种性格:利用人物个性化语言,分析人物性格,学习作者运用对照的方法和在矛盾斗争中描写人物的方法,学习一分为二地评论历史人物,树立正确的读史观。 (3)情感和价值目标:三种认知态度: ①学以致用的态度,感受司马迁隐忍发愤的著书精神,从容应对学习生活中的各种困难和挫折 ②领悟态度:分析项羽悲剧的原因,到底“败”在哪里?领悟良好的性格决定一生的命运
《名字的由来》 名字的由来作文(一): 名字的由来350字 中国的孩子习惯跟父同姓,我父亲姓滕,所以我也姓滕。我的名字是我在妈妈肚子里5个月的时候就取好了,是爸爸给我取的。远航是在2000年冬天那时正下着茫茫的大雪,我父母在温暖的小屋里看电视,他们看见广阔的大海上有一艘轮船,轮船上正飘着鲜红的中国五星红旗,站着威武的中国海军。这时爸爸突然就有了一个想法,说不管我们的孩子是男孩还是女孩,都叫远航。妈妈也觉得这个名字既好听又有好处,从此我就叫了滕远航。 我的爸爸妈妈期望我驾驶大轮船向大海前进。我期望我是一名海上特站队的队长,能够保卫国家,我不会辜负父母对我的期望。不论怎样我必须会努力去大海完成父母的心愿。 你此刻明白我的名字有什么秘密了吧,你们也说说你们的名字有什么秘密吧。 名字的由来作文(二): 名字的由来300字 我叫郑逸豪。郑是姓爸爸的姓,逸是飘逸的逸,英俊潇洒的意思。豪是英雄豪杰的豪,又勇敢又机智的意思。 我的名字还有其他三个。一是小马虎,因为我做事、写字、考试等都很马虎,十分容易犯大大小小的错误,所以爸爸常常严厉地批评我是个小马虎。 二是小憨憨,因为我的脸蛋胖乎乎的,说话的样貌憨憨的,做事情也懒洋洋的,所以妈妈常常摸着我的脸蛋,亲昵地叫我小憨憨。 三是旺崽小毛头,这是我姐姐给我起的名字,因为我小时候头上的头发可稀少啦,姐姐就把我的头发比喻成几根毛,所以我就有了这个小毛头这个绰号。 我的秘密已经告诉你们了,你们可千万别拿我的三个名字来开我的玩笑哦。 名字的由来作文(三): 名字的来历350字 小名字大好处 每个人都有自我的名字,每个名字都代表不一样的好处,都有一个动人的故
高中语文说课稿范文 篇一:高中语文说课稿范文(共7篇) 篇一:高中语文说课模板通稿 各位评委老师:大家好,我是几号考生,我今天说课的题目是。下面,我将会从说教材、说教法、说学法、说教学过程等部分来进行我的说课。 一、说教材 教材简析:本篇课文是人教版高中语文课本必修几第几册第几单元第几课的课文,是一篇什么体裁的文章。文章主要叙述的内容是什么,表现了作者什么样的思想感情。本篇课文具有什么样的地位,和什么特色。学习教材的目的是为了让学生能够触类旁通,举一反三,能将知识由课内向课外延伸。通过对本篇课文学习,能够更好的培养学生的鉴赏能力和归纳总结能力。 教学目标: (一)诗歌:根据教学大纲的要求,诗歌教学要以诵读为主,在诵读中使学生领悟诗的思想感情,鉴赏文学作品能够感受形象,品味语言。同时,本篇诗歌通过典型意象创造出优美的意境,巧妙的将诗人的情感融入其中。确立教学目标如下:我的知识目标是:品味诗的意象美,领悟诗的意境,体会诗人的真情。 能力目标是:培养学生鉴赏诗歌的能力。
德育目标是:体悟作者情怀,引发共鸣,逐渐养成良好的审美情趣,培养审美能力。本节课的教学重点是:领反复诵读,鉴赏诗歌意象,体会诗歌的意境美,体悟诗情,获得情感体验。教学难点是:把握诗歌的思想感情,以及意象的体味与把握。 (二)文言文:根据教学大纲的要求,文言文教学要求培养学生阅读浅显文言文的能力,把握文章的思想内容,积累语言知识。同时本课情节、结构、语言等的特点,确立教学目标如下:知识与能力目标:了解作者的基本常识;理解文中所出现的生僻词以及意义特殊的词语;把握文中的主要思想感情,初步鉴赏文中的形象与个性。 过程与方法:通过诵读质疑、自主探究、合作解决,培养学生借助注释和工具书阅读浅显文言文,理解重点词句的含义以及初步的研究分析能力并积累文言文实词、虚词和句式,培养学生的自学能力和翻译能力。情感态度与价值观目标:理解作者在作品中所流露出的情感,培养正确的审美观/价值观/人生观。 我确定以上的三个目标是体现新课标所提倡的“知识与能力、过程与方法、情感与态度”并重的教学理念。教学重点:诵读课文,在把握文意的基础上理解词句,积累一些文言实词、虚词和句式。 教学难点:掌握文章的写作风格和特点;深入分析文章内涵,并作出评价,激发学生的学习兴趣。
中国分4个直辖市,5个自治区,2个特别行政区,24个省,简称如下:直辖市: 北京[京] 天津[津] 上海[沪] 重庆[渝] 自治区: 宁夏[宁] 西藏[藏] 广西[桂] 新疆[新] 内蒙古 特别行政区: 香港[港] 澳门[澳] 省份: 黑龙江[黑] 云南[滇|云] 吉林[吉] 安徽[皖] 山东[鲁] 山西[晋] 广东[粤] 广西[桂] 江苏[苏] 江西[赣] 河北[冀] 河南[豫] 浙江[浙] 海南[琼] 湖北[鄂] 湖南[湘] 甘肃[甘|陇] 福建[闽] 四川[川|蜀]
贵州[黔|贵] 辽宁[辽] 陕西[陕|秦] 青海[青] 台湾[台] 各省省名的来由: 江西:以江南的西部得名。唐属江南西道,后设江西观察使,为江西得名的开始;宋置江南西路,简称江西路;元设江西行省及江西湖东道;明置江西省,后改江西布政使司;清改江西省,省名至今未变。 山东:以在太行山之东而得名。唐大部分属河南道;宋设京东路,后分京东东、西路;金更名山东东、西路,为山东得名的开始;元设山东东西道;明置山东省,后改山东布政使司;清改山东省,省名至今未变。 山西:以在太行山之西而行名。唐大部分属河东道;宋设河东路;金分河东北、南路;元设山西河东道,为山西得名的开始;明置山西省,后改山西布政使司;清改山西省,省名至今未变。 河南:以在黄河之南而得名。西汉即有河南郡,为河南得名的开始。唐大部分属都畿道和河南道;宋设京畿路和京西北路;金改南京路;元设河南江北省和河南江北道;明置河南省,后改河南布政使司;清改河南省,省名至今未变。 河北:以在黄河之北而得名。唐大部分属河北道,为河北得名的开始。宋设河北路,后分河北东、西路;金分河北东路设大名府路;元设燕南赵北道;明设北平省,后废省,所有府和直隶州直属中央,称北直隶;清改直隶省;1929年民国改河北省,省名至今未变。 湖南:以在洞庭湖之南而得名。唐属江南西道和黔中道,后设湖南观察使,为湖南得名的开始;宋称湖南路;元设岭北湖南道;明属湖广省,后改省为湖广布政使司;清分湖广省置湖南省,省名至今未变。 湖北:以在洞庭湖之北而得名。唐属江南东道、淮南道和山南东道;宋荆湖北路,简称湖北路,为湖北得名的开始;元设江南湖北道;明属湖广省,后改为省为湖广布政使司;清分湖广省置湖北省,省名至今未变。 广东:以广南东路简称得名。唐属岭南道;宋以旧广州辖地置广南东路,简称广东路,为广得名的开始;元设海北广东道;明置广东省,后改广东布政使司;清改广东省,省名至今未变。
篇一:高中语文省级说课一等奖《李清照词两首》说课稿 《李清照词两首》说课稿 嘉峪关市一中张红丽 尊敬的各位评委、各位老师: 大家下午好! 我今天说课的题目是《李清照词两首》,这是高一第二学期后半学期的学习内容。下面我将从教材分析、学情介绍、教学目标、教学过程四个部分来进行说明。 第一部分——教材分析 《李清照词两首》是人教版必修四第二单元中的篇目,这一单元选编的是宋词,在新课标实验教材五个必修模块中,这是唯一的宋词单元。本单元选取的是柳永、苏轼、辛弃疾、李清照四位词人的作品,四者基本完整地体现了宋词的发展脉络和艺术价值。李清照的词《醉花阴》《声声慢》放在最后,属略读篇目,安排一课时完成教学。《醉花阴》是作者南渡前的作品,抒发“相思闲愁”,《声声慢》是作者南渡后的名篇之一,将重点赏析,写词人历遭国破家亡夫丧劫难后的愁苦悲戚,是词人晚年生活的真实写照,也是时代苦难的象征。本课的学习将引导学生深入熟悉诗词鉴赏的基本方法,为以后进行诗歌与散文系列的选修打下坚实的基础。 第二部分——学情介绍 通过本单元前面六首词的学习,学生对豪放派和婉约派的风格特点已有了大体认识,对词的文体常识和基本鉴赏方法已有所掌握,这一点对学生学习本课是很有利的,但李清照的这两首词如果不了解词人的人生遭遇就很难把握两首词中深层的感情内涵。 针对学生学习本课的不利因素,我安排学生在课前 1.回顾以前学过的李清照的作品 2.查找相关资料了解李清照生平 3.利用早读熟读成诵,初步感知两词。第三部分——教学目标 基于以上教材地位、学情特点以及新课标的要求,我确立了本课的三维教学目标: ①背诵这两首词,因为《语文课程标准》中明确要求学生要背诵一定数量的名篇。 ②通过反复诵读,对比探究,品味意象,体会“闲愁”与“悲愁”的区别,熟悉诗词鉴赏的基本方法,学会知人论世。因《语文课程标准》中要求学生“要加强诵读,在诵读中感受作品的意境和形象,领悟作品的丰富内涵和深层意义”,还提出要培养学生的探究意识,要学习鉴赏诗歌的基本方法,学会知人论世,了解与作品相关的作家经历、时代背景等,加深对作家作品的理解”,依据这两点所以我确立了教学目标二,同时这也是本课的教学重难点。 ③体会真情之美,培养学生对古诗词的热爱及审美情趣。《语文课程标准》中提出“高中语文课程应关注学生情感的发展,培养学生自觉的审美意识和高尚的审美情趣”,因此我确立了教学目标三。 教法与学法 依据教学目标,及《语文课程标准》中“语文教学要为学生创设良好的自主学习情境,倡导自主、合作、探究学习方式”的要求,本课将通过诵读法、情境 法、对比探究法来进行教学,学生通过诵读法、自主合作探究法来学习。 说完了教法与学法,紧接着我将要说的是“教学过程”,分五步走。 第四部分、教学过程 一、新课导入 课前播放《菊花台》歌曲,学生欣赏完我会问:为什么说“菊花残,满地伤”?菊花有什么象征意义?学生对《满城尽带黄金甲》这部电影比较熟悉,可能会想到铺满皇宫的菊花,宫廷军变的失败,生命的凋残消逝??我会顺势总结到:菊花在影片中象征①对已逝辉煌的伤感②对生命凋残的悲悼。“花”这个意象在中国古典诗词中有着深刻的文化内涵,古人有以花
中国省份名称、简称、省会及其简称的由来 一、四个直辖市: 1、北京(京)——北京 北京据可查的第一个名称为“蓟”,是春秋战国时燕国的都城。辽金将北京作为陪都,称为燕京。金灭辽后,迁都于此,称中都。元代改称大都。明成祖朱棣从南京迁都于此,改称“北京”。名称一直沿用至今。1949年设为直辖市。取全称中的“京”字作为简称。 2、天津(津)——天津 唐宋以前,天津称为直沽。金代形成集市称“直沽寨”。元代设津海镇,这是天津建城的开始。明永乐2年(1404年)筑城设卫,始称天津卫,取“天子经过的渡口”之意。1949年设为直辖市。取全称中的“津”字作为简称。 3、上海(沪)——上海 上海之称始于宋代,当时上海已成为我国的一个新兴贸易港口,那时的上海地区有十八大浦,其中一条叫上海浦,它的西岸设有上海镇。1292年,上海改镇为县。这是上海这一名称的由来。1949年,上海设为直辖市。古时,上海地区的渔民发明了一种竹编的捕鱼工具“扈”,当时还没有上海这一
地名,因此,这一带被称为“沪渎”,故上海简称“沪”。春秋战国时上海是楚春申君黄歇封邑的一部分,故上海别称“申”。 4、重庆(渝)——重庆 重庆古称“巴”。秦时称江州。隋称渝州。北宋称恭州。重庆之名始于1190年,因南宋光宗赵敦先封恭王,后登帝位,遂将恭州升为重庆府,取“双重喜庆”之意。1997年,重庆设为直辖市。隋时,嘉陵江称渝水,重庆因位于嘉陵江畔而置渝州,故重庆简称“渝”。 二、五个自治区 1、内蒙古自治区(内蒙古或蒙)——呼和浩特 蒙古原为部落名,始见于唐代记载。1206年,成吉思汗统一蒙古各部,建立蒙古国。元灭后,蒙古族退居塞北。明清形成内、外蒙古之称。晚清以后,泛指大漠以南、长城以北、东起哲里木盟、西至套西厄鲁特所以盟旗为内蒙古。取全称中“内蒙古”三字作为简称。 2、新疆维吾尔自治区(新)——乌鲁木齐
(封面) 高中语文优秀说课稿范文3篇 授课学科: 授课年级: 授课教师: 授课时间: XX学校
高中语文优秀说课稿范文3篇 高中语文优秀说课稿范文1 一.关于教材: 我所说课的篇目是两千年前的爱国主义诗人屈原的代表作《离骚》,它是高中二年级的教学内容,具体编排在第三册第一单元(古典诗歌) 的第二篇。该单元所选中国古代古体诗8首,其中《诗经》中3首,汉 魏晋五言诗3首,《孔雀东南飞》并序以及《离骚》节选。在该单元中,《离骚》节选占有及其重要的位置。一方面,以屈原的作品为代表的楚 辞是继北方黄河流域出现《诗经》之后,在南方长江流域出现的具有独 特艺术魅力的新诗体,其本身在中国诗歌发展史上具有重要地位;另一 方面,楚辞作品,尤其是屈原的《离骚》从词句的角度看,地方特色鲜明,学生理解的难度较大。 从作品的内容看,《离骚》是一首规模宏伟的政治抒情长诗,全诗373句2400余字,既具有诗人自传的性质,又具有某些幻想性的浪漫主 义成分,整首诗歌感情回环激荡,撼人心魄。课文节选了长诗的第一节,内容主要是诗人自述身世、品质、政治理想以及自己的忠诚不为君王理 解的苦闷之情,表现了屈原坚持“美政”、至死不渝的高尚情操,抒发 了诗人忧国忧民、献身理想的爱国情感。 二.关于教学方法 结合作品特点,按照课程标准对高中阶段在古典诗歌方面阅读能力 的要求,我把《离骚》节选的教学目的确定为以下两点: 一是了解屈原的生平,理解诗人忧国忧民的高尚品质,培养学生的
爱国忧民的思想感情;二是反复诵读,抓住关键词语,疏通诗句,培养学生初步评价鉴赏古典诗歌的能力。学生是学习的主体,每当我们向自己的学生教授新知识的时候,自然要考虑到我们的教学对象在学习本课知识时的原有基础、现有困难及某些学习心理特征,从而有针对性地确定学习的重点、难点及教学对策。高中二年级学生,具有一定的古代诗歌的评价能力,但对于时代久远的楚辞作品,评价的前提――读懂诗歌的内容方面,仍存在困难,根据大纲要求结合学生的实际情况以及本文特点,我确立本文重点及难点如下: 教学重点: 鉴赏重要的语句,感受屈原高尚的人格美。 教学难点: 关键词句的疏通。如何突破重点、难点,有效完成本课的教学任务呢?我决定从教材特点和面临的具体学情出发,首先要把握两个原则:第一,注意高视角、低起点,先把基础知识落到实处,再循序渐进进行教学;第二,重视素质教育,有意识地对学生进行人文素质的培养。 具体教学措施如下: 第一,充分预习。要求学生课下预习,早读检查(内容包括:A作家作品;B写作背景;C掌握生字生词;D熟读课文),逐步培养学生的认知能力和自学能力。 第二,分解重点、难点。本课将分两课时进行,把教学难点,即词句的疏通安排在第一课时中,把教学重点,即作品思想内容的理解安排在第二课时,以确保学生真正做到一课一得。
一、中国共有省级行政区34个,具体为: 2个特别行政区:香港、澳门。 4个直辖市:北京、上海、天津、重庆。 23个省:河北、山西、陕西、山东、河南、辽宁、吉林、黑龙江、江苏、浙江、安徽、江西、福建、湖北、湖南、四川、贵州、云南、广 东、海南、甘肃、青海、台湾。 5个自治区:内蒙古、新疆、西藏、广西、宁夏。 二、各市省会目录 1.北京市北京 2.天津市天津 3.上海市上海 4.重庆市重庆 5.河北省石家庄 6.山西省太原 7.陕西省西安 8.山东省济南 9.河南省郑州 10.辽宁省沈阳 11.吉林省长春 12.黑龙江省哈尔滨 13.江苏省南京 14.浙江省杭州 15.安徽省合肥 16.江西省南昌 17.福建省福州 18.湖北省武汉 19.湖南省长沙 20.四川省成都 21.贵州省贵阳 22.云南省昆明 23.广东省广州 24.海南省海口 25.甘肃省兰州 26.青海省西宁 27.台湾省台北 28.内蒙古自治区呼和浩特 29.新疆维吾尔自治区乌鲁木齐 30.西藏自治区拉萨 31.广西壮族自治区南宁 32.宁夏回族自治区银川 33.香港特别行政区香港 34.澳门特别行政区澳门
三、5 - 32省会的地级市与县级市 5.河北省(11个地级市、22个县级市): 11个地级市:石家庄市、唐山市、秦皇岛市、邯郸市、邢台市、保定市、张家口市、承德市、沧州市、廊坊市、衡水市。 22个县级市:辛集市、藁城市、晋州市、新乐市、鹿泉市、遵化市、迁安市、武安市、南宫市、沙河市、涿州市、定州市、安国市、高碑店市、泊头市、任丘市、黄骅市、河间市、霸州市、三河市、冀州市、深州市。 6、山西省城市(11个地级市、11个县级市) 11个地级市:太原、大同、朔州、阳泉、长治、晋城、忻州、晋中、临汾、运城、吕梁 11个县级市:古交、潞城、高平、原平、介休、侯马、霍州、永济、河津、孝义、汾阳 7.陕西省(10个地级市、3个县级市): 10个地级市:西安市、铜川市、宝鸡市、咸阳市、渭南市、延安市、汉中市、榆林市、安康市、商洛市。 3个县级市:兴平市、韩城市、华阴市。 8.山东省(17个地级市、31个县级市): 17个地级市:济南市、青岛市、淄博市、枣庄市、东营市、烟台市、潍坊市、济宁市、泰安市、威海市、日照市、莱芜市、临沂市、德州市、聊城市、滨州市、菏泽市。 31个县级市:章丘市、胶南市、胶州市、平度市、莱西市、即墨市、滕州市、龙口市、莱阳市、莱州市、招远市、蓬莱市、栖霞市、海阳市、青州市、诸城市、寿光市、安丘市、高密市、昌邑市、曲阜市、兖州市、邹城市、新泰市、肥城市、乳山市、文登市、荣成市、乐陵市、禹城市、临清市。 9.河南省(17个地级市、21个县级市): 17个地级市:郑州市、开封市、洛阳市、平顶山市、安阳市、鹤壁市、新乡市、焦作市、濮阳市、许昌市、漯河市、三门峡市、南阳市、商丘市、信阳市、周口市、驻马店市。 21个县级市:巩义市、新郑市、新密市、登封市、荥阳市、中牟县、偃师市、汝州市、舞钢市、林州市、卫辉市、辉县市、沁阳市、孟州市、禹州市、长葛市、义马市、灵宝市、邓州市、永城市、项城市、济源市。 10.辽宁省(14个地级市、17个县级市): 14个地级市:沈阳市、大连市、鞍山市、抚顺市、本溪市、丹东市、锦州市、营口市、阜新市、辽阳市、盘锦市、铁岭市、朝阳市、葫芦岛市。 17个县级市:新民市、瓦房店市、普兰店市、庄河市、海城市、东港市、凤城市、凌海市、北镇市、大石桥市、盖州市、灯塔市、调兵山市、开原市、凌源市、北票市、兴城市 11.吉林省(8个地级市、1个州、20个县级市): 8个地级市:长春市、吉林市、四平市、辽源市、通化市、白山市、松原市、白城市。 1个州:延边朝鲜族自治州。 20个县级市:九台市、榆树市、德惠市、舒兰市、桦甸市、蛟河市、磐石市、公主岭市、双辽市、梅河口市、集安市、临江市、大安市、洮南市、延吉市、图们市、敦化市、龙井市、