Radar Technologies for Landslide
Detection,Monitoring,Early Warning
and Emergency Management
Chiara Del Ventisette,Giovanni Gigli,Veronica Tofani,Ping Lu
and Nicola Casagli
Abstract Landslide detection and monitoring represent a starting point to produce hazard and risk maps useful for proper urban planning and emergency management. In this chapter,different applications of radar interferometric techniques are presented to prove their applicability for detection,mapping and monitoring landslides in different geological settings and with different operative conditions. Data acquisition was carried out through satellite(operating in C-band)and ground-based(operating in Ku-band)sensors.In particular,in this chapter,the application of radar interferometry for landslide detection(Arno River basin),for landslide monitoring(Santo Stefano d’Aveto landslide),for landslide hazard scenario de?nition(Montebeni landslide)and for landslide emergency management(Santa Trada landslide)are presented and discussed.The different applications highlight the capability and suitability of these techniques to work in different operative settings(i.e.?different phenomena and geological framework)and for different aims (survey,early warning and emergency assessment).
Keywords Radar interferometryáGround deformationáLandslideáRapid mappingáMonitoringáEmergency management
C.Del Ventisette(&)áG.GigliáV.TofaniáN.Casagli
Department of Earth Science,University of Florence,Via La Pira,4,50121Florence,Italy
e-mail:chiara.delventisette@uni?.it
G.Gigli
e-mail:giovanni.gigli@uni?.it
V.Tofani
e-mail:veronica.tofani@uni?.it
N.Casagli
e-mail:nicola.casagli@uni?.it
P.Lu
College of Surveying and Geo-Informatics,Tongji University,Siping Road1239,
Shanghai200092,People’s Republic of China
e-mail:luping@https://www.doczj.com/doc/ac16790868.html,
?Springer-Verlag Berlin Heidelberg2015
209 M.Scaioni(ed.),Modern Technologies for Landslide Monitoring and Prediction,
Springer Natural Hazards,DOI10.1007/978-3-662-45931-7_11
210 C.Del Ventisette et al. 1Introduction
Ground movements and in particular landslides represent one of the main threats to human life in most mountainous regions in the world.
The occurrence of landslides depends on complex interactions among a large number of partially interrelated factors(geological setting,geomorphologic fea-tures,soil properties,land cover characteristics and hydrological impacts).Land-slide triggering factors include both natural(intense or prolonged rainfall, earthquakes,volcanic eruptions,rapid snowmelt)and human causes(slope exca-vation and loading;land use changes,e.g.deforestation;rapid reservoir drawdown; blasting vibrations).
Even though some global landslide databases exist,such as EM-DAT(Interna-tional Disaster Database;Sapir and Misson1992),NatCatSERVICE(natural catastrophe loss database;Munich Re;Germany),durham fatal landslide database (DFLD;https://www.doczj.com/doc/ac16790868.html,/database.htm)and many papers have been published on this topic(e.g.Petley et al.2005;Nadim et al.2006;Kjekstad and Highland2008;Kirschbaum et al.2010),the global impact of slope failures on the population,structures and infrastructures,the economy and the environment remains largely undetermined.In2004–2010,2,620non-seismic,fatal landslides were recorded worldwide,causing a total of32,322recorded deaths(more than4,600 fatalities per year,see Petley2012)testifying that the existing database underesti-mate the landslides frequency and the associated fatalities.This suggests that a reassessment of the global landslide risk forecasting and prevention action is needed.
The main step to get this aim is to keep updated landslides inventory at basin/ national scale and to monitor known landslides for early-warning purpose.
To measure ground movement displacements,different technologies are avail-able,such as geotechnical techniques(extensometer,inclinometers,etc.),surveying techniques(manual triangulation,theodolites and GNSS geodetic networks)and geophysical techniques.These conventional monitoring techniques(Guzzetti et al. 2012)produce very accurate information but generally limited to a few points on a sliding mass,and they are rarely representative of the whole landslide behaviour.
Furthermore,the two main problems of using conventional techniques,espe-cially for basin-scale landslide detection and monitoring,concern the time and economic cost.
Various remote-sensing technologies(passive and active optical sensors,active microwave sensors)can overcome these limitations and,as concerns satellite data, they can provide ground movement information for very large areas(several thousands of square kilometres,see Parker et al.2011)with temporal and spatial high resolution.In particular radar techniques,both spaceborne Differential Inter-ferometric Synthetic Aperture Radar(DInSAR)and Persistent Scatterers Interfer-ometry(PSI)and ground based Synthetic Aperture Radar(GBSAR),can operate over wide areas in almost any weather condition,continuously over a long time, providing real-time widespread information with millimetric accuracy without the need of accessing the study area.
Radar Technologies for Landslide Detection (211)
This work aims at illustrating,through some selected case studies,the capability of both satellite and ground-based radar techniques to operate in different settings for landslide detection,mapping and monitoring,as well as for early-warning purpose.
2Radar Techniques
Radar technologies have been developed since the beginning of the twentieth cen-tury?rstly to remotely detect objects.In the last decades,synthetic aperture radar (SAR)data analysis has been often used for ground movement analysis.The SAR interferometry(Curlander and McDonough1991)has become,in recent years,one of the emerging techniques for the measurement of ground displacements and an operational tool for monitoring and early warning.SAR techniques are suitable tools in checking/updating inventory maps dealing with mass movement phenomena whose typical velocity values range from few millimetres/year up to1.6m/year (i.e.extremely slow landslides according to the classi?cation in Cruden and Varnes 1996).Thanks to more than20years covered by radar images,a spatially and temporally detailed characterization of displacement rates is possible today.
The SAR systems used for ground movement detection and monitoring differ both for the platform on which they are installed(spaceborne or ground based)and for the wavelength(frequency)of the emitted signal.Enhancement in wavelength corresponds to a decrease in spatial resolution and measurement precision and an increase in the penetration capacity and stability of the returned signal with respect to the environmental changes.
The radar spaceborne sensors are emitting radio waves in X-band (f=8–12.5GHz;λ=2.4–3.75cm;i.e.sensor Cosmo-SkyMed by Italian Space Agency and TerraSAR-X by the German Aerospace Center and British National Space Center),C-band(f=4–8GHz;λ=3.75–7.5cm;i.e.sensor ERS and ENVISAT by European Space Agency and RADARSAT by Canadian Space Agency)and/or L-band(f=1–2GHz;λ=15–30cm;i.e.sensor JERS and ALOS-PALSAR by Japanese National Space Development Agency).
Although ground-based sensors generally emitting in Ku-band(f=12.5–18GHz;λ=1.6–2.4cm),some systems operate in band S(f=2–4GHz;λ=7.5–15cm), C-band(f=4–8GHz;λ=3.75–7.5cm),band X(f=8–12.5GHz;λ=2.4–3.75cm) and Ka-band(f=26.5–40GHz;λ=0.75–1.1cm).The use of Ku-band allows high resolution and high-displacement sensitivity although can cause frequent coherence loss;for this reason,a continuous monitoring is preferred(Monserrat et al.2014).
DInSAR is a remote-sensing technique that exploits the phase difference(i.e., the interferogram)between SAR data pairs acquired over the same area at different times,allowing the production of deformation maps at centimetre or millimetre accuracy.Power image is related to the amplitude of the backscattered signal. Although the power image is not directly related to the displacement measurement, it allows to understand the main features of the radar image and to?nd good points
212 C.Del Ventisette et al. for interferometric processing.The coherence and hence the quality of the interferometric phase of the observed points is strongly related to the signal-to-noise ratio,i.e.to the amplitude of the backscattered signal.The spaceborne data could be affected by temporal decorrelation due to changes in observed scene(i.e.vegeta-tion,rapid deformation of surface).
A remarkable improvement in the quality of DInSAR results for ground deformation mapping and monitoring is given by the advanced DInSAR techniques (A-DInSAR).These techniques make use of large multi-temporal stacks of spaceborne SAR images acquired over the same area,in order to identify radar targets on which it is possible to detect and measure displacements along the line-of-sight(LOS)direction over time.Two different groups of A-DInSAR techniques can be distinguished on the basis of processing approach:(i)PS-based A-DInSAR techniques(called also PSI)and(ii)Interferogram stacking techniques.
The PSI techniques are based on the amplitude and phase information over single isolated re?ectors,derived by computing differential interferograms of all the acquisitions with respect to the same reference master image,that are characterized by high temporal signal stability(Wasowski and Bovenga2014).Different meth-odologies are based on this approach:Permanent Scatterers InSAR—PSInSAR?(Ferretti et al.2000,2001;Colesanti et al.2003);SqueeSAR?(Ferretti et al.2011); Interferometric Point Target Analysis(IPTA)(Werner et al.2003;Wegmuller et al. 2004);Persistent Scatterers Pair(PSP)(Costantini et al.2000,2009);Stable Point Network(SPN)(Crosetto et al.2005);Standford Method for Persistent Scatterers (StaMPS)(Hoper et al.2004,2007);and QuasiPS(Perissin and Wang2012).
The interferogram stacking technique is based on the information derived from differential interferograms obtained from interferometric pairs with small perpen-dicular baseline.The decorrelation phenomena that could arise are mitigated by maximizing the number of pixels exploited and improving the signal-to-noise ratio. The small baseline subset(SBAS)(Bernardino et al.2002;Lanari et al.2004)is based on this approach.
The scienti?c literature reports some successful case studies dealing with the detection,mapping and monitoring of landslide phenomena(Hilley et al.2004; Strozzi et al.2006;Colesanti and Wasowski2006;Canuti et al.2007;Wasowski et al.2007;Meisina et al.2007;Cascini et al.2009;Fornaro et al.2009;Prati et al. 2010;Herrera et al.2011;Cigna et al.2012;Lu et al.2012;Righini et al.2012; Tofani et al.2013;Del Ventisette et al.2013,2014;Ciampalini et al.2014; Wasowski and Bovenga2014;Zhang et al.2014).
The ground-based synthetic aperture radar(GBSAR)is a radar-based terrestrial remote sensing imaging system(Tarchi et al.1997,2000,2003;Antonello et al. 2004;Monserrat et al.2014).GBSAR has proven to be a reliable remote sensing tool which enhances the advantages of the spaceborne InSAR and provides dis-placement maps with high spatial and temporal resolutions and accuracy,thanks to its high acquisition frequency(up to one image every minute)and a rapid deployment,which makes it a promising tool for managing local(at single slope scale)emergencies.Ground-based radar installations are useful in single hillsides monitoring,while imaging from satellite radar is able to monitor very large areas.
Radar Technologies for Landslide Detection (213)
Landslide monitoring applications through GBSAR have been consolidated in the last years(Atzeni et al.2001;Casagli et al.2009,2010;Gigli et al.2011;Del Ventisette et al.2012;Intrieri et al.2013;Nolesini et al.2013;Bardi et al.2014;Di Traglia et al.2014;Mazzanti et al.2014).
Satellite and ground-based radar interferometry are derived from the same physical principles but in GBSAR,the topographic information does not need to be removed,since the position of the antennas remains the same during different scans (zero baseline condition).
3Satellite SAR Data for Landslide Detection
Preparation of reliable landslide hazard and risk maps is crucial for hazard miti-gation and risk management.In recent years,various approaches have been developed for quantitative assessment of landslide hazard and risk.However, possibly due to the lack of new data,very few of these hazard and risk maps were updated after their?rst generation.The chosen test site is the Arno River basin, located in central Italy mostly within the Tuscany region.The basin is strongly affected by landslides(Catani et al.2005;Farina et al.2006).
From the previously mapped inventory created from1992to2007,it turns out that landslides tend to cluster in the Arno River basin.This clustering effect can also be re?ected in the spatial distribution of persistent scatterers which are able to detect slow-moving and extremely slow-moving landslides according to the velocity scale proposed by Cruden and Varnes(1996).In this study,a(semi-)automatic spatial statistical approach,PSI Hotspot and Clustering Analysis(PSI-HCA,Lu et al. 2012),was employed so as to detect spatial clustering of PSI point targets which may be closely associated with landslide occurrences in the mountainous areas of the Arno River basin.PSI point targets processed from four years(from2003to 2006)of RADARSAT-1images based on the PSInSAR?technique(Ferretti et al. 2001)were deployed for the analysis.
PSI-HCA chie?y consists of two statistical approaches:(1)Getis-Ord G statistics and(2)kernel density estimation.The Getis-Ord G statistics was utilized to estimate the clustering level of PSI point targets while the kernel density estimation was employed to construct a smooth tapered surface of a hotspot.In this study,the scale distance for PSI-HCA was determined by the average value of the shortest distance to a channel and a ridge of each pixel of a10-m resolution DTM.However,for a more sophisticated estimation,this scale distance is suggested to be evaluated by the bivariate K-function analysis so as to determine the spatial patterns of PSI point targets and landslide occurrences at diverse scales(Lu et al.2014a).
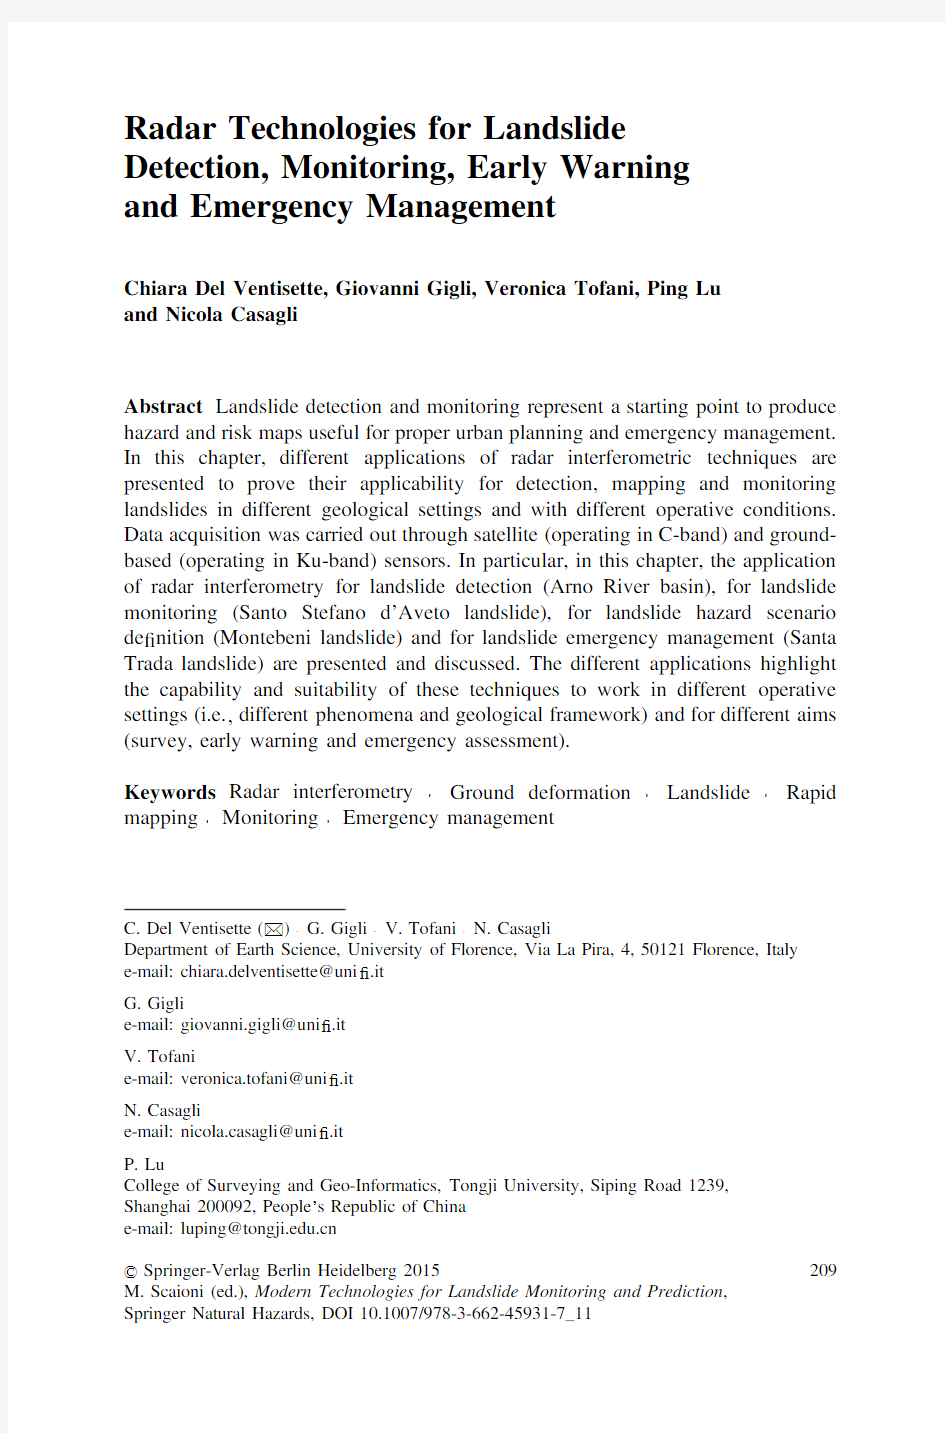
Figure1shows part of the output of PSI-HCA in the Arno River basin.This hotspot map was combined by the outputs from both ascending and descending orbits.The red hotspots indicate the mass movements moving away from the satellite,whereas the blue hotspots reveal the mass movements moving towards the sensor.The deeper the colour is,the higher clustering level of PSI point targets is
detected.The violet hotspots suggest that the mass movements were detected by both ascending and descending orbits,however,with the opposing moving direc-tions.Field surveys were performed to validate most of the labelled landslide-prone regions in Fig.1as detected by PSI-HCA.
Hotspot analysis provides an important support for con ?rming existing landslides in the Arno River basin.The Carbonile landslide (Fig.1)is a well-known landslide reactivated in 1984.The PSI-HCA approach detected a hotspot in the area and con ?rmed the previous investigation.At the same time,the hotspot analysis is also an effective tool to detect new extremely slow-moving landslides.In particular,a new landslide was detected in the cemetery of Trespiano (Fig.1).The hotspot represents a cluster of 678Radarsat PS ’s from 2003to 2006(Fig.2).Among them,211PS ’s are from ascending orbits and 467are from descending orbits.The existing landslide inventory did not report any landslides,and also no evidence of movement is attested by ERS PS ’s covering the period from 1992to 2001.The time series of Radarsat PS ’s suggests that the movement has accelerated since October 2003(Fig.2).The velocity of these Radarsat PS ’s in the cemetery reaches 15mm/year.Stable and unstable parts can be easily distinguished by checking the velocity dis-tribution of PS ’s,where a sharp increase of velocity can be seen along the slope (Fig.2).The landslide is then mapped with the help of the topographic map and aerial photos.The result is validated by ?eld evidence:a ?eld reconnaissance carried out in March 2009discovered existing damages on walls,roads and
structures.Fig.1The output of PSI-HCA covering part of the Arno River basin
214 C.Del Ventisette et al.
The hotspot detected in the Mugello area (Fig.1)was attributed to the subsidence due to groundwater pumping and railway tunnel construction instead of the landslide.This may bring one of the major uncertainties for the PSI-HCA approach for landslide detection.This hotspot map was then further used as the input for the landslide hazard and risk assessment in the Arno River basin.In particular,an economic loss of about 3.22billion Euros throughout the whole basin was predicted for the upcoming 30years (Lu et al.2014b
).
Fig.2The Trespiano landslide detected by the PSI-HCA method.a Radarsat PS ’s distribution and mapping results of the new landslide.b Time series of PS ’s located in the northern part of the cemetery
Radar Technologies for Landslide Detection (215)
4PSI for Landslide Monitoring
An extensive bibliography contains works on the use of PSI for landslide moni-toring (Berardino et al.2003;Singhroy and Molch 2004;Strozzi et al.2006;Meisina et al.2007;Fornaro et al.2009;Prati et al.2010).In many cases,the PSI data have been integrated with in situ monitoring instrumentation (Farina et al.2006;Peyret et al.2008;Liao et al.2012;Tofani et al.2013,2014).The joint use of satellite and ground-based data facilitates the geological interpretation of a landslide and allows a better understanding of landslide geometry and kinematics.
An example of this approach is the Santo Stefano d ’Aveto landslide,located in the Northern Apennines (Italy)and affecting the homonym village (Fig.3).It can be classi ?ed as a complex phenomenon that is an earth rotational slide evolving into a ?ow.The landslide has an extension of 1.3km 2and a volume of about 10million of cubic metres.
From a geological point of view,the main outcropping lithologies are constituted by sandstones with limestones and marls and ophiolitic rocks as basalts and gab-bros.Six boreholes have been drilled to investigate the landslide instability and
the Fig.3Landslide map with location of the geotechnical monitoring instrumentation and inclinometer measurements (modi ?ed from Tofani et al.2013)
216 C.Del Ventisette et al.
Radar Technologies for Landslide Detection (217)
underground geological setting.The results of the boreholes show that the underground geology is characterized by a three-layer stratigraphy,which are starting from the top(Tofani et al.2013):
(i)coarse debris in a sandy–silty matrix with thin layers of clay material and
large blocks of ophiolitic rocks,with a thickness ranging from25m to40m; (ii)weathered bedrock with a thickness ranging from5m to20m;and (iii)bedrock constituted by the sandstones and rubbles of the Complesso di Monte Veri and slates of the Ottone?ysch.
The investigated area is included in the Landslide Inventory Map developed within the PAI(Hydrogeomorphological Setting Plan)of the Po River Basin Authority.The landslide has been classi?ed as active in the upslope portion and dormant in the remaining part where almost all the villages are located(Fig.3).
The buildings and the main roads of the village are extensively interested by cracks and damages and are often subjected to repairing and consolidation works.
A geotechnical campaign has been carried out from2000to2006,during which six inclinometers and eleven piezometers have been installed inside the landslide perimeter(Fig.3).The inclinometric measurements have allowed reconstructing the depth of the sliding surface and the rate of movement.The landslide affects the?rst layer of material composed of colluvium soil made of debris in a sandy–silty matrix.The slip surface is located at about10m depth in the upslope portion of the landslide and at about20m depth near Santo Stefano d’Aveto village.In general, the depth of the slip surface increases from the upper to the lower portion of the landslide.The annual mean velocities recorded by inclinometers range from 59mm/year for Sensor I1–15mm/year for Sensor I4(Fig.4).The piezometers have registered a free water table in the debris cover with an average depth of the piezometric surface ranging from a few metres in the upper portion of the landslide up to approx.20m at the toe.The measurements present a seasonal variability with a water table lowering during dry seasons and rising in the wet season.
PSI analysis has been carried out making use of ERS-1/2SAR images spanning from1992to2001and ENVISAT SAR images spanning from2002to2008,both of them in ascending and descending orbits.The SAR images were processed with the PSInSAR?approach(Ferretti et al.2001).The target points within the Santo Stefano landslide have a high density,particularly in correspondence of the urban settlement of the village because the wide availability of bright,stable(i.e.phase coherent)man-made objects(Fig.4).
The ERS and ENVISAT PS’s for both orbits are displayed in Fig.2.The average absolute velocity of the PS’s extracted from ERS descending stack within the landslide is12.3mm/year while the maximum value is37.9mm/year.The highest velocities,up to35mm/year,have been generally measured in the upslope zone of the landslide(Rocca d’Aveto village).In correspondence with the Santo Stefano village,slope velocities vary from a minimum of6mm/year to a maximum of 16mm/year.The average velocity of PS’s from ERS ascending data set is approx. 6mm/year along the satellite LOS,with peaks,recorded nearby the Rocca d’Aveto village,up to11mm/year.
The PS ’s from ENVISAT descending shows a mean velocity (in absolute value)of 10.2mm/year with a peak of 19.8mm/year.The PS ’s from ENVISAT ascending data set has a mean value of velocity of 3.5mm/year while the maximum value is around 7mm/year.Also for ENVISAT data set,deformation rates decrease moving downslope.
The time series of ENVISAT data,spanning the time period from 2002to 2008,have been compared with the inclinometers ’readings,whose measurements cov-ered a period from 2001to 2006.The Inclinometer I1has been compared with the PS A0106,whereas the Inclinometer I5has been compared with the PS A013W (Fig.4).In order to perform a representative comparison,the displacement vector of the inclinometers has been projected along the LOS using a simple trigonometry equation:
I los ?I slope sin h
where I los is inclinometer displacement along the LOS,I slope is the inclinometer displacement and θis 23°,the look angle of the SAR sensors.In both cases,the computed velocity values of the inclinometers along the LOS (22mm/year for
I1Fig.4PSI data available for the Santo Stefano d ’Aveto landslide.a ERS1/2ascending (1992–2000).b ERS1/2descending (1992–2001).c ENVISAT ascending (2003–2008).d ENVISAT descending (2002–2008),(modi ?ed from Tofani et al.2013)
218 C.Del Ventisette et al.
and 13mm/year for I5)show values quite similar to the mean velocities of closest PS ’s (20mm/year and 23mm/year,see Fig.5).
The PSI data have been compared also with the piezometer measurements in order to de ?ne the relationship among the landslide displacements and the trig-gering factors.In general,it has been observed that during wet seasons,there is the rise of the water table level in the piezometers and an increase of the displacement rates from PSI technique,while during dry seasons,there is a lowering of the water table level in the piezometers and a decreasing of the displacement rates from PSI technique.
5GBSAR for Hazard Scenario De ?nition in Emergency Conditions
Landslides involving large rock masses are always associated with high-risk levels,because their failure may occur catastrophically with long https://www.doczj.com/doc/ac16790868.html,rge rockslides cannot be stabilized at a reasonable cost.Therefore,the most proper measure for risk reduction in settled areas is to set up early-warning systems associated with emergency plans.Correct understanding of a rockslide volume (magnitude)and failure mechanism (with associated energy)is,therefore,very useful,as they in ?uence the type of movement and the runout
distance.
Fig.5Comparison of PS ’s
and inclinometer time series
of displacement (reproduced
with permission from Tofani
et al.2013)Radar Technologies for Landslide Detection …
219
On Mt.Beni (province of Florence,Italy)a reversed ophiolitic sequence outcrops (Fig.6).The eastern slope had been the object of quarrying activity from the 1940s to the 1980s,when the quarry was abandoned for safety reasons.The total height of the slope,from the quarry ?oor,is about 340m.
In April 2002,after a moderate rainstorm,evidence of instability appeared on the slope,with a continuous perimetral crack bounding the upper and right limits of the unstable area,spanning a total length of more than 200m (red line in Fig.6).Due to the lack of evidences and to inaccessibility,the left and lower limits of the rockslide were unknown.
Given the very fast movements,most of the rockslide body was not accessible for the installation of benchmarks or monitoring instrumentation,with the exception of the upper area (yellow sector in Fig.6),where a conventional distometric monitoring was immediately installed.
In order to extract precious information on the inaccessible sector,the new promising GBSAR technique was employed (Gigli et al.2011).
From 5th to 19th May 2002,the GBSAR LISA Prototype No.2of the Joint Research Centre of the European Commission (JRC)was installed in front of the eastern slope of Mt.Beni at a distance of approx.2km.This sensor allowed the investigation of the unstable slope H24,even under bad weather conditions with high rainfall or thick fog.
From the cumulated displacement map (Fig.7),it was immediately evident that the active area was concentrated in three sectors:(i)the rockslide crown area,corresponding to the perimetral crack;(ii)the lower part of the rockslide,just under the forested area;and (iii)the main debris cone,fed by continuous rock falls from the upper sectors.Thus,the data provided by GBSAR technique allowed the def-inition,with high precision,of the boundaries of the moving mass and the evolution of the movement in space and time.These outputs were fundamental to calibrate and validate the numerical modelling,which was performed by using a distinct element method for discontinuum modelling (UDEC version 3.1,see Itasca 2000
).Fig.6The eastern slope of
Mt.Beni with outcropping
materials.Red line shows the
perimetral crack observed in
2002.The accessible area is
shaded in yellow 220
C.Del Ventisette et al.
The rock mass characterization and the quantitative description of discontinuities were obtained by geomechanical surveys,according to ISRM suggested methods (ISRM 1978).Discontinuity and rock mass parameters were obtained by using the Hoek and Brown (1997)and Barton and Choubey (1977)criteria,respectively.The highest vertical displacements were located in the upper and less steep part of the model,were comparatively small in the steepest sector and did not involve the breccias of basalt.As for the horizontal displacements,they did not involve the basaltic breccias and showed a maximum in the median sector of the slope,where the steepness increases.This displacement distribution was in good accordance with the GBSAR monitoring data,as most deformational sectors and activity zones almost completely agreed.
From the numerical model,the upper area was expected to exhibit a prevailing vertical displacement,sinking between sub-vertical cracks,with tension failure prevailing along the steepest lower part experiencing a ?exural toppling and associated basal shearing mechanism (Fig.8).
The complex rock topple/rock slide mechanism resulting from the numerical modelling in agreement with GBSAR data was associated with a paroxistic failure,with a possible long runout distance.Several authors observed that for large rock or debris avalanches,the runout distance increases with landslide volume (Sheidegger 1973;Hsu 1975;Hungr 1990;Nicoletti and Sorriso Valvo 1991;Legros 2002;Morelli et al.2010).A dynamic analysis was therefore performed using the DAN software (Hungr 1995;Hungr and Evans 1997).The material was assigned a frictional rheologic behaviour,with a dynamic friction angle obtained though the relation proposed by Legros (2002
):
Fig.7Cumulated
displacement (in mm)map
obtained from GBSAR data
acquired from 8th to 13th
May 2002(time span:124h)Radar Technologies for Landslide Detection …
221
H =L ?0:16V à0:15
where V is the rockslide volume.
Although the planimetric boundary of the rockslide was accurately de ?ned thanks to GBSAR data,the slip surface depth was unknown.Two distinct scenarios were thus analysed,by considering a rockslide volume of 106and 5×10⁵m 3,respectively (Fig.9
).
Fig.8Distinct element numerical modelling.a Vertical displacement contours.b Horizontal displacement contours.c Displacement vectors.d Block model with magni ?ed displacement and zone state (modi ?ed from Gigli et al.2011
)
Fig.9Runout analysis,
considering a rockslide
volume of 5×10⁵m 3
222 C.Del Ventisette et al.
Radar Technologies for Landslide Detection (223)
On28th December2002,at7.30a.m.,the main collapse took place,involving a total volume of about5×105m3.The failure mechanism was a rock topple/ rockslide type.The detachment area completely corresponded to the one high-lighted by the GBSAR observations and the runout was in good agreement with the 5×10⁵m3volume scenario.
After the main collapse,the maximum credible scenario was associated with rock falls,due to the presence of large blocks on the slope.Thus,after the construction of a reinforced earth defence barrier,?nished on14th April2003,the road was opened to traf?c again,and the inhabitants were able to return to their houses.
The presented case is one of the?rst applications of the GBSAR technique for rockslide monitoring,where a complete and successful hazard scenario has been de?ned and used for civil protection purposes.
6GBSAR for Early Warning
Thanks to its prompt installation and optimization,one of the main applications of GBSAR systems regards the landslide emergency management for early-warning purpose.
In this section,an application of the GBSAR technique to rapid mapping and to monitor a landslide threatening transportation infrastructures is presented.The application is?nalized to de?ne the landslide dynamic and to evaluate possible risk scenario.In the case study presented,the main endangered infrastructure is a motorway,namely the A3branch,located in Calabria Region(southern Italy).The GBSAR system installed was designed by JRC and successively optimized by Ellegi company.
On30th January2009,a mass movement never detected before and located near Santa Trada viaduct(Fig.10a)caused the closure of that sector of the A3motor-way.From a geological point of view,this area is characterized by Paleozoic micaschists and augen gneiss overlaid by weathered Paleozoic biotite and musco-vite granites along with arkosic Pleistocenic sands and conglomerates(Marchetti 1968).The latter are involved in the investigated mass movement.The landslide has a length of100m and a maximum width of90m.The landslide was triggered by intense rainfall occurred during December2008and January2009(cumulative monthly rain values of146.0mm and188.6mm,respectively)that resulted in the saturation of soil for almost the entire period(Del Ventisette et al.2011).The main aim was to evaluate the possible risk scenarios and to provide early warning. Indeed,despite the landslide did not threaten the roadway directly,its complete collapse would have hit the pillars of the Santa Trada viaduct and,in the event of heavy rainfall,the landslide could be developed in a debris?ow affecting the nearby village.
On31st January2009,a GBSAR system was installed and after1day of signal optimization,the monitoring started.After few days,the GBSAR monitoring allowed to hypothesize two different risk scenarios:
(i)
the landslide would evolve as a series of small collapses due to low-intensity rainfall.Reasonably the collapses would involve three sectors detected by GBSAR.In such a case,collapses would not affect the motorway pillars,even though they could block a minor road located at the foot of the slope;or (ii)the landslide would fail as a whole.This hypothesis may occur as a result of
very intense rainfall.In such a case,the pillars could be damaged producing a serious risk for on way
drivers.
Fig.10a Picture of Santa Trada landslide nearby the viaduct of the A3motorway.b Radar ‘power ’image of Santa Trada landslide (top )compared to a photograph (bottom ),both acquired from the GBSAR station.A and B indicate stable areas;C NW slope;D and E unstable areas;F https://www.doczj.com/doc/ac16790868.html,ndslide sectors:1—Top Sector;2—Eastern Sector;3—Western Sector.c Displacement map covering the entire duration of the campaign.Three different sectors are visible.The cumulative displacement recorded during the whole monitoring period of 86days (from 2nd February 2009to 29th April 2009)reached the value of 4,320mm (modi ?ed from Del Ventisette et al.2011)224 C.Del Ventisette et al.
Since 12th February 2009,an internet application with the monitoring result updated every 15min from GBSAR was working.The continuous monitoring ended on 29th April 2009when the landslide reached a new equilibrium state.In order to evaluate the possible risk scenario and to understand the dynamics of the landslide,interferograms (spanning a variable time interval from 7min to 2h)and daily displacement maps were elaborated (Fig.11).
According to the GBSAR ?rst data results,the unstable area has an extension of about 6,000m 2(estimated total volume of approx.18,000–30,000m 3)and can be divided into 3sectors (namely Top Sector,Western Sector,and Eastern
Sector,Fig.11Example of cumulative deformation map (a –b )and interferogram (c )achievable from GBSAR data.a Cumulative displacement map between 2nd and 3rd February 2009(time interval 24h).b Cumulative displacement map between 4th and 5th February 2009(time interval 24h).c Interferogram between 18:08UT and 18:22UT of 4th February 2009(time interval 14min)Radar Technologies for Landslide Detection (225)
226 C.Del Ventisette et al. see Fig.10c),characterized by different behaviours in terms of cumulative displacement and dynamics.
During the three months of GBSAR monitoring,the landslide showed several acceleration phases.Between1st and5th February,the average velocity of displacements along the LOS of the instrument reached5.5mm/h.The landslide continued to accelerate until mid-February up to a value of more than14mm/h.On 4th February,a shallow landslide developed in the Eastern Sector.Thanks to the high acquisition frequency of GBSAR,it was possible by means of a mosaic of incremental interferograms spanning a time interval of2h,to follow its evolution and to evaluate the deformation velocity(Fig.11).The super?cial collapse reached a maximum velocity of38mm/h.This rate was estimated by using interferograms with low time span(7,14and21min,respectively).By increasing the time span, the interferograms show a complete decorrelation on the4th February in the Eastern Sector,while it is still possible to estimate the velocity of the Top and the Western Sectors of the landslide.
From mid-February until the end of monitoring(29th April2009),two periods of heavy acceleration overlapped to a regular decreasing of velocity.During the last month,an average velocity of0.5mm/h towards the radar was measured.Before the end of monitoring,the landslide movements were low enough not to represent a risk for the infrastructures in the immediate future.
The rainfall data analysis highlights a close relationship between precipitations and displacements(Del Ventisette et al.2011).
Field survey has highlighted that also the contiguous slope,facing on the motorway(Sector‘c’in Fig.10b),was fractured in many points.For this reason,a reprocessing of the GBSAR data was performed to understand and quantify the movements of this sector.Since the alignment between the radar and the assumed direction of movement is not the most favourable,a correction of LOS deformation has to be made(in this case GBSAR recorded15–35%of displacement).A cumulative displacement map(spanning a time interval of59days between4th February and4th April)shows a maximum value of about5mm.After the cor-rection,the velocity of deformation results between8×10?3mm/h and2×10?2 mm/h.Considering the deformation recorded and the thickness of the material involved in this sector(less than1m),this slope did not represent a risk for the motorway security.
7Conclusion
The presented case studies demonstrate the increasing important role played by radar interferometry in landslide management.Indeed,the use of radar interfer-ometry provides to be a very cost and time-ef?cient technique.
The satellite advanced differential interferometric synthetic aperture radar (A-DInSAR)techniques have demonstrated to be suitable for exploring large land areas and for identifying high-risk zones.It represents an effective tool for remotely
Radar Technologies for Landslide Detection (227)
measuring and investigating landslide-prone areas,which are characterized by various mechanisms,dynamics and geological/environmental settings.
The PSI technique is suitable for the investigation of extremely slow-moving landslides due to its capability of detecting ground displacements with millimetre precision.However,the interpretation of PSI outputs is sometimes dif?cult for the large number of possible persistent scatterers(PS’s)that may be obtained.The approach proposed in this chapter,the PSI Hotspot and Cluster Analysis (PSI-HCA),is a procedure for mapping landslides ef?ciently and automatically. PSI-HCA could represent an ef?cient way to extract useful information from large amount of PSI data especially considering the rapid development of short-wave-length X-band sensors which largely increases PS density and shortens the revisit time.
PSI technique can also have a high potential in the?eld of landslide monitoring, but the use of this technique alone for this purpose needs to be carefully evaluated. Even if the use of PSI approach may overcome some limitations of conventional monitoring techniques(https://www.doczj.com/doc/ac16790868.html,rge extension of the area to be monitored and high costs,inaccessibility of the area,problems of installation and maintenance),it cannot replace in situ measurements.Based on the results of the application of PSI for landslide monitoring,some general guidelines can be derived.Even though PSI analysis is a valuable technique to monitor landslides,some expedients have to take into account to obtain sound results:(i)correct reconstruction of the actual dis-placement vector,i.e.the vertical component(VV)and the horizontal E-W com-ponent(VE)through the combined use of ascending and descending tracks and (ii)the reconstruction of the link between surface and subsurface displacements combing the PSI results with local underground displacements measures(such as inclinometer readings)in order to compare the PSI-based surface velocities with the actual3D vectors at different depths in the landslide body.
Ground-based SAR(GBSAR)can provide sequences of deformation maps that allow to study the landslide’s temporal evolution,aiming at the detection and de?nition of kinematic features,even when the acceleration changes are very small, and to evaluate the volume of the material involved in the mass movement. Although the accuracy of the data can slightly decrease,it also granted the possi-bility of acquiring data during precipitations,which represent the most critical events for slope stability.The accuracy of GBSAR data in mapping and monitoring of landslides is fundamental in risk management and in preparation of emergency plans.
The GBSAR technique is essential for a rapid and detailed de?nition of risk scenarios in emergency conditions,and,at the same time,it allows the acquisition of all the necessary information without the need of entering dangerous areas,thus ensuring the safety of the involved personnel.
The combined use of satellite and ground-based SAR data may improve the capacity of the monitoring system of slow-moving landslides providing displace-ment map at different spatial and temporal resolution.
228 C.Del Ventisette et al. Acknowledgements The research leading to these results received funding from the European Union SAFER and DORIS,ESA TERRAFIRMA Project,and https://www.doczj.com/doc/ac16790868.html, Project founding by National Agency of Civil Protection.We thank the research group of Applied Geology of Uni-versity of Firenze for their support during projects development.We also wish to thank Ellegi-LiSALab srl for the preprocessing of GB-InSAR data.
References
Antonello,G.,Casagli,N.,Farina,P.,Leva,D.,Nico,G.,Sieber,A.J.,&Tarchi,D.(2004).
Ground-based SAR interferometry for monitoring mass https://www.doczj.com/doc/ac16790868.html,ndslides,1,21–28. Atzeni,C.,Canuti,P.,Casagli,N.,Leva,D.,Luzi,G.,Moretti,S.,Pieraccini,M.,Sieber,A.& Tarchi,D.(2001).Monitoring unstable cultural heritage sites with radar interferometry.In: Sassa K(Ed),UNESCO/IGCP Symposium on Landslide Risk Mitigation and Protection of Cultural and Natural Heritage(p.257–264),Tokyo,15–19January2001.
Bardi,F.,Frodella,W.,Ciampalini,A.,Bianchini,S.,Del Ventisette,C.,Gigli,G.,et al.(2014).
Integration between ground based and satellite SAR data in landslide mapping:The San Fratello case study.Geomorphology,223,45–60.
Barton,N.R.,&Choubey,V.(1977).The shear strength of rock joints in theory and practice.
Rock Mechanics,10,1–54.
Berardino,P.,Fornaro,G.,Lanari,R.,&Sansosti,E.(2002).A new algorithm for surface deformation monitoring based on small baseline differential SAR interferograms.IEEE Transactions on Geoscience and Remote Sensing,40,2375–2383.
Berardino,P.,Costantini,M.,Franceschetti,G.,Iodice,A.,Pietranera,L.,&Rizzo,V.(2003).Use of differential SAR interferometry in monitoring and modelling large slope instability at Maratea(Basilicata,Italy).Engineering Geology,68(1–2),31–51.
Canuti,P.,Casagli,N.,Catani,F.,Falorni,G.,&Farina,P.(2007).Integration of remote sensing techniques in different stages of landslide response.In K.Sassa,et al.(Eds.),Progress in landslide sciences(pp.251–259).Berlin:Springer.
Casagli,N.,Tibaldi,A.,Merri,A.,Del Ventisette,C.,Apuani,T.,Guerri,L.,et al.(2009).
Deformation of Stromboli Volcano(Italy)during the2007crisis by radar interferometry, numerical modeling and?eld structural data.Journal of Volcanology and Geothermal Research,182,182–200.
Casagli,N.,Catani,F.,Del Ventisette,C.,&Luzi,G.(2010).Monitoring,prediction and early warning using ground-based radar https://www.doczj.com/doc/ac16790868.html,ndslides,7(3),291–301.doi:10.1007/ s10346-010-0215-y.
Cascini,L.,Fornaro,G.,&Peduto,D.(2009).Analysis at medium scale of low-resolution DInSAR data in slow-moving landslide affected areas.ISPRS Journal of Photogrammetry and Remote Sensing,64,598–611.doi:10.1016/j.isprsjprs.2009.05.003.
Catani,F.,Casagli,N.,Ermini,L.,Righini,G.,&Menduni,G.(2005).Landslide hazard and risk mapping at catchment scale in the Arno River https://www.doczj.com/doc/ac16790868.html,ndslides,2,329–342. Ciampalini,A.,Bardi,F.,Bianchini,S.,Frodella,W.,Del Ventisette,C.,Moretti,S.,&Casagli,N.
(2014).Analysis of building deformation in landslide area using multisensor PSInSAR?technique.International Journal of Applied Earth Observation and Geoinformation,33,166–180. Cigna,F.,Del Ventisette,C.,Gigli,G.,Menna,F.,Agili,F.,Liguori,V.,&Casagli,N.(2012).
Ground instability in the old town of Agrigento(Italy)depicted by on-site investigations and persistent scatterers data.Natural Hazards Earth System Sciences,12,3589–3603.doi:10.
5194/nhess-12-3589-2012.
Colesanti,C.,&Wasoswki,J.(2006).Investigating landslides with satellite synthetic aperture radar(SAR)interferometry.Engineering Geology,88,173–199.
Colesanti,C.,Ferretti,A.,Prati,C.,&Rocca,F.(2003).Monitoring landslides and tectonic motions with the permanent scatterers technique.Engineering Geology,68,3–14.
[键入文字] 2019 年时政:2 月21 日国内篇 1、脱贫攻坚三年行动开局良好我国农村贫困发生率降至1.7% 记者从国新办吹风会上获悉:2018 年我国减少农村贫困人口1386 万,连续6 年超额完成千万减贫任务,贫困发生率下降到1.7%,全国已有153 个贫困县宣布脱贫摘帽,2018 年预计还有284 个贫困县退出。 2、长江经济带环境污染犯罪可从重处罚 随着环境污染犯罪案件多发高发,执法司法机关普遍反映实践中存在着确定管辖 难、调查取证难、司法鉴定难、法律适用难等突出问题,亟待通过顶层设计予以解 决。 20 日,最高人民法院、最高人民检察院、公安部、司法部、生态环境部首次就办理环境污染刑事案件有关问题联合出台《关于办理环境污染刑事案件有关问题座谈会纪要》,要求统一法律适用和政策把握,依法准确有效惩治环境污染犯罪,形成各部门依法惩治环境污染犯罪的合力。 此次《纪要》也对长江经济带区域污染环境犯罪规定了相关从重处罚的情形,规定 对于发生在长江经济带11 省(直辖市)的跨省(直辖市)排放、倾倒、处置有放射性的废物、含传染病病原体的废物、有毒物质或者其他有害物质的,将从重处罚。 3、农业农村部要求做好斑海豹幼崽救护工作 近日,大连破获一起特大盗捕斑海豹案件。案件发生后,农业农村部要求严查此事 并务必做好斑海豹幼崽救护工作,同时派员会同辽宁省农业农村厅赶赴大连,就案件 处理和斑海豹救治情况进行指导和对接。 下一步,农业农村部还将指导协调地方渔业渔政部门,妥善做好斑海豹幼崽收容救 助工作,待专家和兽医联合评估认可具有野外生存能力后再分批放归野外。农业农村 部还将进一步加强海洋馆等繁育场所规范管理,切断可能的非法贸易链条,联合有关 1
课程(论文)题目:红外隐身原理及其应用技术 内容: 1 背景 光电隐身技术可分为可见光隐身、红外隐身和激光隐身三大类。光电隐身起源于可见光隐身,成熟于红外隐身,发展于激光隐身。而现代红外隐身技术经历了探索时期(2 0世纪60年代以前)、技术全面发展时期(20世纪60~70 年代)和应用时期(20世纪80年代至今)。红外隐身技术于20世纪70年代末基本完成了基础研究和先期开发工作,并取得了突破性进展,已由基础理论研究阶段进入实用阶段。从20世纪80年代开始,国外陆海空三军研制的新式武器已经广泛采用了红外隐身技术。 红外隐身技术通过降低或改变目标的红外辐射特征,实现对目标的低可探测性。这可通过改进结构设计和应用红外物理原理来衰减、吸收目标的红外辐射能量,使红外探测设备难以探测到目标。 2 红外隐身原理 概述 从红外物理学可知, 物体红外辐射能量由斯蒂芬-玻耳兹曼定律决定: 式中W——物体的总辐射出射度; σ——玻耳兹曼常数; ε——物体的发射率; T——物体的绝对温度。 温度相同的物体,由于发射率的不同,在红外探测器上会显示出不同的红外图像。鉴于一般军事目标的辐射都强于背景,所以采用低发射率的涂料可显著降低目标的红外辐射能量。另一方面,为降低目标表面的温度,红外伪装涂料在可见光和近红外还具有较低的太阳能吸收率和一定的隔热能力,以使目标表面的温度尽可能接近背景的温度,从而降低目标和背景的辐射对比度,减小目标的被探测概率。 红外侦察系统能探测目标的最大距离R为: 式中J——目标的辐射强度; ——大气透过率; N A——光学系统的数值孔径; ——探测器的探测率; ω——瞬时视场; ——系统带宽; ——信号电平; ——噪声电平。 红外隐身的主要目的是减少公式中第一项的各项取值,也就是说,目标的红外隐身应包括三方面内容,一是改变目标的红外辐射特性,即改变目标表面的发射率;二是降低目标的红外辐射强度,即通常所说的热抑制技术;三是调节红外辐射的传播途径(包括光谱转换技术)。 改变目标红外辐射特性采用的技术 (1) 改变红外辐射波段改变红外辐射波段,一是使目标的红外辐射波段处于红外探测器的响
文章编号:1001-893X(2009)02-0038-05 侦察雷达数字中频接收机的设计与实现? 杨春 (中国西南电子技术研究所,成都610036) 摘 要:针对传统模拟接收机在实现方式上的不足,提出了侦察雷达数字化接收机的性能改进方案。并对数字中频中多项关键技术进行原理分析,给出了雷达中频数字化具体实现方案,同时给出了一个比较全面的数字中频测试方法。 关键词:侦察雷达;数字化接收机;中频采样;数字本振;镜频抑制度 中图分类号:TN959.1 文献标识码:A Design and Implementation of the Digital Intermediate Frequency Receiver for a Reconnaissance Radar YANG Chun (Southwest China Institute of Electronic Technology,Chengdu 610036,China) Abstract:In allusion to the defect of analog receiver,performace improvement scheme of digital intermediate frequency(IF)receiver for a surveillance radar is proposed,and theory of several key technologies is analysed.The implementation scheme of IF digitization for reconnaissance radar is given. A comprehensive digital IF test method is provided. Key words:reconnaissance radar;digital receiver;intermediate frequency sample;digital local oscillator;image suppression 1 引言 传统雷达接收机正交解调在模拟域进行,I/Q 通道混频器要求同频率相位相差90°,两个通道通过滤波器后,信号增益也要求完全一致。如果在信号带宽上所有频点不能满足这个要求,则后端信号处理会因为I/Q通道的幅度不一致在脉压后产生距离旁瓣和相位正交性不好引入虚假目标,同时传统模拟接收机每个通道都需要一个A/D,两个A/D的差异会进一步降低系统性能。 随着集成电路的高速发展,尤其是高速A/D变换器的发展,使得直接中频采样成为可能,即直接将模拟中频信号通过A/D变换为数字信号,同时在数字域实现正交解调,生成数字I、Q基带信号。与传统模拟方法相比,直接中频采样具有更高的精度与稳定性。尤其是数字本振不受环境变化影响,没有温度漂移,同时数字本振的幅度一致和相位正交性比模拟本振高一个数量级。本文探讨了侦察雷达数字中频的实现方案,给出了一种基于多相滤波器结构的数字接收机实现方法,实现了对60 MHz 调制的中频信号(带宽5 MHz)数字下变频设计,并给出了最后试验结果。 ?收稿日期:2008-12-03;修回日期:2009-01-21
隐形材料 定义: 旨在降低武器装备的雷达、红外、可见光或声波等可探测信号特征、使之难以被探测、识别、跟踪或攻击的一种特殊用途材料。 所属学科: 航空科技(一级学科);航空材料(二级学科) 简介:隐身材料是隐身技术的重要组成部分,在装备外形不能改变的前提下,隐身材料(stealth material)是实现隐身技术的物质基础。武器系统采用隐身材料可以降低被探测率,提高自身的生存率,增加攻击性,获得最直接的军事效益。因此隐身材料的发展及其在飞机、主战坦克、舰船、箭弹上应用,将成为国防高技术的重要组成部分。对于地面武器装备,主要防止空中雷达或红外设备探测、雷达制导武器和激光制导炸弹的攻击;对于作战飞机,主要防止空中预警机雷达、机载火控雷达和红外设备的探测,主动和半主动雷达、空对空导弹和红外格斗导弹的攻击。 浅谈隐形材料 隐身材料按频谱可分为声、雷达、红外、可见光、激光隐身材料。按材料用途可分为隐身涂层材料和隐身结构材料。这里便着重介绍几类重要的隐身材料。 雷达隐身涂料技术:为了减少雷达截面,常用的隐身技术途径有三类:即外形设计技术、吸收材料技术和加载对消技术。 下面主要介绍相关的雷达隐身涂料技术: 涂敷型吸波涂料:实质上是一种高分子复合涂料。它是以高分子溶液或乳液为基料,及波刘和其它附加成分分散加入其中而制成。如美国研制的系列铁氧体吸波涂料,主要成分是俚镉、镍镉和锂锌铁氧体,它在厘米波段到分米波段,可使雷达波反射衰减达20DB。因此,研制开发“轻、薄、宽”的吸波涂料是今后主要发展方向。(例如B-2战略隐形轰炸机上就是用了一种基于环氧树脂的“先进高频材料”隐身涂料)目前国外
第37卷,增刊 红外与激光工程 2008年9月 V ol.37 Supplement Infrared and Laser Engineering Sep. 2008 收稿日期:2008-07-04 作者简介:程永强(1981-),男,陕西渭南人,助理研究员,主要从事激光雷达及中高层大气方面研究。Email:chengyq@https://www.doczj.com/doc/ac16790868.html, 钠激光雷达在临近空间探测方面的最新进展 程永强,胡 雄,徐 丽,闫召爱,郭商勇 (中国科学院空间科学与应用研究中心,北京 100190) 摘要:介绍了Na 激光雷达的研究背景,详细阐述了Na 激光雷达的国内外发展动态和Na 层测风测温激光雷达的基本探测原理,最后简要描述了发展Na 层测风测温激光雷达的重要意义。 关键词:激光雷达; Na 层测风测温; 临近空间 中图分类号:P4 文献标识码:A 文章编号:1007-2276(2008)增(激光探测)-0028-04 Advances of Na Lidar in near space detection CHENG Yong-qiang, HU Xiong ,XU Li, YAN Zhao-ai, GUO Shang-yong (Center for Space Science and Applied Research, Chinese Academy of Science, Beijing 100190, China) Abstract :The research background of Na lidar is introduced, then the latest advances and the detecting theory of Na wind/temperature lidar is described in detail, at last the important significance of developing Na wind / temperature lidar is explained. Key words :Lidar; Na wind / temperature lidar; Near Space 0 引 言 10 km 以上的地球大气称之为“中高层大气”[1] , 它是日地系统的一个重要中间环节,包括对流层的上部、平流层、中间层和热层。目前国际上临近空间(20~100 km )飞行器技术快速发展,临近空间因其飞行环境的特殊性和广阔的应用前景而受到高度关注。因此,中高层大气探测与研究在大气科学和空间物理中具有举足轻重的地位,在航天等高新科技领域也有重要的意义,也是优化人类的生存环境、保障人类社会可持续发展的需求。 光在大气中传播时,会被大气分子和气溶胶散射或吸收,这种大气分子对光的散射和吸收是使用激光对大气组成和特性进行探测的物理基础。目前,激光雷达(Lidar)是对中高层大气探测与研究的主要手段 之一[2]。根据激光束于大气物质相互作用机制,可设计不同的激光雷达[3],包括气溶胶激光雷达、拉曼激光雷达、共振荧光激光雷达、瑞利散射激光雷达等。 共振荧光激光雷达利用共振荧光过程,将激发光的频率调至散射物质的吸收线,通过散射回波信号来探测大气特性。由于波源或观察者的运动而出现观测频率与波源频率不同的现象,称之为多普勒效应。利用这种多普勒效应进行测风的激光雷达称为测风激光雷达。多普勒频移的大小和方向由分子运动速度方向与激光束方向的夹角决定。因此,通过测量散射光的多普勒谱线频移量就可获得大气风速;通过测量散射光的多普勒谱线展宽就可获得大气温度。Na 层测风测温激光雷达[4]利用中层顶区域内的钠原子作为示踪物,由接收到的共振荧光散射回波光子数反演大气温度、风场及Na 原子数密度廓线。其仅有20多
49 多普勒测风激光雷达系统 1.研究背景 大气风场信息是一项重要的资源,精确可靠的大气风场测量设备可提高风电可再生能源领域的利用率,改进气候气象学模型建立的准 确性,增强飞行器运行的安全性,因此在风电、航空航 天、气候气象、军事等领域都有着重要的意义。 风场信息测量的手段主要分为被动式和主动式两大类。传统的被动式测量装置有风速计、风向标和探空仪,主动式测量装置有微波雷达、声雷达等。风速计和风向标只能实现单点测量,借助测风塔后实现对应高度层的风场信息检测,这类传统装置易受冰冻天气影响,测风塔的搭建和维护也需要花费大量的人力物力,还存在移动困难和前期征地手续复杂等问题;微波雷达以电磁波作为探测介质,由于微波雷达常用波长主要为厘米波,与大气中的大尺寸粒子(如云、雨、冰等)相互作用产生回波,无法与大气中的分子或气溶胶颗粒产生作用,而晴空时大气中大尺寸粒子较少,因此微波雷达在晴空天气条件下将出现探测盲区。另外,微波雷达还具备庞大的收发系统也导致其移动困难;声雷达与微波雷达测量原理相似,不同的是将探测介质由微波改为了声波。声雷达的探测方式使得在夜间和高海拔地区易出现信噪比降低的情况甚至无法测量。因此,迫切需要补充新型的风场测量手段替代传统测风装置实现大气风场信息的测量。2. 测风激光雷达系统 2015年,南京牧镭激光科技有限公司成功研制出国产化测风激光雷达产品Molas B300,该产品基于多普勒原理可实现40~300 m 风场信息测 ■ 黄晨,朱海龙,周军 南京牧镭激光科技有限公司 第一作者 黄晨 量,风速测量精度可达0.1 m/s ,风向测量精度可达1°,数据更新率为1 Hz ,风速测量范围可达0~60 m/s 。测风激光雷达定位为外场应用装备,对环境适应性有较高要求,Molas B300可在外界温度范围为-40℃~50℃,相对湿度为0%~100%的环境条件下正常工作。除此以外,Molas B300体积小质量轻(约50 kg )方便运输安装便捷,可显著降低项目前期施工时间。测风激光雷达采用激光作为探测介质,可与空气中微小颗粒发生相互作用,具有时空分辨率高、自动化程度高、安装简单易维护、移动便携性好等优势,可有效提高项目实施效率, 因此成为了最具前景的风场信息测量手段。 表1 各类风场探测技术的优缺点 探测技术优势 劣势风速计、风向标较高的水平分辨率, 成本低单点测量微波雷达三维风场探测,测量距离 可达100 km 晴空条件下不能使用,体积庞大声雷达三维风场探测探测距离较近,易受大气环境影响 测风激光雷达 三维风场探测,晴空下仍 能测量,移动便携性好 图1 测风激光雷达Molas B300
雷达与红外兼容隐身材料的研究及进展 哈恩华,黄大庆,王智勇,何 山,丁鹤雁 (北京航空材料研究院,北京100095) 摘要 雷达与红外兼容隐身材料在军事领域具有广阔的应用前景。综述了对雷达与红外兼容隐身材料的研究状况及应用,详细分析了粘结剂对材料隐身性能的影响以及半导体填料对实现雷达与红外兼容隐身的可能性。 关键词 雷达与红外兼容隐身材料 粘结剂 掺杂半导体 Development in Radar Absorbing Materials with Infrared Camouflage H A Enhua,HU ANG Daqing,WANG Zhiyong,HE Shan,DING Heyan (Beijing Institut e o f A eronautical M aterials,Beijing100095) Abstract R radar absorbing materials w ith infr ared camouflag e w ill hav e bro ad applicat ion pro spect in many militar y fields.I n this paper,the present research situat ion and applicatio ns o f these ty pes o f stealth mater ials ar e re v iew ed.T he effect of binder o n camouflage pr operties is ana lyzed theor etically.T he possibility o f doped semiconductor materia ls being tailor ed to radar and infr ared camo uf lag e is also discussed. Key words r adar&infr ared stealth materials,binder,doped semico nducto r 0 前言 随着现代军事侦察技术的发展,对隐身技术的要求也越来越高,单一频段隐身技术已远不能满足现代战争需求,未来隐身材料必须具有宽频特性。目前雷达在各种探测器中仍占主导地位,而红外技术在侦察、捕获目标和制导技术方面也已得到广泛的应用,因此,雷达和红外隐身的兼容性将是今后研究的主要方向之一。 雷达隐身是通过减弱、抑制、吸收、偏转雷达回波强度,降低雷达散射截面积,使其在一定范围内难以被敌方雷达识别和发现的技术。根据雷达系统工作原理,雷达最大探测距离R max 为[1]: R m ax=[P t G t2 2 /(4 )3P min]1/4(1)式中:P t为雷达发射功率,G t为发射天线的最大增益, 为雷达工作波长, 为被探测目标的雷达散射截面积,P min为雷达接收机最小可检测信号功率。雷达吸波材料是雷达隐身技术中十分关键的技术之一。通过雷达吸波材料可以将入射电磁波能量转换成热能或产生干涉从而吸收衰减入射电磁波来降低目标的雷达散射截面积。 鉴于一般情况下目标的红外辐射强度都高于环境背景,红外隐身的目的主要就是降低目标红外辐射强度。公式(2)给出了点源红外探测系统能探测目标的最大距离R max与目标辐射强度的关系[2]。 R max=(J )1/2[ /2(N A)D*]1/2 [1/( f)1/2(V s/V n)]1/2(2)式中:J为目标的辐射强度, 为大气透过率,N A为光学系统的数值孔径,D*为探测器的探测率, 为瞬时视场, f为系统带宽,V s为信号电平,V n为噪声电平。而目标的辐射强度J正比于目标的辐射出射度M(M= T4, 为物体的发射率; 为玻耳兹曼常数;T为物体的绝对温度)。因此,红外隐身材料一是通过改变目标的红外辐射特性来降低目标表面发射率;二是通过在可见光和近红外具有较低的太阳能吸收率和一定的隔热能力来降低目标表面的温度,以降低目标辐射强度,从而减小目标的被探测概率。 由于雷达吸波材料与红外隐身材料的隐身机理不同,使得它们的性能要求相互制约。雷达吸波材料要求高吸收率,低反射率;而红外隐身材料要求低吸收率,高反射率。要使同一种材料同时满足以上两种要求,实现起来有相当的困难。近年来,国内外科研人员一直在致力于解决这个难题。本文中我们对这一领域的研究及应用状况进行了综述,并着重分析了粘结剂对红外隐身性能的影响以及掺杂半导体填料满足雷达与红外兼容隐身的可能性。 1 研究状况及应用 雷达波与红外兼容主要包括毫米波与红外兼容和厘米波与红外兼容。毫米波与红外兼容隐身材料主要用于导弹和地面武器装备的隐身;厘米波和红外兼容隐身材料主要用于军用飞行器的隐身。实现雷达和红外兼容目前有两条技术途径:一是研制一种雷达波高吸收、热红外低辐射的隐身材料;二是分别研制高性能雷达波吸收和热红外低辐射材料,然后通过结构设计将其复合起来,复合后其雷达波吸收性能和热红外低辐射性能仍能保持不变或变化不大[3]。 国内有多家单位在开展毫米波和红外兼容隐身材料的研究。王智勇等[4]在毫米波吸波材料上涂覆一层红外涂料,在一定的厚度范围内,可以同时兼顾两种性能,且雷达波吸收性能基本不变。研究表明,涂层的厚度对谐振点吸收率及吸收频宽的影响是完全一致的。只是随红外涂层厚度的增加,谐振峰向低频平移,同时也能保证原涂层的红外辐射性能不变,如图1所示。谢国华等[5]用红外低发射率涂料与吸波材料料复合制成双层材料,外层是红外低发射率涂料,其发射率范围为0.23~ 0.54,内层吸波材料分别用涂覆型吸波材料(发射率为0.81)或 325 雷达与红外兼容隐身材料的研究及进展/哈恩华等 哈恩华:男,1974年生,硕士,工程师,主要从事隐身材料研究 T el:010 ******** E mail:haenhua@https://www.doczj.com/doc/ac16790868.html,
电子科技大学电子工程学院标准实验报告 (实验)课程名称:信息对抗实验电子科技大学教务处制表
实验报告(六) 学生姓名:王超楠学号:2013020904011 指导教师:廖红舒/张花国 实验地点:科研二号楼B453 实验时间:周二晚 一、实验室名称:信息对抗系统专业实验室 二、实验项目名称:雷达参数侦实验察 三、实验学时:4学时 四、实验原理: MATLAB软件具有编程实现简单、使用方便等优点,是目前应用广泛的计算机仿真软件,并且提供各种常用数字通信信号源生成函数的使用帮助文件。因此让学生通过实际上机实验,熟悉MATLAB计算机仿真软件,可实现各种雷达信号产生及分析仿真,从而加深对雷达信号产生、参数提取的理解。 五、实验目的: 1.针对常规脉冲/脉冲压缩(LFM、相位编码)雷达,掌握截获信号的计算机模拟仿真; 2.掌握脉冲雷达脉宽、脉冲幅度、脉冲达到时间、频率及脉内调制特征参数估计的基本方法。 六、实验内容: 1. 提取信号包络; 2. 设置门限; 3. 估计TOA与PW; 4. 提取脉内信号样本; 5. 脉内调制识别; 6. 估计频率; 7. 估计噪声功率、PA; 七、实验器材(设备、元器件): 计算机、Matlab仿真软件
八、实验步骤: 1.学习MATLAB软件的使用并学习其通信信号帮助工具箱; 2.利用MATLAB语言生成雷达信号,并提取雷达参数。 九、实验数据及结果分析 1.提取信号包络 (1)常规脉冲信号包络 (2)BPSK信号包络
(3)QPSK信号包络
(4)LFM信号包络
2.设置门限 由上图分析可以设置门限,其中常规脉冲信号门限设置为4,其余的设置为3。 3.估计TOA与PW 4.提取脉内信号样本 四种信号的脉内样本提取方式类似,由于数据比较多因此以常规脉冲雷达的脉内数据提取为例。
直接探测多普勒测风激光雷达 引言 风是研究大气动力学和气候变化的一个重要参量,利用风的数据,可以获得大气的变化,并预见其改变,促进人类对能量、水、气溶胶、化学和其它空气物质圈的了解,提高气象分析和预测全球气候变化的能力。目前的风场数据主要来源于无线电探空测风仪、地面站、海洋浮标、观测船、飞行器以及卫星,它们在覆盖范围和观测频率上都存在很大限制。对全球进行直接三维风场测量已经提到日程上来,世界气象组织提出了全球范围的高分辨率大气风场数据的迫切需要,迄今为止,多普勒测风激光雷达是唯一能够获得直接三维风场廓线的工具,具有提供全球所需数据的发展潜力[1]。 激光雷达是探测大气的有力工具,随着激光技术、光学机械加工技术、信号探测、数据采集以及控制技术的发展,激光雷达技术的发展也日新月异。多普勒测风激光雷达具有实用性、高分辨率和三维观测等优点,是其它探测手段难以比拟的[2, 3, 4]。 新研制的1064 nm直接探测多普勒测风激光雷达,利用双边缘技术对对流层三维风场进行探测[5]。本文介绍了该激光雷达 的总体结构及其各部分的功能,并对其探测对流层风场的初步结果进行了分析和讨论。 1 总体结构和技术参数 1064 nm直接探测多普勒测风激光雷达从整体上由激光发射单元、二维扫描单元,回波信号接收单元、信号探测和数据采集单元及控制单元五部分组成,其结构示意图和外观照片分别见图1和图2,主要的技术参数见表1。
激光发射单元、回波信号接收单元、信号探测和数据采集单元放置在光学平台上,保证其光学稳定性。Nd:YAG激光器的中心波长是1064 nm,工作在此波长,可以有较大的激光输出功率,并且气溶胶的后向散射截面比较大。脉冲重复频率为50 Hz,可以节省探测的时间,能捕捉短时间内风速的变化,有利于提高风速探测的准确度。同时,激光器内部注入种子激光可以保证激光器的频率稳定。 二维扫描单元安置在实验房的房顶,接收望远镜的上方。由两个镀有1064 nm 波长全反的介质膜的平面反射镜、水平旋转机构和垂直旋转机构组成的大口径光学潜望式结构。通过软件控制或者手动调节能够全方位扫描,水平方向可以旋转0o至360o,垂直方向可以旋转0o至180o。进行常规探测时采用四波束法,水平方位依次按照0o、90o、180o和270o四个方位探测,即东、南、西和北四个方位,工作仰角为45o。 接收望远镜在二维扫描单元的正下方,有效通光口径为300 mm,如图1所示。主镜镀有1064 nm波长全反的介质膜,反射率高达99%。望远镜接收的大气后向散射回波信号耦合至光纤,由光纤导入到准直镜后成为平行光,经过压制背景光的窄带滤光片后,由20%反射、80%透射的分束片分成两部分。20%的反射信号作为能量探测,由直角反射棱镜分成两束,分别由光子计数探测器接收;80%的透射信号作为信号探测,经过双Fabry-Perot标准具的两个通道后,由于透过率的不一样,得到强度不等的两束光信号,由直角反射棱镜分为两束,由相应的光子计数探测器接收。四个光子计数探测器分别将光信号转换为电信号后,输入光子计数卡内,最后由工控机中的主程序对采集的数据进行储存和处理,并实时显示测量的信号强度廓线、风速和风向。
第28卷第5期 2004年9月大气科学Chinese Journal of Atmospheric Sciences Vol 128 No 15Sept.2004 2003205208收到,2003210214收到修改稿 3中国科学院百人计划和上海市光科技计划共同资助 基于斐索干涉仪的直接探测多普勒测风激光雷达 3刘继桥 陈卫标 胡企铨 (中国科学院上海光学精密机械研究所先进激光技术与应用系统实验室,上海201800) 摘 要 提出结合多光束斐索(Fizeau )干涉仪和CCD 探测器的条纹图像技术,测量地球边界层下的三维风场的直接探测多普勒激光雷达技术。在分析Fizeau 干涉仪的物理特性和光谱特性以及影响测量多普勒频移的因数和改进方法的基础上,提出一套切合实际的直接探测多普勒激光雷达系统参数。并利用该参数进行性能评估分析,模拟不同干涉仪参数对风速精度的影响,得出一个优化的干涉仪物理参数。模拟结果显示,系统可以获得小于1m s -1的水平风速精度。这些分析,为建立实际的激光雷达系统提供设计依据。 关键词:多光束斐索干涉仪;直接探测;多普勒激光雷达;风速 文章编号 100629895(2004)0520762209 中图分类号 P415 文献标识码 A 1 引言 大气风场是各种天气过程、大气化学成分循环和海气相互作用的主要动力,因此大气风场探测在气象、环境等领域中有着极其重要的地位。多普勒激光雷达已经被认为是精确测量三维风场的有效手段[1]。从全球风场的测量来看,直接探测多普勒激光雷达技术相对相干技术来说存在一定的优势[2]。边缘检测[3]和条纹图像[4]是目前直接探测多普勒激光雷达中最主要的两种多普勒频移测量技术。边缘检测常采用高分辨率的法—伯(FP )干涉仪[3]或者分子[5]、原子吸收线的翼作为鉴频器,其测量灵敏度依赖于分子和气溶胶的后向散射比和风速大小;条纹图像技术则是利用干涉条纹的移动直接测量多普勒频移。Mc G ill 等[6]详细分析、比较了两种测量技术,认为两种技术在风速测量精度十分接近。Mc Kay 等[7]从星载系统的角度比较两种技术,认为条纹图像技术更适合于研制星载激光雷达系统。 最初的条纹图像技术采用FP 干涉仪和图像光电探测器(IPD )得以实现,但这种多阳极光电倍增管的量子效率比较低,而且像元数很有限[8]。Irang 等[9]演示了利用CCD 探测器的条纹图像的直接探测激光雷达,系统利用复杂的二元光学技术将环形条纹转换成点阵[10],增加系统复杂性。因此,相关学者把目光转移到寻找更加适合的干涉仪来代替FP ,如M 2Z 干涉仪[11]和Fizeau 干涉仪[12]。Mc Kay [12]首次分析了利用Fizeau 干涉仪进行多普勒频移检测,其分析是较初步的,也没有针对具体系统进行分析。由于Fizeau 干涉形成的是直线条纹,这样可以利用量子效率较高的线阵固体探测
人教版2019版中考模拟语文试题C卷 姓名:________ 班级:________ 成绩:________ 考试须知: 1、请首先按要求在本卷的指定位置填写您的姓名、班级等信息。 2、请仔细阅读各种题目的回答要求,在指定区域内答题,否则不予评分。 一、选择题 1 . 下列句子没有语病的一项是() A.在“大众创业、万众创新”的大潮中,凭着青春的激情和对互联网新技术的敏感,使越来越多年轻人加入到“互联网+”创业的大军中。 B.“一带一路”描绘了一幅和平发展、互利共赢的新思路,它不仅给中国企业带来更多的商机,而且将为世界经济积蓄巨大的力量。 C.为加快我市经济发展的步伐,我们要尽力争取国内外投资,搞好基础设施建设,发展生态节水农业、文化旅游业和服务业。 D.纪录片《舌尖上的中国》不仅引发了人们对“文化认同”和“软实力输出”的思考,而且让人怀念童年时的美味。 2 . 下列说法正确的一项是() A.《最苦与最乐》选自《梁启超文选》,作者梁启超是明代思想家、学者。 B.《邹忌讽齐王纳谏》选自《战国策》,《战国策》是战国时游说之士的策谋和言论的汇编,由东汉的刘向编订为三十三篇。 C.词又称“长短句”,句式长短不一。兴盛于宋代,苏轼和辛弃疾是豪放派的代表人物,而李清照是婉约派的代表人物。 D.《岳阳楼记》实际上是一篇借物言志的文章,寄寓了作者与民同乐的思想。 3 . 下列加点词语注音完全正确的一项() A.畸形(qí)诘责(jié)文绉绉(zhōu)眼翳(yì) B.胡髭(zī)黝黑(yǒu)一绺绺(liǔ )颔首(hàn) C.直戳(chuō)解剖(pāo)诱惑(yòu)摹画(mó)
自制直接探测多普勒测风激光雷达的总体结构和技术参数介绍引言风是研究大气动力学和气候变化的一个重要参量,利用风的数据,可以获得大气的变化,并预见其改变,促进人类对能量、水、气溶胶、化学和其它空气物质圈的了解,提高气象分析和预测全球气候变化的能力。目前的风场数据主要来源于无线电探空测风仪、地面站、海洋浮标、观测船、飞行器以及卫星,它们在覆盖范围和观测频率上都存在很大限制。对全球进行直接三维风场测量已经提到日程上来,世界气象组织提出了全球范围的高分辨率大气风场数据的迫切需要,迄今为止,多普勒测风激光雷达是唯一能够获得直接三维风场廓线的工具,具有提供全球所需数据的发展潜力[1]。 激光雷达是探测大气的有力工具,随着激光技术、光学机械加工技术、信号探测、数据采集以及控制技术的发展,激光雷达技术的发展也日新月异。多普勒测风激光雷达具有实用性、高分辨率和三维观测等优点,是其它探测手段难以比拟的[2,3,4]。 新研制的1064 nm直接探测多普勒测风激光雷达,利用双边缘技术对对流层三维风场进行探测[5]。本文介绍了该激光雷达的总体结构及其各部分的功能,并对其探测对流层风场的初步结果进行了分析和讨论。 1 总体结构和技术参数1064 nm直接探测多普勒测风激光雷达从整体上由激光发射单元、二维扫描单元,回波信号接收单元、信号探测和数据采集单元及控制单元五部分组成,其结构示意图和外观照片分别见图1和图2,主要的技术参数见表1。 激光发射单元、回波信号接收单元、信号探测和数据采集单元放置在光学平台上,保证其光学稳定性。Nd:YAG激光器的中心波长是1064 nm,工作在此波长,可以有较大的激光输出功率,并且气溶胶的后向散射截面比较大。脉冲重复频率为50 Hz,可以节省探测的时间,能捕捉短时间内风速的变化,有利于提高风速探测的准确度。同时,激光器内部注入种子激光可以保证激光器的频率稳定。 二维扫描单元安置在实验房的房顶,接收望远镜的上方。由两个镀有1064 nm波长全反的
第37卷第1期 红外与激光工程 2008年2月Vol.37No.1 InfraredandLaserEngineering Feb.2008 收稿日期:2007-04-25; 修订日期:2007-06-10 基金项目:国家863计划资助项目(2006AA12Z126) 作者简介:陈卫标(1969-),男,上海人,研究员,博士生导师,博士,主要从事激光、光电子、激光雷达及其在海洋、大气、空间的应用等 研究。Email:wbchen@mail.shcnc.ac.cn 多普勒激光雷达及其单纵模全固态激光器 陈卫标,周军,刘继桥,朱小磊 (中国科学院上海光学精密机械研究所,上海201800) 摘 要:设计一套测量大气风场的多普勒激光雷达系统,以种子注入的单频、高重频、脉冲紫外全 固态激光器为发射光源,采用两种直接探测技术获取高低空大气风场。基于费索干涉仪(Fizeau)的条纹图像技术获取边界层和低对流层大气风场,基于双法布里珀罗干涉仪(DFP)的双边缘检测技术获取高对流层和低平流层风场。研制的单频全固态激光器输出100Hz、30mJ的单纵模脉冲激光,输出线宽达到傅里叶转换极限。报道了测量原理和数值模拟结果、实验样机和系统技术参数。系统将用于移动式高低空大气风场测量。 关键词:直接探测多普勒激光雷达;条纹图像; 双边缘检测; 种子注入 中图分类号:TN958.98 文献标识码:A 文章编号:1007-2276(2008)01-0057-04 Dopplerlidarandit′sallsolid!statesinglefrequencylaser CHENWei!biao,ZHOUJun,LIUJi!qiao,ZHUXiao!lei (ShanghaiInstituteofOpticsandFineMechanics,ChineseAcademyofSciences,Shanghai201800,China) Abstract:ADopplerlidarwithaninjection!seeding,singlefrequency,highrepetitionrate,pulsedultravioletlaserandtwodirect!detectionmethodsareproposedforwindmeasurement.Windoflowtroposphereandboundarylayerisobtainedbyfringe!imagetechniquebasedonaFizeauinterferometer,andwindofhighertroposphereandlowstratosphereisachievedbydouble!edgetechniquebasedondoubleFPinterferometers.Laseroutputs30mJat100HzwithalinewidthofFourier!transfer!limitation.Principleandnumericalsimulation,prototypeandparametersofsystemwillbeintroduced.Thesystemisappliedtothewindmeasurementofhighandlowaltitude. Keywords:Direct!detectionDopplerlidar;Fringe!image;Doubleedge!detection;Injection!seeding 0引言 多普勒激光雷达能够获得高空间和时间分辨率的大气风场,已被认为是精确测量全球三维风场的唯一有效手段[1]。多普勒激光雷达主要包括相干探测和直接探测技术。虽然相干探测激光雷达灵敏度和测量精度较高,但是相干探测只能利用大气中的气溶胶散射信号,因此测量范围和能力有限。直接探测多普勒激光雷达技术相对相干技术来说存在一定的优势[2]。其最主要的两种多普勒频移测量技术是边缘检测[3-5]和条纹图像[6]。 边缘检测常采用高分辨率的法-珀(FP)干涉仪[3-5]或者分子、原子[7]吸收线的翼作为鉴频器,其测量灵敏度依赖于分子和气溶胶的后向散射比和风速大小;条纹图像技术则是利用干涉条纹的移动直接测量多普勒频移,常用FP干涉仪,M!Z干涉仪[8]和Fizeau干涉仪[9]等。McGill等详细分析、 比较了直接探测的两种测量技术,认为它们在风速测量精度上十分接近[10]。 文中根据直接探测多普勒激光雷达的发展趋势和技术特点,综合利用上述两种技术,分别获取高低空大气风场信息。
光电雷达技术 课程论文 题目激光雷达技术的应用现状及应用前景 专业光学工程 姓名白学武 学号2220140227 学院光电学院 2015年2月28日
摘要:激光雷达无论在军用领域还是民用领域日益得到广泛的应用。介绍了激光雷达的工作原理、工作特点及分类,介绍了它们的研究进展和发展现状,以及应用现状和发展前景。 引言 激光雷达是工作在光频波段的雷达。与微波雷达的T作原理相似,它利用光频波段的电磁波先向目标发射探测信号,然后将其接收到的同波信号与发射信号相比较,从而获得目标的位置(距离、方位和高度)、运动状态(速度、姿态)等信息,实现对飞机、导弹等目标的探测、跟踪和识别。 激光雷达可以按照不同的方法分类。如按照发射波形和数据处理方式,可分为脉冲激光雷达、连续波激光雷达、脉冲压缩激光雷达、动目标显示激光雷达、脉冲多普勒激光雷达和成像激光雷达等:根据安装平台划分,可分为地面激光雷达、机载激光雷达、舰载激光雷达和航天激光雷达;根据完成任务的不同,可分为火控激光雷达、靶场测量激光雷达、导弹制导激光雷达、障碍物回避激光雷达以及飞机着舰引导激光雷达等。 在具体应用时,激光雷达既可单独使用,也能够同微波雷达,可见光电视、红外电视或微光电视等成像设备组合使用,使得系统既能搜索到远距离目标,又能实现对目标的精密跟踪,是目前较为先进的战术应用方式。 一、激光雷达技术发展状况 1.1关键技术分析 1.1.1空间扫描技术 激光雷达的空间扫描方法可分为非扫描体制和扫描体制,其中扫描体制可以选择机械扫描、电学扫描和二元光学扫描等方式。非扫描成像体制采用多元探测器,作用距离较远,探测体制上同扫描成像的单元探测有所不同,能够减小设备的体积、重量,但在我国多元传感器,尤其是面阵探测器很难获得,因此国内激光雷达多采用扫描工作体制。 机械扫描能够进行大视场扫描,也可以达到很高的扫描速率,不同的机械结构能够获得不同的扫描图样,是目前应用较多的一种扫描方式。声光扫描器采用声光晶体对入射光的偏转实现扫描,扫描速度可以很高,扫描偏转精度能达到微弧度量级。但声光扫描器的扫描角度很小,光束质量较差,耗电量大,声光晶体
激光雷达替代多普勒雷达功能技术参数要求说明书 物联网产业研究院 防入侵事业部 2011/04/28
目录 目录 (1) 前言 (2) 一、项目概述 (3) 1.1项目名称 (3) 1.2项目来源 (3) 1.3项目背景及用户需求 (3) 1.4项目目标 (3) 二、道口防入侵系统功能 (4) 2.1系统原理实现 (4) 2.2系统功能设计 (4) 2.3性能设计 (5) 2.4技术架构 (6) 三、雷达定位子系统性能参数 (7) 3.1激光雷达技术参数 (7) 3.2激光雷达拟定验收环境 (7) 3.3激光雷达拟用验收用例 (8)
前言 道口防入侵解决方案作为周界防入侵新的子系统和业务,具有创新性、独特性和很高的技术要求。本文主要对项目的总体解决方案进行描述,对使用激光雷达定位子系统替代多普勒雷达定位子系统的技术参数需求进行明确,并设置相关测试验收用例
一、项目概述 1.1项目名称 “浦东国际机场道口防入侵” 1.2项目来源 参看《浦东国际机场道口防入侵解决方案技术解析》 1.3项目背景及用户需求 一般机场的周界都有几十公里长,几十个出入口。由于机场和外部业务往来较多,会有大量的人车出入,所以机场出入口是除围界外唯一可能的可疑人员闯入的通道。由于保安人员在车辆安检过程中注意力分散,可能会有恶意人员从伴随车辆一起进入机场;另外,在夜间,保安人员值班疲惫,也可能会有可疑人员从车辆通道混入机场。在出入口实现自动探测非授权人员进入机场,将大大降低潜在隐患。 1.4项目目标 选择一个出入口的行车区域,进行系统开发、验证、演示,实现授权人员和非授权人员识别、分类、轨迹跟踪、球机联动跟踪。
2018.5-2019.4 时事政治复习材料 2019 年 1 月-4 月时政 1. 2019 年 1 月 2 日,《告台湾同胞书》发表40 周年纪念会在北京人民大会堂 隆重举行。 2.教育部办公厅近日印发《关于严禁有害 APP进入中小学校园的通知》,要求各地采取有 效措施,坚决防止有害 APP进入中小学校园。 3.2019 年 1 月 3 日 10 时 26 分,嫦娥四号探测器成功着陆在月球背面预选着陆区, 并通过“鹊桥”中继星传回了世界第一张近距离拍摄的月背影像图,揭开了古老月背 的神秘面纱。 4.《求是》杂志发表习近平的文章《推动我国生态文明建设迈上新台阶》。文章强调, 新时代推进生态文明建设,必须坚持好以下原则:一是坚持人与 自然和谐共生 ;二是绿水青山就是金山银山;三是良好生态环境是最普惠的 民生福祉 ;四是山水林田湖草是生命共同体;五是用最严格制度最严密法治 保护生态环境 ;六是共谋全球生态文明建设。 5.2019 年 1 月 30 日 20 时 39 分,嫦娥四号着陆器接受光照自主唤醒。此前,玉兔 二号巡视器于 1 月 29 日 20 时许完成自主唤醒。 6.北京时间 1 月 31 日,美国科学促进会宣布,中国科学技术大学潘建伟教授领衔的“墨子 号”量子科学实验卫星科研团队被授予 2018 年度克利夫兰奖,以表彰该团队量子通信实验研究做出的贡献。 7.刘永坦、钱七虎获得 2018 年度国家最高科学技术奖。 8.2018 年全年我国国内生产总值( GDP)为 900309 亿元,经济总量首次站上 90 万亿元的历史新台阶,同比增长 6.6%,稳居世界第二位。 9.按现行国家农村贫困标准测算, 2018 年末,全国农村贫困人口 1660 万人,比上年末减 少 1386 万人;贫困发生率 1.7%,比上年下降 1.4 个百分点。 10.近日,《粤港澳大湾区发展规划纲要》正式公开发布,建设粤港澳大湾区是习近平 总书记亲自谋划、亲自部署、亲自推动的国家战略,是新时代推动形成全面开放新 格局的新举措,也是推动“一国两制”事业发展的新实 践 11.新春伊始,中共中央、国务院公开发布《关于坚持农业农村优先发展,做