Winter wheat area estimation from MODIS-EVI time series data using the Crop Proportion Phenology Index
Yaozhong Pan a ,Le Li a ,Jinshui Zhang a ,?,Shunlin Liang b ,Xiufang Zhu b ,Damien Sulla-Menashe c
a College of Resources Science &Technology,State Key Laboratory of Earth Processes and Resource Ecology,Beijing Normal University,100875,Beijing,China
b Department of Geography,University of Maryland,College Park,Maryland,MD20742,USA
c
Department of Geography and Environment,Boston University,675Commonwealth Avenue,Boston,MA 02215,USA
a b s t r a c t
a r t i c l e i n f o Article history:
Received 23November 2010
Received in revised form 4October 2011Accepted 8October 2011
Available online 26January 2012Keywords:
Winter wheat area MODIS
Time series
Crop Proportion Phenology Index (CPPI)Landsat TM ALOS/AVNIR
The global distribution of croplands is of critical interest to a wide group of end-users.Different crops have their own representative phenological stages during their growing seasons,which differ considerably from other natural vegetation types.During the last decade,the Moderate Resolution Imaging Spectroradiometer (MODIS)has become a key tool for vegetation monitoring because of its high temporal resolution,extensive scope,and rapid availability of various products.However,mixed pixels caused by the moderate spatial res-olution produce signi ?cant errors in crop area estimation.Here we propose a Crop Proportion Phenology Index (CPPI)to express the quantitative relationship between the MODIS vegetation index (VI)time series and winter wheat crop area.The utility of this index was tested in two experimental areas in China:one around Tongzhou and the other around Shuyang,as representative districts around a metropolis and a rural area,respectively.The CPPI performed well in these two regions,with the root mean square error (RMSE)in fractional crop area predictions ranging roughly from 15%in the individual pixels to 5%above 6.25km 2.The training samples containing mixtures of crop types mitigated the challenges of pure end-member selection in a spectral mixture analysis.A small number of training samples are suf ?cient to generate the CPPI,which is adaptable to other crop types and larger regions.Estimating the CPPI parameters across larger spatial scales helped improve the stability of the model.
?2011Elsevier Inc.All rights reserved.
1.Introduction
Remote sensing has proven to be an effective tool to estimate the regional distribution of individual crop types for a wide range of end-users including government agencies,farmers,and researchers (Allen et al.,2002;Lobell &Asner,2004).Multi-temporal high-spatial reso-lution remote sensing data are now widely used to estimate crop area and distributions throughout the growing season (de Colstoun et al.,2003;Langley et al.,2001;Van Niel &McVicar,2004).However,in complex agricultural areas with a diversity of crop types,different crops may have similar spectra during the growing season.A signi ?-cant advantage of using multi-temporal data is that the proportions of different crop types in these confusing conditions can be discrim-inated using the spectral differences at different points in the growing season (Carrao et al.,2008;Liu et al.,2003;Vieira et al.,2000).Acquiring such frequent cloud-free imagery is a serious limitation in estimating crop area over large areas (Carrao et al.,2008;Chen et al.,2004;Potgieter et al.,2010).
The frequent acquisitions of remote sensing data from the Moderate Resolution Imaging Spectroradiometer (MODIS)aboard the Aqua and Terra satellite platforms allow for the seasonal development of crops to be monitored ef ?ciently.The rapid availability of such data at the global scale is also a prerequisite for accurately measuring crop area over large regions (Geerken,2009;Townshend &Justice,2002)and allows for operational cropland estimation and mapping (Lobell &Asner,2004;Wardlow &Egbert,2008;Xiao et al.,2005).Many clas-si ?cation methods discern different crop types by identifying differ-ences in their spectra during the crops'growing seasons (Carrao et al.,2008;Friedl et al.,2002;Potgieter et al.,2010;Wardlow &Eg-bert,2008).These approaches intelligently used multi-temporal information but struggled to characterize the mixture of different land covers within a pixel,which introduces errors in estimating crop area and mapping crop types.
Considerable efforts have been made to extract sub-pixel informa-tion of fractional crop types by examining the temporal separation of crop phenologies within the MODIS time series (Busetto et al.,2008;Lobell &Asner,2004;Ozdogan,2010).Two major challenges remain to spectrally unmix crop types from a MODIS time series:(1)selecting pure end-members in 250-m MODIS data even with the support of ?ner spatial resolution data;(2)identifying the correct spectral features that characterize the crops'growing seasons.This is relevant to predict
Remote Sensing of Environment 119(2012)232–242
?Corresponding author.Tel.:+861058802932.E-mail address:zhangjs@https://www.doczj.com/doc/a06079715.html, (J.
Zhang).
0034-4257/$–see front matter ?2011Elsevier Inc.All rights reserved.doi:
10.1016/j.rse.2011.10.011
Contents lists available at SciVerse ScienceDirect
Remote Sensing of Environment
j o u r n a l h om e p a g e :ww w.e l s e v i e r.c o m /l o c a t e /r s e
the cropland area in China because the ?elds are small,and mixtures of different crops are common.It is expected that an approach that uses the variance across a given crop's phenological stages and provides credible sub-pixel results will be most effective.The scale and spatial characteristics of landscapes in ?uence area estimates from remote sensing data (Lobell &Asner,2004;Moody and Woodcock,1995).This has important implications for the integration of high spatial reso-lution imagery with coarser resolution data from MODIS (Ozdogan &Woodcock,2006).
Here we propose a new index,the Crop Proportion Phenology Index (CPPI),to express the quantitative relationship between the MODIS vegetation index (VI)time series and actual crop acreage.The index is oriented to the sub-pixel scale and was tested in two ex-perimental areas in China around Tongzhou (TZ)and Shuyang (SY)as representative districts around a metropolis and a rural area,respec-tively.The main objectives of this work are:(1)to develop the CPPI to estimate the fraction of individual crops using the MODIS-EVI time series data;(2)to examine the in ?uence of different spatial resolu-tions on the performance of the index across validated study sites;(3)to evaluate the potential of expanding the CPPI to large-scale crop area estimation.2.Study area and materials 2.1.Site descriptions
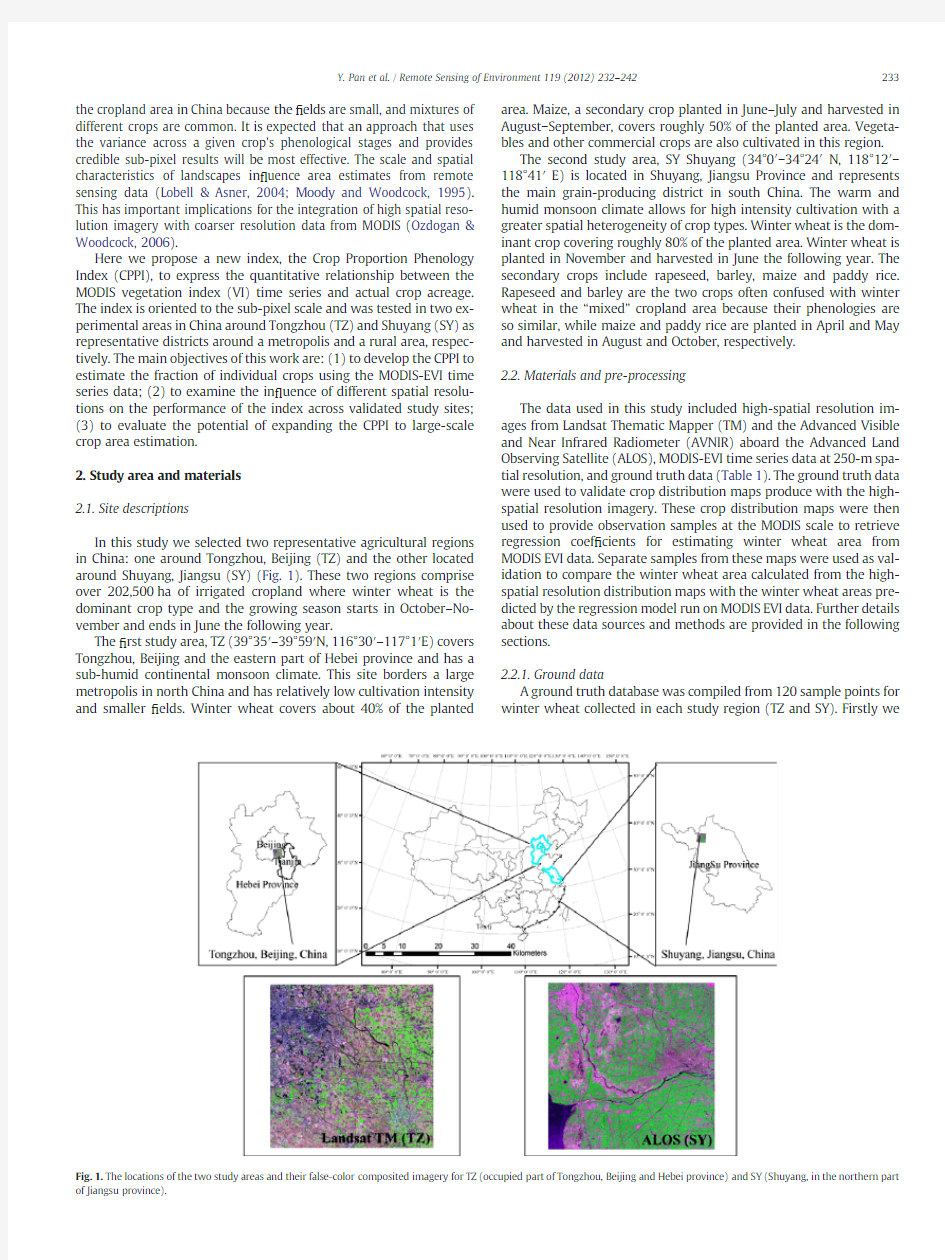
In this study we selected two representative agricultural regions in China:one around Tongzhou,Beijing (TZ)and the other located around Shuyang,Jiangsu (SY)(Fig.1).These two regions comprise over 202,500ha of irrigated cropland where winter wheat is the dominant crop type and the growing season starts in October –No-vember and ends in June the following year.
The ?rst study area,TZ (39°35′–39°59′N,116°30′–117°1′E)covers Tongzhou,Beijing and the eastern part of Hebei province and has a sub-humid continental monsoon climate.This site borders a large metropolis in north China and has relatively low cultivation intensity and smaller ?elds.Winter wheat covers about 40%of the planted
area.Maize,a secondary crop planted in June –July and harvested in August –September,covers roughly 50%of the planted area.Vegeta-bles and other commercial crops are also cultivated in this region.
The second study area,SY Shuyang (34°0′–34°24′N,118°12′–118°41′E)is located in Shuyang,Jiangsu Province and represents the main grain-producing district in south China.The warm and humid monsoon climate allows for high intensity cultivation with a greater spatial heterogeneity of crop types.Winter wheat is the dom-inant crop covering roughly 80%of the planted area.Winter wheat is planted in November and harvested in June the following year.The secondary crops include rapeseed,barley,maize and paddy rice.Rapeseed and barley are the two crops often confused with winter wheat in the “mixed ”cropland area because their phenologies are so similar,while maize and paddy rice are planted in April and May and harvested in August and October,respectively.2.2.Materials and pre-processing
The data used in this study included high-spatial resolution im-ages from Landsat Thematic Mapper (TM)and the Advanced Visible and Near Infrared Radiometer (AVNIR)aboard the Advanced Land Observing Satellite (ALOS),MODIS-EVI time series data at 250-m spa-tial resolution,and ground truth data (Table 1).The ground truth data were used to validate crop distribution maps produce with the high-spatial resolution imagery.These crop distribution maps were then used to provide observation samples at the MODIS scale to retrieve regression coef ?cients for estimating winter wheat area from MODIS EVI data.Separate samples from these maps were used as val-idation to compare the winter wheat area calculated from the high-spatial resolution distribution maps with the winter wheat areas pre-dicted by the regression model run on MODIS EVI data.Further details about these data sources and methods are provided in the following sections.
2.2.1.Ground data
A ground truth database was compiled from 120sample points for winter wheat collected in each study region (TZ and SY).Firstly
we
Fig.1.The locations of the two study areas and their false-color composited imagery for TZ (occupied part of Tongzhou,Beijing and Hebei province)and SY (Shuyang,in the northern part of Jiangsu province).
233
Y.Pan et al./Remote Sensing of Environment 119(2012)232–242
divided each study area into patches delineated by the?eld bound-aries.The dimensions of each patch ranged from300m×300m to 500m×500m.Fig.2(a)shows an example of such a patch.Next we classi?ed the high-spatial resolution images into the following?ve classes using a maximum likelihood classi?cation:winter wheat, other crops and other vegetables,natural vegetation(woodland and grassland),unvegetated(urban area and barren),and water.The area of winter wheat for each patch was estimated from the classi?ca-tion maps described in the previous section.The120ground truth plots were selected as a random strati?ed sample from the patches according to the estimated winter wheat areas as strata.
Field surveys of the120plots were conducted in November2006 for TZ and in May2009for SY.The cover type labels for the samples include mixtures of winter wheat,other crops and other vegetables, natural vegetation(woodland and grassland),and unvegetated (urban area and barren).Fig.2shows an example of the ground sur-vey data in one of the plots.We calculated the true winter wheat area for the total of240samples combined from the two study sites.These areas were used to validate crop distribution maps from the high-spatial resolution images,as discussed in Section2.2.2,below.
2.2.2.Crop distribution maps produced from high-spatial resolution data
Remote sensing images with a spatial resolution between10m and30m allow for the identi?cation of single agricultural?elds in most landscapes(Carfagna&Gallego,2005).Here we primarily used imagery from the Landsat and AVNIR sensors because they provided suf?cient scenes during the winter wheat growing season with low levels of cloud cover,high radiometric quality and geo-referencing,and low acquisition costs.For the TZ area,Landsat TM images with30-m spatial resolution for the dates December3,2006 and April26,2007were collected for the2006–2007growing season. For the SY area,data from the Advanced Visible and Near Infrared Ra-diometer(AVNIR)aboard the Advanced Land Observing Satellite (ALOS)with a nominal10-m spatial resolution for the date April6, 2009were acquired for the2008–2009growing season.These images were re-projected into Albers Equal Area projection for the winter wheat area mapping.
A novel hybrid hard and soft classi?cation method(HSCM;Hu et al.,2011)was used to classify the high-spatial resolution images. The entire study area was divided into three parts,core area (CA),boundary area(BA),and rest area(RA),by an automatic threshold segmentation algorithm.CA refers to the target agricul-ture cover type,RA refers to the non-target cover types,and BA re-fers to the transition area between CA and RA.CA and RA are dominated by pure pixels,whereas BA is dominated by mixed pixels. The hard classi?cation method(HCM)is used to classify CA and RA,and the soft classi?cation method(SCM)is used to classify BA.Outputs from the HCM and the SCM are combined to produce the?nal classi-?cation results.This method has been shown to provide reasonable re-sults for fragmented agricultural areas such as our study area(Hu et al., 2011).
We generated winter wheat distribution maps(WWDMs)from the Landsat TM images of TZ and the ALOS/AVNIR image of SY. Using the true winter wheat area of the240samples collected in the?eld(Section2.2.1),we validated the WWDM.The validated ac-curacies were90.5%and93.8%for the TZ and SY maps,respectively. The accuracies of these maps satis?ed our requirement for retrieving regression coef?cients for the CPPI and justify the use of the HSCM for this region.
2.2.
3.MODIS data and pre-processing
The MODIS EVI time series used in this study was derived from16-day MODIS EVI re?ectance data at250m from the MOD13Q1product spanning from September30,2006to June26,2007for TZ,and from September30,2008to June26,2009for SY.The MOD13Q1dataset
Table1
List of data used for estimating winter wheat areas with the CPPI. Data set TZ SY
MODIS16-day MODIS-EVI and
composite day of the
year from MOD13Q1
data at250m(September
30,2006–June26,2007)16-day MODIS-EVI and composite day of the year from MOD13Q1
data at250m(September 30,2008–June26,2009)
High
resolution data Landsat TM(December3,2006)
Landsat TM(April26,2007)
ALOS/AVNIR(April6,2009)
Ground data120survey samples120survey
samples
Fig.2.An example of a sample patch from the?eld survey(a.the crop?elds displayed on top of the aerial-photo;b.the crop?elds displayed on top of the Landsat TM classi?cation results;c.pink borders for winter wheat areas;d.blue borders for vegetable areas;e.yellow borders for maize areas;f.green borders for natural vegetation areas).
234Y.Pan et al./Remote Sensing of Environment119(2012)232–242
contains 12layers,including NDVI,EVI,red re ?ectance,blue re ?ec-tance,NIR re ?ectance,MIR re ?ectance,VI quality,view zenith,sun ze-nith,relative azimuth angle,QA,and 16days composite day of year.Previous studies have shown that EVI performs better than NDVI in estimating crop area (Houborg et al.,2007;Huete et al.,2002;Justice et al.,2002;Waring et al.,2006).In addition,EVI is less susceptible than NDVI to biases resulting from cloud and haze contamination (Miura et al.,2001;Waring et al.,2006).The MODIS data were mosaicked and re-projected from Sinusoidal to Albers Equal Area pro-jection for direct comparison to the WWDMs.A Savitzky –Golay ?lter
was applied to the MODIS-EVI time series to minimize the effects of cloud cover and other sources of noise (Chen et al.,2004).3.Methodology
3.1.Qualitative analysis of MODIS-EVI time series curve features Each crop has unique phenological features according to the crop species but also in ?uenced by climate,soil condition,water supply,cultivation habits,and other environmental factors (Chmielewski
E V I (W i n t e r w h e a t )
a
b
E V I (O t h e r c r o p s a n d v e g e t a b l e )
d
c
E V I (N a t u r a l v e g e t a t i o n )
f
e
E V I (U n v e g e t a t e d )
h
g
0.7
0.60.50.40.30.20.1
0.0
Oct Nov Dec Jan Feb Mar Apr May Jun
Date
0.70.60.50.40.30.20.1
0.0
Oct Nov Dec Jan Feb Mar Apr May Jun
Date 0.70.60.50.40.30.20.1
0.0
0.3
0.20.10.0
0.3
0.2
0.1
0.0
Oct Nov Dec Jan Feb Mar Apr May Jun
Date Oct Nov Dec Jan Feb Mar Apr May Jun Date 0.70.60.50.40.30.20.1
0.0
Oct Nov Dec Jan Feb Mar Apr May Jun
Date
0.70.60.50.40.30.20.1
0.0
Oct Nov Dec Jan Feb Mar Apr May Jun
Date
0.70.60.50.40.30.20.1
0.0
Oct Nov Dec Jan Feb Mar Apr May Jun
Date
Oct Nov Dec Jan Feb Mar Apr May Jun
Date
Fig.3.EVI time series of different land cover types during the winter wheat growing season (Julian day 273in the ?rst year to 177in the following year)in TZ (a,c,e,g)and in SY (b,d,f,h).Ten random samples (pixels)are shown for each land cover type.
235
Y.Pan et al./Remote Sensing of Environment 119(2012)232–242
et al.,2004;Sakamoto et al.,2005).MODIS-EVI time series data has shown promise as an indicator of crop development stages for two reasons (Zhao,2003):(1)inter-annual variation in the MODIS-EVI time series re ?ects crop phenology throughout the growing season and (2)the intensity of EVI within a season can re ?ect the areal coverage of a given crop.The growth cycle of winter wheat starts in October –proceeding through seeding,emergence,tilling,over-wintering,greening,jointing,grouting,and maturing –and ends in June of the following year.Fig.3shows how the MODIS-EVI time series differs between cover types during the winter wheat grow-ing season.
The time series of EVI for winter wheat has two distinctive peaks in northern China,which distinguishes winter wheat from other crops and vegetables in this cycle.During the same period,natural vegetation,including hardwood forest and grass,displays a single peak corresponding to its growing season.The temporal pro ?les of single-cropped areas dominated by maize or other sum-mer crops are similar to winter wheat during the spring months but do not have the ?rst hump speci ?c to the growing cycle of win-ter wheat.
In TZ,four cover types are categorized according to these temporal pro ?les:(1)winter wheat,(2)other commercial crops,(3)natural vegetation (including woodland and grassland),and (4)unvegetated (including urban areas and barren).The life cycle of winter wheat (Fig.3a)spans from about DOY 273(September 30),through the 1st peak around DOY 305(November 1),the 2nd peak around DOY 104(April 14)of the following year,to harvest around DOY 177(June 26).The other commercial crops (Fig.3c)are dominated by seasonal vegetables that are planted in early spring at about DOY 49(February 18),and harvested in early summer around DOY 177(June 26).The time series of the seasonal vegetables class only has one peak during this growing season.There are two major distin-guishing features of the woodland and grassland pro ?les (Fig.3e):(1)the curves fall gradually during the abscission period,which starts on DOY 273(September 30)and continues through the winter wheat growing season and (2)the beginning of the growing season for these natural vegetation classes occurs later than the second hump of the winter wheat.The EVI values of unvegetated land (Fig.3g)remain lower than any of the other classes during the spring and summer months.
The temporal EVI pro ?les of the same four classes for the SY area are shown again in Fig.3b,d,f,h and are generally similar to those in the TZ area.The growing season of winter wheat (Fig.3b)spans from about DOY 289(October 16)through the 1st peak at about DOY 321(November 17),the 2nd peak around DOY 89(March 29)of the following year,through harvest around DOY 145(May 25).Because of the dif ?culties in distinguishing the three types of sum-mer crops (rapeseed,barley,and maize)in this area based solely on phenology,they are combined together in one feature class.The time series pro ?les of these combined summer crops (Fig.3d)rise steeply from DOY 33(February 2)through the only peak at about DOY 113(April 23)until DOY 161(June 10)when the harvest is completed.The woodland,grassland,and unvegetated land pro-?les (Fig.3f and h)show similar characteristics to those of TZ.In particular,the phenology in SY is ahead of that of similar crops in TZ by roughly half a month because of the latitudinal effects of cli-mate on plant growth.
3.2.Developing the Crop Proportion Phenology Index (CPPI)from MODIS EVI time series
The MODIS-EVI time series described in Section 3.1contain four key phases relevant to the growth cycle of winter wheat (Fig.4).(1)Seeding (Point A at Time T 1):the plowed areas are bare soil while areas dominated by most of the other crops and natural vegeta-tion are still fairly green.(2)The ?rst peak (Point B at Time T 2):the EVI values for winter wheat are much higher than those of the other vegetation types,which are mostly dormant.(3)The second peak (Point C at Time T 3):the EVI values for winter wheat are even higher than the second phase,while the EVI values of the other veg-etation types are beginning to increase.(4)Harvest (Point D at Time T 4):the winter wheat is harvested during this period,which is an important distinctive feature for the phenology of winter wheat when compared to other crop types.
Subtle distinctive features captured in the EVI time series are usu-ally used to discriminate between crop types.Analogous to the prin-ciple of atmospheric windows of earth surface re ?ectance (Liang,2004),the peaks at T 2and T 3can be de ?ned as re ?ection peaks,while the seeding point T 1and reaping point T 4are absorption troughs.Following the concept of a Vegetation Index (Liu &
Huete,
Fig.4.Generalized time series curves of pure winter wheat pixels and mixed pixels during the winter wheat growing season.Points A,B,C and D indicate the four key phenological phases of winter wheat.
236Y.Pan et al./Remote Sensing of Environment 119(2012)232–242
1995;Rouse et al.,1973),the Crop Proportion Phenology Index (CPPI)is de ?ned as:
CPPI ?f EVIT2;EVIT3;ΔEVIg ;ΔEVIr eT:
e1T
Where EVI Ti is the EVI value at Ti,ΔEVI g is the EVI difference between T 2and T 1during the growing period,and ΔEVI r is the EVI difference between T 3and T 4during the reaping period:ΔEVIg ?
d EVIg eT?ΔDTs ?ΔEVI
ΔT
?ΔDT s ?EVI T2?EVI T1eT?
ΔDTs
2?DT 1eTe2T
ΔEVIr ?
d EVIr eTdt ?ΔDTs ?ΔEVI
ΔT
?ΔDTs ?EVI T3?EVI T4eT?ΔDTs
DT 4?DT3eT
:
e3T
Where EVI Ti is the EVI value at T i ,D Ti is the real day at Ti,and ΔD Ts is the number of days between the periods of growing and reaping.
The CPPI can be estimated by either linear or non-linear models.If Eq.(1)is manipulated as a simple linear relationship,the CPPI can be presented as:
CPPI ?A ?EVIT2tB ?EVIT3tC ?ΔEVIg tD ?ΔEVIr tE :
e4T
Where A ,B ,C ,and D are coef ?cients,and E is the constant residual term.
3.3.Application of the CPPI to estimate winter wheat area
There are three major steps to produce the CPPI.First the four characteristic variables of the CPPI are calculated:1st peak value EVI T2,the 2nd peak value EVI T3,the growing slope ΔEVI g ,and the reaping slope ΔEVI r .Second,training samples are used to calculate the regression coef ?cients A ,B ,C ,D and E by inverting a linear regres-sion model.Finally,the area of winter wheat crops can be estimated for each pixel of study area using the calculated CPPI (Eq.4)by computing the coef ?cients in a forward application of the regression model.
We investigated how the spatial structure and ?eld size of the different sites in ?uence the error in the area estimates.To do this we estimated the CPPI from several different spatial scales of imagery
instead of a single scale.We then compare how the errors in the resulting winter wheat area estimates change with the change in scale.Here spatial scale refers to different boxes of MODIS pixels,such as 1×1,2×2,…,10×10pixels.When the scale is bigger than 1,the mean value of EVI aggregated from all pixels within the window will be used to estimate the CPPI variables according to Fig.5and described in more detail below.
3.3.1.Calculation of CPPI variables
The dates of the seeding trough,the 1st peak,the 2nd peak and the reaping trough in the EVI time series curve are the key variables to calculate in the CPPI.Here,we composited the maximum and minimum EVI values to obtain the exact date of peaks and troughs in the curves.
For the TZ area,the EVI Ti and D Ti are calculated as:EVIT 1?min EVI 1;EVI 2eT
EVIT 2?max EVI 3;EVI 4;EVI 5eTEVIT 3?max EVI 13;EVI 14;EVI 15eTEVIT 4
?min EVI 17;EVI 18eT:
8
>><
>>:
e6T
In SY,because there is a clear shift in the growing season of the winter wheat to later dates,the EVI Ti are adjusted as follows:EVIT 1?min EVI 2;EVI 3eT
EVIT 2?max EVI 4;EVI 5;EVI 6eTEVIT 3?max EVI 12;EVI 13;EVI 14eTEVIT 4
?min EVI 16;EVI 17eT:
8
>><
>>:
e7T
where D T1,D T2,D T3,and D T4are the composite day of the year at time T 1,T 2,T 3and T 4.EVI i are the ith EVI in the EVI time series from September 30,2006to June 26,2007—18dates altogether.Then,ΔEVI g and ΔEVI r can be calculated according to Eqs.(2)and (3).3.3.2.Estimation of CPPI regression coef ?cients
The regression model was used twice to estimate the winter wheat area.The inverted form of the model was used to calculate the parameters of CPPI using the ground truth samples from the study area and the forward form of the model was used to estimate winter wheat areas across the whole study area with the CPPI param-eters obtained in the ?rst step.
In the ?rst step,100samples were randomly taken from the winter wheat distribution maps (WWDMs)in each study area.The actual winter wheat area from the WWDMs and the key variables
from
Fig.5.Flow chart of the winter wheat area estimation base on the CPPI .
237
Y.Pan et al./Remote Sensing of Environment 119(2012)232–242
the MODIS-EVI time series,such as EVI T2,EVI T3,ΔEVI g and ΔEVI r ,in each sub-region at the appropriate scale were used to achieve the adaptive parameters:E A B C D 0B B B @1
C C
C A
?M T M h i ?1M T P
1P 2?P n
B B @1
C
C A and M ?EVIT2?1EVIT2?2?EVIT2?n EVIT3?1EVIT3?2?
EVIT3?n ΔEVIg ?1ΔEVIg ?2?ΔEVIg ?n ΔEVIr ?1ΔEVIr ?2?ΔEVIr ?n
B B @1
C C A
e8T
where n is the ID of the samples,EVI T2·n ,EVI T3·n ,ΔEVI g·n ,ΔEVI r·n are the four variables of the nth sub-region in the samples,and P n is the proportion of the winter wheat in the nth sub-region.
3.3.3.Estimation of winter wheat area
The winter wheat area proportion in each sub-region was then de-termined from the parameters by the forward regression model as:
CPPI 1
CPPI 2M CPPI m 0
B B @1
C C A ?M ?A B C
D 0B B @1C C A tEm and M ?EVI T 2?1EVI T 2?2
M
EVI T 2?n EVI T 3?1
EVI T 3?2
M EVI T 3?n
ΔEVI g ?1ΔEVI g ?2M ΔEVI g ?n ΔEVI r ?1
ΔEVI r ?2M
ΔEVI r ?n
B B @1
C C
A e9Twhere A ,
B ,
C ,
D and
E are the parameters de ?ned by the inverse model,especially,Em is the constant array consisted by the constant coef ?cient E with the dimension of m ×1,and EVI T2·m ,EVI T3·m ,ΔEVI g·m ,ΔEVI r·m are the four variables of the mth sub-region in the study area.The parameters of CPPI are estimated at different scales and then applied to estimate the winter wheat area at the MODIS pixel scale.At each scale,the total area of winter wheat was predicted by the MODIS-EVI time series and evaluated from the reference maps by RMSE,bias and R 2statistics.3.4.Evaluation of CPPI results
In this study,?ve criteria (R m ,RMSE,R 2,Mean bias and Var bias )were used to evaluate the performance of the CPPI to estimate winter wheat area.Their de ?nition and usage are shown in Table 2.
While evaluating the relationship between the WWDMs and the key variables of the CPPI,the multiple correlation coef ?cients (R m )
between them were computed.R m re ?ects the CPPI performance at every given spatial scale (Xu,2002):
Rm ?????????????????????????????????????????????????????????????????????????????????????????????????????????????????????????????????????????????????????????????????????1?1?R 2EVIT2àá1?R 2EVIT3?EVIT2àá1?R 2ΔEVIg ?EVIT2EVIT3 1?R 2
ΔEVIr ?ΔEVIgEVIT2EVIT3
r e10T
where R EVIT2is the single correlation coef ?cient for the WWDM and variable ΔEVI T2;R EVIT3?EVIT2is the partial correlation coef ?cient between each WWDM and variable ΔEVI T3,under the condition that EVI T2is treated as a constant;R ΔEVIg ?EVIT2EVIT3is the partial correlation coef ?cient between the WWDM and variable ΔEVI g under the condition that ΔEVI T2and ΔEVI T3are treated as constants;R ΔEVIr ?ΔEVIgEVIT2EVIT3is the partial correlation coef ?cient between the WWDM and variable ΔEVI r ,under the condition that ΔEVI T2,ΔEVI T3and ΔEVI g are treated as constants.The multiple correlation coef ?cient R m ranges from 0to 1.The higher the R m ,the closer the relationship between WWDM and the four variables in the CPPI,which means that the CPPI successfully identi ?es the signature of winter wheat in the EVI time series.
The root mean square error (RMSE)and the correlation coef ?cient (R 2
)of the area estimates are used to evaluate the accuracy of estima-tion results from MODIS (Lobell &Asner,2004)at each spatial scale.They are de ?ned as:RMSE s eT?????????????????????????????????X
n i ?1
^a i ?a i eT2=n v u u t
e11T
R 2
?cov a ;^a
àá2
var a eTvar ^a
eT:
e12T
Where s is the spatial scale,n is the number of sub-regions in the
scale s ,^a
i is the estimated area,and a i is the WWDM in the i th sub-region.cov a ;^a
eTis the covariance between the WWDM and estimated wheat area,and var(a )and var ^a
eTare the variances of WWDM and estimates.
The mean and variance of the bias of the area estimates are also provided to explain how the accuracy of the area estimates change with spatial scale:Meanbias s eT?
X n i ?1
^a i ?a i eT=n e13T
Varbias s eT?
X
n i ?1
^a i ?a i eT? ^a ?a eT 2=n e14T
where all the variables are the same as in Eq.(12),and ^a
?a eTis the mean of the bias of the area estimate.
4.Accuracy of winter wheat areas derived from the Crop Proportion Phenology Index
Winter wheat area estimates using the CPPI at different spatial scales with 100samples indicated that the CPPI generally succeeded in reproducing the actual spatial distribution of winter wheat.Fig.6shows the winter wheat maps for both regions at different spatial scales.
The winter wheat area results from MODIS using the CPPI were compared with those from the WWDMs for the TZ and SY areas using RMSE,R 2,and the mean and variation of the bias (Fig.7).The results are generally consistent across the two regions.RMSE decreases from roughly 15%–20%when evaluated at the scale of in-dividual pixels,to about 5%–10%at a scale of 3×3MODIS pixels.While the scale decreases to 10×10MODIS pixels (6.25km 2),the RMSE remains close to 5%.In addition,R 2between the estimation
Table 2
The de ?nition and usage of each evaluation criteria.Evaluation criteria De ?nition
Usage
R m
Multiple correlation coef ?cients between the WWMDs and key characteristic variables of the CPPI Evaluating the rationality and stability of the CPPI
RMSE
Root mean square error between the results from the MODIS time series and “true values ”from the high resolution data
Evaluating the accuracy of the estimation results from the MODIS time series by the CPPI R 2
Correlation coef ?cient for the area from the validation samples and that estimated from the CPPI Evaluating the accuracy of
estimation results from MODIS time series by the CPPI
Mean bias
Mean of the bias of the area
estimates in different sub-regions Comparing and evaluating the estimations of crop area by CPPI at different scales
Var bias
Variance of the bias of the area estimates in different sub-regions
Comparing and evaluating the estimations of crop area by CPPI at different scales
238Y.Pan et al./Remote Sensing of Environment 119(2012)232–242
results and the “true value ”increases as the scale decreases in a similar logarithmic function from roughly 0.5–0.6at the scale of in-dividual pixels to 0.8–0.9at a scale above 4×4MODIS pixels.While the spatial scale varies from individual pixels to 10×10pixels,the biases of the area estimates in the sub-regions were similar on average and represented roughly 5%to 17%of the total variance in
c
b a f
e d Legend 1.0
Fraction of winter wheat
0Fig.6.The distribution maps of winter wheat for TZ (top)and SY (bottom).The high-spatial resolution WWDM results using Landsat TM and ALOS/AVNIR (a,d).The high-spatial resolution results aggregated to 250-m resolution (b,e).The winter wheat areas produced by the CPPI applied to MODIS EVI data (c,
f).
https://www.doczj.com/doc/a06079715.html,parison of winter wheat area estimates by CPPI applied to MODIS EVI data and WWMDs from high-spatial resolution results at different scales in TZ and SY:(a)RMSE,(b)R 2,(c)Mean bias and (d)Var bias .
239
Y.Pan et al./Remote Sensing of Environment 119(2012)232–242
the actual winter wheat area.The stable mean of the biases indicates that the CPPI is consistent and robust across different agricultural areas.The variance of the bias shows the sensitivity of area estimates to spatial aggregation and landscape heterogeneity.Some error at ?ner scales may be attributed to the point spread function of the MODIS observations,where the area of the observation can be signif-icantly larger than the actual ground area of the gridded cell(Tan et al.,2006).
Overall the CPPI performs better for the SY area than the TZ area.It may be because the classi?cation results from ALOS/AVNIR have a higher accuracy in evaluating the actual crop area than those from Landsat TM.However,the assessment of CPPI performance depends on two factors:the?rst is that a higher quality training sample set will improve the regression model?t to the data and produce a more accurate CPPI and the second is that a WWDM with higher accuracy can provide better validation samples and therefore a more realistic evaluation of the CPPI.
5.Discussion
5.1.The impact of CPPI variables modeling on model accuracy
Fig.8presents the linear correlation relationship between the each WWDM and the four key variables in the CPPI.Different scales are used to observe the performance of the four variables to evaluate the scaling impact on the CPPI.
The CPPI shows closer correlation with the winter wheat areas from the WWDMs than the four variables(EVI T2,EVI T3,ΔEVI g and ΔEVI r)do separately.Because it combines the four key variables for the key phase of the winter wheat,it accurately transfers not only the strong vegetation coverage characteristic in phases T2and T3 but also record the changes in the growing period and the reaping period.Moreover,while the scale decreases,the multiple correlation coef?cients R m2at different scales increase in a similar logarithmic function.
Some of the differences between the TZ and SY study areas in terms of the spatial heterogeneity of their agricultural?elds could be associated with the correlative degree between the four variables and the real planting area.For the TZ area,EVI T2and EVI T3are better correlated with the real value thanΔEVI g andΔEVI r.This may be because TZ is located in the northern part of China;the relative low cultivation intensity but smaller?eld sizes in northern China results in mixing occurring more often between winter wheat and fallowed land.Because there are no other types of crops with the same phenology as the winter wheat in this area,the value of the two peaks can effective-ly represent the proportion of winter wheat area.However,for the SY area,ΔEVI g andΔEVI r are better correlated with the real values than EVI T2and EVI T3,possibly due to the more complex spatial structure in SY.These areas have more mixtures of winter wheat and other crops with slightly offset growing seasons.In this case the magnitude of change in EVI during the growing and reaping periods has a closer correlation to the proportion of the winter wheat area than the peak values.
https://www.doczj.com/doc/a06079715.html,parison of CPPI results across different spatial scales
The multiple correlation coef?cient R m2continuously increases with decreasing spatial scale,but the total number of pixels in the scene decreases as the scale decreases.Therefore,the optimal scale for winter wheat area estimation will guarantee enough observations while allowing for ef?cient?eld surveys.The R2with different numbers of observation samples at different spatial scales are presented in Fig.9. One point to be emphasized here is that in order to minimize the impact of sample diversity and spatial autocorrelation,the test was repeated ten times with random samples,and the mean value was shown in Fig.9.R2stays relatively stable with various sample populations at certain scales.For the TZ area,when the scale is6×6MODIS pixels, R2can reach above0.84,which not only represents an extremely signi?cant correlation but also a slower rising rate of R2.For the SY area,when the scale is larger than3×3MODIS pixel size,R2reached values above0.85,which also represents an extremely signi?cant correlation and a slower rising rate of R2.Therefore,the optimal scale for winter wheat area estimation using the CPPI for TZ is6×6 MODIS pixels and for SY it is3×3MODIS pixels,because of the different spatial resolutions of the reference winter wheat distribution maps and the difference in mean winter wheat patch size between the two sites.
5.3.Advantages and challenges to operational application at larger scales
The results for the two representative sites in China show the potential of the CPPI in crop area estimation across larger regions. This approach provides an easy and effective way to utilize sparse observations at high-spatial resolution while preserving temporal information of coarser sensors.This method utilizes three novel ideas:(1)employing the maximum and minimum compositing algorithm reduces the dif?culty of exactly capturing the key dates, (2)accepting mixed samples as training data to reduce the dif?culty of selecting pure end-members,and(3)computing the difference in the Julian dates between phenological stages to highlight the EVI changes during the growing season.
If this approach is to be expanded operationally,an important consideration is the signi?cant correlation between the quality and quantity of samples and the cost of the?eld survey.It has been proven that fewer?eld survey samples with signi?cant correlations can satisfy the demand of the CPPI model even with a limited number of50or80 samples for each crop type.Many previous studies have observed that the selection of only pure end-members presents an obstacle in mixture modeling,especially on moderate spatial resolution data such as
MODIS Fig.8.Multiple correlation relationship between winter wheat area from the WWDMs and those estimated for TZ(a)and SY(b)using the CPPI applied to MODIS EVI data. 240Y.Pan et al./Remote Sensing of Environment119(2012)232–242
(Dennison &Roberts,2003;Holben &Shimabukuro,1993).Samples representing a mixture of crop types rather than only single crop types proved successful for the CPPI approach and should be utilized by an operational application.
Several obstacles remain before the CPPI approach could be ap-plied to large areas.The de ?nition of the target crop phenology is an essential factor.The same crop with different cultivation habits in different locations or different crop types in the same location produce different regression coef ?cients.When the model is applied to other crop types,the key CPPI variables will be obtained from the following steps:(1)characterizing the growing season of the target crop and the obvious peaks and troughs of the EVI time series data during the growing season;(2)using a phenology monitoring method such as the maximum and minimum compositing algorithm to deter-mine the number of phonological phases in the time series;and (3)cal-culating EVI and ΔEVI from the temporal pro ?le of the target crop's EVI time series.The CPPI for the target crop will be calculated from a revised Eq.(1)in Section 3.2.For example,if the target crop has only one growing peak,the CPPI model will only have three key vari-ables (EVI peak ,ΔEVI g ,and ΔEVI r )according to its phenology.Both the inverted and forward regression models will need to be adjusted accordingly.
Moreover,we note that it is dif ?cult to reliably separate different crops with phenologies similar to the current CPPI model.This is exempli ?ed by the mixture of summer crops in southern China,which has winter wheat,maize,rapeseed,and barley,all with quite similar phenological stages.In these cases,information from other spectral bands might be needed to distinguish them.Therefore,it will be important to employ the relevant spectral information in future developments of the CPPI.In addition,multiple cropping is practiced in some agriculture areas,and the growing seasons of the multiple crops overlap to some degree.In these situations,more ?eld measurements and other auxiliary information will be required for accurate CPPI results.
A second issue is the observation samples used for calculating the regression coef ?cients in the CPPI model.The representativeness,quality,and quantity of samples are very important to the accuracy and ef ?ciency of the CPPI on a large scale since the agricultural areas may have different planting structures,climate conditions,and to-pographies.Therefore,dividing the large study area into different sub-regions based on the climate,planting structure,and other aux-iliary information and selecting different samples in each sub-region will be helpful and needs to be tested in future work.Finally,small errors dependent on spatial resolution can accumulate into consid-erable errors over large regions when estimating cropland areas on a large scale.Therefore,estimating the parameters of the CPPI at the appropriate landscape scale instead of at the scale of individual
pixels may be another criterion for estimating cropland area across a larger region.6.Conclusions
A phenology-based index called the Crop Proportion Phenology Index (CPPI)is proposed to estimate crop area on a sub-pixel scale using the MODIS-EVI time series.This approach links the coarser spa-tial resolution MODIS-EVI time series with ground truth crop infor-mation using a regression model.It performed well in two typical winter wheat dominant regions:one with lower cultivation intensity but smaller ?eld sizes and the other with higher cultivation intensity but larger ?elds.The RMSE between the CPPI and reference data ranges roughly from 15%in individual pixels to 5%in areas above 6.25km 2.The CPPI determined the winter wheat area by utilizing phenological information of green-up and senescence speci ?c to winter wheat to produce fractional crop type areas at the sub-pixel scale.In addition,it has two advantages over traditional spectral mixture ap-proaches in crop area estimation (Busetto et al.,2008;Lobell &Asner,2004;Ozdogan,2010):(1)it accepts mixed samples and requires fewer samples than such methods and (2)it has a ?exible framework with modi ?able characteristic variables and regression coef ?cients.Those two advantages support the expansion of the CPPI to multiple crops and larger regions.
We also show that landscape heterogeneity impacts estimates of crop area by increasing variability in re ?ectance at decreasing scales.These resolution-dependent errors can be reduced by selection of an appropriate scale of analysis relative to the spatial structure of the landscape.Here we used random samples to calculate regression co-ef ?cients that estimate the CPPI at a scale that minimized inter-pixel variance rather than at the scale of a single pixel.This may inspire new strategies for combining high and moderate spatial resolution data.Acknowledgments
This research was supported by National Natural Science Founda-tion Project of China (No.40871194)and National High Technology Research and Development Program of China (No.2006AA120101).We also thank the USGS and NASA for freely distributing the Landsat TM and MODIS data,respectively.References
Allen,R.,Hanuschak,G.,&Craig,M.(2002).History of remote sensing for crop acreage
in USDA's National Agricultural Statistics Service.Available at.https://www.doczj.com/doc/a06079715.html,da.
gov/nass/nassinfo/remotehistory.htm
Fig.9.R 2of winter wheat crop areas from high-spatial resolution data and those estimated from MODIS data in (a)TZ and (b)SY with different sample populations and different spatial scales.
241
Y.Pan et al./Remote Sensing of Environment 119(2012)232–242
Busetto,L.,Meroni,M.,&Colombo,R.(2008).Combining medium and coarse spatial resolution satellite data to improve the estimation of sub-pixel NDVI time series.
Remote Sensing of Environment,112,118–131.
Carfagna,E.,&Gallego,F.J.(2005).Using remote sensing for agricultural statistics.In-ternational Statistical Review,73,389–404.
Carrao,H.,Goncalves,P.,&Caetano,M.(2008).Contribution of multispectral and mul-titemporal information from MODIS images to land cover classi?cation.Remote Sensing of Environment,112,986–997.
Chen,J.,Jonsson,P.,Tamura,M.,Gu,Z.H.,Matsushita,B.,&Eklundh,L.(2004).A simple method for reconstructing a high-quality NDVI time-series data set based on the Savitzky–Golay?lter.Remote Sensing of Environment,91,332–344. Chmielewski,F.M.,Muller,A.,&Bruns,E.(2004).Climate changes and trends in phe-nology of fruit trees and?eld crops in Germany,1961–2000.Agricultural and Forest Meteorology,121,69–78.
de Colstoun,E.,Story,M.H.,Thompson,C.,Commisso,K.,Smith,T.G.,&Irons,J.R.
(2003).National Park vegetation mapping using multitemporal Landsat7data and a decision tree classi?er.Remote Sensing of Environment,85,316–327. Dennison,P.E.,&Roberts,D.A.(2003).Endmember selection for multiple endmember spectral mixture analysis using endmember average RMSE.Remote Sensing of Envi-ronment,87,123–135.
Friedl,M.A.,McIver,D.K.,Hodges,J.,Zhang,X.Y.,Muchoney,D.,Strahler,A.H.,et al.
(2002).Global land cover mapping from MODIS:Algorithms and early results.Re-mote Sensing of Environment,83,287–302.
Geerken,R.A.(2009).An algorithm to classify and monitor seasonal variations in veg-etation phenologies and their inter-annual change.ISPRS Journal of Photogramme-try and Remote Sensing,64,422–431.
Holben,B.N.,&Shimabukuro,Y.(1993).Linear mixing model applied to coarse resolu-tion data from multispectral satellite sensors.International Journal of Remote Sens-ing,14,2231–2240.
Houborg,R.,Soegaard,H.,&Boegh,E.(2007).Combining vegetation index and model inversion methods for the extraction of key vegetation biophysical parameters using Terra and Aqua MODIS re?ectance data.Remote Sensing of Environment, 106,39–58.
Hu,T.G.,Pan,Y.Z.,Zhang,J.S.,Li,L.L.,&Li,L.(2011).Integration of Soft and Hard Clas-si?cations Using Linear Spectral Mixture Model and Support Vector Machines.
Spectroscopy and Spectral Analysis,31(2),508–511.
Huete,A.,Didan,K.,Miura,T.,Rodriguez,E.P.,Gao,X.,&Ferreira,L.G.(2002).Overview of the radiometric and biophysical performance of the MODIS vegetation indices.
Remote Sensing of Environment,83,195–213.
Justice,C.O.,Townshend,J.,Vermote,E.F.,Masuoka,E.,Wolfe,R.E.,Saleous,N.,et al.
(2002).An overview of MODIS Land data processing and product status.Remote Sensing of Environment,83,3–15.
Langley,S.K.,Cheshire,H.M.,&Humes,K.S.(2001).A comparison of single date and multitemporal satellite image classi?cations in a semi-arid grassland.Journal of Arid Environments,49,401–411.
Liang,S.(2004).Quantitative remote sending of land surfaces.:John Wiley.
Liu,H.O.,&Huete,A.R.(1995).A feedback based modi?cation of the NDVI to minimize canopy background and atmosphere noise.IEEE Transactions on Geoscience and Remote Sensing,33,457–465.
Liu,J.Y.,Zhuang,D.F.,Luo,D.,&Xiao,X.(2003).Land-cover classi?cation of China:In-tegrated analysis of AVHRR imagery and geophysical data.International Journal of Remote Sensing,24,2485–2500.Lobell,D.B.,&Asner,G.P.(2004).Cropland distributions from temporal unmixing of MODIS data.Remote Sensing of Environment,93,412–422.
Miura,T.,Huete,A.R.,Yoshioka,H.,&Holben,B.N.(2001).An error and sensitivity analysis of atmospheric resistant vegetation indices derived from dark target-based atmospheric correction.Remote Sensing of Environment,78,284–298. Moody,A.,&Woodcock,C.E.(1995).The in?uence of scale and the spatial character-istics of landscapes on land-cover mapping using remote https://www.doczj.com/doc/a06079715.html,ndscape Ecol-ogy,10,363–379.
Ozdogan,M.(2010).The spatial distribution of crop types from MODIS data:Temporal unmixing using Independent Component Analysis.Remote Sensing of Environment, 114,1190–1204.
Ozdogan,M.,&Woodcock,C.E.(2006).Resolution dependent errors in remote sensing of cultivated areas.Remote Sensing of Environment,103,203–217.
Potgieter,A.B.,Apan,A.,Hammer,G.,&Dunn,P.(2010).Early-season crop area estimates for winter crops in NE Australia using MODIS satellite imagery.ISPRS Journal of Photo-grammetry and Remote Sensing,65,380–387.
Rouse,J.W.,Haas,R.H.,Schell,J.A.,&Deering,D.W.(1973).Monitoring vegetation systems in the Great Plains with ERTS.Proceedings of Third Earth Resources Technol-ogy Satellite—l Symposium[C](pp.310–317).Greenbelt:NASA SP:351. Sakamoto,T.,Yokozawa,M.,Toritani,H.,Shibayama,M.,Ishitsuka,N.,&Ohno,H.
(2005).A crop phenology detection method using time-series MODIS data.Remote Sensing of Environment,96,366–374.
Tan,B.,Woodcock,C.E.,Hu,J.,Zhang,P.,Ozdogan,M.,Huang,D.,et al.(2006).The impact of gridding artifacts on the local spatial properties of MODIS data:Implications for val-idation,compositing,and band-to-band registration across resolutions.Remote Sensing of Environment,105,98–114.
Townshend,J.,&Justice,C.O.(2002).Towards operational monitoring of terrestrial systems by moderate-resolution remote sensing.Remote Sensing of Environment, 83,351–359.
Van Niel,T.G.,&McVicar,T.R.(2004).Determining temporal windows for crop dis-crimination with remote sensing:A case study in south-eastern https://www.doczj.com/doc/a06079715.html,-puters and Electronics in Agriculture,45,91–108.
Vieira,C.,Mather,P.,&McCullagh,M.(2000).The spectral-temporal response surface and its use in the multi-sensor,multi-temporal classi?cation of agricultural crops.International Archives of Photogrammetry and Remote Sensing,23(1980), 582–589.
Wardlow,B.D.,&Egbert,S.L.(2008).Large-area crop mapping using time-series MODIS250m NDVI data:An assessment for the US Central Great Plains.Remote Sensing of Environment,112,1096–1116.
Waring,R.H.,Coops,N.C.,Fan,W.,&Nightingale,J.M.(2006).MODIS enhanced veg-etation index predicts tree species richness across forested ecoregions in the con-tiguous USA.Remote Sensing of Environment,103,218–226.
Xiao,X.M.,Boles,S.,Liu,J.Y.,Zhuang,D.F.,Frolking,S.,Li,C.S.,et al.(2005).Mapping paddy rice agriculture in southern China using multi-temporal MODIS images.Remote Sensing of Environment,95,480–492.
Xu,J.(2002).Mathematical methods in contemporary geography.Beijing:Higher Education Press.
Zhao,Y.(2003).Analysis theory and method of remote sensing application.Beijing:Science Press.
242Y.Pan et al./Remote Sensing of Environment119(2012)232–242
剖宫产术后护理查房 时间:2012年12月xx日下午 地点:产科病房 参加人员:护士长,护士甲、乙、丙、丁 护士长:今天我们一起学习一下剖宫产术后相关的知识。首先请甲护士介绍一下病人的情况。 护士甲:1床xx,女,25岁,G1P0孕39+5周,胎位不正,臀位。胎心音145次/ 分,无传染病史,无手术史。于今天上午9时在腰硬联合麻醉下行子宫下段剖宫产 术,安返病房。 护士长:好!下面我们讨论一下术后一些护理措施。 护士甲: 1?须认真做好交接班工作。未回房前,备好麻醉床,做好接手术病人的准备工作。回病房后与麻醉巡回护士做好床头交接班,了解患者术中情况。 2?术后体位护理。回房后应去枕平卧6h,有呕吐现象应头偏一侧,妥善固定尿袋。 3.皮肤观察及护理。嘱患者早翻身、勤翻身,避免局部长期受压而发生压疮。 4.术后生命体征观察。严密监测血压、呼吸。术后监测血压每小时一次,三次平稳后 改四小时一次。严密观察阴道出血量,定时按压子宫,若出血比月经量多,需立即 汇报医生并采取措施。 5?观察宫底高度及切口情况。术后宫底应在平脐或脐下一指,密切观察子宫收缩情况。6?导管护理。妥善处理好各种导管。首先是输液管,观察留置针穿刺部位有无脱落、红肿、渗出。输液卡药物名称、剂量、滴速是否相符,尿管是否通畅,尿色量是否正常。一般手术后24h拔尿管,协助患者下床活动,注意能否自行排尿。当产妇第一次下床,体位应由卧一坐一站慢慢改变,防止体位性低血压发生。 护士长:护士甲说的非常到位,术后活动我们一定要告诉病人术后活动的注意事项,严防低血压晕厥或虚脱发生。一旦发生虚脱,低血压晕厥我们如何处理? 护士乙:把病人扶到床上,平卧保暖,监测生命体征,发现异常及时通知医生。 护士长:好!刚刚甲护士说的护理措施,护士丙补充一下。 护士丙: 1.对产妇做好心理护理。术后应了解产妇心理,做好宣教。 2?向产妇及家属交代术后注意事项。(1)去枕平卧6h。(2)阴道流血多于月经量要 及时通知医生。(3)婴儿注意保暖,侧卧,防止呕吐出的羊水阻塞呼吸道。(4)6h 后可喝温开水,禁奶、豆浆等产气食物。(5)由于产妇出汗较多,应勤擦洗、勤换 衣物。 3.让宝宝早吸吮。产后30分钟即让宝宝吸吮,喂奶前清洁双手及乳头。 4.术后早活动。术后6h在床上翻身,促进血液循环及肠蠕动,防止肠粘连,尽早排 气。
大家下午好,今天我们结合的病历对剖宫产术后患者的护理进行一个护理教学查房,剖宫产术是经腹切开子宫取出胎儿的手术,是产科领域中的重要手术,成为解决难产和某些产科合并症,挽救产妇和围产儿生命的有效手段。第一次活体剖宫产术发生在1610年,但由于各种原因产妇于术后25天死亡。经阴道分娩则是自然而且符合生理的分娩途径,产妇分娩后能迅速康复,新生儿能更好的适应外界环境。剖宫产对产妇和新生儿都有一定的影响, 孕产妇死亡率,所以不主张无医学指征行剖宫产术。 剖宫产指证 一、难产 (1)头盆不称:指胎儿相对于产妇的骨盆入口过大。 (2)骨产道或软产道异常:骨产道异常,比如有尾骨骨折过的孕妇;软产道异常,如较严重的阴道发育畸形、瘢痕狭窄等,或妊娠合并直肠或盆腔良、恶性肿瘤梗阻产道者。这些情况下,即使进行会阴切开,估计足月胎儿也不能通过产道。(3)胎儿或胎位异常:比如臀位、横位、异常头位(高直位、额位、颏后位等)不适宜阴式分娩。还有双胎、多胎时的某些情况(双胎第一胎为臀位、横位,或联体双胎等),也不适宜阴式分娩。另外,一些可矫治的胎儿异常,胎儿不能耐受分娩过程,或胎儿某部分异常不能通过产道,宜行剖宫产术。 (4)脐带脱垂:一些胎膜已破的孕妇,胎儿脐带越过胎儿先露部而先脱出于宫颈口外进入阴道,甚至阴道外,称为脐带脱垂。这时,宫颈、胎儿先露部等挤压脐带,胎儿可能迅速发生宫内窘迫,甚至死胎死产。所以一旦发现脐带脱垂,胎心尚存在,应在数分钟内娩出胎儿。 (5)胎儿窘迫:指胎儿宫内缺氧,由此造成胎儿酸中毒,导致神经系统受损,严重者可留有后遗症,甚至胎儿宫内死亡,是产科常见合并症。这种情况下,如短期内不能经阴道分娩,应立即行剖宫产术。 (6)剖宫产史:易发生子宫破裂或先兆子宫破裂。 (7)羊水过少:B超检查最大羊水平面≤2cm,羊水指数≤8cm提示羊水偏少,羊水指数≤5cm为诊断羊水过少的绝对值。分娩期羊水流出量总和<300ml 。 二、妊娠并发症 比如子痫、子痫前期重度、、前置胎盘、胎盘早剥等。 三、妊娠合并症 比如某些子宫肌瘤、卵巢肿瘤。某些内外科疾病,如心脏病、糖尿病、肾病等等。某些传染病,如妊娠合并尖锐湿疣或淋病等。
弱势品牌的渠道精耕细作策略 精耕细作”一词在各种专业市场治理媒体上频繁出现,一时刻成为企业营销政策和方案里点击率最高的名词之一。能够讲“精耕细作”是今年的一个营销关键词。众多的企业从开始关注通路的竞争到现在逐渐关注终端的竞争,进行深度分销和区域市场的精耕细作,开始了新一轮的针对终端的竞争。谁能有效地运作终端,掌控终端,谁将能够取得竞争的胜利。 一、市场精耕细作的含义 所谓渠道精耕细作,确实是指企业在特定的区域市场,通过整合的营销手段,充分地挖掘市场潜力,对分销商进行培育和支持,提高网点的覆盖率和渗透率,加强网点的生动化治理,并利用广告宣传及促销活动等手段来拉动市场,最终达到分销商主推、终端主推的目的,从而提高市场占有率和品牌阻碍力,提高企业产品的销售量。
由于市场环境的变化,众多的企业开始意识到对市场精耕细作和深度分销的必要性和重要性,特不是快速消费品行业中一些弱势品牌的企业,面临着众多知名强势品牌的围攻和市场瓜分,为了能够有效地开发和维护好现有市场,有必要对渠道进行精耕细作,然而由于受到各种资源的制约,该如何开展这项工作呢?这是专门多中小企业所面临的一个问题。 二、精耕细作的背景 1、销售渠道和零售终端的多样化 近年来,中国市场发生了专门大的变化,销售渠道的类型和零售终端出现了专门多的创新。企业的竞争表现为渠道的争夺和终端的抢占,从渠道的各个环节自上而下来掌控市场。传统的批发市场分销流通模式接着在一些区域市场存在同时专门好的进展,同时跨国公司进入中国市场,带来了先进的治理经验,如区域分销模式、联合分销体模式。国内的专门多公司结
合中国市场的实际情况,专门成功地运用了这些销售模式,取得了专门好的市场效果。在零售终端业态方面,街边小店、社区便利店、连锁超市、大卖场等形式的零售终端遍布整个市场,不同的终端形式针对不同的细分市场和消费者群体。企业如何来面对如此的市场环境,如何依照企业的资源状况来选择渠道和终端是十分重要的。 2、终端上的竞争加剧 企业对市场的掌控的能力取决于对渠道治理的深度,即企业能够有效治理和掌控的渠道层级。随着竞争的加剧,从大区经销商、省级经销商、市级经销商,一直进展到以县级经销商为主,渠道治理重心的下移是一个不可逆转的趋势,也是营销界的主旋律之一,经销商重心下移的底线是乡镇经销商,在乡镇市场上占据终端。而关于中心都市而言,经销商正向规模化的方向进展,大卖场和连锁超市等现代终端的出现同时日益进展成熟,企业对这些经销商和终端的资源展开争夺,竞争激
---------------------------------------------------------------最新资料推荐------------------------------------------------------ 剖宫产术后护理查房 大家下午好,今天我们结合的病历对剖宫产术后患者的护理进行一个护理教学查房,剖宫产术是经腹切开子宫取出胎儿的手术,是产科领域中的重要手术,成为解决难产和某些产科合并症,挽救产妇和围产儿生命的有效手段。 第一次活体剖宫产术发生在 1610 年,但由于各种原因产妇于术后 25 天死亡。 经阴道分娩则是自然而且符合生理的分娩途径,产妇分娩后能迅速康复,新生儿能更好的适应外界环境。 剖宫产对产妇和新生儿都有一定的影响,无医学指征剖宫产不但不能降低围生儿的死亡率,反而增加了剖宫产术后病率及孕产妇死亡率,所以不主张无医学指征行剖宫产术。 剖宫产指证一、难产剖宫产指证一、难产(1)头盆不称:指胎儿相对于产妇的骨盆入口过大。 (2)骨产道或软产道异常: 骨产道异常,比如有尾骨骨折过的孕妇;软产道异常,如较严重的阴道发育畸形、瘢痕狭窄等,或妊娠合并直肠或盆腔良、恶性肿瘤梗阻产道者。 这些情况下,即使进行会阴切开,估计足月胎儿也不能通过产道。 (3)胎儿或胎位异常: 比如臀位、横位、异常头位(高直位、额位、颏后位等)不适宜 1 / 6
阴式分娩。 还有双胎、多胎时的某些情况(双胎第一胎为臀位、横位,或联体双胎等),也不适宜阴式分娩。 另外,一些可矫治的胎儿异常,胎儿不能耐受分娩过程,或胎儿某部分异常不能通过产道,宜行剖宫产术。 (4)脐带脱垂: 一些胎膜已破的孕妇,胎儿脐带越过胎儿先露部而先脱出于宫颈口外进入阴道,甚至阴道外,称为脐带脱垂。 这时,宫颈、胎儿先露部等挤压脐带,胎儿可能迅速发生宫内窘迫,甚至死胎死产。 所以一旦发现脐带脱垂,胎心尚存在,应在数分钟内娩出胎儿。 (5)胎儿窘迫: 指胎儿宫内缺氧,由此造成胎儿酸中毒,导致神经系统受损,严重者可留有后遗症,甚至胎儿宫内死亡,是产科常见合并症。 这种情况下,如短期内不能经阴道分娩,应立即行剖宫产术。 (6)剖宫产史: 易发生子宫破裂或先兆子宫破裂。 (7)羊水过少: B 超检查最大羊水平面2cm,羊水指数8cm 提示羊水偏少,羊水指数5cm 为诊断羊水过少的绝对值。 分娩期羊水流出量总和300ml 。 二、妊娠并发症比如子痫、子痫前期重度、、前置胎盘、胎盘早
弱势品牌的渠道精耕细 作策略规划 WTD standardization office【WTD 5AB- WTDK 08- WTD 2C】
弱势品牌的渠道精耕细作策略精耕细作”一词在各种专业市场管理媒体上频繁出现,一时间成为企业营销政策和方案里点击率最高的名词之一。可以说“精耕细作”是今年的一个营销关键词。众多的企业从开始关注通路的竞争到现在逐渐关注终端的竞争,进行深度分销和区域市场的精耕细作,开始了新一轮的针对终端的竞争。谁能有效地运作终端,掌控终端,谁将能够取得竞争的胜利。 一、?市场精耕细作的含义? 所谓渠道精耕细作,就是指企业在特定的区域市场,通过整合的营销手段,充分地挖掘市场潜力,对分销商进行培育和支持,提高网点的覆盖率和渗透率,加强网点的生动化管理,并利用广告宣传及促销活动等手段来拉动市场,最终达到分销商主推、终端主推的目的,从而提高市场占有率和品牌影响力,提高企业产品的销售量。?
由于市场环境的变化,众多的企业开始意识到对市场精耕细作和深度分销的必要性和重要性,特别是快速消费品行业中一些弱势品牌的企业,面临着众多知名强势品牌的围攻和市场瓜分,为了能够有效地开发和维护好现有市场,有必要对渠道进行精耕细作,但是由于受到各种资源的制约,该如何开展这项工作呢?这是很多中小企业所面临的一个问题。? 二、?精耕细作的背景? 1、?销售渠道和零售终端的多样化? 近年来,中国市场发生了很大的变化,销售渠道的类型和零售终端出现了很多的创新。企业的竞争表现为渠道的争夺和终端的抢占,从渠道的各个环节自上而下来掌控市场。传统的批发市场分销流通模式继续在一些区域市场存在并且很好的发展,同时跨国公司进入中国市场,带来了先进的管理经验,如区域分销模式、联合分销体模式。国内的很多公司结合中国市场的实际情
产科实习护士教学查房 时间:2014年10月21日 地点: 产科办公室 查房内容: G2P0孕38+1周,臀位 查房病人: 15床邓倩 主持老师:陈老师 参加学生:石瑶董娜娜、陈静 陈老师:大家下午好,今天下午我们产科实习同学进行教学查房,查房病人是15床邓倩先请石瑶同学给大家介绍一下简要病史。 石瑶同学:产妇邓倩,女性,27岁,已婚,常州人,因“停经38+1W,产检发现臀位”于2014-10-17入院。行正规产检无异常,2013年孕1月自然流产一次。产妇于2014-10-20在 连硬麻下行子宫下段剖宫产术,手托足娩出一女婴,重3450g,评分10-10,术 中出血不多,约100ml。术后常规给予抗炎、促宫缩等治疗,今术后第一天,生 命体征平稳,宫底脐下一指,恶露正常。 入院时体检:T 37.0℃,Bp 110/76mmHg,P 80bpm,R 19次/分,身高160cm,体重65kg。 B超:宫内单胎臀位(LSA),双顶径91cm,腹周径363,股骨长66mm,羊水深52mm,胎盘附着于子宫前壁,Ⅲ-级,S/D2.10,胎儿颈部见U形压迹,胎心140次/分。 2014-09-29我院B族链球菌(+)。 心电图:正常 陈老师带着学生到床边对病人进行护理评估。 陈老师:请石瑶同学根据病史和评估资料列出这个病人目前的主要护理问题以及帮助病人解决问题的主要护理措施。 石瑶同学:主要有3个护理问题 护理诊断:疼痛-----与手术切口及宫缩痛有关 护理目标:产妇能掌握2-3项减轻疼痛的方法,疼痛能及时得到缓解。 循证原因:手术造成的组织损伤,不仅仅局限于皮肤,肌肉、内脏器官都会受累,术后疼痛的来源,包括体神经和内脏神经的双重激动。是由于神经系统地损伤、刺激造成 的疼痛感觉,其根本原因还是肌肉、肌腱的损伤对神经系统地刺激造成的异常感 觉。也是与个体差异有关系的。 护理措施:1、适当抬高床头,半卧位以减轻腹部伤口张力,缓解伤口疼痛,同时有利于恶露的排出。 2、保持病室环境安静整洁,认真聆听病人主诉,告知家属经常鼓励她并给予精 神支持和安慰。 3、指导产妇通过听音乐、给宝宝喂奶等转移注意力的方法减轻疼痛。 4、进行各种检查或护理前先将目的程序告诉产妇,操作动作应熟练轻柔,避免 粗暴。 5、加强巡视病人,注意评估疼痛部位、程度,必要时遵医嘱使用止痛药,观察 用药效果。 护理诊断:有感染的危险------与手术及留置导尿管有关。 护理目标:患者住院期间无感染症状或若有感染症状及体征能及时发现并处理。 循证原因:1、妊娠期易发生菌血症,如泌尿生殖道感染。
朱玉童:公司战略、营销战略与职能战略一)、整体战略、营销战略、职能战略的区别: 2、例证:皇明集团的战略
(以上部分内容摘自皇明集团网站,案例内容由采纳品牌营销国际顾问机构提供) 皇明的成功,取决于其长期的、有规划性的公司战略、营销战略、职能战略的确立,截止2003年,皇明太阳能中央热水系统已推广几千万平方米,累计节约标准煤1000多万吨,减少相应燃煤污染排放量500多万吨,创造出巨大的经济效益和社会效益。现在全国有太阳能热水器生产厂家近4000家,皇明太阳能集团规模最大、技术能力最强,年产热水器50万台,真空管1200万支,成为中国太阳能行业的第一品牌。 二)、营销战略制定流程 1、营销审计——界定关键问题
点击看大图 市场营销活动的审计是一项复杂而细致的评估活动,其实施程序为: 营销审计在国内是一个全新的概念,目前仅在管理非常优秀的少数跨国公司内有类似的机制,它是对一个公司或一个业务单位的营销环境、目标、战略和行动所进行的一种全面的、系统的、独立的和定期的检查。其目的在于确定问题和机会,提出行动计划,以改善公司的营销业绩。 2、竞争环境分析
点击看大图 企业面对的市场通常是一个竞争性市场,从某种产品制造和销售活动的企业通常不只一家,在多家企业同时生产或相似产品的情况下,相互之间因为争夺顾客必然形成激烈的市场竞争。 3、进行思想采购——用全球化视野思考 全球化的思想采购,是找出国际各行业的标杆企业作为案例来进行研究,从中找出行业的基准,再与本企业进行对比,参考而制定出合适的战略规划。全球化视野之下的策划思维拥有宽广的视野对于解决问题来说至关重要。 4、确定战略定位 战略定位。要作到"不战而屈人之兵",就要占领市场的最佳位置,即正确制定"定位策略"(Positioning Strategy),主要策略有:1)拾遗补缺定位策略:这是专钻市场空隙的一种定位策略。 2)迎头定位策略:这是一种针锋相对的定位策略。 3)突出特色定位策略:这是一种高人一筹的定位策略。 5、设置战略目标
剖宫产术后护理查房 科别:妇二科床号:12床住院号2014001985 姓名::*** 性别:女年龄:26民族:汉职业:农民籍贯:甘肃文化程度;初中发病节气:立夏入院方式:步入 入院日期:2014-05-13 手术日期: 2014-05-14 现病史:患者,女,26岁,主因:孕40+2W,无产兆要求入院剖宫分娩,门诊以“孕足月待产 ”收住。入院时见:神志清,精神可,无腹痛腰酸下坠感,无阴道流血流液,食纳可,夜寐安,二便调 。产查胎方位ROA胎心140次/分,肛查宫口未开,胎膜未破,。于2014-05-14 08;30在“腰麻”下行“子宫下段剖宫产”术,术程顺利术中于9:00剖娩一男婴,清理呼吸道后,哭声响亮,面色口唇红润。常规结扎脐带。体重3600克,产妇术程顺利,术毕于10:00安返病室,麻醉清醒,术后予去枕平卧切口至沙袋抗炎缩宫补液等对症处理。产妇切口疼痛可忍,切口敷料整洁无渗出,已虚恭,进食半流食后无腹胀,子宫收缩可,阴道恶露量适少,其子面色口唇红润,吃奶水可,二便调。现产妇术后第六天,神志清,精神可,线已拆,切口愈合良好,食纳可,二便调。 体格检查:T:36.8℃ ,P:96次/分,R:23次/分,BP:118/73mmHg舌质淡苔薄白脉滑数 既往史:既往体健月经史:15岁初潮,婚育史:26岁结婚,孕1产0。 辅助检查:B超提示:晚孕,单活胎,头位。胎儿双顶径约9.6cm, 入院诊断:中医诊断:妊娠足月西医诊断:1.妊娠40+2W;2.巨大儿? *术前护理诊断及护理措施一.护理问题 产妇1.疼痛与子宫收缩有关 2.焦虑与担心术中疼痛、新生儿性别与期望不符有关。 3.知识缺乏与对产后生活护理不了解 4.潜在并发证脐带脱垂,羊水栓塞。 胎儿1.有受伤的危险与胎儿巨大引起头盆不称有关 2.潜在并发证宫内窘迫,缺氧 三. 护理措施(1)一般护理 1.介绍入院环境,包括责任护士,主管医生 2.告诉患者生产前,宫缩痛是正常的,让其正确对待疼痛。 3.做好术前护理宣教,术前禁食水, 4.保持床单位的整洁,用温水擦洗皮肤,保持皮肤的清洁干燥。 5.给患者讲解术前,术中,术后的相关准备及注意事项。 6.讲解相关知识,消除焦虑心理。 (2)病情观察1.入院后左侧卧位,必要时给与氧气吸入 2.监测胎心,胎动听胎心每日6次,吸氧30分钟每日两次,自数胎动1小时每日3次 3.观察产程进展,如出现阴道流血流液应及时报告医生处置。 *术后护理问题及护理措施一护理问题 产妇1.疼痛与术后切口疼痛子宫收缩有关 2.营养失调与禁食水有关 3.知识缺乏与对术后生活护理不了解有关 4.有感染的危险与手术和留置尿管有关 5.有亲子依恋改变的危险与术后疲惫,疼痛和婴儿性别有关。 6.呼吸形态紊乱与呼吸道分泌物增多有关 7.潜在并发证尿潴留,腹胀,切口感染,乳房胀痛,产后出血 新生儿1.有受伤的危险烫伤 2.潜在并发证窒息,臀红,脐部感染 二护理措施(1).一般护理 1、床边接班,产妇被送回病房时,与手术室护士做好交接班,了解术中出血,补液等情况及目前状况。,指导患者家属按摩患者双下肢以促进血液循环防止静脉血栓的形成 2、体位,去枕平卧6-8小时,头偏向以一侧,保持呼吸道通畅,给予低流量吸氧,持续沙袋加压切口8小时。手术8小时后取半卧位,以减少炎症及腹胀的发生。鼓励患者早下床活动,促进肠蠕动。 3疼痛护理:疼痛无法耐受时,遵医嘱於止痛针剂。告知患者,产后应用缩宫素也会导致宫缩痛,是正常现象,有利于子宫复旧
渠道经理岗位职责 渠道经理团队作为电信代理渠道的中坚力量,需要明确自身在未来企业战略框架下的使命:服务、培养、管理、维系优质代理渠道,确保完成公司给代理渠道下达的各项任务。围绕这个最终目的,确定了渠道经理团队的岗位职责。 一、定位: 渠道经理团队的定位为: ★代理渠道优秀业绩的推动者; ★代理渠道规范运营的督导者; ★代理渠道双赢合作的掌控者。 渠道经理必须对渠道日常运营管理与支撑、渠道门店日常管理沟通、问题门店运营 能力提升、市场信息的收集与反馈等。 渠道经理在日常渠道管控与指导中主要围绕选店、开店、炒店、巡店这条主线,具 体又涉及调研、谈判、培训、陈列和微促等五大能力。 二、工作理念(“六要”) (一)工作形象要鲜明:有了好的职业形象,才能给代理商及其店员留下良好的专 业形象,是建立渠道管理威信的第一步。 (二)渠道政策要熟知:各项渠道政策要非常熟悉,这样才能执行起来准确无误。 (三)系统操作要熟练:对系统操作了如指掌,加快业务受理的速度与效率。 (四)渠道服务要主动:渠道代理商就是我们的客户,主动快速准确解决渠道各种 问题,服务客户是渠道经理的基本职责。
(五)营销指导要专业:在营销技巧与微促的指导上非常专业,既可以赢得客户,也可以赢得渠道方的认同。 (六)关系维系要紧密:密切的合作关系可以增加工作的顺畅度,同时提高代理商的忠诚度。 三、具体职责及规范 (一)计划管理 良好的计划是高效工作的前提,计划的作用体现在三个方面:合理利用资源、提高工作效率、降低风险产生。制定计划必须包含以下内容: ★培训指导、物料到达、促销策划; ★需领导协助和团队支撑的工作; ★与渠道管理和支撑相关的其他工作。 (二)渠道走访 渠道店面经营质量与渠道经理渠道走访有直接的关系,渠道走访可以现场沟通、现场发现、现场指导、现场解决、现场服务,以实现渠道经营与销售业绩最大化。
产科实习护士教学查房 时间: 2014年10月21日 地点: 产科办公室 查房内容: G2P0孕38+1周,臀位 查房病人: 15床邓倩 主持老师:陈老师 参加学生:石瑶董娜娜、陈静 陈老师:大家下午好,今天下午我们产科实习同学进行教学查房,查房病人是15床邓倩先请石瑶同学给 大家介绍一下简要病史。 石瑶同学:产妇邓倩,女性,27岁,已婚,常州人,因“停经38+1W,产检发现臀位”于2014-10-17入院。 行正规产检无异常,2013年孕1月自然流产一次。 产妇于2014-10-20在连硬麻下行子宫下段剖宫 产术,手托足娩出一女婴,重3450g,评分10-10, 术中出血不多,约100ml。术后常规给予抗炎、 促宫缩等治疗,今术后第一天,生命体征平稳, GAGGAGAGGAFFFFAFAF
宫底脐下一指,恶露正常。 入院时体检:T 37.0℃,Bp 110/76mmHg,P 80bpm,R 19次/分,身高160cm,体重65kg。 B超:宫内单胎臀位(LSA),双顶径91cm,腹周径363,股骨长66mm,羊水深52mm,胎盘附着于子宫前壁, Ⅲ-级,S/D2.10,胎儿颈部见U形压迹,胎心140 次/分。2014-09-29我院B族链球菌(+)。 心电图:正常 陈老师带着学生到床边对病人进行护理评估。 陈老师:请石瑶同学根据病史和评估资料列出这个病人目前的主要护理问题以及帮助病人解决问题的主要护理措施。 石瑶同学:主要有3个护理问题 护理诊断:疼痛-----与手术切口及宫缩痛有关 护理目标:产妇能掌握2-3项减轻疼痛的方法,疼痛能及时得到缓解。 循证原因:手术造成的组织损伤,不仅仅局限于皮肤,肌肉、内脏器官都会受累,术后疼痛的来源,包括体神 经和内脏神经的双重激动。是由于神经系统地损 GAGGAGAGGAFFFFAFAF
剖腹产术后护理查房 Document serial number【UU89WT-UU98YT-UU8CB-UUUT-UUT108】
产科实习护士教学查房时间: 2014年10月21日 地点: 产科办公室 查房内容: G2P0孕38+1周,臀位 查房病人: 15床邓倩 主持老师:陈老师 参加学生:石瑶董娜娜、陈静 陈老师:大家下午好,今天下午我们产科实习同学进行教学查房,查房病人是15床邓倩先请石瑶同学给大家介绍一下简要病史。 石瑶同学:产妇邓倩,女性,27岁,已婚,常州人,因“停经38+1W,产检发现臀位”于2014-10-17入院。行正规产检无异常,2013年孕1月自然 流产一次。产妇于2014-10-20在连硬麻下行子宫下段剖宫产术,手 托足娩出一女婴,重3450g,评分10-10,术中出血不多,约100ml。 术后常规给予抗炎、促宫缩等治疗,今术后第一天,生命体征平稳, 宫底脐下一指,恶露正常。 入院时体检:T ℃,Bp 110/76mmHg,P 80bpm,R 19次/分,身高160cm,体重 65kg。 B超:宫内单胎臀位(LSA),双顶径91cm,腹周径363,股骨长66mm,羊水深52mm,胎盘附着于子宫前壁,Ⅲ-级,S/,胎儿颈部见U形压迹, 胎心140次/分。2014-09-29我院B族链球菌(+)。 心电图:正常 陈老师带着学生到床边对病人进行护理评估。
陈老师:请石瑶同学根据病史和评估资料列出这个病人目前的主要护理问题以及帮助病人解决问题的主要护理措施。 石瑶同学:主要有3个护理问题 护理诊断:疼痛-----与手术切口及宫缩痛有关 护理目标:产妇能掌握2-3项减轻疼痛的方法,疼痛能及时得到缓解。 循证原因:手术造成的组织损伤,不仅仅局限于皮肤,肌肉、内脏器官都会受累,术后疼痛的来源,包括体神经和内脏神经的双重激动。是由于神 经系统地损伤、刺激造成的疼痛感觉,其根本原因还是肌肉、肌腱的 损伤对神经系统地刺激造成的异常感觉。也是与个体差异有关系的。护理措施:1、适当抬高床头,半卧位以减轻腹部伤口张力,缓解伤口疼痛,同时有利于恶露的排出。 2、保持病室环境安静整洁,认真聆听病人主诉,告知家属经常鼓励她 并给予精神支持和安慰。 3、指导产妇通过听音乐、给宝宝喂奶等转移注意力的方法减轻疼痛。 4、进行各种检查或护理前先将目的程序告诉产妇,操作动作应熟练轻 柔,避免粗暴。 5、加强巡视病人,注意评估疼痛部位、程度,必要时遵医嘱使用止痛 药,观察用药效果。 护理诊断:有感染的危险------与手术及留置导尿管有关。 护理目标:患者住院期间无感染症状或若有感染症状及体征能及时发现并处理。循证原因:1、妊娠期易发生菌血症,如泌尿生殖道感染。
剖宫产术后护理查房 张友花:今天我们学习剖宫产术相关知识,下面我先介绍患者病历。 科别:妇产科床号:20床住院号:201607171 姓名:熊芬芬性别:女年龄:23 民族:汉职业:无籍贯:南昌文化程度:初中入院方式:步入 入院日期:2016-05-13 手术日期: 2015-05-14 现病史:患者,女,23岁,主因:孕39+6W,剖宫产史要求入院剖宫分娩,门诊以“孕足月待产,疤痕子宫 ”收住。入院时见:神志清,精神可,无腹痛腰酸下坠感,无阴道流血流液,食纳可,夜寐安,二便调 。产查胎方位ROA胎心140次/分,肛查宫口未开,胎膜未破,宫高29cm,腹围100cm。于2014-05-14 09:00在“腰麻”下行“子宫下段剖宫产”术,术程顺利术中于10:07剖娩一女婴,清理呼吸道后,哭声响亮,面色口唇红润。常规结扎脐带。体重3000克,产妇术程顺利,术毕于11:00安返病室,麻醉清醒,术后予去枕平卧切口置沙袋抗炎缩宫补液等对症处理。产妇切口疼痛可忍,切口敷料整洁无渗出,进食半流食后无腹胀,子宫收缩可,阴道恶露量适少,其女面色口唇红润,吃奶水可,二便调。现产妇术后第三天,神志清,精神可,切口愈合良好,食纳可,二便通。 体格检查:T:36.8℃ ,P:96次/分,R:23次/分,BP:118/73mmHg 既往史:既往体健月经史:15岁初潮,婚育史:20岁结婚,孕2产1。 辅助检查:B超提示:晚孕,单活胎,头位,胎儿双顶径约9.3cm。 入院诊断: 1.妊娠39+6W G2P1;2.疤痕子宫。 张友花:下面请贺芳介绍一下剖宫产的定义和指征。 *剖宫产定义及指征 剖宫产定义:凡诊断为28周以上的妊娠而行剖腹,切开子宫,取出体重达到或超过500克的胎儿者称为剖宫产术。指征:头盆不称、脐带脱垂、横位、社会因素、羊水过少、臀位、瘢痕子宫、胎心监护晚减,胎儿宫内窘迫、前置胎盘、过期妊娠、妊娠合并心脏病、糖尿病、肾病、重度妊高症等等。 张友花:一旦发现胎儿宫内窘迫或异常,危及母子安全,我们都应该及时终止妊娠,下面请吴云穹说一下如何对剖宫产病人做术前宣教。 *术前护理诊断及护理措施一.护理问题 产妇1.疼痛与子宫收缩有关 2.焦虑与担心术中疼痛、新生儿性别与期望不符有关。 3.知识缺乏与对产后生活护理不了解 4.潜在并发证脐带脱垂,羊水栓塞。 胎儿1.有受伤的危险与胎儿巨大引起头盆不称有关 2.潜在并发证宫内窘迫,缺氧 护理措施(1)一般护理 1.介绍入院环境,包括责任护士,主管医生 2.做好术前护理宣教,术前晚进食清淡饮食,00:00后禁食水。 3.保持床单位的整洁,用温水擦洗皮肤,保持皮肤的清洁干燥。 4.给患者讲解术前,术中,术后的相关准备及注意事项。 5.讲解相关知识,给予病人心理疏导,消除焦虑心理。 6.让病人晚上早休息,保持充足的体力; (2)病情观察
渠道精耕细作的秘诀 得渠道者得天下。渠道是企业的命脉。当企业高举着产品战、价格战、概念战、品牌战等大旗杀得人仰马翻之时,一直暗藏在水面下的渠道竞争也正在如火如荼,一浪高过一浪。 对渠道精耕细作,一时成为企业营销政策和方案里点击率最高的名词。所谓渠道精耕细作,就是指在特定的区域市场,通过整合的营销手段,充分地挖掘市场潜力,对分销商进行培育和支持,提高网点的覆盖率和渗透率,加强网点的生动化管理,并利用广告宣传及促销活动等手段来拉动市场,最终达到分销商主推、终端主推的目的,从而提高市场占有率和品牌影响力。 但说来容易做来难。企业究竟应该如何才能将传统的从上向下的渠道管理模式转变为扁平化渠道管理模式,从而真正掌控渠道,在硝烟弥漫的市场上立于不败之地呢? “四害”猛于虎:认识精耕细作的重要性 很多人抱着一种很天真的想法,认为只要搞定区域经销商,就万事大吉,只需在办公室翘着二郎腿数钞票了!非也!渠道疏散管理,其害猛于虎!搞定经销商只相当于把树苗植进了土地,但要真正长成参天大树,还需要施肥、除草、浇地等艰辛的劳作! 不对渠道进行精耕细作,其危害性表现在以下四方面: 一害:市场无法深度开发。如果经销商不能把产品销售出去,产品滞留在流通领域,这种销售只是一种仓库转移,无法形成市场的良性互动。要实现真正意义上的销售,必须进行深层次市场开发:由进入市场变为占领市场,由攻下阵地变为巩固阵地。而要真正占领市场和巩固阵地,决定性的战争就在于渠道。如何挖掘现有市场潜力?如何扩大产品在现有市场上的销量?如何提高市场占有率?如果渠道上没有占据有利形势,这些问题都无异于天方夜谭。 二害:要么导致对经销商失控,要么导致经销商“变节”。长期对渠道放任自流,必然导致企业在二级、三级分销商和终端失去话语权,从而在与经销商的博弈中处于劣势,在各种营销策略和营销政策中受制于经销商。同时,由于对渠道缺乏有力的监管和支持,无法激发经销商的积极性,结果经销商陷入恶性竞争状态,价格体系遭到破坏,最终经销商互相倾轧,市场遭到毁灭性打击,于是经销商“倒戈变节”,要么主要精力转移到竞争产品,要么干脆投入敌军阵营,给企业造成重大损失。因此必须通过合理的网络结构,分化区域经销商的力量,化整为零,使企业能够更好地控制经销商。 三害:品牌形象受损。由于对经销商的培训和辅助不到位,公司广告宣传政策不能执行到位,促销不到位,服务不到位,其最终的结果就是品牌形象江河日下。 四害:信息通路不畅。由于没有真正深入市场,信息不畅通,导致决策缓慢或偏离市场,最后在竞争中节节败退,饮恨江湖。因此必须构筑起平台式的销售网络体系,降低企业对渠道的管理重心,更加贴近终端,提高市场变化的反应速度。
2020{营销策略}朵彩营销宝典之渠道策略
·营销渠道的起点是生产者,终点是消费者。营销渠道是商品或者劳务从生产者到消费者“一通到底”的完整通道。渠道流通的过程不仅是产品所有权转移的过程,也是产品个性化体验传递的过程。 ·在渠道运营过程中,我们要强调关爱式的专业服务、科学化的精准管理以及强有力的推进执行! 渠道 与经销商建立战略同盟伙伴关系,是我们的目标。 ——鲁晓强 一、精细化耕作,想得到,更要做得到 营销渠道建设,执行高于策略。在渠道运作上,优质的管理与严格有效的执行,是深度市场开发与精细化耕作的保障。在这个层面上,参与竞争的人最多、竞争也最为激烈。无论是歪点子还是正点子,大家都想过、试过!——网点要多、位置要好,这有谁不知道?!我们聪明,竞争对手其实也不傻。不能比人更聪明,那比什么?比执行力,比谁先做到! 渠道精耕细作,就是指企业在特定的区域市场,通过整合的营销手段,充分地挖掘市场潜力,对分销商进行培育和支持,提高网点的覆盖率和渗透率,加强网点的生动化管理,并利用广告宣传及促销活动等手段来拉动市场,最终达到分销商主推、终端主推的目的,从而提高市场占有率和品牌影响力,提高企业产品的销售量。 在我们在对市场环境有了一个细致的认识以后,就要根据实际情况对市场进行精耕细作,以便更好地进行市场开发,有效管理经销商,达到产品的销售目标和市场占有率。在具体的操作上,有以下四个重点策略: 一、同经销商建立分销联合体
企业在对区域市场进行市场精耕细作,就必须依靠当地分销商的支持,同时给予分销商各个方面的指导和协助,进行渠道建设,建立关系密切的分销联合体。帮助分销商进行分销和存货管理,建立完善的分销商管理和服务体系。 企业的业务员要对分销商进行管理。业务员要配合经销商作好渠道基础建设和管理,最主要的工作就是经营规划、存货管理、零售覆盖、运输与仓储、售点广告与促销支持这五项工作,企业应明确各项职能在企业和经销商之间的分配,并确定各自的工作重点,才能有效地管理好分销商,共同开拓市场。对于大的分销商,委派客户经理进驻其总部办公,小的分销商则由一个业务人员同时管理几个分销商。 这样做的一个目的是为了同分销商建立起一种关系密切的分销联合体,依靠分销商的渠道网络和分销能力,更好地促进产品的深度分销。 二、终端网点最大化、最优化,密集性分销 市场精耕要求企业必须依靠分销商。分销商在特定的区域市场有广泛的销售网络,网络中含有一定数量的二级分销商和零售商,同时分销商对这些下游网络成员很熟悉,并且要求分销商有仓储和配送能力,分销商可以达到网络覆盖的范围。企业必须依靠这些网络资源,进行密集性分销,让产品到达尽可能多的终端,通过具有高覆盖率和多种渠道并存的分销网络来接近消费者。 在提高网点覆盖率时,企业应注意以下三个问题: 第一,确保网点布局合理。不能盲目追求覆盖广度,在占领市场空白点的同时,应该控制网点的数量,确保单个网点的质量。同时要对网点进行动态管理,淘汰无效网点,提升有效网点,强化形象网点,巩固战略网点,打击竞争网点,建立起合理的网络布局。
成功零售的精耕细作策略 在市场日益成熟、技术与产品日趋同质的背景下,竞争不断加剧,从商品到货币的一跳,似乎越来越惊险,零售终端的重要性日益凸显出来。由于零售商处于渠道的最前沿,与“上帝”的距离最近,因而成为产品流向市场的“守门人”。若零售环节不畅,销售通路就会得上“肠梗阻”,商品价值就无法实现。为此,企业在构建销售渠道时,必须慎重选择零售商,然后通过精耕细作,有效管理,使销售通路畅通无阻。否则,从企业到终端售点的整个分销工作都将成为低效甚至无效劳动。 你的布点适当吗商品的消费者定位与零售商的顾客定位要一致,即什么样的产品进什么样的店。企业借助零售商分销商品,目的就是要把自己的产品打入目标市场,让那些需要企业产品的最终用户方便购买。只有当商品找到与之市场定位趋同的零售商时,目标市场才能被覆盖。否则,企业的分销渠道根本未能延伸至目标市场,就更谈不上占领了。比如,中高价位的产品在便民店铺货或低档大路货进入专卖店,则会导致投资大,见效少,因为这里极少有你的目标消费群。应根据消费者的购买习惯而非产品特性多路并用,以便于顾客购买。 由于目标市场的消费者众多,且消费水平参差不齐,消费习惯各不相同,则有不同的终端服务于不同的细分市场,如果企业只根据产品特性借助于某一种终端来分销产品,就有可能错过整个细分市场,导致目标市场覆盖中的空白,难以达到理想的分销效果。面对零售业丰富的终端形式,企业应该系统和充分地利用它们。如台湾牛津食品公司针对本地渔民这一目标市场,独辟蹊径,利用渔港附近的五金商店推销产品,
大获成功。虽然五金商店所销售的是五金材料,但是它们销售的对象却是渔民。它们是渔船补给品的供应中心,而该公司的产品对渔民说来也正是必需的补给品。通过五金商店经销,不仅能达到将产品推销给渔民,又可方便渔民在同时同地一并解决补给品的采购,一举数得。 确定合理的终端售点密度确定终端售点密度即是确定企业在目标市场利用多少渠道成员来销售产品,从而能最大限度地提高产品分销的效率。终端销售点的密度直接关系着企业分销网络整体布局的均衡状况,如果布点太稀,则不利于充分占领市场;如太密,则可能加大销售成本,而且销售效率可能大大下降,并加剧各销售点的冲突与矛盾。一般地,对于一些大众消费品,宜采用密集分销策略,使产品尽可能地接近目标市场的消费者,扩大市场覆盖率,迅速打开产品的销路;而对于一些选购品或对服务要求较高的专业产品,则宜采用选择分销或独家分销策略,以树立产品形象,谋求企业与零售商长期稳定的合作关系。同时,企业还应结合分销成本、市场覆盖率、企业的控制能力和后勤支持系统的跟进能力等因素综合考虑。 零售商的形象、口碑要有利于企业产品品牌形象的建立,决不能在进入零售商完成销售额的同时,对企业的品牌形象造成损害,只顾眼前利益而因小失大。 把握零售终端管理要诀消费者是在零售点买东西的,如果厂家不能使消费者在零售店里见得到、乐得买,你的产品就永远无法卖出去。终端售点的管理就是要解决两个问题:一是如何让零售店乐得卖,把货铺到消费者的面前,使消费者买得到;二是如何把货铺进消费者的心中,
课前测试 说明:课前测试是测试您对课程内容的初期掌握情况,带着问题参与学习,测试结果不计入考试成绩。判断题 1. 发展区域市场时,一定要了解当地的经济发展水平、产业结构、人均收入情况。此种说法:√ 正确 错误 正确答案:正确 2. 运作区域市场时,只有靠数据加上关键指标去印证,才能得出结论。此种说法:√ 正确 错误 正确答案:错误 3. 了解区域市场当地的生活方式,有助于找到合适的终端和推广方式。此种说法:√ 正确 错误 正确答案:正确 4. 资源是经营好市场和精耕细作的唯一因素。此种说法:√ 正确 错误 正确答案:错误 5. 挣钱的产品流动性较慢,跑量的产品性价比较高,流动性很强。此种说法:√ 正确 错误 正确答案:正确 6. 当区域市场得到有效造势时,就要追求细分产品。此种说法:√ 正确 错误
正确答案:正确 7. 厂家和商家要基于核心经销商规划区域市场的终端和网络。此种说法:√ 正确 错误 正确答案:正确 8. 在市场启动期,要进行梳理渠道、梳理网点,封闭渠道运作。此种说法:√ 正确 错误 正确答案:错误 9. 渠道价格管理有顺价管理和逆价管理两种方式。此种说法:√ 正确 错误 正确答案:正确 10. 产品的设计、定位和开发都是区域经理的职责。此种说法:√ 正确 错误 正确答案:错误 学习导航 通过学习本课程,你将能够: ●发现区域市场存在的机会; ●了解区域市场的基本背景; ●针对区域市场进行策略规划; ●把握区域市场的开发节奏。 区域市场解读与策略规划 一、如何解读区域市场 解读和理解一个区域市场,应该从以下几个方面入手。
1.了解区域市场的基本背景 地域范围和人口统计情况 到一个区域市场,首先要了解其地域范围和人口统计结构、当地的地理面积、行政单位等。比如,一个地级市市区有多少个区域,下面有多少个县,总共有多少家庭数,当地的气候地貌,基础设施情况、交通状况、淡旺季节奏等。 区域经济现状 要了解当地的经济发展水平、产业结构、人均收入情况、消费结构与消费指数等。 地方法律和政策环境 要了解当地政府的法规、政府的导向、政府职能部门的效率。随着市场日趋规范,食品安全也日显重要,很多行业的准入门槛也越来越高。继毒大豆、毒豇豆、毒韭菜和三氯氰胺事件之后,区域市场的管控也越来越严格,如果不考虑当地政策环境和政治环境,就会很难成功运作区域市场。 社会和文化环境 考虑区域市场的社会环境和文化环境,了解当地的风土人情、文化习俗、热点事件等。区域经理如果没有融入此市场,如果没有建立自己的社交圈子和人脉网络,就很难有效处理突发危机事件,尤其要跟政府相关部门、圈内的经销商以及同行建立人脉关系。 2.进行区域市场分析 培养市场感觉 不要简单地认为有了数据就能得出结论。对区域市场进行分析时,必须靠市场感觉和关键指标进行印证,才能得出结论。 中国市场不规范,很多基础数据拿不着,行业数据、统计数据不准确,所以很难从数据中得到结论。可以根据市场直感找到关键的统计因素,这种市场直觉是在长期的市场中获得的经验和感觉。 目标市场规模和潜力 区域经理要混成“地保”,就要深入了解市场,对当地的经销商、门店以及当地发生的事情都非常清楚。 作为区域经理,只有对当地非常熟悉,才会把这市场做好,同时了解背景资料,才能进一步分析市场规模和市场潜力。 【案例】 掌握市场容量和潜力 卖洗发水是按人口数来计算市场规模的,化肥、种子、农药,是按土地面积来计算的。抓住多少地就抓住多少销量,能卖的农药、种子、化肥等,都能测算出来 ——这些产品的市场容量,按当地的耕地面积来测算。 假如是卖饲料,市场规模就要看当地一年能养多少猪,要卖多少猪,有多少猪还未使用你卖的饲料等。把这些情况摸清楚,就知道未来的市场空间就有多大,未 来的发展潜力会在哪里。 从案例可见,只有对区域市场的背景很了解,才能对区域市场的容量和潜力有所掌握。 顾客结构、需求特点与购买行为 作为区域经理,想要对区域市场进行细致的分析,还要了解顾客结构、需求特点与购买行为。 消费结构。区域经理对区域市场的消费结构要清楚:当地消费者的结构,购买者、决策者、咨询者、使用者等都要弄清楚;要弄清楚其需求特点是什么,其消费行为有何变化。
护理查房 时间: 2016-5-19 16:00 主持人:刘丽 地点:内分泌科会议室主讲人:谢盼盼 主题:腺垂体功能减退症 护理查房 (√) 查房形式:个案(√)疑难() 教学() 护理病例讨论:( ) 病例类型:死亡( ) 出院(√)在院( ) 一、查房目的:1、评价责任护士的护理效果,2、了解病人的需要,对护理的工作中存在的问题提出改正意见。3、介绍先进的护理,指导下一步护理工作。二、病例介绍 基本资料:患者,女性,55岁,公务员,因垂体瘤放疗术后18+年,咳嗽咳痰1周,加重伴乏力、呕吐1天,于2016-4-20 12:23入院。 既往有“乙型病毒性肝炎”病史,否认结核、疟疾病史,否认高血压、心脏病史,否认糖尿病、脑血管疾病、精神疾病史,否认外伤、输血史,否认食物、药物过敏史,预防接种史不详。患者于2014年12月8日因尿频、尿痛、纳差、乏力1周第一次入住我院我科。诊断为:1.腺垂体功能减退症垂体危象 2.垂体放疗术后 3.低钾、低钠、低氯血症 4.尿路感染 5.病毒性肝炎乙型慢性,入院后,予补钠、补充糖皮质激素(氢化可的松50mg),“哌拉西林他唑巴坦钠 4.5g Bid”抗感染,“泮托拉唑钠注射液 40mg QD”抑酸护胃等对症支持治疗,曾因发生垂体危象转ICU治疗,予以抗感染、补充激素、维持水电解质平衡、预防应激性溃疡等对症支持治疗后,患者神志、反应能力较前好转,复查电解质示血钠、血氯大致正常,改“醋酸泼尼松片2.5mg*口服*Qd”替代激素治疗,患者病情好转,生命体征平稳,后转入我科,继续予以口服“醋酸泼尼松龙5mg每日清晨顿服”、“左甲状腺素片 25ug 口服每天1次”替代治疗。 体格检查:体温36.3℃脉搏74次/min 呼吸17次/min 血压140/90mmHg发育正常,营养良好,正常面容,神志清楚,精神尚可。 入院诊断: 1.腺垂体功能减退症垂体危象? 2.垂体瘤术后 3.咳嗽咳痰查因:肺部感染? 4.病毒性肝炎乙型慢性 病情及治疗过程:1、完善常规检查。2、告病重,暂予以注射用兰索拉唑护胃、维生素C注射液+维生素B6注射液补液、盐酸氨溴索注射液化痰、注射用哌拉西林钠他唑巴坦钠4.5g静滴Q8h抗感染治疗。