Research Policy 38(2009)338–357
Contents lists available at ScienceDirect
Research
Policy
j o u r n a l h o m e p a g e :w w w.e l s e v i e r.c o m /l o c a t e /r e s p o
l
China’s regional innovation capacity in transition:An empirical approach
Xibao Li ?
Department of Innovation and Entrepreneurship &Research Center for Technological Innovation at Tsinghua University,School of Economics and Management,Tsinghua University,Beijing 100084,PR China
a r t i c l e i n f o Article history:
Received 19January 2008
Received in revised form 3December 2008Accepted 9December 2008
Available online 20January 2009Keywords:Patent
Regional innovation system
Knowledge production function Stochastic frontier model
a b s t r a c t
Drawing upon regional innovation system literature,this paper estimates a stochastic frontier model to explain the increasing disparity in innovation performance between Chinese regions.The estimated results show that government support,the constitution of the R&D performers,and the regional industry-speci?c innovation environment are signi?cant determinants of innovation ef?ciency.Due to the large difference in the ?rms’innovation performance across the regions,when regional innovation modes are transformed from university and research institute dominant to ?rm dominant,the overall innovation ef?ciency between regions becomes more and more disparate,which actually underlies the widening gap in regional innovation performance.
?2008Elsevier B.V.All rights reserved.
1.Introduction
In innovation literature,cross-country comparisons of innova-tion performance focus on the structures and dynamics of national innovation systems and are mainly carried out through compar-ative case studies (Freeman,2002;Lundvall,1992;Nelson,1993).As noted in Liu and White (2001b),however,an aggregate level of analysis at the national level is subject to a great deal of ques-tions and criticism.This is because of the regional and industrial diversity within a nation,especially in transitional and develop-ing economies.Innovation performance varies not only between nations,but also between sub-national regions;such as states or provinces (Acs et al.,2002;Evangelista et al.,2001;Fritsch,2002).For large countries,the national innovation system approach is probably less relevant (Edquist,2005).In the case of China,this is particularly true.As one of the largest developing countries in the world,China’s economy and innovation systems are under transi-tion from the former centrally planned regime to a market-driven system.One prominent feature of the Chinese economy is the increasing variation in development levels between regions.One can even argue that multiple-level “systems”of innovation coex-ist (Tylecote,2006).With this as an initial condition,the concept of a regional innovation system,with a focus on lower levels of economy,seems to be an appropriate lens through which the large variation in innovation performance can be analyzed and compared (Asheim and Isaksen,1997;Cooke et al.,1997).
?Tel.:+861062795443;fax:+861062784544.E-mail address:Lixibao@https://www.doczj.com/doc/9c11286357.html, .
Although remaining open and ?exible,the innovation system approach is often criticized for its vague concepts and unclear boundaries,which bring about many dif?culties,including data collection and the measurement of theoretical constructs,in theo-retically based empirical studies.A lack of correspondence between the theoretical studies and the empirical studies has compromised the rigor and speci?city of this framework.The innovation system approach is therefore usually regarded as a useful analytic tool,but not as a formal theory (Edquist,2005).Recently,Furman et al.(2002),Furman and Hayes (2004),and Hu and Mathews (2005)empirically investigated the disparity in innovation performance between nations in terms of innovation capacity (Suarez-Villa,1990).The eclectic approach they adopted is only partially built on the national innovation system approach.Nonetheless,their analysis demonstrates the importance of integrating conceptual speci?cation and empirical work in clarifying the properties of innovation systems.
This paper will follow this line of empirical research and explore the underlying determinants of innovation disparity at the regional level.More speci?cally,the regional variation in innovation perfor-mance in China during its transition period from 1998to 2005is investigated.This study particularly focuses on the development of innovation and leaves aside two other innovation system func-tions:the diffusion and use of innovation.Following the literature,I take different measures of patent counts as a proxy of innovation output and conduct robust checks.The role of both system compo-nents and institutional links are taken into account in an empirical estimation.
Examining the statistics of Chinese institutional patents,one can ?nd that,since the late 1990s,the number of both patent applica-tions and grants has increased dramatically in China.During the
0048-7333/$–see front matter ?2008Elsevier B.V.All rights reserved.doi:10.1016/j.respol.2008.12.002
X.Li/Research Policy38(2009)338–357339
same period,the distribution of patent counts among regions has become progressively uneven,and disparity in regional patent-ing has become increasingly prominent.One can argue that the increase of R&D sources,in terms of both expenditures and Full-time Equivalent(FTE)Personnel,can at least partly explain the surge in patenting.However,it is unknown what factors are causing the increasingly large variation between regions,since the distri-bution of R&D sources among regions remained almost unchanged during the same transitional period.Within a productivity analysis framework,this study treats patenting as a function of knowledge production and assumes that the change in the behavior of leading R&D performers in?uences the production ef?ciency of innova-tion and patenting.The results show that it is not the uneven increase of R&D input,but the transition of inherent innovation modes,that leads to the large variations in patenting between regions.Innovation modes are the distinct ways in which the leading innovators in a region perform R&D and patenting activ-ity.In some regions of China,the?rms are the major R&D and innovation performers,but in others the universities and research institutes take the lead.The inherent differences in incentives and knowledge bases imply that?rms perform different forms of innovation activities than universities and research institutes.In this sense,each region demonstrates an innovation mode that is determined by the majority of the R&D performers in the region. During the transitional period,many regions have moved from a university-research institute dominant mode to a?rm dominant mode.However,the geographical distribution of R&D input among regions has not changed much,and neither has that of potential patent counts.It is the disparity in innovation production ef?-ciency that has led to the ever-increasing regional concentration of patents.
The conceptual framework and econometric model are funda-mentally different in this study from that of Furman et al.(2002). Many researchers have noticed that the innovation systems in developing economies and transitional economies have quite dif-ferent systematic characteristics from those in developed countries (Hu and Mathews,2005;Gu and Lundvall,2006;Liu and White, 2001b;Radosevic,2002).The very term“transition”is an exact re?ection of these differences.For instance,although?rms are the primary locus of innovation systems in developed countries,this is not so in transitional economies.The conceptual framework devel-oped by Furman et al.(2002),drawing upon Romer(1990),Porter (1990)and Nelson(1993),emphasizes the role of?rms in innova-tion,and is fundamentally not applicable to transitional economies like China.As alluded to above,this study uses a framework of pro-ductivity analysis and does not distinguish between?rms and their counterparts’universities and research institutes in terms of their roles in innovation,since all are major R&D performers in the Chi-nese regions.Furthermore,to incorporate the effect from the main elements and from the links in the innovation system,this study uses stochastic frontier models to identify and estimate their in?u-ence,which is again methodologically different from that of Furman et al.(2002)and Furman and Hayes(2004).
By comparing innovation performance between regions and identifying the determinants of innovation capacity,this paper draws upon and contributes to three streams of research:the regional innovation system,innovation capacity at the regional level,and transitional economies.Furthermore,by focusing on the econometric analysis of innovation ef?ciency,this paper helps to bridge the gap between theoretical work and quantitative analysis, and addresses the researchers’appeals for increasing the rigor and speci?city of the innovation system approach.
This paper is structured as follows:Section2describes the features of China’s innovation capacity at the regional level,and poses the research questions.Section3introduces a conceptual framework and the empirical models.Section4discusses the con-struction of data.In Section5,?ndings and results are discussed in detail.Finally,Section6forms a conclusion.
2.Regional innovation systems in China
To compare innovation performance across regions,it is neces-sary to?rst make a decision concerning the unit of analysis to be used,second put forth a conceptual framework and then further specify an econometric model.In this section,why the provincial-level regions are selected and treated as independent innovation systems is explained,their distinctive features are described,and the research question is further clari?ed.
2.1.Regions as innovation systems
Regional innovation studies show that innovation activities are not evenly distributed spatially and the production of new techno-logical knowledge tend to localize spatially.Since the uncertainty, complexity and tacit form of new knowledge make it transferable only through personal interaction,spatial proximity is instrumental in facilitating interactive learning and knowledge?ow and regional boundaries in?uence the transfer?ow.In this sense,as Fritsch (2002)argued,regional systems of innovation are an adequate approach for analyzing innovation activities.
No matter how dif?cult and controversial it is to specify the boundaries of regional innovation systems,the concept of a regional innovation system is very useful for helping researchers formu-late hypotheses and conjectures.In this paper,30administrative provincial-level regions1were chosen as the unit of analysis.The decision was based on the following considerations(see also T?dtling and Kaufmann,1999).
First,provinces in China are administratively and economically independent geographical regions.Since the open-door reform, provincial governments have gained autonomy for formulating eco-nomic and social development policies(Gu and Lundvall,2006;Liu and White,2001b).Although all are subject to the same legal and political institutions that are under the control of the central gov-ernment,each has its own governance rules.Technology policies and innovation plans have strong regional features.
Second,the dialect,customs,conventions and cultures have both local and regional characteristics.People living within a province usually share the same spoken language(dialect)and culture.Dur-ing the long history of China,each region has developed and formed its own distinctive historical,cultural and geographic features. Arguably,this“social capital”is locally embedded and in?uences the evolutionary processes of innovation in a region.
Finally,the mobility of labor is restricted and limited between provinces in China.Due to the strict regulations on registered permanent residence under the central-plan regime,the Chinese people were not allowed to work or live outside their registered permanent residence.Although this regulation has been gradually lifted during the process of reform,tacit knowledge and social capi-tal developed in the past are strongly tied to regions,and can only be accessed within a particular region.Moreover,the mobilization of labor forces happens more often from within,rather than between provinces.
Based on these considerations,the high degree of“coherence”and“inward orientation”at the provincial level justi?es the valid-
1Here an administrative unit is a province,a municipality or an autonomous region.Since Hong Kong,Macao,Taiwan and Tibet differ in their economic con-ditions from most of the other regions,and since information from these regions is not available,I exclude them from the analysis and thus only30regions have been included.In the following,I will refer to the administrative units as regions and do not make distinctions between provinces,municipalities,and autonomous regions.
340X.Li /Research Policy 38(2009)
338–357
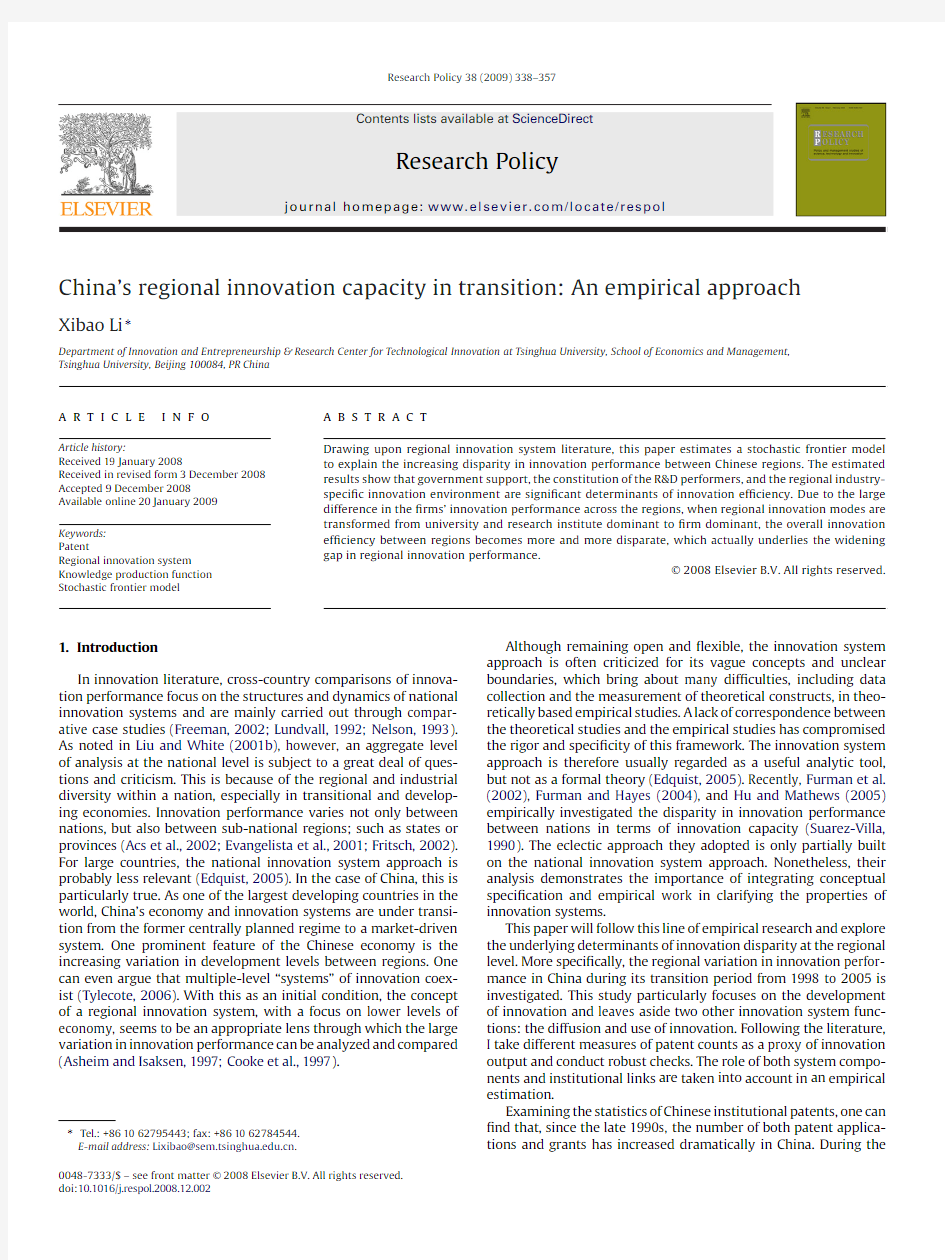
Fig.1.The trend of innovation activities from 1998to 2005.
ity of treating regions as relatively independent innovation systems (Edquist,2005).Each region constitutes an innovation system,which in turn constitutes an important part of the national inno-vation system in China (Chung,2002).In addition,the use of administrative regions as the unit of analysis has at least three advantages.First,from a practical perspective,comparable datasets covering innovation indicators are easily compiled for these sys-tems;thus making an empirical comparison between regions possible and reliable.Second,using administrative regions as the unit of analysis provides an applicable and comparable framework.Although organization categories may have different meanings in different national contexts in terms of the range of activities they undertake,they are usually the same within the same country.It is reasonable to compare the role of these organizations and their links between regions.Furthermore,institutional factors deter-mined at the national level can be ignored when comparing regional variation.For example,the legislation system for intellectual prop-erty rights is uniform across the country and so the in?uence of IPR need not be considered.Patent application costs and procedures are also the same and controlled by the same patent system ensuring comparability when using patents as innovation indicators.2.2.Features of China’s regional innovation systems
As one of the largest transitional economies,China has experi-enced a dramatic change in its innovation system.At the regional or provincial level,Chinese regional innovation systems share sev-eral prominent features that are typically found in developing or transitional countries.
First,the late 1990s and the early 21st century witnessed a rapid increase in R&D and innovation activity in China.With respect to invention patents,a domestic Chinese patent that represents the most technologically sophisticated innovation output,both the number of patent applications from non-individual organizations and the number of grants given to non-individual organizations increased by more than 10times from 1998to 2005.In the year 1998,the beginning of our study period,the total number of non-individual invention applications and grants were 3958and 918,respectively (Fig.1,panel a).By 2005,however,these numbers had increased to 54,088and 12,635,respectively.Regarding ?nancial sources and human capital devoted to R&D activities,the expan-sion was also dramatic.For example,total R&D expenditure in China increased from 48.6billion in 1998to 231billion (1998RMB value)in 2005,while the total amount of FTE R&D personnel almost dou-bled during the same period (Fig.1,panel b).
Second,many organizations are involved in innovation and R&D performance in regions undergoing transition.These main inno-vators include not only ?rms,but also universities and research institutes.In the innovation systems of developed economies,?rms are considered as the primary locus of innovation and all other types of organizations and institutions are treated as peripheral elements.In China,the case is almost the opposite (Liu and White,2001b ).Table 1lists the ?rms’share in R&D input and innovation output measured by applications and grants of two types of domes-tic patents:inventions and utility models.From this table,it is quite evident that ?rms are not the only R&D performers and innova-tors in a region.In terms of FTE R&D personnel,?rms are not even the most important performers.Universities and research institutes dominate ?rms.It is only recently that ?rms have begun to take the leading position in R&D spending.Though ?rms are active in patent applications,accounting for about 60%of the total amount of institutional inventions,they are still behind universities and research institutes regarding invention patent grants.As the transi-tion progresses towards the end,?rms can be expected to become the dominant innovators and R&D performers in the future.This has been clearly proclaimed in the Chinese government’s long-term science &technology development plan.Structural changes in inno-vation systems seem to be common during the catch up process in late-comer economies (Kim,1997;Freeman,2002).However,for the moment,the multiple-innovators feature during the transi-tion phase has to be taken into account when comparing regional variations in innovation performance.
Third,dual innovation “systems”co-exist in transitional China.As argued by Tylecote (2006),transitional countries usually have a dual technology system.One is an upper level innovation system which mimics its counterpart in developed economies and focuses
X.Li/Research Policy38(2009)338–357341
Table1
The share of innovation activities performed by?rms.
Year R&D Applications Grants
Expenditure Personnel FTE Invention Utility model Invention Utility model
(1)(2)(3)(4)(5)(6)
199840.5545.7547.1776.6517.6571.14 199941.6342.6352.9379.3825.1375.62 200039.4935.6662.4281.1533.1279.93 200142.3941.2054.4382.6237.2680.09 200243.2140.3657.4883.8639.8882.74 200346.1444.9056.6582.6843.5282.67 200448.5538.0359.1682.6043.4182.48 200551.0444.4559.9382.6245.1082.13
Note:The remaining share is attributed to universities and research institutes.
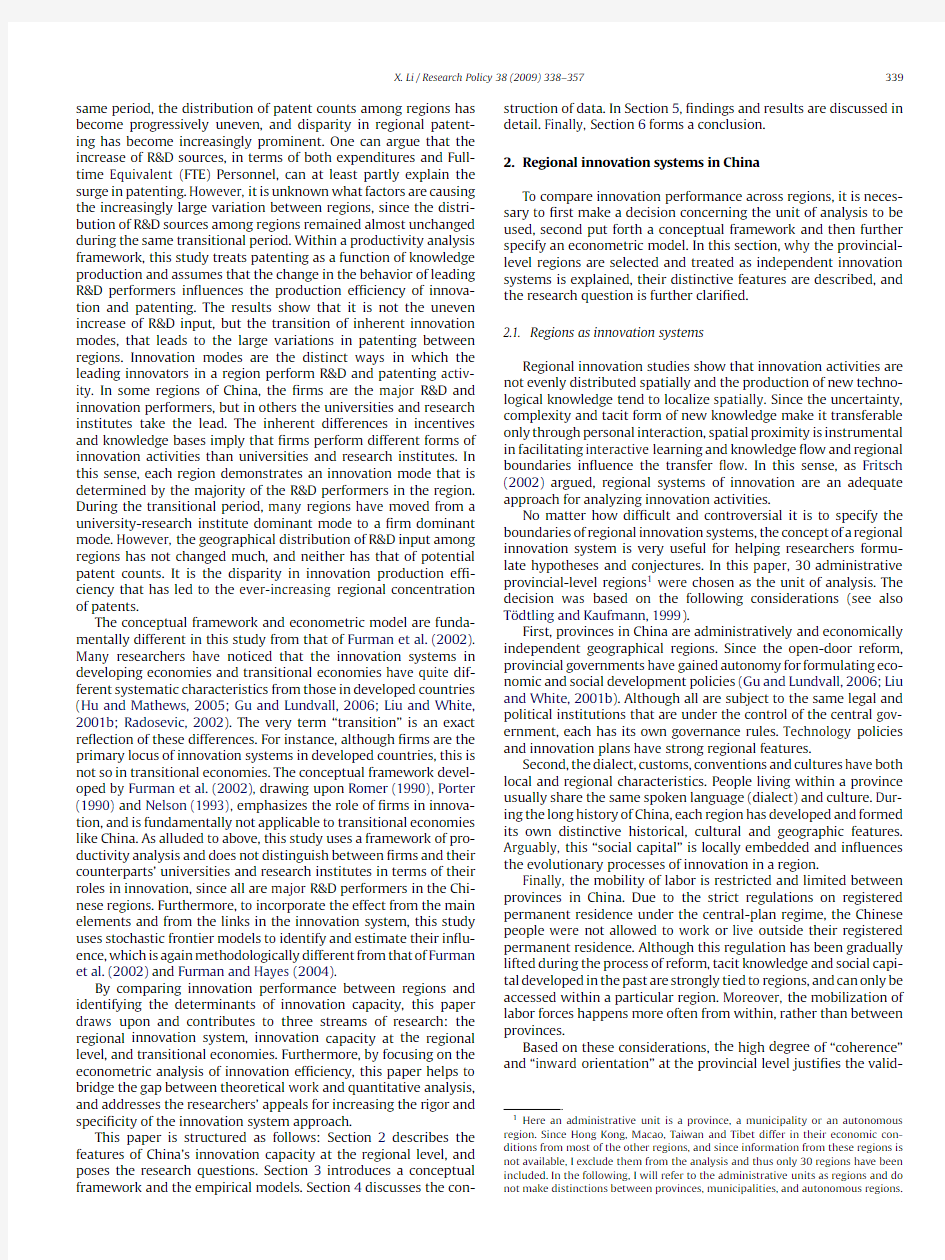
on the development of advanced technology.The other is a lower level innovation system which has its roots in locally embedded industries,such as agriculture and traditional technology?elds,but is more important for the development of local economies.During the catch-up or transition process,overall economic and innovation performance depends largely on how a country coordinates the two system levels.The feature of duality is evident in most of China’s regions.Panel(a)of Fig.2depicts the regional distribution of gross output shares contributed by the1st primary industries,including agriculture,?shery and forestry.For most regions in China,indus-trialization is far from https://www.doczj.com/doc/9c11286357.html,pared to developed countries, regions in China have too much output from the primary industries. On the other hand,high-tech industries account for a relatively large proportion of the total industrial output in some regions (Fig.2,panel b).This exactly illustrates the so-called co-evolution of high-tech industries and primary industries in China’s regional innovation systems.When comparing their innovation and R&D performance,it is wise to take this duality into consideration.
Last but not the least,one of the most noteworthy features of transitional Chinese innovation systems is an increasing variation in regional innovation performance.With the rapid economic devel-opment in China,innovation output has become progressively more concentrated into a few highly innovative regions.Fig.3below plots the cumulative proportion of non-individual inventions against the rank of regions ordered by the number of invention patents.For example,in1998,the most innovative?ve regions accounted for about half of the total invention applications in China.By2005, over two thirds of the total applications came from the?ve most innovative regions.During the same7years,the share from the top ten regions increased from72%to84%(Fig.3,panel a).With respect to invention patent grants(Fig.3,panel b)a geographical agglomer-ation trend also existed,although not so remarkable as in the case of invention patent applications.As a result,the most innovative 10regions accounted for more than80%of the invention grants in 2005,with less than20%coming from the remaining20regions. Such a large disparity in innovation is by no means contingent and de?nitely warrants an in-depth analysis.
However,somewhat surprisingly,the degree of geographical agglomeration in R&D activities,in terms of both R&D spending
and
FTE R&D personnel,remained almost unchanged during the tran-
sition.From1998to2005,the share of total R&D spending from
the?ve largest and10largest performance regions was about53%
and76%,respectively(Table2).With regard to FTE R&D person-
nel,the contribution from the top?ve and10regions also did not
change much.Thus,one may wonder what factors are underlying
the large variation in innovation performance between regions.If Fig.2.The structure of China’s regional innovation system.
342X.Li /Research Policy 38(2009)
338–357
Fig.3.The cumulative proportion of invention applications and grants.
a rapid increase in R&D input can lead to a surge of innovation in terms of patent counts,why has the even increase in R&D spend-ing and personnel among regions not induced an even increase in patents?Since all regions are subject to the same patent laws,why have the patenting activities become more and more concen-trated while at the same time the geographical distribution of R&D activities changed so little?
Solving this puzzle is the main purpose of the empirical analyses in this paper.It could be argued that innovation or patent produc-tion ef?ciency varies between the regions and that the difference in innovation or patenting ef?ciency leads to the large variation between regions.In other words,R&D input is not the only deter-minant of innovation performance,as Furman et al.(2002)have shown.Changes in institutions and policies are responsible for the resulting disparity between regions.To go further,this paper argues that the redistribution of innovation activities between major orga-nizations (?rms,universities and research institutes),during the transition process,prompted the variation in innovation ef?ciency,
Table 2
Cumulative proportion trend contributed by the largest R&D performers.N
1998
1999
200020012002200320042005R&D expenditures 10.210.200.170.160.170.160.160.1620.310.310.290.300.290.280.270.2730.390.400.380.380.380.380.380.3740.460.470.460.470.470.460.460.4550.530.530.520.530.530.520.540.53100.760.760.74
0.76
0.76
0.76
0.76
0.76
R&D FTE personnel 10.120.120.11
0.100.110.100.130.1320.200.200.180.190.200.200.220.2230.270.270.260.270.280.280.300.3140.340.340.330.340.350.360.360.3750.400.400.400.390.410.410.420.43100.650.66
0.650.640.670.660.660.66
Note:The ?gures in the table represent the cumulative proportion of R&D input contributed by the ?rst n regions ranked according to the amount of R&D input.
which in turn brought about the large gap in regional innovation performance.
3.Conceptual and empirical approaches
While investigating the differences in innovation performance between countries,Furman et al.(2002)based their empirical anal-ysis upon a conceptual framework drawing upon the endogenous growth theory (Romer,1990),the theory of industrial competitive advantage (Porter,1990),and the theory of national innovation sys-tems (Nelson,1993).However,as already argued,the structures of innovation systems in transitional economies are inherently different from those in developed countries.The underlying strat-egy for a transitional economy is more inclined to be to catch up with the advanced economies rather than to build up their own industrial competitive advantages.Most innovations in transitional economies are “new-to-the-market”or “new-to-the-country,”but not “new-to-the-world.”Firms,one of the most important orga-nizations performing R&D in advanced economies,have not yet become the focus of innovation in most Chinese regions,and usu-ally devote more effort to manufacturing and marketing capabilities than to innovation capability.Therefore Porter’s theory of industrial competitive advantage is less relevant here than in OECD coun-tries.The conceptual framework adopted in national innovation capacity studies cannot be applied to the Chinese context without customization.Instead,this paper argues that the structural compo-sition and the relations between major organizations are important for determining regional innovation performance in a transitional innovation system,and the regional innovation system approach offers a theoretical framework from which an empirical analysis can proceed.
3.1.Conceptual approach
The core of this analysis is the notion of a knowledge pro-duction function.Following the literature on idea-driven growth models (Jones,1995;Romer,1990),one can assume that an idea-
X.Li/Research Policy38(2009)338–357343
generating sector exists in the economy and produces the new ?ow of knowledge that affects economic growth.The rate at which new knowledge is produced depends on the R&D resources(human and?nancial capital)devoted to the knowledge generation process and the historical stock of knowledge(previously generated ideas). Together they contain the most important investments for impact-ing all innovation-oriented sectors in a region.Without regard to sources,these investments pooled together determine the potential for innovation output in a region,that is,the frontier(or the largest possible)value of the knowledge production function.The extent to which the potential for innovation supported by these investments is translated into actual innovative output is the so-called techni-cal ef?ciency of knowledge production,or innovation ef?ciency.It is arguably related to the organization and distribution of innova-tion related activities,that is,the speci?c source of investments and the disparate innovative behavior of R&D performers.In this sense, who conducts how much R&D activity and how innovation actors interact affect the level of innovation ef?ciency,and take part in determining aggregate innovation performance.
In previous studies on national innovation capacity,Furman et al.(2002,p.906)argued that,“...a strong cluster innovation environment can amplify the strengths of the common inno-vation infrastructure,and a weak one can sti?e them.”This is actually a technical ef?ciency and productivity point of view; although they have not incorporated this view in their empir-ical analysis from a methodological perspective.Their point of view claims that a cluster-speci?c innovative environment has an impact on innovation ef?ciency and R&D productivity.Without denying the importance of regional industry or market structure, the present study goes further to emphasize the impact of struc-tural components and their relations on innovation ef?ciency in transitional innovation systems.For this purpose,the innovation system approach is conceptually very helpful.
In the innovation system literature,components and relations between the components are commonly regarded as two con-stituents that together form a coherent system(Carlsson et al., 2002;Edquist,2005).One major component of an innovation system is the formally structured and deliberately created organi-zations including,?rms,universities,research institutes,?nancial institutes responsible for innovation?nancing,and government agencies responsible for innovation policy and industrial regu-lations.Although they have quite different purposes,they are all major innovation actors or players.The other component is the institutional component including norms,routines,laws,and rules of the game,which are instituted to coordinate and reg-ulate relations and interactions between individuals,groups and organizations.Some important institutions in?uencing innovation activities include patent laws,tax laws,industrial policies and environmental and safety regulations.Despite the nature of these institutions to vary over time,which allows them to undergo dra-matic changes in a transitional system,they are normally set at the nation level and are constant between regions.Hence,institutional differences are not so much relevant in regional comparisons within the same national context.One can reasonably assume that it is the constitutional differences of innovation actors and the relations between these organizations that in?uence the technical ef?-ciency of knowledge production in the Chinese regions.However, cross-regional structural differences may evolve as institutions change.
Speci?cally,according to this framework,the following factors are,among others,regarded as critical in determining the realized level of innovation potential:
(1)The innovation effort contributed by each of the major innova-
tion actors including?rms,universities,and research institutes.(2)The interactions between?rms,universities and research insti-
tutes in the innovation process.
(3)The support from government agencies and?nancial institu-
tions.
(4)The interaction between knowledge users(regional or national)
and producers in the innovation process.
(5)The interaction between local innovation actors and innovation
actors from other nation’s innovation systems.
(6)The region-speci?c industrial structures or innovation environ-
ments.
A conceptual framework formulated in this way is consistent with the previous studies on Chinese innovation systems.Accord-ing to innovation system theory(Lundvall,1992;Nelson,1993), various organizations–?rms,universities,research institutes,gov-ernments–interact with institutions and policies and with one another in a systematic way and jointly contribute to the build-up of innovation capacity.In the transitional context of China,Liu and White(2001b)noticed that economic reform has had a far-reaching in?uence on the distribution of innovation-related activity among organizational bodies and the mechanism for coordinating actors and activity in the innovation process.They maintained that the changes in organizational boundaries around innovation activities, as well as the incentive structure and capabilities of the innovation actors,are the most important and fundamental issues in transition. This view substantiates the notion that the structures and dynam-ics of regional innovation systems have an important impact on innovation ef?ciency in China.
In order to incorporate structural components and dynamic rela-tions into the above-mentioned knowledge production function framework,it is assumed that the innovation effort contributed by disparate organizational types and the links between them affect the level of innovation ef?ciency,while region-wide innovation investment including R&D input and previous knowledge stock determines the frontier value of the knowledge production func-tion.The frontier values and the ef?ciency-level values together provide the values for innovation performance measures.
3.2.Econometric models
Taking the approach that innovation is a knowledge production process and referring to the literature on productivity analysis,a stochastic frontier model is proposed in this study to empirically analyze the evolution of regional innovation capacities.
Aigner et al.(1977)and Meeusen and van den Broeck(1977)are among the?rst to propose the stochastic frontier model.This model is well suited for analyzing and evaluating inef?ciency within a pro-duction process and has become a commonly used econometric technique for productivity analysis(see,for example,Battese and Coelli,1995;Kumbhakar et al.,1991).In order to encapsulate both the time-variant and time-invariant variables,the model speci?ca-tion is interpreted as follows:
y it=x it?+εit andεit= it? it,(1) it~N(0, 2 ),
it≥0, it~TN(u it, 2u),u it=z itˇ.(2) Here it is an independent,identical,normally distributed mea-surement error and it is a non-negative inef?ciency error which follows a one-sided normal distribution truncated at0.y it is a mea-sure of new knowledge?ow in region i at year t.x it is a vector of input factors determining the deterministic frontier value of the knowledge production function.x it may include the constant term and region or year dummies.u it is the mean of inef?ciency error and
344X.Li/Research Policy38(2009)338–357
Table3
De?nitions and sources of variables.
Variable De?nition Source Dependent variables
Log AINV The number of non-individual invention patent
applications(in logarithm scale)Annual Report of Patent Statistics(ARPS)by State Intellectual Property Of?ce of China: 1998–2005
Log AUM The number of non-individual utility model
patent applications(in logarithm scale)
ARPS:1998–2005
Log GINV The number of non-individual invention patent
grants(in logarithm scale)
ARPS:1998–2005
Log GUM The number of non-individual utility model
patent grants(in logarithm scale)
ARPS:1998–2005
Input factors
Log RNDP FTE R&D personnel(in logarithm scale)China Science&Technology Statistical
Yearbooks(CSTSY):1999–2006
Log GDPPC Per capita GDP at regional level adjusted by the
real growth rate to1998level(in logarithm
scale)
China Statistical Yearbook(CSY):1999–2006
Ef?ciency factors
UNIVINS Percentage of total R&D expenditures spent by
universities and research institutes(%)
CSTSY:1999–2006
LINK Share of university and research institute S&T
funds raised from?rms(%)
CSTSY:1999–2006
GOV Share of regional?nancial revenue spent on
local Science&Technology activities(%)
CSY:1999–2006
BANK Share of Science&Technology(S&T)funds
from?nancial institutions(%)
CSTSY:1999–2006
TECHMKT Total value of technology contracts normalized
by number of S&T Personnel and CPI-adjusted
to1998constant value(in logarithm scale)
CSTSY:1999-2006
TSI Trade Specialization Index(between?1and1)CSY:1999–2006
LIGHT Percentage of gross industrial output from light
industries(%)China Statistical Yearbook on Industrial Economy:1999–2006
HITECH Percentage of gross industrial output from high
technology industries(%)Chinese Statistical Yearbook on High Technology Industry:1999–2006
is determined by a vector of ef?ciency factors z it,which may or may not contain variables in x it.?andˇare two vectors of parameters of interest to be estimated.
Unlike in ordinary linear regression models,the measure-ment errorεit(= it? it)in(1)consists of both a random term it and an inef?ciency term it.The random term it re?ects the analyst’s observation error and arises from the idiosyncratic region/year-speci?c technology shocks which are unrelated to both the ef?ciency in innovation activity and the determinants of pro-duction frontiers.The inef?ciency term it represents the level of inef?ciency and measures the extent to which the actual output deviates from the production frontier.Here,the actual frontier value
y?it in(1)is stochastic,since it is dependent not only on input fac-
tors x it,but also on the random observation error it:y?
it =x
it
?+v it,
with x
it ?being the value of the deterministic frontier.
Consistent with the majority of prior works(Furman et al.,2002; Furman and Hayes,2004;Hu and Mathews,2005;Jones,1998),this study uses a log–log speci?cation,and variables(y it,x it,and z it) are expressed either in a logarithm form or in a ratio.This treat-ment makes the estimation less sensitive to outliers and estimated coef?cients have a nature interpretation in terms of elasticities. Moreover,the innovation ef?ciency,de?ned as the technical ef?-ciency of knowledge production,can be interpreted as the ratio of realized outputs to potential outputs.That is,
TE it=exp(? it)=exp(y it?y?it)=Y it/Y?it,(3)
where Y it and Y?
it represent the observed value and the stochastic
frontier value of innovation output measured in the original scale, respectively.The estimate of TE it tech can be obtained from the residuals as follows(Kumbhakar and Lovell,2000):
TE it=E{exp(? it)|εit}.(4)
It is noteworthy that the difference between this model and the model in Liu and White(2001a)and Furman et al.(2002)is that ef?ciency factors in this model do not enter the econometric equation in a linear form.Rather,they are assumed to affect the realization of innovation potential indirectly in a non-linear way, i.e.,they determine the conditional mean u it of inef?ciency error it.This speci?cation makes a distinction between two groups of variables,input factors x it and ef?ciency factors z it,and the effect of factors in each group can be separately identi?ed and estimated. As far as ef?ciency is concerned,this model is also compatible with the argument that innovation actors in a system are not operating optimally but“X-ef?ciently”(Niosi,2002).
Methodologically,if inef?ciency exists,the estimate of inter-cept would be biased in an OLS equation.Discussions about R&D productivity based on intercept changes are not warranted. In his estimation of interregional knowledge functions,Fritsch (2000)interpreted the difference in estimated slopes of R&D inputs as re?ecting the regional innovation productivity.His approach ignored the effect of important ef?ciency factors and actually treated the determination of ef?ciency as unknown.The method-ology adopted in this study can not only give an unbiased estimate of the inef?ciency level,but also identify the separate effects of each ef?ciency factor,thus allowing a comparison of the innovation ef?ciency between regions.
4.Data and summaries
To estimate the stochastic frontier model,I constructed a dataset covering30provincial-level regions in China from1998to2005. The data are constructed from of?cial statistics published in various series of statistical yearbooks,including China Statistical Yearbook, China Science and Technology Statistical Yearbooks,and China Statistical Yearbook on Industrial Economy,Chinese Statistical Year-
X.Li/Research Policy38(2009)338–357345
Table4
Descriptive statistics of variables.
Variable N Period T Mean Std.Dev.Min Max
Dependent variables
log AINV2401998–2005 5.396 1.490 2.3989.191 log AUM2401998–2005 5.728 1.4860.6938.861 log GINV T+31501998–2002 4.439 1.415 1.0997.962 log GUM T+12101998–2004 5.544 1.452 1.0998.388
Explanatory variables
Input factors
log RNDP2401998–20050.732 1.117?2.467 2.839 log GDPPC2401998–2005?0.1750.559?1.469 1.475
Ef?ciency factors
UNIVINS2401998–200536.44217.584 6.79891.902 LINK2401998–200513.1218.3080.18738.462 GOV2401998–20050.9790.5360.118 2.693 BANK2401998–20057.899 4.2670.00323.369 TECHMKT2401998–20050.482 1.047?4.042 2.958 TSI2401998–20050.1540.249?0.5650.763 LIGHT2401998–200532.05212.954 5.77867.052 HITECH2401998–20059.4658.2760.33337.916
book on High Technology Industry,and Annual Report of Patent Statistics.Table3gives the de?nitions and sources of variables used in this empirical analysis.The descriptive statistics are summarized in Table4.
4.1.Measuring the innovation output
To measure and compare the innovation performance between regions,this paper employs the number of domestic patents as a proxy for the level of commercially valuable innovation output.It is used in the estimation as the dependent variable re?ecting the level of new knowledge?ow.
Measurement issues arising from equating patent counts with the level of innovation activity have been widely documented in the literature(Archambault,2002;Archibugi,1992;Griliches,1990; Pavitt,1988).It is well recognized that patent data can neither represent all important technological innovations nor re?ect the importance of different innovations.In empirical literature,a few alternative indicators of innovation output have been proposed and used,such as new product sales(Liu and White,1997),changes in?rm-level stock market value(Pakes,1985),literature-based innovation counts(Acs et al.,2002),the number of new products (Fritsch,2002)and the number of patent citations(Trajtenberg, 1990a,b).Unfortunately,however,these indicators are associated with similar pitfalls and subject to even more criticism(Li,2006). Thus,due to its availability and reliability,patent data remains one of the most popular sources from which various indicators can be constructed.
A recent check of compatibility among multiple indicators has further con?rmed the usefulness of patent information in mea-suring innovation output(Acs et al.,2002;Hagedoorn and Cloodt, 2003)and in regional innovation studies(Evangelista et al.,2001). In this comparative study,since regions are subject to the same national patenting laws,processing costs and procedures;the use of domestic patents does not involve source bias as corrected by using international patents in Furman et al.(2002)and Hu and Mathews (2005).Variables based on Chinese domestic patent data are com-parable between regions and thus constitute consistent measures of technologically and economically signi?cant innovations.
Domestic patent data have been systematically collected by the State Intellectual Property Of?ce(SIPO)of China for over20 years and constitute a rich dataset.Two important characteris-tics associated with Chinese patent data are worth special notice. First,domestic patents in China are classi?ed into three categories: inventions,utility models and designs.These three patent types are very different in terms of economic value,technological impor-tance and resource commitment.Inventions represent the most technologically sophisticated innovation output and are“new-to-the-world.”Utility models are less innovative than inventions from a technological perspective,but nonetheless are at least“new-to-the-country.”Designs contain the least of technological content and mainly re?ect super?cial novelty.The variation of patent quality across these three categories is remarkable.The extent to which a patent represents innovation output depends on which type of patenting information is used.Hence,it is wise or appropriate to compare regional innovation performance with respect to speci?c patent categories.In addition,among Chinese domestic patents,a large amount of patents are applied for by and granted to inde-pendent applicants(see,for example,Table3in Li,2006),which measures the contribution to regional innovation capacity by indi-vidual residents within a region.However,the data on R&D efforts contributed by these non-institutional innovators is unknown.In view of these characteristics,this study focuses on technologi-cally important institutional innovations only,and considers two categories of patents:inventions and utility models.In order to moderate the effect of time lag on the results,both the number of institutional patent grants and the number of institutional appli-cations are analyzed separately.
Since it takes time to process and approve patent applications, the time lag is another issue associated with using patent data.In China,it usually takes about3years for an invention patent appli-cation to be approved,while utility model patent applications can be approved within one year.In addition,a time lag exists between R&D efforts and innovative ideas.To check the robustness of the estimates,this analysis considers two time-lag speci?cation scenar-ios.In the short-lag scenario(Scenario1),no time lag is considered for invention and utility model patent applications.But a3-year time lag is used for invention patent grants and a1-year time lag is used for utility model patent grants.In the long-lag scenario(Sce-nario2),a1year time lag is used for both invention and utility model patent applications.A4-year time lag is used for invention patent grants and a2-year time lag is used for utility model patent grants.
4.2.Input factors
According to the conceptual and empirical framework discussed above,explanatory variables in this analysis are classi?ed into two groups:input factors and ef?ciency factors.They are classi?ed on the basis of their relationship with the knowledge production pro-cess.Speci?cally,in a regional innovation system,the?ow of R&D resource commitments(including both?nancial and human capi-tal)and the accumulated knowledge stock are considered as direct input factors to the process of knowledge production.
Although it is customary to include both?nancial and human capital in the estimation of production functions,only the measure of human capital,total FTE R&D personnel(log RNDP),is contained in the core knowledge production function of Eq.(1),because of the high correlation between these two variables.For instance,within the sample period,the coef?cient between logged-scaled FTE R&D personnel and R&D expenditure is as high as0.9522.
With regard to knowledge stock,two alternative indicators are proposed in previous works,e.g.Furman et al.(2002).One indicator is per capita GDP which captures the ability of a nation or a region to explore and realize the economic value of its knowledge stock. The other indicator is patent stock de?ned as the sum of patents from the start of the sample period until the year of observation. Since domestic patents have experienced a surge in recent years, this measure of knowledge stock is dominated by patent counts in recent years and is highly correlated with the value of FTE R&D personnel and R&D expenditures.To avoid the strong collinearity in the core knowledge production function,the possibility of using
346X.Li/Research Policy38(2009)338–357
patent stock is not explored here.Only regional per capita GDP is used as a proxy of regional knowledge stock.
To sum up,this analysis employs total FTE R&D Personnel (log RNDP)and per capita GDP(log GDPPC)at the regional level to measure two main determinants of the new knowledge production frontier:the overall level of human capital devoted to innovation activity and a region’s knowledge stock.These are part of what Furman et al.(2002)called common innovation infrastructure.Dur-ing the sample period,the value of both variables has increased in almost all regions.
4.3.Ef?ciency factors
Although changes in structure and changes in dynamics of regional innovation systems are both regarded as critical factors affecting the realization of innovation potential,direct measures of structure and dynamics are not available.Ef?ciency factors are dif-?cult to quantify and construct;especially because of the subtlety of the concepts and the lack of data.In order to measure key con-structs in a comparable way,one has to trade off some of the rich details of the innovation systems.To address these challenges,this particular analysis employs intermediate measures that capture the ?nancial?ow between organizations as rough proxies for dynamic links between innovation actors.
4.3.1.Innovation efforts by each of the innovation organizations: UNIVINS
Firms,universities and research institutes are major innovation actors and R&D performers and are directly involved in the process of knowledge production.They are carriers and producers of new knowledge and innovation output.Due to the considerable differ-ences in organizational goals,structures and operating practices, the ef?ciency with which each type of actor conducts innovation related activities and engages in active learning varies remark-ably(Mowery and Sampat,2005).The share of activity undertaken by the different actors affects the innovation performance at the aggregate level.To capture the distinct role of universities and research institutes in the innovation process,a variable UNIVINS is included in the vector of ef?ciency factors.It is constructed as the ratio of intramural R&D expenditure spent by both universities and research institutes to the total regional R&D expenditure and acts as a proxy for the structural composition of innovation actors. For the purpose of simpli?cation,this paper does not make a fur-ther distinction between these two types of organizations.Since the share of R&D expenditure by?rms is just one minus UNIVINS, including this factor in the estimation amounts to a comparison of disparate effects on R&D productivity from?rms,universities and research institutes.
In1998,the?rst year of the sample period,UNIVINS ranged from 16.9%to91.9%,and almost92%of the R&D expenditure in Beijing was controlled and spent by the universities and research institutes. During the transition period,the share of R&D activity contributed by?rms continued to grow in most regions.By the end of the sample period,the values of UNIVINS had fallen to between6.8%and70.6%, which indicates a strengthened position for?rms in most regional innovation systems.
4.3.2.Interactions among major innovation actors:LINK
In innovation systems,interaction between organizations is very common and is important to their pursuit of innovation(Edquist et al.,2002;Etzkowitz and Leytesdorff,1997).Interactive learning between?rms,universities and research institutes has a critical impact on innovation processes and performance(Cohen et al., 2002;Lundvall et al.,2002).Recognizing the importance of this link between innovation actors,a new variable LINK has been con-structed to measure the interaction between?rms,universities and research institutes.It is de?ned as the proportion of Science&Tech-nology(S&T)funds raised by universities and research institutes from?rms.It is noteworthy;however,that the variable LINK con-structed in this way may not be able to incorporate the effect of personnel mobility between two categories of actors,which is also critical in generating new knowledge.
Within the whole sample period,the value of LINK was dispersed from less than1%to more than30%.Its geographical distribu-tion pattern shows that interaction between innovation actors is stronger in eastern regions and weaker in western regions.
4.3.3.Support from government and?nancial institutions:GOV
and BANK
In the catch-up stage of late-comer economies,government agencies play an indispensable role.They not only contribute important institutions,including laws and innovation policies for regulating and coordinating innovation activities between the inno-vation actors,but they also provide direct?nancial support or research grants to the innovation actors.They are often actively involved in guiding and allocating the limited R&D resources into speci?c industries where technological advances and knowledge diffusion are regarded as critical(Amsden,1989;Amsden and Chu, 2003;Etzkowitz and Leytesdorff,1997;Gerschenkron,1962;Kim, 1997;Liu and White,2001b;Suzuki,1994).Policies formulated by the government create a macroeconomic environment in which innovation activity operates,which in turn directly and indirectly affects the process of innovation.R&D activity and projects funded by the government have speci?c purposes and features,thus affect-ing both the quality and quantity of innovation output.In this analysis,the share of local?nancial revenue spent on S&T activity by the regional government is included as a measure of the strength of the government’s resource commitment,denoted by https://www.doczj.com/doc/9c11286357.html, measures the relative importance of S&T activity in the regional government’s budget allocation process and a higher value of GOV indicates stronger?nancial support for regional innovation.
Among all of the regions in China,less than3%of the regional ?nancial revenue is guided and allocated to S&T activities which may or may not be actual R&D activity.Surprisingly,Shanghai,one of the most developed regions,has the least value of GOV–less than 0.2%–while its adjacent neighbors,Zhejiang and Jiangsu,both have much higher values.
Financial institutions and banking systems are other support agencies which may affect the innovation and catch-up rate.Their importance has long been discussed in innovation literature and has been recognized in the recent catch up experiences of East Asian countries(Kim,1997;Perez,2002;Schumpeter,1996;Sullivan, 2005).In order to take into account the role of?nancial institu-tions,the total share of S&T funds borrowed from banks or other ?nancial institutions(denoted by BANK)is added into the vector of ef?ciency factors as a measure of the extent to which the?nancial institutions support innovation activity.
For most regions in China,the major portion of region-wide S&T funds is raised from?rms and the government,and the funds that are raised from banks account for less than10%.Nonetheless,in a couple of western regions,this proportion is more than20%,indi-cating the relatively important role played by?nancial institutions in innovation activity in the relatively poor regions.
4.3.4.Interaction between local producers and users of knowledge:TECHMKT
The interaction between knowledge users and producers promotes an exchange of technological information between inno-vation agents,and plays an important role in the success of innovation characterized by interactive learning(Lundvall,1988, 1992).A lack in this type of interaction is one of the major rea-sons for an inadequate transfer of technology exploitation in the
X.Li/Research Policy38(2009)338–357347
Chinese innovation system under the centrally planned regime. Prominent in the early stage of China’s S&T system reform,a tech-nology market solution was proposed as a diffusion mechanism to promote the transfer of technology from the knowledge producers to the technology users(Gu and Lundvall,2006;Liu and White, 2001b).The operation of technology markets makes it easier to transfer knowledge assets and technology between organizations, although a weakness in user competence may limit the effective-ness of this transfer of knowledge assets and technology(Gu and Lundvall,2006).
To capture the effect of interactive learning between the users and producers of technological knowledge,an intermediate mea-sure is considered:The contract value in the regional technology market.2This?gure re?ects the strength of S&T transfer.In order to cancel out the scale bias,a new variable,TECHMKT,is de?ned as the logarithm of contract value normalized by the number of S&T personnel.TECHMKT is added into the vector of ef?ciency factors to re?ect the intensity of transactions or collaborations between local knowledge producers and users in an innovation network.
It should be noted that,although?rms are the dominant users of technological knowledge transacted in regional technology mar-kets,universities and research institutes are not the only knowledge producers.They are not even the most important knowledge providers in regional technology markets.In2005,for instance, universities and research institutes received23.2%of total contract value in Chinese technology markets.By contrast,the share accrued to?rms is59.2%.In this sense,the user–producer linkage captured by TECHMKT includes the interaction between one?rm and another, which is different from what LINK measures.The latter only cap-tures the interaction between?rms on one side and university and research institutes on the other side.
The strength of this link varies both between regions and over time.In general,interaction between local producers and users is stronger in the eastern economically developed regions than in the western inland regions.Four large municipal cities,Beijing,Shang-hai,Tianjin and Chongqing,are now the major operation loci for active technology markets.
4.3.
5.External links or interaction with international innovation players:TSI
Previously developed technological knowledge from advanced economies is one of the most important technology sources for transition economies like China,especially during its early catch-up stage(Gerschenkron,1962;Giuliani et al.,2005).Regions can have access to this sophisticated technological information and knowledge through different channels,including foreign direct investment,technology imports,and international trade(Asheim and Vang,2006;Cantwell,1989;Soete,1987).In this sense,the openness of a region is one of the important external factors that affects the ef?ciency level of innovation production.To take into account its effect,the measure of regional Trade Specializa-tion Index(TSI)is added to the ef?ciency factors to represent the intensity of interaction between local?rms and their international counterparts in other countries.TSI also measures the extent to which innovation actors in a region make use of external technology information and knowledge.This index is de?ned as
TSI=total amount of export?total amount of import
total amount of export+total amount of import
.
2Since technology buyers may not come from the same region as technology producers,the reference base for this measure is the technology providers’region. In this sense,it represents the market value of technologies developed within the referred region and utilized by either regional or national buyers,and it measures the interaction between regional knowledge producers and nation-wide knowledge users.The value of TSI ranges between1and?1depending on whether a trade surplus or de?cit exists in a region,respectively.The smaller the value of TSI,the more opportunities a region has to absorb and learn technological knowledge embodied in imported goods, and thus the more likely for the region to draw upon advanced technological knowledge from external economies.
The importance of foreign direct investment and technology imports is equally,if not more,remarkable(Liu and Wang,2003;Liu and White,1997).However,they indicate an inward?ow of technol-ogy and only represent unidirectional linkage between innovation actors.Domestic innovation actors can not only learn from foreign technology providers,but also bene?t from the interaction with foreign users.The catch-up experiences of the East Asian regions of Korea and Taiwan show that bidirectional interaction is criti-cal in export-led economic growth(Amsden,1989;Amsden and Chu,2003).In China,a similar mode of economic growth seems to have manifested itself in the rapid increase in exports(Gu and Lundvall,2006).In view of this evidence,only the measure of open-ness as de?ned above is considered.Notably,which products and technologies have been imported is also critical.Whether they are high-technology equipment or raw materials can make a large dif-ference.Given that the measure does not contain this information, it acts as only a rough measure and contains inevitable noise.
In terms of growth modes,several coastal regions,such as Guangdong,Zhejiang,Jiangsu and Shandong,are export-led and have a positive TSI value for all sample years.Beijing and Shanghai, the two most developed municipal cities in China;however,are among the regions that import more than they export,implying a different growth and innovation mode than the other regions.
4.3.6.Cluster-speci?c environment or industrial structure:LIGHT and HITECH
The microeconomic environment in which?rms operate impacts the processes and outcomes of their innovation.A variety of industry-speci?c circumstances,investments and policies in?u-ence the extent to which dedicated innovation effort is translated into economically valuable output(Furman et al.,2002).During the central plan period from the early1950s to the end of the1970s, the industrialization priority in China was directed to the develop-ment of heavy industry,and the Chinese economy was dominated by agriculture and heavy industry(Fig.2).Following this early industrialization strategy,China’s central government deliberately arranged the geographical distribution of light and heavy industry ?rms among the regions.During this period,regions were not inno-vation systems per se.The heritage from the early industrialization era constitutes an institutional base from which the transition of the Chinese economy proceeds.Due to the inherent differences in investment requirements,knowledge bases,and innovation pro-cesses between industries(Malerba,2005);the composition of the industrial structure affects the rate and performance of innovation between regions.Recently,with the emergence of ICT-related high technology,the role that the hi-tech industry plays in economic growth has been recognized and emphasized.In many regions,the industrial strategy priority has shifted into the hi-tech industry, thus leading to the formation of what Tylecote(2006)termed dual innovation systems within a region.
To take into consideration the importance of the industrial structure,ideally it would be appropriate to include a variable rep-resenting the distribution of regional industrial clusters.However, because of limited data accessibility,I use the light industry gross-product share within the regional industrial output as a proxy, denoted by LIGHT.In addition,the gross product ratio of the high-tech industry to the regional industrial output,de?ned as a new variable HITECH,is also incorporated to capture the importance of the presence of the high technology industry for regional innovation
348X.Li/Research Policy38(2009)338–357
Table5
Results from stochastic frontier models–inventions.
Coeff.Applications Grants
Scenario1Scenario2Scenario1Scenario2
log AINV log AINV T+1log GINV T+3log GINV T+4
(1)(2)(3)(4)
Frontier function
log RNDP0.661***0.673***0.743***0.715***
(0.039)(0.045)(0.063)(0.086)
log GDPPC0.967***0.999***0.952***0.803***
(0.072)(0.079)(0.133)(0.117)
Inef?ciency function
UNIVINS?0.023***?0.018***?0.014**?0.012**
(0.007)(0.006)(0.006)(0.006)
LINK0.0110.0030.016*0.011
(0.008)(0.008)(0.009)(0.012)
GOV?0.381***?0.266*?0.424**?0.507**
(0.146)(0.141)(0.166)(0.210) BANK0.0100.0090.019?0.009
(0.013)(0.012)(0.017)(0.019) TECHMKT0.115*0.117**0.154*0.208*
(0.067)(0.060)(0.079)(0.107)
TSI0.036?0.144?0.2370.331
(0.239)(0.231)(0.285)(0.389) LIGHT?0.004?0.006?0.002?0.006
(0.004)(0.004)(0.005)(0.006) HITECH?0.037***?0.039***?0.010?0.025**
(0.012)(0.011)(0.009)(0.012)
2= 2u+ 2v0.2980.2550.2770.397
(0.050)(0.041)(0.056)(0.068)
= 2u/( 2u+ 2v)0.6260.4110.816 1.000
(0.180)(0.249)(0.260)(0.000)
2u0.1860.1050.2260.397
(0.077)(0.076)(0.090)(0.068)
2v0.1110.1500.0510.000
(0.045)(0.050)(0.072)(0.000) Estimated ef?ciency0.5780.6030.4600.450 Number of observations240210150120
Note:The estimated coef?cients of the constant terms and year dummies are not reported for the sake of brevity.Standard errors are in the parentheses;***p<0.01,**p<0.05, *p<0.1.
activity.These two factors together measure the industry-speci?c innovation environment of a regional innovation system.
Industrial structure varies remarkably between regions.In1998, the share of gross industrial output contributed by light industries ranged from11.7%to60.1%,with a mean level of36.8%.During the sample period,there was a decreasing trend in almost all regions. By the end of2005,the mean value of LIGHT had decreased to a level of25.8%,with its range between5.8%and46.0%.Clearly,a structural change in industrial composition had occurred within most regions.
The share of hi-tech industrial output is even more dispersed between regions(Fig.2,panel b).Although the mean value of HITECH between regions is less than7.5%for all years,there are sev-eral regions that have considerably larger hi-tech industry shares.In Beijing,for example,the percentage of hi-tech industrial output has been at a level of over25%since1998.As a result,the development of hi-tech industries now tends to be more and more geographically concentrated.
As discussed above,all variables included in this analysis are either in a logarithm form or expressed as a dimensionless ratio (Table3).When monetary values are involved,they are de?ated by consumer price indices(CPI),except for per capita GDP which is adjusted by the real growth rate,to the1998constant value.In addi-tion,year dummies are included in the core production function to capture the annual change in ef?ciency during the study period. Since many independent variables are included in the ef?ciency Eq.(2),it is useful to check the seriousness of multi-collinearity. Separate diagnostic tests based on variance in?ation factors and condition numbers show that multi-collinearity is not a big prob-lem among both explanatory variables x’s and z’s as de?ned in(1)and(2).Table A.1in the Appendix gives the pair-wise correlation coef?cients between included variables.
5.Main results and?ndings
In the following,the estimated results from stochastic frontier models speci?ed for different measures of innovation output are ?rst explained and then a robust check follows.Finally,based on the estimated innovation ef?ciency,the reasons underlying the dispar-ity in regional innovation performance are explored.
5.1.Determinants of invention patent counts
Taking the number of invention patent applications and patent grants as separate measures of innovation output,a model for two different time-lag scenarios is estimated(Table5).
5.1.1.Input factors
A robust relationship exists between invention counts and FTE R&D personnel in both scenarios(upper part of Table5).In sce-nario1,for example,other things being equal,a1%increase in FTE R&D personnel would lead to a0.66%and0.74%increase in contemporaneous invention patent applications and patent grants, respectively.The reason that the elasticity of patent grants with respect to R&D personnel is slightly higher is probably because the number of grants is much smaller than that of applications. Nonetheless,it may also indicate an improvement in the quality of invention applications.These estimates are consistent between the two scenarios.
X.Li/Research Policy38(2009)338–357349
Table6
Results from the stochastic frontier models–utility models.
Coeff.Applications Grants
Scenario1Scenario2Scenario1Scenario2
log AUM log AUM T+1log GUM T+1log GUM T+2
(1)(2)(3)(4)
Frontier function
log RNDP0.995*** 1.023*** 1.039*** 1.037***
(0.043)(0.046)(0.041)(0.044)
log GDPPC0.476***0.437***0.498***0.538***
(0.110)(0.109)(0.098)(0.094)
Inef?ciency function
UNIVINS0.008***0.010***0.008***0.008***
(0.003)(0.003)(0.003)(0.003)
LINK?0.009?0.013**?0.01*?0.011*
(0.006)(0.007)(0.006)(0.006)
GOV?0.115?0.024?0.090?0.059
(0.081)(0.086)(0.076)(0.085) BANK0.012?0.0010.004?0.012
(0.010)(0.010)(0.009)(0.010) TECHMKT?0.054?0.087*?0.041?0.053
(0.043)(0.045)(0.040)(0.046)
TSI0.2210.1710.1580.122
(0.166)(0.173)(0.154)(0.173) LIGHT?0.021***?0.019***?0.018***?0.018***
(0.003)(0.003)(0.003)(0.003) HITECH0.0050.0020.0080.006
(0.006)(0.006)(0.005)(0.006)
2= 2u+ 2v0.2010.1990.1620.171
(0.022)(0.022)(0.017)(0.014)
= 2u/( 2u+ 2v)0.6510.6520.609 1.000
(0.335)(0.388)(0.643)(0.000)
2u0.1310.1300.0980.171
(0.069)(0.080)(0.105)(0.014)
2v0.0700.0690.0630.000
(0.068)(0.077)(0.104)(0.000) Estimated ef?ciency0.4190.3860.3800.334 Number of observations240210210180
Note:Estimated coef?cients of the constant terms and year dummies are not reported for the sake of brevity.Standard errors are in the parentheses;***p<0.01,**p<0.05, *p<0.1.
Regarding economized knowledge stock measured as per capita GDP,estimated elasticities of invention applications are almost unity in the two scenarios.In terms of invention grants,elastic-ities estimated under the two time-lag scenarios are comparable and not signi?cantly different,though the coef?cient value is less than unity in the long time-lag scenario.These positive coef?cients imply that an important“standing on the shoulders of others”effect exists in invention patenting,indicating that accumulated knowl-edge stock greatly promotes the creation of new knowledge.Ceteris paribus,an increase of1%in real per capita GDP could increase the number of invention patents by the same proportion.
5.1.2.Ef?ciency factors
No matter whether invention applications are used or grants are used,estimated coef?cients for ef?ciency factors are robust and consistent in both time-lag scenarios(lower part of Table5).Since the interpretation of results is similar for all cases,the following discussion focuses on the results of column1where the number of contemporary invention applications is the dependent variable.
The negative sign in UNIVINS suggests that an increase in the share of R&D performed by universities and research institutes will lower the level of inef?ciency,or equally enhance innova-tion ef?ciency.This indicates that a larger proportion of resource committed to universities and research institutes induces a higher proportion of innovation potential to be translated into visible out-put.However;interaction between?rms,universities and research institutes does not affect invention patenting,and the LINK coef?-cients do not differ from0at a signi?cant level of5%in all cases.
The importance of support organizations is captured by the parameter of GOV and BANK.Strong support from government organizations has an important impact on innovation ef?ciency, as demonstrated by signi?cant negative coef?cients(Table5).The higher the share of?nancial revenue spent on S&T activities,the more productive the innovation activity.However,the impact from ?nancial institutions(BANK)seems to be trivial and all estimated coef?cients are statistically insigni?cant.
Surprisingly,the importance of interaction between technology users and producers in the innovation process is contrary to what innovation system theory predicts.Positive coef?cients of TECHMKT suggest that a strong user–producer interaction has a negative impact on the ef?ciency of invention patents.Although this sounds strange,it actually accords with the observation pointed out by Gu and Lundvall(2006).These authors argue that an incapabil-ity for users to absorb and appreciate advanced technology retards the proper transfer of technology in the early stage of reform,and so spin-offs from universities or research institutes(for example, Founder and Lenovo)gained incentive to move into production. After about20years,this argument seems to still hold true.In this sense,the indicator TECHMKT is incapable of capturing the interac-tion between users and advanced technology providers.Moreover, the?nding of this estimation makes more sense if bad technologies drive good technologies out of the technology markets.In terms of the impact of TSI,the evidence from stochastic models is not conclu-sive.It is unclear whether or how regional openness to international communities in?uences innovation performance at the regional level.
350X.Li/Research Policy38(2009)338–357
The in?uence of the industrial structure on ef?ciency is con-?rmed.Estimated HITECH coef?cients are statistically signi?cant in all but one case.Their negative signs are indicative of an af?rmative impact of hi-tech industries on region-wide innovation perfor-mance,which is probably related to the fact that many patents are taken out from the hi-tech industry?elds.Although not statisti-cally signi?cant,the coef?cients of LIGHT seem to further highlight the importance of the industry-speci?c environment in innova-tion,suggesting that domestic patenting is probably more intensive within light industries than within heavy industries.
5.2.Determinants of utility model patent counts
Besides inventions,the most sophisticated technological novel-ties,a middle class of patents,exist in the Chinese patent system, utility models.These represent marginal technological improve-ment and modi?cation.Embodied technological content in these patents is not as advanced as that in inventions,and thus associ-ated commercial value is lower.With the count of utility models as another measure of innovation output,the estimated results are reported in Table6.
5.2.1.Input factors
As in the case of invention patents,the estimated coef?cients of both input factors are signi?cant and comparable in all four speci?-cations with different measures of utility model patents.However, with utility model counts as dependent variables,their elastic-ity with respect to resource commitment,measured by FTE R&D personnel,is remarkably larger than with respect to accumulated knowledge stocks,measured by per capita GDP.For example,the elasticity of utility model applications with respect to FTE R&D per-sonnel is close to unity,which is about twice that of the elasticity with respect to GDP per capital.In other words,a1%increase in per capita GDP only contributes to less than a0.5%increase in util-ity model applications,other things being equal.This pattern is reversed in the case of inventions,i.e.,the process of utility model production is more likely to be driven by devoted resources than by prior knowledge.Accumulated prior technological knowledge is more valuable in high-quality invention patenting than in innova-tion leading to marginal improvement.
5.2.2.Ef?ciency factors
In four speci?cations from Table6,estimated coef?cients of UNI-VINS are all statistically signi?cant.However,compared to those given in Table5,their signs are reversed and positive,suggesting a negative impact from universities and research institutes in terms of utility model patenting.Since the share of R&D activities under-taken by?rms is just one minus UNIVINS by construction,this result actually manifests a positive role for?rms in generating utility mod-els.Thus,although a high share of innovation activity conducted by?rms is not favorable to patenting inventions,it does help to increase ef?ciency in utility model production.
Combined with the fact that universities and research institutes are major sources of invention patenting,and business?rms hold a dominant share of utility models(Table1),this contrast reveals that a disparate role is played by the two types of innovation actors. It is reasonable to postulate that universities and research institu-tions are inclined to engage in technologically intensive innovation activities in China.They are neither effective nor ef?cient in per-forming marginal innovation activity which is strongly related to the generation of utility models.
Evidence from the interactions among innovation actors pro-vides further support for this postulation.Contrary to what is revealed in Table5,the coef?cients of LINK are all negative in Table6, suggesting that?nancial support from?rms to S&T activities in uni-versities and research institutes is favorable for the translation of innovation activities into less sophisticated yet practical and use-ful utility models.This does not hold true in the case of patenting inventions.
Compared to the result in the case of invention patenting,the impact from government support is not signi?cant in the case of utility model patenting,although it is also positive.This is credi-ble and justi?able in view of the fact that the government provides ?nancial support only for important S&T and R&D activities.With regard to?nancial institutions,their impact on promoting less advanced technological innovation is still insigni?cant.Together with the results in Table5,it seems to suggest that a trivial role is played by?nancial institutions in China’s regional innovation.How-ever,the measurement de?ciencies associated with the variable BANK may render this inference unwarranted.During the transition, it has been traditional that loss-making state-owned enterprises are given life-support by governments in the form of“loans”from state banks–infusions of funds which no one would expect to be paid back.The markedly high value of BANK in a couple of west-ern poor regions as mentioned before may be indicative of such a de?ciency.In this case,the money from?nancial institutions is not an effective incentive support for innovation.One should therefore interpret the above-mentioned result warily.
An examination of the estimated coef?cients of TECHMKT between Tables5and6highlights the distinction between the two types of innovation processes.Although statistically insigni?cant, the coef?cients of TECHMKT are negative,suggesting a favorable role of knowledge user–producer interaction in the generation of utility models.This is contrasting what has been discussed in invention patents.In addition,the negative coef?cients of TSI, although insigni?cant,are indicative of a positive impact from imports on the innovation process in utility models.Contrasted to its effect on invention patenting,technological knowledge embod-ied in imported goods seems to promote the learning of technology only at an intermediate level.
Comparing the estimated coef?cients of LIGHT for the two types of patents suggests that the effect of the light–heavy industrial structure is more important for innovation in the utility model and more evident than its effect on innovation in inventions.Generally,?rms in light industries are found to be more active and ef?cient in engaging in innovation and patenting than their counterparts in heavy industries,which can probably be attributed to the inherent differences in the innovation processes between industries.Regard-ing the importance of an innovation environment characterized by the presence of hi-tech industries,the estimated coef?cients of HITECH are positive yet statistically insigni?cant in all4cases in Table6,entirely contrary to those reported in the case of inventions.
From the analysis and comparison of the estimated results for the two types of innovation output,it is evident that the in?uence of ef?ciency factors on innovation depends on which type of patent is used as a measure of innovation and which type of organizations are dominant innovation actors.In general,regions in which uni-versities and research institutes are more active in the innovation process tend to generate more inventions,while regions in which ?rms are dominant innovators have advantages in patenting util-ity models.These empirical results also con?rm the importance of innovation actors,interaction among these actors,and the innova-tion environment to innovation.
https://www.doczj.com/doc/9c11286357.html,parisons of estimated innovation ef?ciencies
In all cases,from the estimated values,a large part of the vari-ance can be attributed to ef?ciency factors(Tables5and6).The high values of estimated imply that the use of stochastic frontier models is appropriate for this analysis.
Given the estimated residuals from the stochastic frontier mod-els,it is straight-forward to compute the value of innovation
X.Li/Research Policy38(2009)338–357
351
https://www.doczj.com/doc/9c11286357.html,parison of estimated technical ef?ciencies between the two scenarios.
ef?ciency for each region in each period,according to Eq.(4).It actually amounts to a measure of technical ef?ciency in the produc-tion of new knowledge(Coelli,1996).Fig.4compares the estimates of innovation ef?ciency between two time-lag scenarios for all cases.In all four panels,the estimates of TE it from the two sce-narios are distributed along the isolines very closely.This indicates that the time-lag speci?cation has little effect on the estimates of ef?ciencies for all measures of innovation output:invention applications,invention grants,utility model applications and utility model grants.
Panels(a)and(b)of Fig.5compare the estimates of TE it between applications and grants with the short time lag as a default.In the case of inventions,the values for the estimated innovation ef?-ciency for applications are slightly larger than those for grants.This makes sense because it is normally easier to apply for patents than to receive an application grant.In the case of utility models,
the https://www.doczj.com/doc/9c11286357.html,parison of estimated technical ef?ciencies.
352X.Li /Research Policy 38(2009)
338–357
Fig.6.The trend of estimated technical ef?ciencies.
estimates of innovation ef?ciency in the two cases are very similar and lie closely around the isoline.
A comparison of estimated ef?ciencies between the two types of patents shows that innovation ef?ciencies in inventions are quite different from those in utility models with either applications or grants as the dependent variables (Fig.5,panels c and d).This result is consistent with the observation discussed above that innovation processes are fundamentally different for the two types of patents.
With the number of a speci?c class of patents as the measure of innovation output,both the estimated coef?cients and innovation ef?ciencies are robust and comparable across all speci?cations,no matter whether applications or grants are used as dependent vari-ables,and no matter how the time lag is speci?ed.Nonetheless,they vary with the type of patent,revealing distinct innovation processes between inventions and utility models.This seems quite obvious and understandable,in view of the underlying differences of many aspects between these two classes of patents including patent-ing procedures,time length,technological novelty and potential commercial value.Moreover,the empirical ?ndings suggest that dissimilar innovation processes may be related to the distinct char-acteristics of the innovation actors.
5.4.Impacts of innovation modes
To see how the level of innovation ef?ciency changes with time,I plot the distribution of TE it values estimated from the short time-lag scenario with all four measures of innovation (Fig.6).
During the sample period,innovation ef?ciencies in invention applications become more and more dispersed,and their mean decreases (Fig.6,panel a).Such a trend in dispersion of and decrease in innovation ef?ciencies is much more prominent than that demonstrated in the other three cases.In the case of inven-tion grants (Fig.6,panel b),there is no noticeable pattern or trend.With respect to utility models,the distribution of innovation ef?-ciencies is actually stable over the sample years,no matter whether applications or grants are considered (Fig.6,panels c and d).
The decreasing trend and the dispersing trend in invention application ef?ciencies (Fig.6,panel a)suggest a solution to the puzzle proposed at the end of Section 2.They may be related to the cause of the increasingly concentrated distribution of invention patents.Given the importance of universities and research insti-tutes in invention patenting,it is worth examining if this trend is related to these actors’decreasing share in region-level R&D activ-ities (Table 1,column 1).
According to the share of R&D resources contributed by the dif-ferent types of actors,the region’s R&D activities are de?ned as ?rm-dominant if both R&D expenditures and FTE R&D personnel from ?rms are larger than the perspective sums from universities and research institutes.The region’s R&D activities are de?ned as UR-dominant if both R&D expenditures and FTE R&D personnel from ?rms are smaller than the perspective sums from universi-ties and research institutes.By distinguishing between these two dominant R&D modes at the regional level,one can clearly see how the structural composition of innovation actors has evolved during the transition,which presumably has a critical impact on regional innovation performance.For instance,although only nine regions in China were clearly ?rm dominant in R&D in 1998,20regions became ?rm-dominant by 2005.During the same period,the num-ber of UR-dominant regions had been reduced from eleven to six.Clearly,R&D activity in most regions has undergone a transition from ?rm-dominant to UR-dominant.
To explore if and how this structural transition has affected the innovation process,a similar distinction is made between the two modes,?rm-dominant and UR-dominant,according to a region’s innovation performance.In 1998,13regions were ?rm-dominant in terms of invention applications,while the remaining seventeen regions were UR-dominant.In 2005,however,the situation was reversed.Innovation performance was dominated by universities and research institutes in as many as thirteen regions,although only six regions were UR-dominant in R&D activities.In terms of both applications and grants,this contrast is even more remarkable.In 2005,for example,there were twelve regions with innovation performance dominated by ?rms,which equals the UR-dominant
X.Li /Research Policy 38(2009)338–357
353
Table 7
The number of regions with different types of innovation modes.Year
R&D input a
Invention applications b
Invention grants and applications c Firm-dominant d (1)
UR-dominant d (2)Firm-dominant (3)UR-dominant (4)Firm-dominant (5)UR-dominant (6)19989(1)11(8)1317316199910(4)10(9)1614212200012(5)7(7)1911911200116(6)6(6)1911611200216(6)5(4)219129200317(5)9(7)18121212200417(5)7(7)171311122005
20(7)
6(6)
17
13
12
12
a
In terms of R&D input,a regional innovation mode is said to be ?rm-dominant if both R&D expenditures and R&D FTE personnel from the class of ?rms are larger than the perspective sums from universities and research institutes within the same region.A regional innovation mode is said to be UR-dominant if both R&D expenditures and R&D FTE personnel from the class of ?rms are smaller than the perspective sums from universities and research institutes within the same region.b In terms of invention applications,a regional innovation mode is said to be ?rm-dominant (or UR-dominant)if the number of applications from the class of ?rms are larger (or smaller)than that from universities and research institutes within the same region.c In terms of invention counts,a regional innovation mode is said to be ?rm-dominant (or UR-dominant)if both the application count and the grant count associated with the class of ?rms are larger than two perspective numbers associated with universities and research institutes.d
The number of regions with estimated innovation ef?ciency above median level for the respective innovation mode is in the parenthesis.
regions.However,with respect to R&D activities,the ?rm-dominant regions far outnumbered UR-dominant regions.Twenty regions were ?rm dominant as compared to six UR-dominant regions.
It is useful to link these innovation modes to the estimated innovation ef?ciency.According to the estimated ef?ciency value of invention applications,it is possible to rank thirty regions in a descending order.The numbers of regions with an above-median value of TE it in the short-time-lag scenario are listed in the two brackets of columns (1)and (2)in Table 7.In 1998,among the nine regions where R&D activities were dominated by ?rms,only one region had a value of innovation ef?ciency above the median.Even by the year 2005when two-thirds of the regions had trans-formed into ?rm-dominant R&D modes,only seven regions were relatively ef?cient in invention applications.On the contrary,the regions with UR-dominant R&D modes were more ef?cient in inno-vation than the ?rm-dominant regions.In 2005,six regions with UR-dominant R&D all had above-mean ef?ciency values.These results clearly show that the transition of regional R&D activities from UR-dominant to ?rm-dominant modes had in effect in?u-enced the extent to which region-wide R&D efforts were translated into innovation output and is thus underlying the increasing dis-parity in innovation performance between regions.
Considering the frontier value and innovation ef?ciency together,one can make the argument even stronger.Taking the short-time-lag
scenario as an example,based on estimates of inno-vation ef?ciency in invention applications for each region,I predict the deterministic frontier value of the knowledge production func-tion and compute the estimate of innovation ef?ciency for the year 1998and 2005.Scatter plots of these values are displayed in Fig.7,with panels (a)and (b)representing the cases for the years 1998and 2005,respectively.
The horizontal axis of the two panels shows that the predicted frontier values of invention applications in 2005are remarkably larger than those in 1998,which holds true for each of the 30
https://www.doczj.com/doc/9c11286357.html,parison of frontier values and technical ef?ciencies in invention applications.
354X.Li /Research Policy 38(2009)
338–357
Fig.8.The cumulative proportion of invention applications from different innovation actors.
regions.This observation is not surprising,since both regional per capita GDP and the amount of human capital devoted to innovation activities had increased considerably in all regions during the sam-ple period,as already mentioned (Fig.1).What is unusual is the increasing dispersion of innovation ef?ciencies between regions.The estimated innovation ef?ciencies for most regions are clus-tered around the median value in 1998(Fig.7,panel a).By the year 2005,however,the dispersion of these estimated ef?ciencies had largely increased (Fig.7,panel b).Moreover,such variation in technical ef?ciency is more prominent between regions with ?rm-dominant R&D modes than between UR-dominant regions.Although regions with R&D activities dominated by universities and research institutes were all above the mean ef?ciency level in 2005,?rm-dominant regions had ef?ciency values as low as 0.15(NX and NM)or as high as 0.88(GD).
According to the estimated coef?cients,when a region trans-forms its innovation mode to ?rm-dominant in terms of R&D activities,the estimated innovation ef?ciency will reduce because of a lower value of UNIVINS ,other things being equal.Such a decrease in ef?ciencies can be easily seen in panel (b),where most ?rm-dominant regions have a lower value of estimated innovation ef?ciency in 2005than in 1998.A change in the cluster-speci?c innovation environment or industrial structure may also transform a region’s innovation mode in terms of R&D activities.For example,with the development of hi-tech industries,the rapid increase in the share of innovation activities performed by hi-tech ?rms may cause a region’s R&D activities to be dominated by ?rms.If this is the case,the estimated innovation ef?ciency could instead increase.Two notable cases are Tianjin (TJ)and Shanghai (SH),which are both well developed municipal cities in China (Fig.7).In 1998,these two regions had very high levels of R&D investment but had relatively low invention patenting ef?ciency.By the year 2005,however,the ef?ciencies for both regions rose to among the top ef?ciencies.Another developed region,Guangdong (GD),has also had a notable increase in innovation ef?ciency.The data shows that the share from hi-tech industries in these regions had increased by more than 6%during the sample period.It is the rapid development of high-tech industries in these regions that accounts for such increases in ef?ciencies,con?rming the important impact of hi-tech industries on regional innovation.These ?ndings suggest that the transforma-tion of a region’s R&D activities to ?rm-dominant activities could be ef?ciency-enhancing if the innovation environment or indus-trial structure has undergone a favorable change.Otherwise,such a transformation may lessen the overall innovation ef?ciency.
The large dispersion of innovation ef?ciency among ?rm-dominant regions indicates that the performance of innovation activities undertaken by ?rms is dissimilar between regions.In order to examine this argument,Fig.8compares the cumula-tive proportion of invention applications taken out by ?rms and universities and research institutes between 1998and 2005.The share from the ?rms’inventions from the ?ve most productive regions was about 55%in 1998(Fig.8,panel a).The same share had increased to a level of 75%by 2005,demonstrating an extraordi-nary geographical concentration of the ?rms’innovation capacities.On the other hand,the concentration trend in terms of inven-tion applications from universities and research institutes is not so extraordinary,although it is noticeable.The geographical con-centration trend in the ?rms’invention applications is much more striking than that in inventions taken out by universities and research institutes (Fig.8,panels a and b).In this sense,it is not sur-prising to see that a transformation of regional innovation modes from UR-dominant to ?rm-dominant will lead to a trend of geo-graphical concentration in overall innovation performance.
Given the observation of a concentration trend in ?rms’innova-tions,one further question is why the performance of innovation activities undertaken by ?rms varies so greatly across ?rm-dominant regions.Speci?cally,what are the determinants of the disparity in ?rm-level innovation performance?From a strategic management perspective,such a disparity can be at least attributed to the difference in business and technology strategies,since ?rms embedded in different regional and industrial contexts often have different innovation strategies.In the Chinese case,?rms in east-ern regions are more likely to adopt an export-oriented strategy,while those in western regions are more resource-based.In light of
X.Li/Research Policy38(2009)338–357355
the behavioral theory of?rms’,it is possible that?rms in eastern regions have more slack resources so that they are more active in research or innovation than their counterparts in western regions. To what extent that external constraints and internal sources have in?uenced?rm-level innovation strategies across regions is cer-tainly an interesting topic worthy of further study,however,it is beyond the scope of this paper.
To sum up,innovation performance at the regional level is not only dependent on the total amount of?nancial and human capital invested in R&D activities,but is also related to the innovation ef?-ciency,or the extent to which these efforts can be translated into valuable innovation output.Due to the inherently different incen-tives and capacities associated with the different types of actors, the transformation of regional innovation modes or the change in composition of innovation actors is in?uential in determining a region’s innovation ef?ciency.Although Liu and White(2001b, p.1093)argued that“changes in organizational boundaries around activities comprising the innovation system,as well as the incentive structure and capacities of actors to undertake these activities and perform well is the more important and fundamental issue,”they also claim that“whether particular activities are undertaken by par-ticular actors is not the most important issue.”From the results above;however,one can clearly arrive at the conclusion that who conducts the R&D and innovation does matter,at least in terms of patent production.
6.Discussions and conclusions
During the transition of the Chinese economy from a cen-trally planned regime to a market-driven system,both the national and the regional innovation systems in China have also been transformed.In China’s regional innovation systems,one strik-ing phenomenon is the increasingly concentrated distribution of innovation outcomes.In terms of domestic patent counts,China’s regional innovation performance varies greatly from region to region.Such disparity is dependent on not only the total amount of R&D investment,but also on inef?ciency in the innovation pro-cess.Following a regional innovation system approach,this study assumes that the structural composition of the components and the links between the components of an innovation system have an impact on ef?ciency,and the study tries to identify and evalu-ate the determinants of innovation ef?ciencies from an empirical perspective.With the new knowledge production function concept as the core,stochastic frontier models are employed to address the effects of various ef?ciency factors,which also allows for a com-parison of ef?ciency estimates between regions.The estimation is based on a constructed dataset covering a panel of30regions from 1998to2005.In order to measure the innovation performance,four indicators are speci?ed as rough proxies for the innovation output: The invention patent application count,the invention patent grant count,the utility model patent application count and the utility model patent grant count.They are treated as dependent variables and are estimated separately in two scenarios of time-lag length.
Several interesting?ndings are revealed from the results.First, given the speci?c class of patents,the estimated results are consis-tent and robust,no matter whether patent applications or grants are used,and no matter which time-lag is speci?ed.However,the use of different types of patents as dependent variables does affect the estimation.It indicates a fundamental difference in innovation processes between invention patents and utility model patents.
Secondly,although accumulated knowledge stock represented by per capita GDP is more in?uential than direct R&D investment to the production of invention patents,the case is reversed in the pro-duction of utility models.It suggests that accumulated knowledge plays an important role in technologically sophisticated innovation process.
Thirdly,with respect to ef?ciency factors,the estimated results con?rm the importance of interactions or links between the system components.Universities and research institutes play a favorable role in invention patenting,while?rms are inclined to produce utility models.The impact of government support on innovation ef?ciency is more prominent in invention production than in util-ity model production.The interaction between major innovation actors and the links between knowledge users and producers are conducive to utility model patenting,but not to invention patenting. The impact of the industry-speci?c environment is also important. Regions with developed hi-tech industries are ef?cient in regards to invention patenting,while a light industrial structure favors utility model innovation.
Finally,advanced knowledge providers(universities and research institutes)dominate the creation of the most techno-logically intensive innovations in many of China’s regions,while ?rms,in general,prefer to patent marginal innovations.In terms of invention patenting,?rms have even more disparate productiv-ities between regions than universities and research institutes.A transformation to?rm-dominant R&D modes further widens the gap of overall innovation ef?ciency between regions.Hence,it is the change in the structural composition of regional innovation activities that has contributed to the geographical concentration of innovation outcomes between regions,which together with the large disparity in the?rms’innovation capacities between regions, are the major reasons underlying the recent divergence trend in regional overall innovation performance.
It is wise to point out several caveats in this empirical study. One limitation,which is common in studies analyzing patent data, is that I have not clearly accounted for the problem of patent“qual-ity.”For example,the quality of invention applications is possibly very different across the technology?elds.In a region with devel-oped high-tech sectors,a patent may translate into more valuable innovation and represent more R&D effort than in a region featured by traditional low-tech sectors.Although the patenting laws are the same across regions,one should keep in mind that the problem of patents being an imperfect innovation output proxy holds true in this study.Another limitation is related to the ef?ciency factor measurements.Interactions between innovation actors,between knowledge users and producers,and between external and internal players,are multi-dimensional,including the?ow of information, knowledge and?nance.By only measuring the link to?nancial?ow, the other dimensions have been ignored.In this sense,interpreta-tions of the empirical results should be made carefully.Finally,this study can be extended in several directions in the future.It would be worthwhile to try other measures of innovation output and ef?-ciency factors.The methodology adopted here could be extended to other contexts,for instance OECD countries. Acknowledgements
A preliminary version of this paper was presented at Wider Conference on Southern Engines of Global Growth:China,India, Brazil,and South Africa,Helsinki,Finland.Part of the preliminary results was reported in Forum of Chinese Regional Economy,Man-agement World,December2007,in Chinese.The author is grateful to John Mathews,Mei-chih Hu,two anonymous referees and con-ference participants for their helpful comments and suggestions. The author also gratefully acknowledges?nancial support from the National Natural Science Foundation of China(Project No.: 70602005).The usual disclaimer applies.
Appendix A
Table A.1.
356X.Li/Research Policy38(2009)338–357
Table A.1
Correlation coef?cients between explanatory variables.
UnivIns Link GOV Bank TechMkt TSI Light
Link?0.045
GOV?0.3120.493
Bank?0.1870.1170.184
TechMkt0.1580.3100.190?0.227
TSI?0.275?0.0860.0120.380?0.458
Light?0.0120.1600.1670.1510.286?0.021
HiTech0.1770.2070.301?0.1430.295?0.4360.224 Note:Mean variation in?ation factor:1.47;condition number:13.03(Belsley et al.,1980).
References
Acs,Z.J.,Anselin,L.,Varga,A.,2002.Patents and innovation counts as measures of regional production of new knowledge.Research Policy31,1069–1085. Aigner,D.J.,Lovell,C.K.,Schmidt,P.,1977.Formulation and estimation of stochastic frontier production function models.Journal of Econometrics6,21–37. Amsden,A.,https://www.doczj.com/doc/9c11286357.html,’s Next Giant:South Korea and Late Industrialisation.Oxford University Press,Oxford and New York.
Amsden,A.H.,Chu,W.W.,2003.Beyond Late Development:Taiwan’s Upgrading Poli-cies.The MIT Press,Cambridge,MA.
Archambault,é.,2002.Methods for using patents in cross-country comparisons.
Scientometrics54(1),15–30.
Archibugi,D.,1992.Patenting as an indicator of technological innovation:a review.
Science and Public Policy19,357–368.
Asheim,B.T.,Isaksen,A.,1997.Location agglomeration and innovation:towards regional innovation systems in Norway?European Planning Studies5(3), 299–330.
Asheim,B.T.,Vang,J.,2006.Regional innovation systems in Asian countries:a new way of exploiting the bene?ts of transnational corporations.Innovation:Man-agement,Policy&Practice8(1/2),27–44.
Battese,G.,Coelli,T.,1995.A model for technical inef?ciency effects in a stochastic frontier production function for panel data.Empirical Economics20,325–332. Belsley,D.A.,Kuh,E.,Welsch,R.E.,1980.Regression Diagnostics:Identifying In?uen-tial Data and Sources of Collinearity.John Wiley&Sons,New York.
Cantwell,J.,1989.Technological Innovation and Multinational Corporations.Basil Blackwell,Oxford.
Carlsson,B.,Jacobsson,S.,Holmen,M.,Rickne,A.,2002.Innovation systems:analyt-ical and methodological issues.Research Policy31,233–245.
Chung,S.,2002.Building a national innovation system through regional innovation systems.Technovation22,485–491.
Coelli,T.,1996.A Guide to FRONTIER Version4.1:A Computer Program for Stochastic Frontier Production and Cost Function Estimation.CEPA Working Paper96/07.
Centre for Ef?ciency and Productivity Analysis,University of New England,Armi-dale,NSW,2351,Australia.
Cohen,W.,Nelson,R.,Walsh,J.,2002.Links and impacts:the in?uence of public research on industrial R&D.Management Science48(1),1–23.
Cooke,P.,Uranga,M.G.,Etexbarria,G.,1997.Regional innovation systems:institu-tional and organizational dimensions.Research Policy26,475–491.
Edquist,C.,2005.Systems of innovation:perspectives and challenges.In:Fagerberg, Jan.,et al.(Eds.),The Oxford Handbook of Innovation.Oxford University Press, pp.181–208.
Edquist,C.,Eriksson,M.L.,Sj?gren,H.,2002.Characteristics of collaboration in prod-uct innovation in the regional system of innovation of East Gothia.European Planning Studies10(5),563–581.
Etzkowitz,H.,Leytesdorff,L.,1997.Universities in Global Economy:A Triple Helix of Academic–industry–Government relation.Croom Helm,London. Evangelista,R.,Iammarino,S.,Mastrostefano,V.,Silvani,A.,2001.Measuring the regional dimension of innovation:lessons from the Italian innovation survey.
Technovation21,733–745.
Freeman,C.,2002.Continental,national and sub-national innovation systems—complementarity and economic growth.Research Policy31,191–211.
Fritsch,M.,2000.Interregional differences in R&D activities—an empirical investi-gation.European Planning Studies8(4),409–427.
Fritsch,M.,2002.Measuring the quality of regional innovation systems:a knowl-edge production function approach.International Regional Science Review25
(1),86–101.
Furman,J.L.,Hayes,R.,2004.Catching up or standing still?National innovative productivity among‘follower’countries,1978–1999.Research Policy33,1329–1354.
Furman,J.L.,Porter,M.E.,Stern,S.,2002.The determinants of national innovative capacity.Research Policy31,899–933.
Gerschenkron,A.,1962.Economic Backwardness in Historical Perspective.Harvard University Press,MA.
Giuliani,E.,Rabellotti,R.,van Dijk,M.P.,2005.Clusters Facing Competition:The Importance of the External Linkages.Aldershot:Ashgate.
Griliches,Z.,1990.Patent statistics as economic indicators:a survey.Journal of Eco-nomic Literature28(4),1661–1707.
Gu,S.,Lundvall,B.?.,2006.China’s innovation system and the move toward harmo-nious growth and endogenous innovation.Innovation:Management,Policy& Practice8(1/2),1–26.Hagedoorn,J.,Cloodt,M.,2003.Measuring innovative performance:is there an advantage in using multiple indicators?Research Policy32,1365–1379.
Hu,M.C.,Mathews,J.A.,2005.National innovative capacity in East Asia.Research Policy34,1322–1349.
Jones,C.,1995.R&D based models of economic growth.Journal of Political Economy 103,739–784.
Jones,C.,1998.Introduction to Economic Growth.W.W.Norton&Company,New York,NY.
Kim,L.,1997.Imitation to Innovation:The Dynamics of Korea’s Technological Learn-ing.Harvard Business School Press,MA.
Kumbhakar,S.C.,Lovell,C.,2000.Stochastic Frontier Analysis.Cambridge University Press,Cambridge,UK.
Kumbhakar,S.C.,Ghosh,S.,McGuckin,T.J.,1991.A generalized production frontier approach for estimating determinants of inef?ciency in U.S.dairy farms.Journal of Business&Economic Statistics9(3),279–286.
Li,X.,2006.Regional innovation performance:evidence from domestic patenting in China.Innovation:Management,Policy&Practice8(1/2),171–192.
Liu,X.,White,S.,1997.The relative contributions of foreign technology and domestic inputs to innovation in Chinese manufacturing industries.Technovation17(3), 119–125.
Liu,X.,White,S.,2001a.An exploration into regional variation in innovative activ-ity in China.International Journal of Technology Management21(1/2),114–129.
Liu,X.,White,S.,https://www.doczj.com/doc/9c11286357.html,paring innovation systems:a framework and applica-tion to China’s transitional context.Research Policy30,1091–1114.
Liu,X.,Wang,C.,2003.Does foreign direct investment facilitate technological progress?Evidence from Chinese industries.Research Policy32(6),945–953.
Lundvall,B.?.(Ed.),1992.National Systems of Innovation:Towards a Theory of Inno-vation and Interactive Learning.Pinter,London.
Lundvall,B.?.,1988.Innovation as an interactive process:from user–producer inter-action to the national innovation systems.In:Dosi,G.,Freeman,C.,Nelson,R.R., Silverberg,G.,Soete,L.(Eds.),Technical Change and Economic Theory.Pinter, London.
Lundvall,B.?.,Johnson,B.,Anderson,E.S.,Dalum,B.,2002.National systems of production,innovation and competence building.Research Policy31,213–231.
Malerba,F.,2005.Sectoral systems:how and why innovation differs across sec-tors.In:Fagerberg,Jan.,et al.(Eds.),The Oxford Handbook of Innovation.Oxford University Press,pp.380–406.
Meeusen,W.,van den Broeck,J.,1977.Ef?ciency estimation from Cobb-Douglas pro-duction functions with composed error.International Economic Review18(2), 435–444.
Mowery,D.,Sampat,B.,2005.Universities in national innovation systems.In:Fager-berg,Jan.,et al.(Eds.),The Oxford Handbook of Innovation.Oxford University Press,pp.209–239.
Nelson,R.R.(Ed.),1993.National Innovation System:A Comparative Analysis.Oxford University Press,New York.
Niosi,J.,2002.National systems of innovations are X-ef?cient(and X-effective):why some are slow learners.Research Policy31,291–302.
Pakes,A.,1985.On patents,R&D and the stock market rate of return.Journal of Political Economy93,390–409.
Pavitt,K.,https://www.doczj.com/doc/9c11286357.html,es and abuses of patent statistics.In:Van Rann,A.F.J.(Ed.),Hand-book of Quantitative Studies of Science and Technology.Elsevier,Amsterdam. Perez,C.,2002.Technological revolutions and?nancial capital:the dynamics of bubbles and golden ages.Edward Elgar,Cheltenham,UK and Northampton,MA. Porter,M.E.,1990.The Competitive Advantage of Nation.Free Press,New York. Radosevic,S.,2002.Regional innovation systems in central and eastern Europe: determinants,organizers and alignments.Journal of Technology Transfer27(1), 87–96.
Romer,P.,1990.Endogenous technological change.Journal of Political Economy98, S71–102.
Schumpeter,J.A.,1996.The Theory of Economic Development.Transaction Publish-ers,New Brunswick.
Soete,L.,1987.The impact of technological innovation on international trade pat-terns:the evidence reconsidered.Research Policy18,101–130.
Suarez-Villa,L.,1990.Invention,inventive learning,and innovative capacity.Behav-ioral Science35(4),290–310.
Sullivan,M.,2005.Finance and innovation.In:Fagerberg,J.,et al.(Eds.),The Oxford Handbook of Innovation.Oxford University Press,pp.240–265.
X.Li/Research Policy38(2009)338–357357
Suzuki,T.M.,1994.The Technological Transformation of Japan:From the Seventeen to the Twenty-?rst Century.Cambridge University Press,MA.
T?dtling,F.,Kaufmann,A.,1999.Innovation systems in regions of Europe—a com-parative perspective.European Planning Review7(6),699–717.
Trajtenberg,M.,1990a.A penny for your quotes:patent citations and the value of innovation.Rand Journal of Economics21(1),172–187.Trajtenberg,M.,1990b.Economic Analysis of Product Innovation:The Case of CT Scanner.Harvard University Press,Cambridge,MA.
Tylecote,A.,2006.Twin innovation systems,intermediate technology and economic development:history and prospect for China.Innovation:Management,Policy &Practice8(1/2),62–83.
https://www.doczj.com/doc/9c11286357.html, Sponsor 主办单位承办单位Organizers CPCIF
关于 ICIF China 展品范围 基础化学品 基础化学品、基本有机、无机化工原料等 石油化工及新能源 原油、溶剂油、石蜡及石油产品添加剂等 精细与专用化学品 化工原料、汽车化学品、电子化学品、染料、防御性化学品、农用化学品、皮革和纺织化学品、塑料添加剂、纸浆和造纸化学品、表面活性剂复印化学品/油墨化学品、稳定剂等 化学品包装与储运 包装:金属包装、塑料包装、柔性包装、纸包装、 包装检测设备等 储运:化工物流公司、存储设备、储罐设计与工程等 化工安全生产技术、化工环境保护技术与设备、危险化学品存储及运输等 化工安全与环保 实验室分析仪器、工程仪器、流程机械、热处理装置、泵、压缩机、制药机械、阀门、工业和劳动安全、自动化控制技术、仪器仪表等 化工技术与装备 中国国际化工展览会(ICIF China)是亚洲化工行业顶级展会。展会规模约为90,000平方米,参展企业近2,000家,展品范围涵盖了基础化学品、精细与专用化学品、化学品包装与储运、石油化工及新能源、化工技术与装备和智慧化工创新产品等。展会将吸引超过90,000名的观众前来参观。自1992年以来,ICIF China已经成为政府机构以及企业决策者交流和贸易对接的首选平台。 ICIF China 2018(第十七届)中国国际化工展览会将于2018年9月19-21日在上海新国际博览中心举办,届时,展会将与第十三届中国国际橡胶技术展、第二十一届中国国际胶粘剂及密封剂展览会同期举办,期待您的加入! 中国化工行业顶级贸易平台
创新英语演讲稿 篇一:Innovation创新-英语演讲稿 What we cannot afford to lose We cannot lose innovation There is a wonderful word which expresses the most original motions and desires among human-beings. With solving any kind of imperfections, our world has moved ahead. This is the word “innovation” that we cannot afford to lose. We chicaned every detail of the innovation. Thousands years before, we created fire when we took a stone to knock another one. Since Han Dynasty, four great inventions had been created and it is one of the greatest signs that China become to the ancient civilized country. And nowadays, thousands of software, products, architectures and public facilities have upgraded more than that about 100 years ago. So how did these happen What will you do if you are not satisfied with your tools anymore What will you do if old mode cannot afford to develop in a company There is no doubt that we should innovate no matter where we are and what we do. Not because of the design itself, but actually
Topic of PresentationTitle of Presentation 八个关于在中国创新的迷思 8 innovation myths in China 马祺 尼尔森大中华区总裁 Mitch Barns The Nielsen Company
八个关于在中国创新的迷思 8 innovation myths in China 1) 中国≠创新1) China ≠Innovation 2) 在中国创新= 成功的保证2) Innovation in China = success guaranteed 3) 中国≠其他国家3) China ≠Other countries 4) 创新者> 追随者4) Innovator > Follower 5) 跨国企业= 创新者 5) Multinational company = Innovator 6) 本土企业= 追随者6) Local company = Follower 7) 本土品牌= 低端品牌7) Local brand = Mass 8) R&D研发花费= 成功8) R&D Spending = Success
迷思一:中国缺乏创新 Myth #1: China is not an innovator 2) 在中国创新= 成功的保证2) Innovation in China = success guaranteed 3) 中国≠其他国家3) China ≠Other countries 4) 创新者> 追随者4) Innovator > Follower 5) 跨国企业= 创新者5) Multinational company = Innovator 6) 本土企业= 追随 者 6) Local company = Follower 7) 本土品牌= 低端品牌7) Local brand = Mass 8) R&D研发花费= 成功8) R&D Spending = Success 1) 中国≠创新1) China ≠Innovation
Innovation With the development of social economy, innovation has received more and more attention as to the obbligato role of innovation in social development. Why do so many people think that innovation is important? Later on, I will demonstrate this problem from three aspects. First of all, for individuals, innovative thinking has a significant impact on the future of human beings. People make progress by way of innovation day by day. Furthermore, for enterprises, innovation is the basis of the survival and development. Innovation can improve production efficiency and competitiveness of enterprises. Last but not least, for countries, innovation is the soul of national prosperity and national progress. Without innovation, countries couldn't survive in the world. So how do we promote innovation? As far as I am concerned, both individuals and governments should take an active part. For individuals, we should enhance the innovative thinking and improve the ability of innovation. In addition, we should actively participate in innovation activities. For governments, they should encourage social innovation, providing preferential policies and favorable conditions. Merely in this way, can we create a social environment conducive to innovation virtually. By the way, what do you think of this topic?
I n n o v a t i o n With the economic globalization becoming increasingly intensive, innovation has become one of central topic around the world. Many countries see it as the key to develop their economy. Innovation is an inexhaustible source of motive power for the development of a nation, and a necessary quality for the growth of a man. What can we benefit from it? Innovation can enhance overall national economy, which is important to heighten our nation status in the world. Israel is about the size of China’s B eijing, yet Israel is the most advanced economics in the Middle East because of its strong innovation supported by advanced education. Although over half of land is in state of drought, Israel has the most advanced irrigation technologies. Some well-known products were invented there, such as router, Povos, Intel Core processor and so on. Always following others’ footsteps, you will never surpass him. Being yourself and dare to innovate will be your best choice. Without innovation, Steve Jobs would not have built up Apple which got where it is today. Each new design product of Apple, conceptual unit as a whole or endless after part, is able to bring you surprise and brighten your eyes. That Apple created smartphone, which have a giant influence on peoples’ lives, also makes one of the most highly valued companies in the world. Additionally, if factories have the abilities in innovation, the factories will be booming. As a result, they can provide our people with more jobs and it will make our nation more stable. What is more, a majority of new products may be available through innovation. Therefore, it is also significant factor for improving our living standards. Owing to such benefits, no wonder more and more countries focus on innovation today. Recognizing its importance is only the first step to advocate innovation, and some effective measures should be taken for it. There is no doubt in saying that without innovation, we will lack the competence we need to have a foothold in society. Therefore, only through innovation can we make ourselves competent and competitive. It is high time that we set our mind free and stride forward to make ourselves join the stream of innovation. Our country should continue to enlarge the recruit of graduate. For another, the conditions of scientists and skilled workers should be further improved. Only in this way, our nation has a brighter future.
The Importance of Innovation 2011年12月17日四六级写作,之前2011年12月17日的四六级作文,有如下特点: 1、全英文给题,无中文提纲 2、文章给出一句名人名言或是俗语谚语,对其进行评论 3、文章主题与“人生哲理、优秀品质”相关,不再是以往的校园、学习或社会热点。四六级作文如果同时满足以上三条特点,那么以下的5篇练习题的针对性是很强的。 学习建议:建议同学们参照范文进行比较,看看文章思路、遣词造句方面有没有可以改进的地方;然后进行范文背诵,找到套路,让你的考场作文大放异彩。Directions: For this part, you are allowed 30 minutes to write a short essay entitled The Importance of Innovation by commenting on Rosabeth Moss Kanter’s famous remark ““Mindless habitual behavior is the enemy of innovation.”You should write at least 150 words but no more than 200 words. The Importance of Innovation “Mindless habitual behavior is the enemy of innovation. ” I assume that you are familiar with Rosabeth Moss Kanter’s famous remark. It is o bvious that a man who always stick to habit and experience can hardly create new things . Rosabeth Moss Kanter’s remark aims at informing us of the significance of innovation. Why does innovation play an indispensable role in our life ? innovation can promote the advancement of both individuals and society as a whole. Only those who are innovative can make continuous progress and maintain a competitive edge. Quite a few examples can be given to prove the importance of it, and I can think of no better illustration than the following one: how could Steve Jobs, a genius who changed the way of modern communication, recreation and even our life, launch so many powerful electronic products constantly without creative spirit? We should always bear in mind t hat the consciousness of innovation is of great significance to us all. Hence, we need to develop a habit of discovering new things,using new methods and applying new thoughts in our work, study or simply everyday life. “Innovation is the spirit of human being’s progress.” A philosopher once said. (202 words) “不用心思的习惯性行为是创新的敌人”我觉得你对Rosabeth Moss Kanter的这句名言很熟悉。很明显,一个总是遵循习惯和经验的人是很难创造出新事物的。 Rosabeth Moss Kanter 的这句名言目的在于告诉我们创新的重要性。为什么创新在我们的生活中扮演如此重要的角色呢?创新可以促进个人和整个社会的进步。只有那些创新的人才能去的持续的进步并且保持竞争优势。相当多的例子可以用来证明创新的重要性,我想不出比一下这个例子更好的了:斯蒂夫.乔布斯,这个改变了我们的通讯方式、娱乐方式甚至是生活方式的天才,如果没有创新精神,他怎么可能持续地发布功能强大的电子产品呢? 我们应该牢记在心,创新对于我们每个人都非常重要。因此,在我们的工作、学习甚至是生活中,我们要养成发现新事物、使用新方法、运用新思维习惯。“创新是人类进步的灵魂”一位哲学家也曾这么说过。 Unity breeds success
A very impressive interview, thank you, Pouline, Chloe and Lynn. Now let’s come to the conclusion part. In this part, I’ll talk from two aspects. One is key to success. That’s why Nokia Lumia 800 can successful got the gold award in Innovation competition. The second part is predicting the future. We will predict the future of Nokia from its current position. IDSA gave the gold award to Nokia Lumia800 and provided reasons like: it established Windows phone; combined hardware with the Windows Phone user interface and the principle of the design team. I think the primary reason for Nokia to win the award is design thinking. The IDEO’s CEO Tin Brown gave a definition of “design thinking” like this, “Design thinking is a human-centered approach to innovation that draws from the designer's toolkit to integrate the needs of people,
创新,创业和金融市场周期 虽然硬盘的数据不难发现,金融危机的出现有实质性的负面投资者愿意资助创新创业的影响。特别是这种资金匮乏令人担忧的广泛认可创新企业所谓的“绿芽”需要- 在全球范围内的经济衰退后,重新点燃经济增长。越来越多的证据表明一个强大创业,开拓创新,经济增长之间的关系。本文件首先回顾了关于创新和之间的关系的证据创业。然后将这些活动了解市场周期的后果。我们顺便看看,金融因素影响创新投资决策和创新 特别是创业型企业。然后我又到当前的经济危机的影响。突出四个关键观察: ?当前全球经济危机的创新融资的一个戏剧性的效果,无论是通过风险投资,首次公开发行(IPO),或企业风险投资。 ?这是不是第一次这样的危机,在创业融资。这些模式反映的事实,出现财政拮据限制高潜力企业家。 ?这些资金周期是严重的,因为高潜力企业的重要性创新。 我讨论的影响,越来越多的政府计划,寻求结束鼓励企业家和风险资本融资。过于频繁,这些努力都忽略了上面所讨论的关系。 1.简介:金融危机和创新 1.A.危机的简短摘要 当前的经济危机一直是显着的,它的强度和广度。国家统计局经济研究所(NBER 2008)宣布美国经济已经进入衰退期为12月然而,经济条件已经一直处于下降通道,在许多发达国家世界[两个概述,看到福斯特和马格多夫(2009)和希尔森拉特和所罗门(2009)]经济衰退以来,美国房地产泡沫有着千丝万缕的联系。当联邦储备降低利率以刺激经济在2001年科技泡沫之后9/11,低利率敞开了大门宽松的信贷中的住房市场。从2002年到2004年,作为利息率仍然低,次级贷款成为家常便饭。消费者趁着有利获得抵押贷款和金融机构的信贷条件,推广新的贷款产品和金融仪器。例如,借款人能够获得住房贷款批准几乎没有首付,而贷款人可以放弃时,他们通过他们自己的既得利益,贷款质量向机构投资者。的需求和房屋价值攀升到2006年,但2007年中期,一个信贷危机爆发。杂乱无章的借贷行为的后果和监管不力的系统迅速赶上全球金融市场。2008年的秋天,当投资银行,如贝尔斯登和雷曼兄弟塌陷的压力下,贬值的抵押贷款支持证券,信贷紧缩迫在眉睫。越来越多的房主拖欠贷款或被迫取消抵押品赎回权的时候,例如,他们不能增加按揭付款。贷款人发现自己抵押贷款支持证券,旁边没有什么值得。破灭的房地产泡沫和烦恼大型机构举行他们引发流动性危机,借贷几乎陷于停顿,信用体系完全抓住。2009年9月18日,美国。政府出面用USD700亿美元纾困计划,希望能拯救金融系统的总崩溃的边缘结束“有毒”资产,注入足够的资金进入银行迅速启动信贷市场的周期。该政府接管房利美(Fannie Mae)和房地美(Freddie Mac)的救助了美国国际集团(AIG)在9月和有效对超过价值5万亿美元的债务时,结合其他银行的债务担保。在其他国家发生类似的纾困陷入困境的银行,最主要的是瑞士和美国 英国。在过去的一年中,政府的干预,以刺激经济已成为常规,几乎预期,但许多发达国家的经济仍然脆弱。巨额债务织机,股票市场依然动荡,并担忧失业,通货膨胀的危险,挥舞基本行业继续削弱消费者的信心。虽然在某些市场有复苏的迹象,关键如住房部门仍然依赖于政府的支持。 1.B.创业和创新的影响轶事 虽然硬盘的数据不难发现,金融危机的出现有实质性的负面投资者愿意资助创新创业的影响。特别是这种资金匮乏令人担忧的光的广泛认可需要创新企业- 所谓的“绿芽”- 重新点燃经济增长之后,全球性的经济衰退。以介绍方式,可以被看作是一个高潜力的企业家融资景观谱,更先进的企业获得大量资金从不同的逐渐变大
以创新为主题的英语作文 1、How to Be Creative Being creative is to have the skill and ability to produce something new . To be honest creative is of immune significance which advances the development of economy and thus gives people pleasure and enjoyment . Do you want to be creative ?if yes here are some suggestion . First of all you should be brave . You should dare break the traditional thoughts without hesitation .You should rid yourself of the idea that what others have put forward is the best and try to doubt it .In other words seeing a good thing or idea you should try your best to creat better rather than only speaking highly of it . In addition you should be confident As the old saying goes "opportunity only knock on the door of a pepared and confident mind ."Or rather the person who are hesitant about anything can't grasp the chance for the reason that creation will flash away if not written down timely .Only when you are confident about yourself can you grasp the idea passing through your mind.
What we cannot afford to lose We cannot lose innovation There is a wonderful word which expresses the most original motions and desires among human-beings. With solving any kind of imperfections, our world has moved ahead. This is the word “innovation” tha t we cannot afford to lose. We chicaned every detail of the innovation. Thousands years before, we created fire when we took a stone to knock another one. Since Han Dynasty, four great inventions had been created and it is one of the greatest signs that China become to the ancient civilized country. And nowadays, thousands of software, products, architectures and public facilities have upgraded more than that about 100 years ago. So how did these happen? What will you do if you are not satisfied with your tools anymore? What will you do if old mode cannot afford to develop in a company? There is no doubt that we should innovate no matter where we are and what we do. Not because of the design itself, but actually for its intended purpose. If there was no Apple, everyone could not imagine how to contact others easily and enjoy a better Internet surfing.
Innovation With the economic globalization becoming increasingly intensive, innovation has become one of central topic around the world. Many countries see it as the key to develop their economy. Innovation is an inexhaustible source of motive power for the development of a nation, and a necessary quality for the growth of a man. Whatcan we benefitfrom it? Innovation can enhance overall national economy, which is important to heighten our nation status in the world.Israel is about the size of China’s Be ijing, yet Israel is the most advanced economics in the Middle East because of its strong innovation supported by advanced education. Although over half of land is in state of drought, Israel has the most advanced irrigation technologies. Some well-known products were invented there, such as router, Povos, Intel Core processor and so on.Always following others’ footsteps, you will never surpass him. Being yourself and dare to innovate will be your best choice. Without innovation, Steve Jobs would not have built up Apple which got where it is today. Each new design product of Apple, conceptual unit as a whole or endless after part, is able to bring you surprise and brighten your eyes.That Apple created smartphone, which have a giant influence on peoples’ lives, also makes one of the most highly valued companies in the world. Additionally, if factories have the abilities in innovation, the factories will be booming. As a result, they can provide our people with more jobs and it will make our nation more stable. What is more, a majority of new products may be available through innovation. Therefore, it is also significant factor for improving our living standards. Owing to such benefits, no wonder more and more countries focus on innovation today. Recognizing its importance is only the first step to advocate innovation, and some effective measures should be taken for it. There is no doubt in saying that without innovation, we will lack the competence we need to have a foothold in society.Therefore, only through innovation can we make ourselves competent and competitive. It is high time that we set our mind free and stride forward to make ourselves join the stream of innovation. Our country should continue to enlarge the recruit of graduate. For another, the conditions of scientists and skilled workers should be further improved. Only in this way, our nation has a brighter future.
I n n o v a t i o n创新英语 作文 集团标准化工作小组 #Q8QGGQT-GX8G08Q8-GNQGJ8-MHHGN#
I n n o v a t i o n With the economic globalization becoming increasingly intensive, innovation has become one of central topic around the world. Many countries see it as the key to develop their economy. Innovation is an inexhaustible source of motive power for the development of a nation, and a necessary quality for the growth of a man. What can we benefit from it Innovation can enhance overall national economy, which is important to heighten our nation status in the world. Israel is about the size of China’s Be ijing, yet Israel is the most advanced economics in the Middle East because of its strong innovation supported by advanced education. Although over half of land is in state of drought, Israel has the most advanced irrigation technologies. Some well-known products were invented there, such as router, Povos, Intel Core processor and so on. Always following others’ footsteps, you will never surpass him. Being yourself and dare to innovate will be your best choice. Without innovation, Steve Jobs would not have built up Apple which got where it is today. Each new design product of Apple, conceptual unit as a whole or endless after part, is able to bring you surprise and brighten your eyes. That Apple created smartphone, which have a giant influence on peoples’ lives, also makes one of the most highly valued companies in the world. Additionally, if factories have the abilities in innovation, the factories will be booming. As a result, they can provide our people with more jobs and it will make our nation more stable. What is more, a majority of new products may be available through innovation. Therefore, it is also significant factor for improving our living standards. Owing to such benefits, no wonder more and more countries focus on innovation today. Recognizing its importance is only the first step to advocate innovation, and some effective measures should be taken for it. There is no doubt in saying that without innovation, we will lack the competence we need to have a foothold in society. Therefore, only through innovation can we make ourselves competent and competitive. It is high time that we set our mind free and stride forward to make ourselves join the stream of innovation. Our country should continue to enlarge the recruit of graduate. For another, the conditions of scientists and skilled workers should be further improved. Only in this way, our nation has a brighter future.
Tradition and Innovation Good morning, my fellow students and dear teachers. The stories of our fathers and mothers lie in the long tradition, while the future script of our children will be written by innovation. One nation would not be itself any more if it does not inherit their tradition, which is one of the most important ingredients for the culture of a nation. The influence of tradition on the main stream thoughts is still dominant, but there were good ones as well as bad ones. Tradition is the result of our ancestors’ adaption to environment. Part of tradition still suits nowadays, such as the solar term is the guide of weather. But somehow, tradition will make people shut down their will to take a step forward which may stop the development of the economy. So, our attitude towards tradition should be dialectical, take the essence to its dregs to keep its positive energy. Innovation is an important power that will help us improve the society in many aspects. First, innovation is the way that people use their intelligence to create new things by breaking the old. Thus, innovation can activate our economy by creating new growth point and new jobs. Second, politics should suit the economy if one country wants to keep its economic growth. Politics should change along with the economy, if politics remain the same, it will have negative effects on the economy, and thus, innovation in politics is needed. Third, I want to talk about my major, Industrial Design, because a lot of things occur to at the first sight of the word “innovation”. Innovation is also needed in improving our daily life. A great example is the Apple Company and its brilliant products. Design is to produce something new and new means in some way. Einstein said: “Everything should be made as simple as possible, but not simpler.”And apple is one of those who make their products as simple, cheap and functional as they can. You know you’ve achieved perfection in design, not when you have nothing more to add, but when you have nothing more to take away. Tradition is the innovation of the past, and innovation is the new tradition. Innovation is the blast that will bring new towards old. Innovation is the best way for our nation to invest in the future.