Assessing the trophic position and ecological role of squids in marine ecosystems by means of food-web models
Marta Coll a,b,n,Joan Navarro a,Robert J.Olson c,Villy Christensen b,d
a Institut de Ci e ncies del Mar(ICM-CSIC),Passeig Mar?′tim de la Barceloneta,37-49,08003Barcelona,Spain
b Ecopath International Initiative Research Association,Barcelona,Spain
c Inter-American Tropical Tuna Commission,8604La Jolla Shores Drive,La Jolla,CA92037,USA
d Fisheries Centre,University of British Columbia,2202Main Mall,Vancouver BC,Canada V6T1Z4
a r t i c l e i n f o
Available online23August2012
Keywords:
Squids
Trophic position
Ecological role
Food-web model
Ecopath with Ecosim
Fishing impact
Climate change a b s t r a c t
We synthesized available information from ecological models at local and regional scales to obtain a global picture of the trophic position and ecological role of squids in marine ecosystems.First,static food-web models were used to analyze basic ecological parameters and indicators of squids:biomass, production,consumption,trophic level,omnivory index,predation mortality diet,and the ecological role.In addition,we developed various dynamic temporal simulations using two food-web models that included squids in their parameterization,and we investigated potential impacts of?shing pressure and environmental conditions for squid populations and,consequently,for marine food webs.Our results showed that squids occupy a large range of trophic levels in marine food webs and show a large trophic width,re?ecting the versatility in their feeding behaviors and dietary habits.Models illustrated that squids are abundant organisms in marine ecosystems,and have high growth and consumption rates,but these parameters are highly variable because squids are adapted to a large variety of environmental conditions.Results also show that squids can have a large trophic impact on other elements of the food web,and top-down control from squids to their prey can be high.In addition, some squid species are important prey of apical predators and may be keystone species in marine food webs.In fact,we found strong interrelationships between neritic squids and the populations of their prey and predators in coastal and shelf areas,while the role of squids in open ocean and upwelling ecosystems appeared more constrained to a bottom-up impact on their predators.Therefore,large removals of squids will likely have large-scale effects on marine ecosystems.In addition,simulations con?rm that squids are able to bene?t from a general increase in?shing pressure,mainly due to predation release,and quickly respond to changes triggered by the environment.Squids may thus be very sensitive to the effects of?shing and climate change.
&2012Elsevier Ltd.All rights reserved.
1.Introduction
Cephalopods are widely distributed in the world’s oceans, inhabiting marine ecosystems from coastal lagoons and shallow waters to open oceans.They comprise approximately800living species that are members of the molluscan class Cephalopoda. Cephalopods comprise demersal species,mainly octopuses and cuttle?sh,and pelagic species,mainly squids(Boyle and Rodhouse,2005).Squids,order Teuthida,are the most diverse group of cephalopods with around300species classi?ed into29 families.Squid species include from the largest invertebrate discovered to date,the colossal squid,Mesonychoteuthis hamiltoni,that can reach14m long,to much smaller species of5–10cm long length such the Caribbean reef squid,Heteroteuthis serventii.
The biology and ecology of cephalopod species have been widely investigated in many regions(e.g.,Passarella and Hopkins, 1991;Quetglas et al.,1998).However,benthic and demersal cephalopods are better studied than their pelagic counterparts, mainly because sampling of benthic and demersal habitats (usually by trawl)is easier than sampling pelagic habitats.More-over,cephalopod assemblages in shallow waters are better characterized than those from the deep sea and open ocean due to sampling limitations(e.g.,Cherel et al.,2009).In spite of these limitations,important advances are being made regarding the ecology of squids in many marine ecosystems(Cherel and Hobson,2005;Cherel et al.,2009;Olson and Young,2007).For example,information about the giant squid,Architeuthis sp.,and the colossal squid,is increasing(Cherel et al.,2009;Guerra et al., 2011;Rosa and Seibel,2010),while knowledge of migration
Contents lists available at ScienceDirect
journal homepage:https://www.doczj.com/doc/848894275.html,/locate/dsr2
Deep-Sea Research II
n Corresponding author at:Institut de Ci e ncies del Mar(ICM-CSIC),Passeig
Mar?′tim de la Barceloneta,37-49,08003Barcelona,Spain.Tel.:t34932309543.
E-mail address:mcoll@icm.csic.es(M.Coll).
Deep-Sea Research II95(2013)21–36
patterns and distribution of squids is becoming more available (Bellido et al.,2001;Gilly et al.,2006).
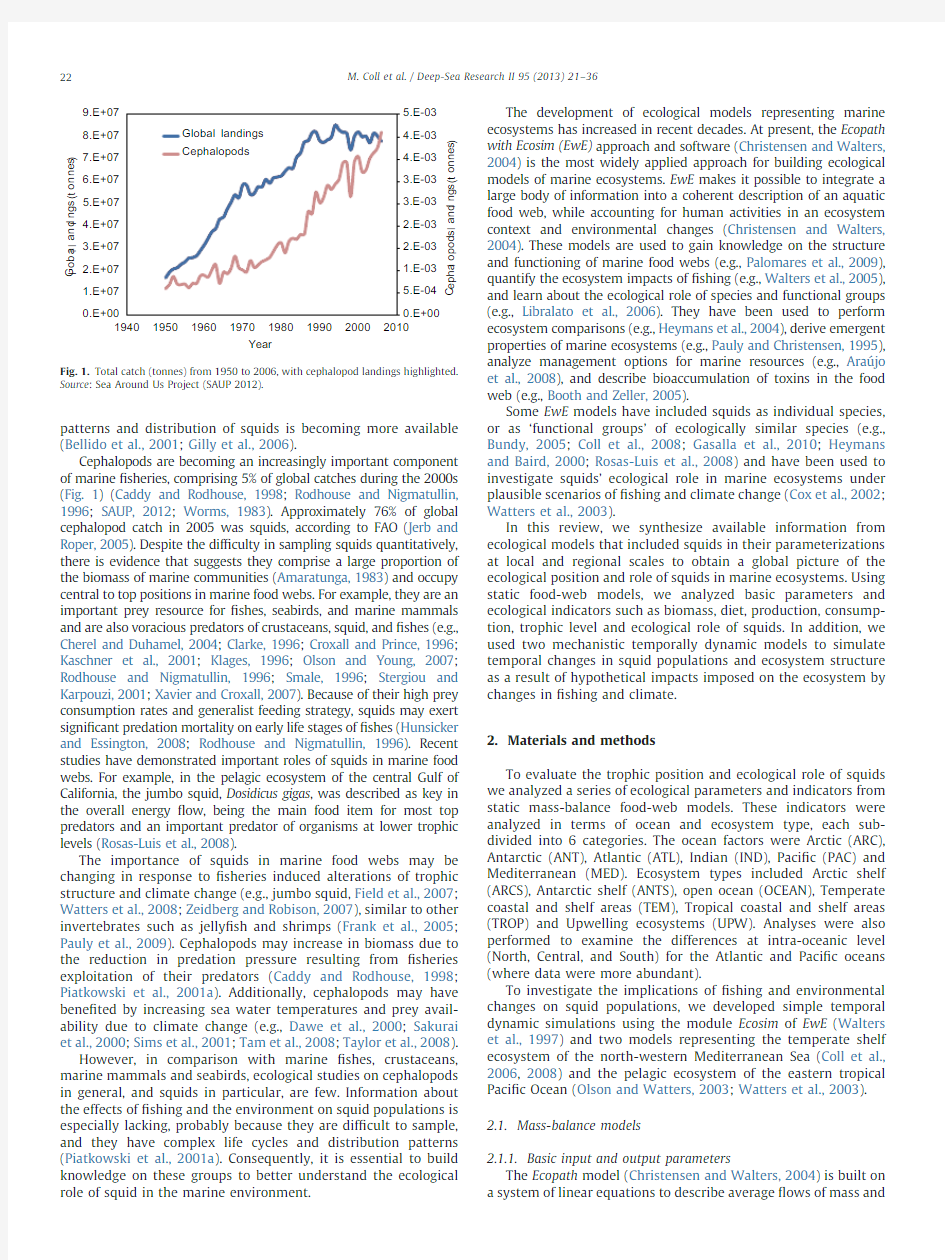
Cephalopods are becoming an increasingly important component of marine ?sheries,comprising 5%of global catches during the 2000s (Fig.1)(Caddy and Rodhouse,1998;Rodhouse and Nigmatullin,1996;SAUP,2012;Worms,1983).Approximately 76%of global cephalopod catch in 2005was squids,according to FAO (Jerb and Roper,2005).Despite the dif?culty in sampling squids quantitatively,there is evidence that suggests they comprise a large proportion of the biomass of marine communities (Amaratunga,1983)and occupy central to top positions in marine food webs.For example,they are an important prey resource for ?shes,seabirds,and marine mammals and are also voracious predators of crustaceans,squid,and ?shes (e.g.,Cherel and Duhamel,2004;Clarke,1996;Croxall and Prince,1996;Kaschner et al.,2001;Klages,1996;Olson and Young,2007;Rodhouse and Nigmatullin,1996;Smale,1996;Stergiou and Karpouzi,2001;Xavier and Croxall,2007).Because of their high prey consumption rates and generalist feeding strategy,squids may exert signi?cant predation mortality on early life stages of ?shes (Hunsicker and Essington,2008;Rodhouse and Nigmatullin,1996).Recent studies have demonstrated important roles of squids in marine food webs.For example,in the pelagic ecosystem of the central Gulf of California,the jumbo squid,Dosidicus gigas ,was described as key in the overall energy ?ow,being the main food item for most top predators and an important predator of organisms at lower trophic levels (Rosas-Luis et al.,2008).
The importance of squids in marine food webs may be changing in response to ?sheries induced alterations of trophic structure and climate change (e.g.,jumbo squid,Field et al.,2007;Watters et al.,2008;Zeidberg and Robison,2007),similar to other invertebrates such as jelly?sh and shrimps (Frank et al.,2005;Pauly et al.,2009).Cephalopods may increase in biomass due to the reduction in predation pressure resulting from ?sheries exploitation of their predators (Caddy and Rodhouse,1998;Piatkowski et al.,2001a ).Additionally,cephalopods may have bene?ted by increasing sea water temperatures and prey avail-ability due to climate change (e.g.,Dawe et al.,2000;Sakurai et al.,2000;Sims et al.,2001;Tam et al.,2008;Taylor et al.,2008).
However,in comparison with marine ?shes,crustaceans,marine mammals and seabirds,ecological studies on cephalopods in general,and squids in particular,are https://www.doczj.com/doc/848894275.html,rmation about the effects of ?shing and the environment on squid populations is especially lacking,probably because they are dif?cult to sample,and they have complex life cycles and distribution patterns The development of ecological models representing marine ecosystems has increased in recent decades.At present,the Ecopath with Ecosim (EwE)approach and software (Christensen and Walters,2004)is the most widely applied approach for building ecological models of marine ecosystems.EwE makes it possible to integrate a large body of information into a coherent description of an aquatic food web,while accounting for human activities in an ecosystem context and environmental changes (Christensen and Walters,2004).These models are used to gain knowledge on the structure and functioning of marine food webs (e.g.,Palomares et al.,2009),quantify the ecosystem impacts of ?shing (e.g.,Walters et al.,2005),and learn about the ecological role of species and functional groups (e.g.,Libralato et al.,2006).They have been used to perform ecosystem comparisons (e.g.,Heymans et al.,2004),derive emergent properties of marine ecosystems (e.g.,Pauly and Christensen,1995),
analyze management options for marine resources (e.g.,Arau
′jo et al.,2008),and describe bioaccumulation of toxins in the food web (e.g.,Booth and Zeller,2005).
Some EwE models have included squids as individual species,or as ‘functional groups’of ecologically similar species (e.g.,Bundy,2005;Coll et al.,2008;Gasalla et al.,2010;Heymans and Baird,2000;Rosas-Luis et al.,2008)and have been used to investigate squids’ecological role in marine ecosystems under plausible scenarios of ?shing and climate change (Cox et al.,2002;Watters et al.,2003).
In this review,we synthesize available information from ecological models that included squids in their parameterizations at local and regional scales to obtain a global picture of the ecological position and role of squids in marine https://www.doczj.com/doc/848894275.html,ing static food-web models,we analyzed basic parameters and ecological indicators such as biomass,diet,production,consump-tion,trophic level and ecological role of squids.In addition,we used two mechanistic temporally dynamic models to simulate temporal changes in squid populations and ecosystem structure as a result of hypothetical impacts imposed on the ecosystem by changes in ?shing and climate.
2.Materials and methods
To evaluate the trophic position and ecological role of squids we analyzed a series of ecological parameters and indicators from static mass-balance food-web models.These indicators were analyzed in terms of ocean and ecosystem type,each sub-divided into 6categories.The ocean factors were Arctic (ARC),Antarctic (ANT),Atlantic (ATL),Indian (IND),Paci?c (PAC)and Mediterranean (MED).Ecosystem types included Arctic shelf (ARCS),Antarctic shelf (ANTS),open ocean (OCEAN),Temperate coastal and shelf areas (TEM),Tropical coastal and shelf areas (TROP)and Upwelling ecosystems (UPW).Analyses were also performed to examine the differences at intra-oceanic level (North,Central,and South)for the Atlantic and Paci?c oceans (where data were more abundant).
To investigate the implications of ?shing and environmental changes on squid populations,we developed simple temporal dynamic simulations using the module Ecosim of EwE (Walters et al.,1997)and two models representing the temperate shelf ecosystem of the north-western Mediterranean Sea (Coll et al.,2006,2008)and the pelagic ecosystem of the eastern tropical Paci?c Ocean (Olson and Watters,2003;Watters et al.,2003).2.1.Mass-balance models
0.E+005.E-04
1.E-03
2.E-032.E-03
3.E-033.E-03
4.E-034.E-03
5.E-03
0.E+00
1.E+07
2.E+07
3.E+07
4.E+07
5.E+07
6.E+07
7.E+07
8.E+07
9.E+071940
1950
1960
19701980
19902000
2010
C e p h a l o p o d s l a n d i n g s (t o n n e s )
G l o b a l l a n d i n g s (t o n n e s )
Year
Global landings Cephalopods
Fig.1.Total catch (tonnes)from 1950to 2006,with cephalopod landings highlighted.Source :Sea Around Us Project (SAUP 2012).
M.Coll et al./Deep-Sea Research II 95(2013)21–36
22
energy between a series of functional groups that represent the organisms inhabiting an ecosystem during a speci?c period of time.Functional groups can be composed of various species, individual species or ontogenetic fractions of a species.The?ow to and from each functional group is described by the main Ecopath equation representing production of each group i:
B iáeP=BTi?X
B jáeQ=BTjáD
C jitY itE itBA itB iáeP=BTiáe1àEE iT
e1T
where B i is the biomass of i,P/B i the production/biomass ratio,Y i the total?shery catch rate,E i the net migration rate,BA i the biomass accumulation rate,EE i the ecotrophic ef?ciency,the proportion of the production that is utilized in the system,B j the biomass of consumers or predators j,Q/B j the consumption per unit of biomass of j and DC ji the fraction of prey i in the diet of predator j.The second equation of Ecopath describes consumption as the sum of production,respiration and unassimilated food for each group(Christensen and Walters,2004).
To parameterize a mass-balance model,three of the four parameters B i,P/B i,QIB j or EE i are normally used as inputs,in addition to Y i,BA i and DC ji.After the model is balanced,a series of ecological parameters and indicators are calculated.Therefore, Ecopath models contain important information at the functional group or species level that can be used to explore the position and role of these species within their food webs.
In this study,we reviewed information from published models (Table S2)that included squids as a mixed group of species or as individual species.For each squid group in each model we obtained the following parameters:Biomass(B),Diet Composition (DC ji),Production per unit of Biomass(P/B),Consumption per unit of Biomass(Q/B),Trophic Level(TL),Omnivory Index(OI),and Predation Mortality(M2).From each publication we recorded the species,name of the ecosystem,ocean and ecosystem type, depths,and year(s)of the model.
Biomass for each functional group in EwE models is presented per unit of surface area,normally in terms of tonnes per square kilometer(t kmà2).P/B and Q/B are ratios of production and consumption,respectively,expressed as yrà1.The TL provides estimates of the trophic position of a particular species or functional group in the food web(Odum and Heald,1975).The TL of a group j is calculated as:
TL j?1t
X n
i?1
DC jiáTL ie2T
where TL i is the trophic level of prey i.By convention,TL of primary producers?1.0.
The OI is a measure of the distribution of feeding interactions among trophic levels by functional group(Christensen et al., 2008).The OI of group j is calculated as the variance of TL of prey i:
OI j?
X n
i?1
?TL iàeTL jà1T 2U DC jie3T
where the contribution of each prey i to the variance of the group j is a proportion of the fraction of prey i in the diet of j(DC ji). When OI is zero,the group is specialized(it feeds on a single trophic level).Large values of OI indicate feeding on many trophic levels and thus a more generalist strategy(Christensen et al., 2008).
Model results are also available in terms of the total mortality of each group partitioned into?shing mortality,predation mor-tality(M2)and other mortality.Partitions of total mortality 2.1.2.Total impact,keystoneness and top-down indicators
Mass-balance models provide results that can be used to quantify the impact that a functional group has on the overall food web and assess its ecological role.An example is the mixed trophic impacts indicator,derived from economic input–output theory(Leontief,1951),which allows quanti?cation of direct and indirect trophic interactions among groups(Christensen and Walters,2004;Ulanowicz and Puccia,1990).The quanti?cation of trophic interactions is calculated as the product of all net impacts for all the possible pathways in the food web linking all prey i and predators j in the matrix of trophic impacts(m ji).In this study,for each squid group,we calculated the relative Total Impact(TI),two indicators of Keystoneness(KS1and KS2),and an indicator of the Top-Down effects(TD).
The relative Total Impact(TI)indicator(that ranges between 0and1,with values close to1indicating higher impact)was calculated excluding cannibalism from the m ji as:
TI j?
???????????????
X n
j a i
m2
ji
v u
u t
e4T
The?rst method to calculate the keystoneness of a functional group j(KS1)(Libralato et al.,2006)is described as:
KS1j?Log?TI je1àp jT e5Twhere p j is the contribution of each functional group j to the total biomass of the food web.Values of KS1close to or larger than 0have the largest keystone role,whereas groups with large negative values have low keystoneness.
An alternative indicator of keystoneness(KS2)is a modi?ca-tion from an indicator by Power et al.(1996)that expresses KS2j as:
KS2j?Log?TI j Ue1=p jT e6TLarger values of KS2are related with a larger keystone role of functional groups.
The Top-Down(TD)indicator was calculated from the matrix of trophic impacts(m ji)as the percentage of negative contribu-tions to the overall effects estimated in Eq.(4)(following Libralato et al.,2006).Values of TD effect range from0%to100%,with larger values indicating a greater top-down effect.
2.1.
3.Statistical analysis of model parameters and indicators
We used the non-parametric multivariate permutational ana-lysis of variance(PERMANOVA,in PRIMER with PERMANOVAtv. 6,PRIMER-E Ltd.,Plymouth,UK)on the Euclidean distance matrix to investigate differences in model ecological parameters and indicators between oceans,ecosystem types and intra-oceanic regions(North,Central,and South)in the Atlantic and Paci?c oceans.
PERMANOVA calculates a pseudo-F statistic that is directly analogous to the F-statistic for multifactorial univariate ANOVA models,but uses permutation procedures(here9999permuta-tions)to obtain p-values for each term in the model(Anderson et al.,2008).Due to the lack of replication and an unbalanced design among factors,we performed a1-way analysis with each factor using each indicator separately and used the unrestricted permutation of raw data.Indicators were normalized prior to the construction of the Euclidean distance matrices(Clarke and Gorley,2006).
2.2.Dynamic simulations
M.Coll et al./Deep-Sea Research II95(2013)21–3623
time-dependent differential equations starting with (initial con-ditions)the baseline mass-balance model (Eq.(1))as:
dB i =dt ?g i U
X Q ji àX
Q ij tI i àeM i tF i te i TU B i e7Twhere dB i /dt represents the growth rate of group i during the time
interval dt in terms of its biomass B i ,g i the net growth ef?ciency (production/consumption ratio,P /Q ),M i the non-predation nat-ural mortality rate,F i ?shing mortality rate,e i emigration rate,I i immigration rate,and e i áB i àI i the net migration rate.The two summations estimate consumption rates,the ?rst expressing the total consumption by group i ,and the second the predation by all predators on the same group i .Consumption rates Q ji are calculated based on the ‘foraging arena’concept,where B i ’s are divided into vulnerable and invulnerable components (Ahrens et al.,2012;Walters et al.,1997).Therefore,Ecosim simulations are especially sensitive to the ‘vulnerability’settings,which incorporates density-dependency and express how far a group is from its carrying capacity (Christensen and Walters,2004;Christensen et al.,2008).Fitting the model to data is thus advised before performing simulations.
Two models representing a temperate shelf ecosystem of the NW Mediterranean Sea (NWM)(Coll et al.,2006,2008)and the pelagic eastern tropical Paci?c Ocean (ETP)(Olson and Watters,2003;Watters et al.,2003)were used for the simulations.The NWM model had been ?tted to time series data from 1978to 2010(Coll et al.,2008)and included a group of ‘‘benthopelagic cephalopods’’,composed of squids.The ETP model had been ?tted to time series from 1961to 1998(Olson and Watters,2003)and included a group of ‘‘cephalopods’’,which was mainly composed of squids (Table S2).The NWM model represented a highly ?shed ecosystem,while the ETP model represented an ecosystem that
was moderately ?shed.No ?sheries for cephalopods were included in the ETP model due to lack of information.Therefore,we simulated a squid ?shery in the EPO initially targeting 2%of the biomass of the cephalopod group,beginning in 1998.
A baseline simulation (or simulation 0)was run with default parameters from the ?nal ?tting procedure explained in Coll et al.(2008)and Olson and Watters (2003)and was run for 20yr from the last year of the ?tting procedure,while keeping all parameters constant.Then,we developed six 20-yr simulations starting with the last year of the ?tting procedure,which included:
Simulation 1:increase of ?shing effort for all ?sheries (2-fold for the NWM model and 10-fold for the ETP model).
Simulation 2:increase of ?shing mortality on squids (2-fold for the NWM model and 10-fold for the ETP model).
Simulation 3:increase of ?shing effort for all ?sheries (2-fold for the NWM model and 10-fold for the ETP model)and a 2-fold increase in primary production.
Simulation 4:increase of ?shing mortality on squids (2-fold for the NWM model and 10-fold for the ETP model)and a 2-fold increase of primary production.
Simulation 5:increase of ?shing effort for all ?sheries (2-fold for the NWM model and 10-fold for the ETP model)and a 50%decrease of primary production.
Simulation 6:increase of ?shing mortality on squids (2-fold for the NWM model and 10-fold for the ETP model)and a 50%decrease of primary production.
Results from the simulations were compared in terms of the biomass trajectories of the squid groups and their main prey and predators,for both food webs.
Ocean T r o p h i c L e v e l
2.5
3.5
ANT
ARC ATL
IND MED
PAC
Ocean O m n i v o r y I n d e x
0.0
0.20.40.6ANT
ARC ATL
IND MED
PAC
Ecosystem type
T r o p h i c L e v e l
2.5
3.5
ANTS ARCS OCEAN TEM TROP
UPW Ecosystem type
O m n i v o r y I n d e x
0.0
0.20.40.6ANTS ARCS OCEAN TEM TROP
UPW P-value = 0.003
P-value = 0.38
P-value = 0.02
P-value = 0.27
Fig.2.Boxplots of Trophic Level and Omnivory Index of squids from food-web models by (a and b)ocean (Antarctic:ANT,Arctic:ARC,Atlantic:ATL,Indian:IND,M.Coll et al./Deep-Sea Research II 95(2013)21–36
24
3.Results
3.1.Basic ecological parameters and indicators of squids by ocean,ecosystem type,and region
We found 75food-web models that included squids as distinct functional groups.A total of 39models included a mixed-group with various species of squids together,23models included distinct species and 13models included two ontogenetic groups,large and small squids (Table S1).Considering mixed-groups and distinct species,we collected information for 92functional groups (Table S1).Most of the data came from models representing ecosystems of ATL (41%)and PAC (34%)oceans,with fewer data available in ANT (9%),MED (8%),IND (5%)and ARC (3%).Data
Ocean B i o m a s s
246810ANT
ARC ATL IND MED PAC
Ocean
P /B
2468ANT
ARC
ATL IND MED
PAC
Ocean
Q /B
204060ANT
ARC
ATL IND MED
PAC
Ocean
M
2
246ANT ARC
ATL
IND MED
PAC
Ecosystem type
B i o m a s s
246810ANTS ARCS OCEAN TEM TROP
UPW Ecosystem type
P /B
2468ANTS ARCS OCEAN TEM TROP
UPW Ecosystem type
Q /B
204060ANTS ARCS OCEAN TEM TROP
UPW Ecosystem type
M 2
0246ANTS ARCS OCEAN TEM TROP
UPW P-value = 0.31
P-value = 0.0001
P-value = 0.009
P-value = 0.001
P-value = 0.03
P-value = 0.008
P-value = 0.75
P-value = 0.03
Fig.3.Boxplots of biomass (t km à2),P /B (yr à1),Q /B (yr à1)and predation mortality (M 2,yr à1)of squids from food-web models by (a–d)ocean (Antarctic:ANT,Arctic:M.Coll et al./Deep-Sea Research II 95(2013)21–3625
came mainly from TEM (33%),OCEAN (32%)and TROP (26%)ecosystems,while fewer data were available from UPW (4%),ARCS (4%)and ANTS (1%).
Diet composition data from squid groups in food-web models indicated that the main prey of squids are zooplankton,forage ?shes (sardine,anchovy and other small pelagic ?shes),benthic invertebrates,shrimps,detritus and cephalopods,including squids (Table S1).In general,squids inhabiting coastal areas and shelves primarily forage on forage ?shes,demersal ?shes,and invertebrates,while those in open oceans and upwelling systems primarily target forage ?shes and zooplankton.
The mean Trophic Level (TL )obtained from models for all squid groups was 3.6570.39(mean and standard deviation),with a maximum of 4.42and minimum of 2.35.Signi?cant differences were found among TL values by ocean (Fig.2a,pseudo-F 5,86?3.93,p ?0.003),with the lowest values in ARC and PAC and highest in MED and ANT.We also found differences in TL by ecosystem type (Fig.2c,pseudo-F 5,86?2.92,p ?0.02),with the lowest values in ARCS.
The mean value for the Omnivory Index (OI )was 0.2370.16,with ranges from 0.01to 0.63.OI was lowest in ARC and similar in the rest of the oceans considered (Fig.2b),with overall similar results by ocean (pseudo-F 5,82?1.10,p ?0.38).OI values by ecosystem type were lower in median and in range in ARCS,
and larger and wider ranging in the other ecosystems,but overall similar among ecosystem types (Fig.2d,pseudo-F 5,82?1.31,p ?0.27).
Large variations were found in values of Biomass (B ,t km à2),P /B (yr à1),Q /B (yr à1)and Predation Mortality (M 2,yr à1)of squids in food-web models by ocean and ecosystem type (Fig.3).Biomass estimates varied from 0.03to 9.98t km à2with a mean of 1.1271.48t km -2.Biomass was lowest in MED (Fig.3a,pseudo-F 5,83?1.14,p ?0.31)and largest in ARCS and ANTS eco-systems (Fig.3e,pseudo-F 5,83?4.24,p ?0.03),although means were not signi?cantly different by ocean.P /B values ranked from 0.15to 8.91yr à1,with a mean of 3.1371.89yr à1,and were the highest in PAC (Fig.3b,pseudo-F 5,85?0.49,p ?0.0001)and in UPW and TROP ecosystems (Fig.3f,pseudo-F 5,85?3.74,p ?0.008).Q /B values ranged between 2.36and 70.0yr à1with a mean of 18.64713.60yr à1,and were highest in PAC and MED oceans (Fig.3c,pseudo-F 5,85?5.18,p ?0.009)and in UPW systems (Fig.3g,pseudo-F 5,85?0.54,p ?0.75).M 2ranged from 0.15to 7.54yr à1,with a mean of 2.5171.84yr à1,and was higher in PAC and ARC oceans (Fig.3d,pseudo-F 5,83?4.46,p ?0.001),and in UPW ecosystems (Fig.3h,pseudo-F 5,83?2.58,p ?0.03).
Results by region within the Atlantic and Paci?c oceans showed some interesting results.In ATL,mean B was 1.2671.76t km à2,with the largest values in the North and
Atlantic region B i o m a s s
246810Central
North South
Atlantic region P /B
1
23456Central
North
South
Atlantic region Q /B
5
152535
Central
North
South
Atlantic region
T r o p h i c L e v e l
3.2
3.6
4.04.4Central
North
South
Atlantic region
O m n i v o r y I n d e x
0.0
0.20.40.6Central
North
South Atlantic region
P r e d a t o r m o r t a l i t y
123456Central
North
South
P-value = 0.06
P-value = 0.0001
P-value = 0.52
P-value = 0.0001
P-value = 0.06
P-value = 0.003
M.Coll et al./Deep-Sea Research II 95(2013)21–36
26
lowest in Central areas,although not signi?cantly different (Fig.4a,pseudo-F 2,32?2.71,p ?0.06).In PAC,mean B was slightly lower than in ATL with 1.2371.49t km à2and values were similar among regions (Fig.5a,pseudo-F 2,26?0.88,p ?0.45).P /B values in ATL reached a mean of 2.2671.62yr à1and were clearly highest in the Central ANT and lowest in the Northern regions (Fig.4b,pseudo-F 2,32?21.72,p ?0.0001),while values of P /B in PAC were greater,with an overall mean of 4.5671.94yr à1and showed similarities among regions (Fig.5d,pseudo-F 2,28?0.61,p ?0.55).Q /B in ATL regions showed large ranges and were clearly higher in the Central area (Fig.4c,pseudo-F 2,32?73.11,p ?0.0001),with an overall mean of 14.22712.79yr à1.In PAC region values were larger than in ATL,with an average of 26.06715.13yr à1,and lower values in the South (Fig.5c,pseudo-F 2,28?3.13,p ?0.06).
TL values within both ATL and PAC levels showed large ranges and no clear differences between levels (Fig.4d,pseudo-F 2,33?0.66,p ?0.52,and Fig.5d,pseudo-F 2,28?0.32,p ?0.73,respectively),with means of 3.6970.41and 3.6370.35.OI values were less variable in the Central areas of ATL (Fig.4e,pseudo-F 2,30?3.18,p ?0.06)and in the Central and Northern areas of PAC (Fig.5e,pseudo-F 2,28?0.20,p ?0.83)compared to the other regions.Mean OI values in ATL and PAC oceans were similar
(0.2470.18and 0.2370.10,respectively).M 2values were highly variable in the Central ATL and showed differences among regions (Fig.4f,pseudo-F 2,30?12.18,p ?0.003),while in PAC region values were similar overall (Fig.5f,pseudo-F 2,28?0.28,p ?0.74).Mean M 2was lower in ATL (2.0771.57),than in PAC (3.6072.11),although variability was very large in both data sets.3.2.Ecological role of squids by ocean,ecosystem type and region The relative Total Impact (TI )of squids ranked from 0.09to 0.95,with a mean value of 0.4570.22,the highest values in MED and lowest in IND and ANT oceans (Fig.6a,pseudo-F 5,68?2.85,p ?0.02).The range of TI values was also large within ecosystem types,with no differences between ecosystems (Fig.6e,pseudo-F 5,68?0.78,p ?0.56).
Keystoneness index 1(KS 1)showed a mean value of à0.3270.27and a range from 0.07(most keystone)to à1.14(least keystone).In ARC and ATL oceans,the KS 1reached values close to or larger than 0,indicating the greatest keystone role,in a few cases,while values in IND were lowest (Fig.6b,pseudo-F 5,69?4.29,p ?0.004).In ARCS,OCEAN and TROP regions,KS 1also reached values closer to or larger than 0,but overall results were similar among ecosystem types (Fig.6f,pseudo-F 5,69?1.50,
Pacific region
B i o m a s s
246Central
North South
Pacific region
P /B
2
468Central
North South
Pacific region
Q /B
10
305070
Central
North South
Pacific region
T r o p h i c L e v e l
3.2
3.6
4.04.4Central
North South
Pacific region
O m n i v o r y I n d e
x
0.1
0.3
0.5
Central
North South
Pacific region
P r e d a t o r m o r t a l i t y
1
357Central
North South
P-value = 0.45
P-value = 0.55
P-value = 0.06
P-value = 0.73
P-value = 0.83
P-value = 0.74
M.Coll et al./Deep-Sea Research II 95(2013)21–3627
p ?0.20).Keystoneness index 2(KS 2)reached values from 0.11(least keystone)to 2.21(most keystone)with a mean of 2.1070.67,and results were similar among oceans (Fig.6c,The Top-Down effect (TD )values ranged from 6%to 99%,with an overall mean of 65%724%.TD s were similar and overall medium to large for most of the functional groups by ocean (Fig.6d,pseudo-Ocean
T I
0.2
0.40.6
0.8
ANT
ARC
ATL
IND MED
PAC
Ocean
K S 1
-1.0
-0.6
-0.2ANT
ARC
ATL
IND MED
PAC
Ocean
ANT
ARC
ATL IND MED
PAC
Ocean
ANT
ARC
ATL
IND MED
PAC
K S 2
0.0
1.0
2.03.0T D
0.2
0.6
1.0
Ecosystem type
T I
0.2
0.40.60.8
ANTS ARCS OCEAN TEM TROP
UPW
Ecosystem type
K S 1
-1.0
-0.6-0.2ANTS ARCS OCEAN TEM TROP
UPW Ecosystem type
ANTS ARCS OCEAN TEM TROP
UPW
Ecosystem type
ANTS ARCS OCEAN TEM TROP
UPW K S 2
0.0
1.0
2.03.0T D
0.2
0.6
1.0
P-value = 0.02
P-value = 0.004
P-value = 0.13
P-value = 0.19
P-value = 0.56
P-value = 0.20
P-value = 0.01
P-value = 0.14
Fig.6.Boxplots of Total Impact (TI),Keystoneness indices (KS1and KS2),and Top-Down effect (TD)from food-web models by (a–d)ocean (Antarctic:ANT,Arctic:ARC,Atlantic:ATL,Indian:IND,Mediterranean:MED,and Paci?c:PAC)and (e–h)ecosystem type (Arctic shelf:ARCS,Antarctic shelf:ANTS,open ocean:OCEAN,temperate coastal and shelf areas:TEM,tropical coastal and shelf areas:TROP,and upwelling:UPW).The smallest observation (sample minimum),lower quartile,median,upper quartile,largest observation (sample maximum)and outliers are indicated.
M.Coll et al./Deep-Sea Research II 95(2013)21–36
28
Results by intra-oceanic level within the Atlantic and Paci?c oceans showed wide ranges of TI values as well,with similarly high results overall (Figs.7a and e,pseudo-F 2,19?0.80,p ?0.56and pseudo-F 2,25?1.59,p ?0.23,respectively),and with means of 0.4470.24and 0.4970.20,respectively.In both cases,higher values were reported in the Central region,followed by the North and the South.This trend was also observed in the KS 1indicator (Figs.7b and f,pseudo-F 2,21?1.10,p ?0.34and pseudo-F 2,25?2.42,p ?0.09,respectively),although not signi?cantly dif-ferent,with overall lower mean values in ATL (à0.3770.32)than PAC (à0.2370.17).The KS 2indicator showed the same trend as the KS 1in ATL (Fig.7c,pseudo-F 2,19?2.04,p ?0.15).On the contrary,the KS 2values in PAC were lowest in the Central regions (Fig.7e,pseudo-F 2,25?6.92,p ?0.005).Mean values of KS 2were slightly higher in PAC (2.0970.64)than ATL (2.0170.67).The TD effect also showed overall medium to large values and a decreas-ing trend from Central to Northern and Southern regions (Figs.7d and h,pseudo-F 2,40?3.01,p ?0.06and pseudo-F 2,25?1.22,p ?0.32,respectively).Mean values reached 69%726%in ATL and 58%726%in PAC.
Atlantic region T I
0.2
0.40.60.8
Central
North
South
Atlantic region K S 1
-1.0
-0.6-0.2Central North
South
Atlantic region
Central
North
South
Atlantic region
Central
North
South
K S 2
1.0
1.5
2.02.5
3.0T D
0.2
0.61.0
Pacific region
T I
0.2
0.40.60.8
Central
North South
Pacific region
K S 1
-0.7
-0.5-0.3-0.1Central
North South
Pacific region
K S 2
1.0
2.0
3.0North Pacific region
T D
0.2
0.40.60.8North P-value = 0.46
P-value = 0.34
P-value = 0.06
P-value = 0.15
P-value = 0.23
P-value = 0.09
P-value = 0.005
P-value = 0.32
M.Coll et al./Deep-Sea Research II 95(2013)21–3629
3.3.Dynamic simulations of?shing and climate
Results from temporal dynamic simulations of the NW Med-iterranean model(NWM)showed changes in the biomass of squids and in their prey and predators under several scenarios of changing?shing and primary production(Fig.8).Squids’biomass increased by29%under simulation0,i.e.the baseline simulation in which there had been an increase of?shing effort during model?tting(Coll et al.,2008),but decreased under both simulations1and2,i.e.under2-fold further increase of overall ?shing effort and of squids?shing mortality(Table1and Fig.8a). Under simulations3and4,which included increased?shing effort and?shing mortality combined with an increase of primary production,squids biomass increased pronouncedly as squids bene?t from higher prey production(e.g.European sardine,Sardina pilchardus,and poor cod,Trisopterus minutus,Figs.8b and c). In contrast,under simulations5and6,with the same increase in?shing effort and?shing mortality,but a50%decline in primary production,squids’biomass reached a minimum,illustrating the importance of bottom up processes for squids’dynamics.
Important prey of squids in the NWM model,such as European sardine,and poor cod,showed biomass changes due to pre-dator-release(Figs.8b and c and Table1).Sardine had declined under simulation0,and this decline was stronger under simula-tion1due to an increase of direct?shing mortality but weaker under simulation2due to less predation by squids(Fig.8b and Table1).Biomass of sardine also increased under simulations 3and4,when both?shing and primary production increased,thus bene?tting from an increase in prey availability and overall reduction in predators.However,this increase tended to reach an asymptote at the end of the20-yr simulation period due to higher consumption by other predators such as squids.The squids increased much more than their sardine prey when primary production was increased.Under simulations5and6,the bio-mass of sardine reached a minimum,illustrating the impact of changes in primary production on small pelagic?shes,following squid dynamics.Poor cod declined under simulation0,and showed similar trends than sardine under scenario1and2 (Fig.8c).As observed for squids and sardines,poor cod increased substantially under simulations3and4,thus bene?ting from higher availability of prey.On the contrary,poor cod biomass reached a minimum under simulations5and
6.
5
10
15
20
20102015202020252030
F
i
n
a
l
/
I
n
i
t
i
a
l
B
i
o
m
a
s
s
Years
Squids
Sim4
Sim3
Sim2
Sim1
Sim5
Sim6
Sim0
0.5
1
1.5
2
2.5
3
20102015202020252030
F
i
n
a
l
/
I
n
i
t
i
a
l
B
i
o
m
a
s
s
Year
Sardine
Sim3
Sim4
Sim2
Sim1
Sim6
Sim5
Sim0
0.5
1
1.5
2
20102015202020252030
F
i
n
a
l
/
I
n
i
t
i
a
l
B
i
o
m
a
s
s
Year
Large pelagic fish
Sim4
Sim3
Sim2
Sim1
Sim5
Sim6
Sim0
5
10
15
20
20102015202020252030
F
i
n
a
l
/
I
n
i
t
i
a
l
B
i
o
m
a
s
s
Year
Seabirds
Sim3
Sim4
Sim1
Sim2
Sim5
Sim6
Sim0
0.25
0.5
0.75
1
1.25
1.5
20102015202020252030
F
i
n
a
l
/
I
n
i
t
i
a
l
B
i
o
m
a
s
s
Year
Whales
Sim4
Sim3
Sim2
Sim1
Sim5
Sim6
Sim0
5
10
15
20
25
20102015202020252030
F
i
n
a
l
/
I
n
i
t
i
a
l
B
i
o
m
a
s
s
Year
Poor cod
Sim4
Sim3
Sim2
Sim1
Sim5
Sim6
Sim0
Table1
Results of modeling simulations in terms of relative biomass(year2030/year2010
biomass values)for different scenarios of?shing increase and primary production
change of the NW Mediterranean model(NWM).
Final/initial B Sim0Sim1Sim2Sim3Sim4Sim5Sim6
Squids 1.290.630.9315.5018.010.000.00
Sardine0.640.430.66 1.92 2.690.000.00
Poor cod0.660.00 1.0814.4948.650.000.00
Large pelagic?sh0.960.910.90 1.59 1.690.630.64
Seabirds0.65 1.250.6615.7611.080.000.00
Fin whales0.610.510.580.970.990.360.36
M.Coll et al./Deep-Sea Research II95(2013)21–36
30
Predators of squids,such as large pelagic?shes(including Blue?n tuna,Thunnus thynnus,and sword?sh,Xiphias gladius), seabirds(yellow-legged gull,Larus cachinnans,slender-billed gull Chroicocephalus genei,lesser black-backed gull Larus fuscus,black-headed gull Chroicocephalus ridibundus,sandwich tern Thalasseus sandvicensis,common tern Sterna hirundo,Balearic shearwater Puf?nus mauretanicus and Scopoli’s shearwater,Calonectris diome-dea)and?n whales,Balaenoptera physalus,also showed changes in their biomass under our simulations(Figs.8d–f and Table1). Large pelagic?shes had declined by4%under the baseline simulation0,and declined further under simulation1due to direct?shing impact(Fig.8d).Moreover,under simulation2the decline was larger due to less availability of squids as prey.On the contrary,large pelagic?shes increased under simulations3and4, thus under increased?shing but accompanied by an increase in primary production,due to increase in prey availability,and declined by approximately40%when primary production declined(Fig.8d).Seabirds declined under simulation0due to indirect?shing impact as by-catch,but they increased under simulation1due to seabirds partially preying on?shing discards, which were more available with an overall?shing increase (Fig.8e).However,under simulation2,a higher?shing mortality of squids,seabirds declined again due to lower direct prey availability.Under simulations3and4,including an increase of primary production,seabirds increased substantially due to higher prey,including squids,while they declined to a minimum under simulations that included a decrease in primary produc-tion.Fin whales showed a decline under simulation0and this decline was higher under simulation1due to a reduction of small pelagic?shes and other prey,and less reduced under simulation 2,partially due to higher availability of prey(mainly small planktivores and squids).This decline was less pronounced when an increase in primary production was included under simula-tions3and4,thus bene?tting from larger amounts of prey,but was maintained when primary production declined in simula-tions5and6.
Results from temporal dynamic simulations from the pelagic eastern tropical Paci?c Ocean(ETP)model for different scenarios of?shing and primary production also showed evident changes in the biomass of squids and their prey and predators(Fig.9and Table2).Squids biomass did not change under simulation0due to simulated?shing effort on squids was small(Olson and Watters,2003),but squids increased under simulation1by bene?ting from an overall increase in?shing intensity and lower biomasses of squid predators(Fig.9a).Under simulation2, however,when squids were targeted increasingly,the biomass declined slightly from baseline over the20-yr period.Under an increase of primary production in addition to?shing,squids increased(simulations3and4).When primary production was reduced,squid biomass declined accordingly,as was observed with the NWM model.
Prey species of squids,miscellaneous mesopelagic?shes (Phosichthyidae,Myctophidae)and?ying?shes(Exocoetus spp., Hirundichthys spp.,Prognichthys spp.,Oxyporhamphus micropterus) were also investigated(Figs.9b and c).Mesopelagic?shes and ?ying-?shes declined slightly under simulation1and increased under simulation2due to top-down trophic interactions,i.e. changes in predator abundances including squids,and similar trends were observed for?ying-?shes.Under an increase in primary production,however,both groups increased substantially and,since no asymptote was reached,did not appear to be controlled by an increase of squids.When primary production was reduced,the biomass of both mesopelagic?shes and?ying-squids in the ETP model(Figs.9d–f).Toothed whales slightly increased under simulations1,3and4mainly due to greater availability of squids as prey,and declined with reduced primary production and prey biomass.Spotted dolphins showed a decline under simulation0and this decline was maintained under simulations1and2due to declines in prey such as miscellaneous ?shes and squids.However,they increased under scenario3and 4due to a substantial increase in prey,including squids.Under scenario5and6,the declines in prey populations led dolphins to strongly decline by20%.Skipjack biomass dynamics showed strong declines under simulation1,thus with a general increase in?shing intensity,and under simulations5and6,thus an additional decline in primary production.However,skipjack increased under scenarios3and4due to higher availability of prey including squids.
4.Discussion
Despite important efforts to increase the amount of data available on ecological parameters of marine invertebrates (Palomares and Pauly,2008;Pauly et al.,2009),data from those are still scarce in comparison with?shes and other vertebrates (Costello et al.,2010;Palomares and Pauly.,2012).Our study represents the?rst review of available data on basic ecological parameters for squids from food-web models of marine ecosys-tems,and contributes to the knowledge of non-?sh organisms of the ocean.
Food-web models can play an important role in understanding the dynamics of species that are dif?cult to study or inhabit regions where data are less available as models evaluate compat-ibility of large amounts of information at local levels that can be used to infer macro-ecological patterns at regional and global scales(Coll and Libralato,2012;Pauly et al.,2009).Moreover, models provide results in a standardized form so comparison of results is possible.This review illustrates the utility of ecological models to envisage general trends of the trophic ecology of marine organisms.
4.1.Trophic level and trophic width of squids
Globally,our results show that squids occupy a high range of trophic levels and exploit a high diversity of trophic resources, re?ecting the versatility of their feeding behavior and dietary habits.According to food-web models,squids consume zooplank-ton,pelagic and benthic?shes,crustaceans,detritus,jelly?sh and squids(see Table S1that summarizes available information by functional group).Furthermore,clear differences in both trophic level among oceans and ecosystem types were found indicating different trophic ecology and availability of prey.
Trophic levels estimated with Ecopath models showed that squids occupy a wide range of trophic positions within their food webs.These results are in line with additional results from stable isotope signatures(Navarro et al.,2013)and con?rm that modeling and stable isotope d15N values are frequently correlated(Navarro et al.,2011).Considering that enrichment in d15N values is$3–5%per trophic level,(Post,2002)the range of d15N values in Navarro et al.(2013)within each ocean or ecosystem type indicates that squids may occupy between trophic levels two and four ranking from medium to top tro-phic positions(e.g.,Cherel and Duhamel,2004;Clarke,1996; Croxall and Prince,1996;Kaschner et al.,2001;Rodhouse and Nigmatullin,1996;Stergiou and Karpouzi,2001;Xavier and
M.Coll et al./Deep-Sea Research II95(2013)21–3631
information utilized by models.Ecopath models are based on diet data for functional groups that include the most abundant and important squid species from which data are available,but may be modi?ed during the balancing of the model.In this sense,the large amounts of zooplankton in squids diets (Table S1)may be partially due to the balancing procedures in some ecosystem models or to the fact that in some models shrimps and small crustaceans are included in the zooplankton functional group.Nevertheless,the differences in the trophic level of squids among regions can be mainly explained by the variation in main feeding habits of the species present in each study (Navarro et al.,2013).In the case of oceans or ecosystem types with squids that occupy higher trophic levels based on Ecopath models,such as those in the Mediterranean Sea and the Atlantic,most of the squid species lower,squids exploited mainly zooplankton and detritus (Christensen et al.,2003)(and see Table S1).
Trophic width inferred by the omnivory index highlighted the generalist feeding strategy of most squid species,also in line with results from isotopic indicators of niche width from Navarro et al.(Navarro et al.,2013).Some differences between oceans and ecosystem types are probably a consequence of different trophic behavior of squid species present in each ocean or ecosystem type (Cherel and Hobson,2005;Cherel et al.,2009).For example,in temperate ecosystems,where the omnivory index was large,we found a large variety of squid species with very different ecology features:from deep-sea squids (bush-club squid,Batoteuthis skolopsk )to shallow squids (common arm squid Brachioteuthis riisei )and from zooplankton-consumers (Patagonian squid
0.5
11.522.53199820022006201020142018
F i n a l / I n i t i a l B i o m a s s
Years
Squids
Sim3Sim4Sim1Sim2Sim5Sim6
Sim0
0.5
11.522.53199820022006201020142018
F i n a l / I n i t i a l B i o m a s s
Years
199820022006201020142018
Years 199820022006201020142018
Years 199820022006201020142018
Years
199820022006201020142018
Years
Misc. Meso. Fish
Sim4Sim3Sim2Sim1Sim5Sim6
Sim0
0.5
11.522.53F i n a l / I n i t i a l B i o m a s s
Flying Fish
Sim4Sim3Sim2Sim1Sim6Sim5
Sim0
0.5
0.75
11.251.5F i n a l / I n i t i a l B i o m a s s
Toothed Whales
Sim3Sim4Sim2Sim1Sim5Sim6
Sim0
0.5
0.75
11.251.5F i n a l / I n i t i a l B i o m a s s
Spotted Dolphins
Sim4Sim3Sim2Sim1Sim5Sim6
Sim0
0.511.522.533.5F i n a l / I n i t i a l B i o m a s s
Skipjack
Sim4Sim3Sim2Sim1Sim6Sim5Sim0
Fig.9.Results of modeling simulations in terms of relative biomass (?nal/initial biomass)for different scenarios of ?shing increase and primary production change of the Eastern Tropical Paci?c Ocean model (ETP):(a)squids,(b)miscellaneous mesopelagic ?shes,(c)?ying-?shes,(d)toothed whales,(e)spotted dolphins,and (f)skipjack.
Table 2
Results of modeling simulations in terms of relative biomass (year 2018/year 1998biomass values)for different scenarios of ?shing increase and primary production change of the eastern tropical Paci?c Ocean model (ETP).Final/initial B
Sim0Sim1Sim2Sim3Sim4Sim5Sim6Squids
1.00 1.110.96
2.95 2.630.410.37Miscellaneous mesopelagic ?shes 1.000.98 1.02 2.59 2.630.380.41Flying-?shes 1.020.97 1.03 2.62 2.630.340.41Toothed whales 1.00 1.01 1.00 1.11 1.090.960.94Spotted dolphins 0.980.920.97 1.12 1.230.850.83Skipjacks
1.04
0.16
1.02
1.70
3.06
0.00
0.23
M.Coll et al./Deep-Sea Research II 95(2013)21–36
32
contrast,in the regions with low trophic width such as in the Mediterranean Sea,squid species(such as llex coindetti,Loligo vulgaris,Todarodes sagittatus,Todaropsis eblanae)are ecologically more similar,showing similar niches(Barausse et al.,2009;Jereb and Roper,2010;Tsagarakis et al.,2010).
4.2.Ecological indicators and role of squids
Knowledge of trophic position,biomass and production of cephalopod stocks is fundamental for understanding their impor-tance in the?ow of energy and matter in marine ecosystems. These data are scarce because few countries apply direct research effort to cephalopods.Interesting patterns emerged in our study by using the results from food-web models that parameterized squids as functional groups.For example,our study con?rmed that squids can be abundant organisms in marine ecosystems,but their abundance is highly variable among ecosystem types and ocean regions,in line with the fact that squids are likely highly in?uenced by changing environmental conditions(Bellido et al., 2001).Production and consumption per unit of biomass increased in warmer areas(especially high in the Paci?c region)and in upwelling and open ocean ecosystems.This is likely due to larger requirements to meet the energetics costs of constant swimming and foraging in pelagic ecosystems(Olson and Young,2007).
Predation mortality calculated from food-web models pro-vided an estimate of the impact that predators have on squid populations.Our results showed high predation rates,which bear evidence that squids are important prey organisms,and that predators may exert an important role on the dynamics of squids. This is in agreement with studies that highlight the importance of squids as prey for large?sh,marine mammals and seabirds(e.g., Cherel and Duhamel,2004;Croxall and Prince,1996;Kaschner et al.,2001;Klages,1996;Olson and Young,2007;Smale,1996; Xavier and Croxall,2007).
In addition,results from the relative total impact analysis showed that squids can have an overall high impact on other elements of the food web,and that the top-down?ow from squids to their prey is especially important in some areas. However,some species or functional groups showed low values of the top-down control indicator,evidencing that squids can also have a large bottom-up impact on marine food webs,thus being an important prey source.These results from food-web models highlight that squids are important organisms in marine food webs and that there are important functional relationships between squids and their prey and predators.
Some squids seem to rank high as keystone groups in marine food webs in line with previous studies that showed high values of keystoneness for some squid groups from several models (Gasalla et al.,2010;Libralato et al.,2006).Changes in biomass of squid species that show high keystoneness may produce important and unexpected effects on other elements of the food web.Therefore,aggregating squids with other groups in models may mask the role of squids in marine ecosystems,which underscores the need for a renewed effort to collect data and incorporate squids in modeling exercises.
4.3.The impact of?shing and climate change
The important role of squids in predator-prey interactions was also evident from our temporal dynamic simulations.Simu-lations of both the NWM and ETP models here showed that changes in squid abundance due to?shing or environmental changes would likely be translated into changes in their preda-top predators.This is in line with other studies highlighting the contribution of squids as predators.For example,in the Falkland Islands,?ying squids,Martialia hyadesi,are the main prey of the king penguins Aptenodytes patagonicus and thus the commercial ?shery targeting this squid can potentially indirectly impact the king penguins(Piatkowski et al.,2001b).
Our simulations also indicated that squids can have major impact on their prey,especially in coastal and continental shelf ecosystems,where squids can prey on the larvae and juveniles of their own predators,potentially affecting predatory?sh recruit-ment(Caddy and Rodhouse,1998).Changes in squid’s biomass may also impact pelagic?shes,as we observe in the NW Mediterranean model simulations,especially on small pelagic ?shes such as sardines.This is consistent with what was described in the Gulf of California in the1980s when recruitment of Paci?c sardines,Sardinops sagax,was limited by the high abundance of jumbo squid,which migrates with different annual intensities in and out of the Gulf of California(Ehrhardt,1991).In 1980an unusually large squid stock was observed and a drop in total sardine landings during1981was attributed,at least in part, to an unusually high sardine mortality induced by squid preda-tion.Moreover,in the Humboldt upwelling system the jumbo squid was identi?ed as an important player in the food web and the increasing trend in its biomass after the1997–1998El Nin?o period was linked with increasing trends of mesopelagic?shes (Tam et al.,2008;Taylor et al.,2008).This is consistent with the relationship between squids and mesopelagic?shes in the ETP model.
Our simulations of the NWM model highlighted a strong interrelationship between neritic squids and the populations of their prey and predators and that the role of squids in coastal and shelf areas may be important.This has already been suggested for ground?sh in many shelf ecosystems(Caddy and Rodhouse, 1998),given that data from15FAO areas revealed that,while cephalopod landings increased signi?cantly over25yr,ground-?sh catches remained stable or declined(Caddy and Rodhouse, 1998;Piatkowski et al.,2001a).For West Africa,the Gulf of Thailand and the Adriatic Sea(in the Mediterranean)there is evidence that?shing pressure has changed ecological conditions and that cephalopods have increased as predatory?shes have declined.This is also observed in our simulation1,in which squids increased slightly during an overall increase in?shing effort.In addition,this important role of squids may well be extendable to open oceans due to the important role that squids seem to have in these ecosystems,illustrated by the ETP model.A sensitivity analysis of the ETP model showed that varying the parameters for the cephalopods exerted the greatest overall in?uence on the ecosystem compared to all other model compo-nents(Olson and Watters,2003).However,the role of squids in open ocean ecosystems,such as the one illustrated by the ETP model,seems more restricted to a bottom-up impact of squids on their predators(Hunt and McKinnell,2006).
Additionally,modeling results illustrated that squids have the ability to quickly respond to changes at the base of the food web that may be triggered by environmental changes.During simula-tions of changing primary productivity,larger changes in relative biomass of the squids than of some squid prey,especially sardines in the NWM model,suggests that squids would respond quicker to environmental changes than their prey,contrary to a classic bottom-up cascade.This underscores the likelihood that climate change explains the large-scale range expansions of Humboldt squid in the eastern Paci?c Ocean(Field et al.,2007;Zeidberg and Robison, 2007),and supports the notion that squids play a central role in
M.Coll et al./Deep-Sea Research II95(2013)21–3633
would result in higher primary production,this would likely be translated into higher abundances of squids.Given our results,this in turn would have an effect up and down the food web in neritic ecosystems and mainly up the food web in pelagic ones.The positive impact of climate is in agreement with previous studies.For example, Dawe et al.(2000)highlighted that the abundance of short-?nned squid,Illex illecebrosus,was positively related to a favorable oceano-graphic regime associated with a negative North Atlantic Oscillation (NAO)index(weak winter north-westerly winds),high water tem-peratures off Newfoundland and a southward shift in the position of the Gulf Stream and the boundary between the shelf waters and the offshore slope waters in the North-Western Atlantic.Humboldt squid substantially expanded its geographic range long-term in the eastern North Paci?c by invading the waters to the north off central California from2002to mid-2010(Zeidberg and Robison,2007).This range expansion coincided with changes in climate and oceanographic conditions and presumably a reduction in squid predators(but see Watters et al.,2008).The Humboldt squid invasion was coincident with a decline in the abundance of Paci?c hake,the most important commercial ground?sh species off western North America.It is important to note that these ecological changes may have conse-quences for recovery of depleted?sh stocks.With the current depletion of ground?sh predators on squids,a warming trend might lead to improve squid production and may compromise recovery of depleted marine populations and ecosystems(Lotze et al.,2011). These interactions can be further analyzed with food-web models, which are suitable to underpin important trophic relationships of the food web,including squids.
If primary production is reduced,however(which seems to be occurring at regional levels as climate change results in stronger strati?cation and weaker upwellings)(Boyce et al.,2010;Polovina et al.,2008),then this would negatively impact squid populations and their predators,such as large commercial?shes and charismatic species.Hence,large declines in squid production would have strong effects on marine food webs.
Squid’s dynamics have been previously described to be highly impacted by environmental?uctuations(e.g.,Dawe et al.,2000; Sakurai et al.,2000;Sims et al.,2001;Taylor et al.,2008). Therefore,it is essential to advance our understanding of the dynamics of predator responses to?uctuations in the abundance of squid’s populations,since squids are short-lived fast growing species that can?uctuate notably(Boyle and Boletzky,1996).The replacement of depleted?sh species by squids may not secure stable food for top predators.Therefore,this study provides further evidence that,due to their ecological interactions,trophic position, and biological characteristics,large removals of squids from marine ecosystems may likely have a negative impact on their predators, including commercially valuable?shes and megafauna,and may have a positive impact on their prey.In the context of an ecosystem-approach to?sheries,and taking into account the principle of the precautionary approach(FAO,2003;Garcia et al., 2003;Pikitch et al.,2004),it is important to further evaluate if increased?sheries landings of cephalopods could be less valuable than their indirect contribution through the ecological enhance-ment of?sh production and maintenance of charismatic species (Hunsicker et al.,2006).This is a relevant issue since cephalopods have gained increasing attention as an alternative to the traditional marine harvest on?n?sh to supply humans with living marine resources(Caddy and Rodhouse,1998).
Acknowledgments postdoctoral contract of the Juan de la Cierva program of the Spanish Government.MC was supported by a research contract of the Ramon y Cajal program of the Spanish Government.This work is partly supported by the NF-UBC Nereus Program.This paper is a contribution to a CLIOTOP initiative to develop understanding of squid in pelagic ecosystems.
Appendix A.Supplementary materials
Supplementary data associated with this article can be found in the online version at https://www.doczj.com/doc/848894275.html,/10.1016/j.dsr2.2010.08.020. References
Ahrens,R.N.M.,Walters,C.J.,Christensen,V.,2012.Foraging arena theory.Fish Fish.13,41–59.
Amaratunga,T.,1983.The role of cephalopods in the marine ecosystem.In:Caddy, J.F.(Ed.),Advances in Assessment of World Cephalopod Resources.FAO Fisheries Technical Paper,pp.379–412.
Anderson,M.A.,Gorley,R.N.,Clarke,K.R.,2008.PERMANOVAtfor PRIMER:Guide to Software and Statistical Methods.PRIMER-E,Plymouth,UK.
Arau′jo,J.N.,Mackinson,S.,Stanford,R.J.,Hart,P.J.B.,2008.Exploring?sheries strategies for the western English Channel using an ecosystem model.Ecol.
Modell.210,465–477.
Barausse,A.,Duci,A.,Mazzoldi,C.,Artioli,Y.,Palmeri,L.,2009.Trophic network model of the Northern Adriatic Sea:analysis of an exploited and eutrophic ecosystem.Estuar.Coast.Shelf Sci.83,577–590.
Bellido,J.,Pierce,G.,Wang,J.,2001.Modeling intra-annual variation in abundance of squid Loligo forbesi in Scottish waters using generalised additive models.
Fish.Res.52,23–39.
Booth,S.,Zeller,D.,2005.Mercury,food webs and marine mammals:implications of diet and climate change for human health.Environ.Health Perspect.113,521–526. Boyce,D.G.,Lewis,M.R.,Worm,B.,2010.Global phytoplankton decline over the past century.Nature466,591–596.
Boyle,P.,Boletzky,S.,1996.Cephalopod populations:de?nition and dynamics.
Philos.Trans.R.Soc.London351,985–1002.
Boyle,P.,Rodhouse,P.,2005.Cephalopods:ecology and?sheries.Blackwell Science Ltd.,Oxford.
Bundy,A.,2005.Structure and function of the eastern Scotian shelf ecosystem before and after the ground?sh collapse in the early1990s.Can.J.Fish.Aquat.
Sci.62,1453–1473.
Caddy,J.,Rodhouse,P.,1998.Cephalopod and ground?sh landings:evidence for ecological change in global?sheries?Rev.Fish Biol.Fish.8,431–444. Cherel,Y.,Duhamel,G.,2003.Diet of the squid Moroteuthis ingens(Teuthoidea: Onychoteuthidae)in the upper slope waters of the Kerguelen Islands.Mar.
Ecol.Prog.Ser.250,197–203.
Cherel,Y.,Duhamel,G.,2004.Antarctic jaws:cephalopod prey of sharks in Kerguelen waters.Deep-Sea Res.Part I:Oceanogr.Res.Pap.51,17–31. Cherel,Y.,Hobson,K.A.,2005.Stable isotopes,beaks and predators:a new tool to study the trophic ecology of cephalopods,including giant and colossal squids.
Proc.R.Soc.B:Biol.Sci.272,1601–1607.
Cherel,Y.,Ridoux,V.,Spitz,J.,Richard,P.,2009.Stable isotopes document the trophic structure of a deep-sea cephalopod assemblage including giant octopod and giant squid.Biol.Lett.5,364–367.
Cheung,W.W.L.,Pitcher,T.J.,2005.A mass-balance model of the Falkland Islands ?sheries and ecosystems.In:Palomares,M.L.,Pruvost,P.,Pitcher,T.J.,Pauly,D.
(Eds.),Modeling Antarctic Marine Ecosystems.Fisheries Centre Research Reports,pp.65–85.
Christensen,V.,Garces,L.R.,Silvestre,G.T.,Pauly,D.,2003.Fisheries impact on the South China Sea large marine ecosystem:a preliminary analysis using spatiallyexplicit methodology.Assessment,Management and Future Direc-tions for Coastal Fisheries in Asian Countries,pp.51-62.
Christensen,V.,Walters,C.,2004.Ecopath with Ecosim:methods,capabilities and limitations.Ecol.Modell.72,109–139.
Christensen,V.,Walters,C.,Pauly,D.,Forrest,R.,2008.Ecopath with Ecosim Version
https://www.doczj.com/doc/848894275.html,er Guide—November2008.Lenfest Ocean Futures Project2008,235pp. Clarke,K.R.,Gorley,R.N.,2006.PRIMER v6:user manual/tutorial(plymouth routines in multivariate ecological research).Primer-E Ltd.,Plymouth. Clarke,M.R.,1996.The role of cephalopods in the world’s oceans:an introduction.
Philos.Trans.:Biol.Sci.351,979–983.
Coll,M.,Libralato,S.,2012.Contributions of food-web modeling for an ecosystem approach of marine resource management in the Mediterranean Sea.Fish Fish.
13,60–88.
Coll,M.,Palomera,I.,Tudela,S.,Dowd,M.,2008.Food-web dynamics in the South Catalan Sea ecosystem(NW Mediterranean)for1978–2003.Ecol.Modell.217,
M.Coll et al./Deep-Sea Research II95(2013)21–36 34
Cornejo-Donoso,J.,Antezana,T.,2008.Preliminary trophic model of the Antarctic Peninsula Ecosystem(sub-area CCAMLR48.1).Ecol.Modell.218,1–17. Costello,M.J.,Coll,M.,Danovaro,R.,Halpin,P.,Ojaveer,H.,Miloslavich,P.,2010.A cen-sus of marine biodiversity knowledge,resources and future challenges.PLoS One5,e12110.https://www.doczj.com/doc/848894275.html,/10.1371/journal.pone.0012110.
Cox,S.,Martell,S.,Walters,C.,Essington,T.,Kitchell,J.,Boggs,C.,Kaplan,I.,2002.
Reconstructing ecosystem dynamics in the central Paci?c Ocean,1952–1998.
II.A preliminary assessment of the trophic impacts of?shing and effects on tuna dynamics.Can.J.Fish.Aquat.Sci.59,1736–1747.
Croxall,J.,Prince,P.,1996.Cephalopods as prey.I.Seabirds.Philos.Trans.R.Soc.
London351,1023–1043.
Dawe,E.,Colbourne,E.,Drinkwater,K.,2000.Environmental effects on recruit-ment of short-?nned squid(Illex illecebrosus).ICES J.Mar.Sci.:J.Cons.57, 1002–1013.
Ehrhardt,N.M.,1991.Potential impact of a seasonal migratory jumbo squid (Dosidicus gigas)stock on a Gulf of California sardine(Sardinops sagax caerulea) population.Bull.Mar.Sci.49(1),325–332.
FAO,2003.The Ecosystem Approach to Fisheries.FAO Technical Guidelines for Responsible Fisheries,vol.4,Suppl.2.Rome.
Field,J.C.,Baltz,K.,Phillips,A.J.,Walker,W.A.,2007.Range Expansion and Trophic Interactions of the Jumbo Squid,Dosidicus gigas,in the California Current.Cali-fornia Cooperative Oceanic Fisheries Investigations Report,vol.48,131-146. Frank,K.T.,Petrie,B.,Choi,J.S.,Leggett,W.C.,2005.Trophic cascades in a formerly cod-dominated ecosystem.Science308,1621–1623.
Garcia,S.M.,Zerbi,A.,Aliaume,C.,Do Chi,T.,Lasserre,G.,2003.The Ecosystem Approach to Fisheries.Issues,Terminology,Principles,Institutional Foundations, Implementation and Outlook.FAO Fisheries Technical Paper,vol.443,pp.71. Gasalla,M.A.,Rodrigues,A.R.,Postuma,F.A.,2010.The trophic role of the squid Loligo plei as a keystone species in the South Brazil Bight ecosystem.ICES J.
Mar.Sci.67,1413–1424.
Gilly,W.,Markaida,U.,Baxter,C.,Block,B.,Boustany,A.,Zeidberg,L.,Reisenbich-ler,K.,Robison, B.,Bazzino,G.,Salinas, C.,2006.Vertical and horizontal migrations by the jumbo squid Dosidicus gigas revealed by electronic tagging.
Mar.Ecol.Prog.Ser.324,1–17.
Guerra,A′.,Gonza′lez,A′.F.,Pascual,S.,Dawe,E.G.,2011.The giant squid Archi-teuthis:an emblematic invertebrate that can represent concern for the conservation of marine biodiversity.Biol.Conserv.144,1989–1997. Halpern,B.S.,Walbridge,S.,Selkoe,K.A.,Kappel,C.V.,Micheli,F.,D’Agrosa,C., Bruno,J.F.,Casey,K.S.,Ebert,C.,Fox,H.E.,Fujita,R.,Heinemann,D.,Lenihan,
H.S.,Madin,E.M.P.,Perry,M.T.,Selig,E.R.,Spalding,M.,Steneck,R.,Watson,R.,
2008.A global map of human impact on marine ecosystems.Science319, 948–952.
Heymans,J.J.,2003.Revised models for Newfoundland for the time periods1985–87and1995–97.Fish.Cent.Res.Rep.11,40–63.
Heymans,J.J.,Baird, D.,https://www.doczj.com/doc/848894275.html,work analysis of the northern Benguela ecosystem by means of NETWRK and Ecopath.Ecol.Modell.131,97–119. Heymans,J.J.,Shannon,L.J.,Jarre,A.,2004.Changes in the northern Benguela ecosystem over three decades:1970s,1980s,and1990s.Ecol.Modell.172, 175–195.
Hunsicker,M.,Essington,T.,2008.Evaluating the potential for trophodynamic control of?sh by the long?n inshore squid(Loligo pealeii)in the Northwest Atlantic Ocean.Can.J.Fish.Aquat.Sci.65,2524–2535.
Hunsicker,M.E.,Essington,T.,Watson,R.,Sumaila,U.R.,2006.The direct and indirect contributions of cephalopods to global marine?sheries.In:Olson,R., Young,J.W.(Ed.),The Role of Squid in Open Ocean Ecosystems.Global Ocean Ecosystem Dynamics,Globec Report24.Report of a GLobec-Cliotop/Pfrp Workshop.16th–17th November2006,Hawaii,USA.
Hunt,G.L.,McKinnell,S.,2006.Interplay between top-down,bottom-up,and wasp-waist control in marine ecosystems.Prog.Oceanogr.68,115–124. Jerb,P.,Roper,C.F.E.,2005.Cephalopds of the World.An Annotated and Illustrated Catalogue of Cephalopod Species Known to Date.Volume 1.Chambered Nautiluses and Sepiods(Nautilidae,Sepiidae,Sepiolidae,Sepiadariidae,Idio-sepiidae and Spirulidae),FAo Species Catalogue for Fishery Purposes.Rome,p.
262.
Jereb,P.,Roper, C.F.E.,2010.Cephalopods of the World.An annotated and Illustrated Catalogue of Cephalopod Species Known to Date.Volume 2.
Myopsid and Oegopsid Squids.FAO Species Catalogue for Fishery Purposes, vol.4.Rome,605pp.
Kaschner,K.,Watson,R.,Christensen,V.,Trites,A.W.,Pauly,D.,2001.Modeling and mapping trophic overlap between marine mammals and commercial ?sheries in the North Atlantic.In:Zeller, D.,Watson,R.,Pauly, D.(Eds) Fisheries Impacts on North Atlantic Ecosystems:Catch,Effort and National/ Regional Data Sets,vol.9(3).Fisheries Centre Research Reports,Vancouver, Canada,pp.35–45.
Klages,N.T.W.,1996.Cephalopodsasprey.II.Seals.Philos.Trans.:Biol.Sci.351 (1343),1045-1052.
Leontief,W.W.,1951.The structure of the US economy,2nd edition Oxford University Press,New York.
Libralato,S.,Christensen,V.,Pauly,D.,2006.A method for identifying keystone species in food web models.Ecol.Modell.195,153–171.
Lotze,H.K.,Coll,M.,Magera,M.A.,Ward-Paige,C.,Airoldi,L.,2011.Recovery of marine animal populations and ecosystems.Trends Ecol.Evol.26,595–605. Navarro,J.,Coll,M.,Louzao,M.,Palomera,I.,Delgado, A.,Forero,M.G.,2011.Navarro,J.,Coll,M.,Olson,R.,Somes,C.J.,2013.Trophic niche of squids in marine systems:a general overview from isotopic data.Deep-Sea Res.II,95, 93–102.
Odum,W.E.,Heald, E.J.,1975.The detritus-based food web for an estuarine mangrove community.In:Cronin,L.E.(Ed.),Estuarine Research,vol. 1.
Academic Press,New York.
Olson,R.J.,Watters,G.M.,2003.A model of the pelagic ecosystem in the eastern tropical Paci?c Ocean.Inter-Am.Trop.Tuna Comm.Bull.22,135–218. Olson,R.J.,Young,J.W.,2007.The Role of Squid in Open Ocean Ecosystems.Report of a GLOBEC-CLIOTOP/PFRP Workshop.16–17November2006,Honolulu, Hawaii,USA.GLOBEC Report24:vi,pp.94.
Palomares,M.,Pauly,D.,2008.Von Bertalanffy growth parameters of non-?sh marine organisms.Fish.Centre Res.Rep.16,pp.137.
Palomares,M.L.D.,Morissette,L.,Cisneros-Montemayor,A.,Varkey,S.,Coll,M., Piroddi,C.,2009.Ecopath25years conference:extended abstracts.Fish.Cent.
Res.Rep.17,pp.171.
Palomares,M.L.D.,Pauly, D.,2012.SeaLifeBase.World Wide Web Electronic Publication./https://www.doczj.com/doc/848894275.html, S(version01/2012).
Passarella,K.C.,Hopkins,T.L.,1991.Species composition and food habits of the micronektonic cephalopod assemblage in the eastern Gulf of Mexico.Bull.
Mar.Sci.49(1),638–659.
Pauly,D.,Christensen,V.,1995.Primary production required to sustain global ?sheries.Nature374,255–257.
Pauly,D.,Graham,W.,Libralato,S.,Morissette,L.,Palomares,M.L.D.,2009.Jelly?sh in ecosystems,online databases,and ecosystem models.Hydrobiologia616, 67–85.
Piatkowski,U.,Pierce,G.,Morais da Cunha,M.,2001a.Impact of cephalopods in the food chain and their interaction with the environment and?sheries:an overview.Fish.Res.52,5–10.
Piatkowski,U.,Pu e tz,K.,Heinemann,H.,2001b.Cephalopod prey of king penguins (Aptenodytes patagonicus)breeding at Volunteer Beach,Falkland Islands, during austral winter1996.Fish.Res.52,79–90.
Pikitch,E.K.,Santora,C.,Babcock,E.A.,Bakun,A.,Bon?l,R.,Conover,D.O.,Dayton, P.,Doukakis,P.,Fluharty,D.,Heneman,B.,Houde,E.D.,Link,J.,Livingston,P.A., Mangel,M.,McAllister,M.K.,Pope,J.,Sainsbury,K.J.,2004.Ecosystem-based ?shery management.Science305(5682),346–347.
Pitcher,T.,Heymans,J.J.,Vasconcellos,M.,2002.Ecosystem models of Newfound-land for the time periods1995,85,1900,1450.Fish.Cent.Res.Rep.10,76. Polovina,J.J.,Howell,E.A.,Abecassis,M.,2008.Ocean’s least productive waters are expanding.Geophys.Res.Lett.35,L0361810.1029/2007GL031745.
Post, D.M.,https://www.doczj.com/doc/848894275.html,ing stable isotopes to estimate trophic position:models, methods,and assumptions.Ecology83,703–718.
Power,M.E.,Tilman,D.,Estes,J.A.,Menge,B.A.,Bond,W.J.,Mills,L.S.,Daily,G., Castilla,J.C.,Lubchenco,J.,Paine,R.T.,1996.Challenges in the quest for keystones.BioScience46,609–620.
Quetglas,A.,Alemany,F.,Carbonell,A.,Merella,P.,Sa′nchez,P.,1998.Some aspects of the biology of Todarodes sagittatus(Cephalopoda:Ommastrephidae)from the Balearic Sea(Western Mediterranean).Sci.Mar.62,73–82.
Rodhouse,P.,Nigmatullin,C.M.,1996.Role as consumers.Philos.Trans.R.Soc.
London351,1003–1022.
Rosa,R.,Seibel,B.A.,2010.Slow pace of life of the Antarctic colossal squid.J.Mar.
https://www.doczj.com/doc/848894275.html,90,1375–1378.
Rosas-Luis,R.,Salinas-Zavala, C.,Koch,V.,Luna,P.,Morales-Za′rate,M.,2008.
Importance of jumbo squid Dosidicus gigas(Orbigny,1835)in the pelagic ecosystem of the central Gulf of California.Ecol.Modell.218,149–161. Sakurai,Y.,Kiyofuji,H.,Saitoh,S.,Goto,T.,Hiyama,Y.,2000.Changes in inferred spawning areas of Todarodes paci?cus(Cephalopoda:Ommastrephidae) due to changing environmental conditions.ICES J.Mar.Sci.:J.Cons.57, 24–30.
SAUP,2012.Sea Around Us Project:Landings by Functional Groups in the Global Ocean./https://www.doczj.com/doc/848894275.html, S(accessed January.12).
Sims,D.W.,Genner,M.J.,Southward,A.J.,Hawkins,S.J.,2001.Timing of squid migration re?ects North Atlantic climate variability.Proc.R.Soc.B268,2607–2611. Smale,M.,1996.Cephalopods as prey.IV.Fishes.Philos.Trans.R.Soc.London351, 1067–1081.
Stergiou,K.I.,Karpouzi,V.S.,2001.Feeding habits and trophic levels of Mediterra-nean?sh.Rev.Fish Biol.Fish.11,217–254.
Tam,J.,Taylor,M.H.,Blaskovic,V.,Espinoza,P.,Ballon,R.M.,Diaz,E.,Wosnitza-Mendo,C.,Arguelles,J.,Purca,S.,Ayon,P.,Quipuzcoa,L.,Gutierrz,D.,Gova,E., Ochoa,N.,Wolff,M.,2008.Trophic modeling of the Northern Humboldt current ecosystem,part I:comparing trophic linkages under La Nin?a and El Nin?o conditions.Prog.Oceanogr.79,352–365.
Taylor,M.H.,Tam,J.,Blaskovic,V.,Espinoza,P.,Michael Ballo′n,R.,Wosnitza-Mendo,C.,Arg¨uelles,J.,D?′az,E.,Purca,S.,Ochoa,N.,2008.Trophic modeling of the Northern Humboldt current ecosystem,part II:elucidating ecosystem dynamics from1995to2004with a focus on the impact of ENSO.Prog.
Oceanogr.79,366–378.
Tsagarakis,K.,Coll,M.,Giannoulaki,M.,Papakonstantinou,C.A.M.,2010.Food-web traits of the North Aegean Sea continental shelf(Eastern Mediterranean, Greece)and comparison with other Mediterranean ecosystems.Estuar.Coast.
Shelf Sci.88,233–248.
Ulanowicz,R.E.,Puccia,C.J.,1990.Mixed trophic impacts in ecosystems.Coenoses 5,7–16.
M.Coll et al./Deep-Sea Research II95(2013)21–3635
Walters,C.J.,Christensen,V.,Martell,S.J.,Kitchell,J.F.,2005.Possible ecosystem impacts of applying MSY policies from single-species assessment.ICES J.Mar.
Sci.62,558–568.
Watters,G.M.,Olson,R.J.,Field,J.C.,Essington,T.E.,2008.Rangeexpansion of the Humboldt squid was not caused by tuna?https://www.doczj.com/doc/848894275.html,A 105,E5.https://www.doczj.com/doc/848894275.html,/10.1073/pnas.0710369105.
Watters,G.M.,Olson,R.J.,Francis,R.C.,Fiedler,P.C.,Polovina,J.J.,Reilly,S.B.,Aydin,K.Y., Boggs,C.H.,Essington,T.E.,Walters,C.J.,2003.Physical forcing and the dynamics of the pelagic ecosystem in the eastern tropical Paci?c:simulations with ENSO-scale and global-warming climate drivers.Can.J.Fish.Aquat.Sci.60,1161–1175.Worms,J.,1983.World?sheries for cephalopods:a aynoptic overview.In:Caddy, J.F.(Ed.),Advances in Assessment of World Cephalopod Resources.FAO Fisheries Technical Paper,pp.1–20.
Xavier,J.,Croxall,J.,2007.Predator–prey interactions:why do larger albatrosses eat bigger squid?J.Zool.271,408–417.
Zeidberg,L.D.,Robison,B.H.,2007.Invasive range expansion by the Humboldt squid, Dosidicus gigas,in the eastern North Paci?c.Proc.Natl.Acad.Sci.104, 12948–12950.
M.Coll et al./Deep-Sea Research II95(2013)21–36 36