An Empirical Characterization of Radio Signal Strength Variability in3-D IEEE802.15.4 Networks Using Monopole Antennas Dimitrios Lymberopoulos,Quentin Lindsey,and Andreas Savvides
Embedded Networks and Applications Lab,ENALAB,
Yale Univerisity,New Haven,CT06520,USA
{dimitrios.lymberopoulos,quentin.lindsey,andreas.savvides}@https://www.doczj.com/doc/875187033.html,,
abs@https://www.doczj.com/doc/875187033.html,
Abstract.The wide availability of radio signal strength attenuation
information on wireless radios has received considerable attention as a
convenient means of deriving positioning information.Although some
schemes have been shown to work in some scenarios,many agree that the
robustness of such schemes can be easily compromised when low power
IEEE802.15.4radios are used.Leveraging a recently installed sensor
network testbed,we provide a detailed characterization of signal strength
properties and link asymmetries for the CC2420IEEE802.15.4compliant
radio using a monopole antenna.To quantify the several factors of signal
unpredictability due to the hardware,we have collected several thousands
of measurements to study the antenna orientation and calibration e?ects.
Our results show that the often overlooked antenna orientation e?ects
are the dominant factor of the signal strength sensitivity,especially in
the case of3-D network deployments.This suggests that the antenna
e?ects need to be carefully considered in signal strength schemes.
1Introduction
The existence of radio connectivity and the attenuation of radio signal with dis-tance are attractive properties that could potentially be exploited to estimate the positions of small-wireless devices featuring low-power radios.Radio signal strength indicator(RSSI),a standard feature in most radios,has attracted a lot of attention in the recent literature for obvious reasons.RSSI eliminates the need for additional hardware in small wireless devices,and exhibits favorable properties with respect to power consumption,size and cost.As a result,several RSSI based algorithms have been proposed that either assume a complete pro?l-ing of the network deployment area[1],[9][3],[15],[2],[8],[14],[16],[19]or a speci?c signal attenuation model that can provide distance or area information directly or indirectly from the raw RSSI data[21],[6],[7],[18],[11],[13],[12],[5].
Despite the increasing interest in signal strength localization using IEEE 802.14.5radios,there is still a lack of detailed characterization of the fundamen-tal factors contributing to large signal strength variability.To investigate these factors,and to get a better understanding of the asymmetries that arise in3-D K.R¨o mer,H.Karl,and F.Mattern(Eds.):EWSN2006,LNCS3868,pp.326–341,2006.
c Springer-Verlag Berlin Heidelberg2006
An Empirical Characterization of Radio Signal Strength Variability327 schemarios,we present a detailed characterization of signal strength behaviors in an IEEE802.15.4sensor network with monopole antennas.Instead of propos-ing a speci?c algorithm,in this paper we focus on showing the sources of signal strength variability.We do so by collecting a large number of measurements from a40-node testbed,both in an indoor and an open-?eld environment.This characterization di?ers from previous studies using IEEE802.11radios,since it examines a new radio technology with less powerful radio transmissions.Fur-thermore,a large fraction of the measurements are taken in a three-dimensional testbed deployment that emulates a realistic environment where sensor network deployments are likely to occur.
Our?ndings demonstrate that the relative antenna orientation between receiver-transmitter pairs is a major factor in signal strength variability,even in the absence of multipath e?ects.This suggests that many schemes using radio signal strength on similar radios should carefully consider these factors before go-ing to actual deployments.The approximately15,000measurements collected for this study are available online at https://www.doczj.com/doc/875187033.html,/enalab/rssidata/.
Our presentation of this paper proceeds as follows:Section2provides an overview of other characterizations and schemes that use signal strength.This is followed by a discussion of the signal strength variability components and a detailed evaluation of our system.
2Related Work
Some of the issues related with received signal strength ranging where presented by Whitehouse et.al.in an outdoor scenario characterization described in[20].
Three recent sensor network localization algorithms using low power sen-sor node radios are Ecolocation[21],MoteTrack[9]and Probability Grid[18]. Ecolocation determines the location of unknown nodes by examining the ordered sequence of received signal strength measurements taken at multiple reference nodes.The key idea of Ecolocation is that the distance-based rank order of refer-ence nodes constitutes a unique signature for di?erent regions in the localization space.Ecolocation reports a location error of10ft for a very small outdoor net-work deployment area(26ft x49ft)while Probability Grid reports a location error that is equal to the70%-80%of the communication range for a410ftx410ft outdoor network deployment.In the case of Probability Grid it is assumed that the goal of the sensor network deployment is to form a grid topology.Given this a priori knowledge,Probability Grid attempts to compute in a probabilistic way the one-hop distance and the number of hops that an unknown node is far away from an anchor node.MoteTrack is very similar to RADAR[1]but it does not require a back-end server where all the data have to be transferred and pro-cessed.Conversely,in Moterack the location of each mobile node is computed using a received radio signal strength signature from numerous beacon nodes to a database of signatures that is replicated across the beacon nodes themselves. The location error reported by Motetrack is approximately13ft for an indoor network deployment area of18751ft2.
328 D.Lymberopoulos,Q.Lindsey,and A.Savvides
Several schemes have also been presented using IEEE802.11radios.In[6] a comparative study of many RSSI based localization techniques using802.11 cards is presented.According to the results of this study all the localization techniques produce approximately the same location error over a range of environments.
Other work on RSSI-based localization algorithms has been developed in the context of two broad categories:map based such as[1],[9],[3],[15],[2],[8],[14],[16], [19],and distance(or area)prediction based[21],[6],[7],[18],[11],[13],[12],[5].
3Experimental Infrastructure
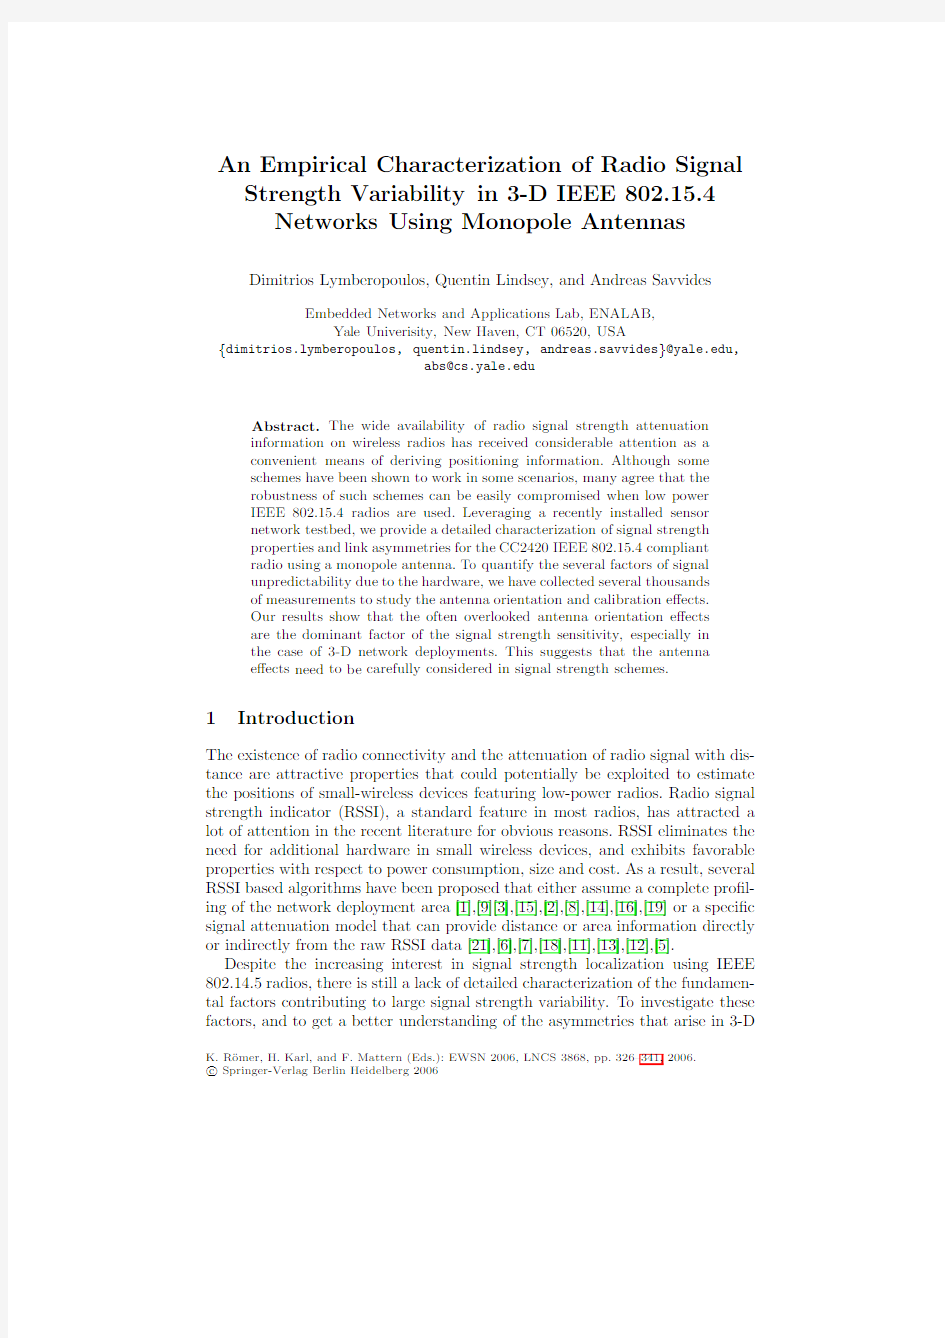
In the next sections we quantify the sources of RSSI variability using our Zigbee based infrastructure.A three dimensional,battery operated scalable testbed in our lab is used for indoor sensor network deployments.The testbed illustrated in Figure1(b)is a3-D structure measuring4.5m(W)x6m(L)x3m(H)and it is de-signed to host a large number of static and mobile nodes to instrument a variety of application scenarios.The centerpiece of our infrastructure is the XYZ sensor node[10],an open-source general purpose sensing platform designed around the OKI ML67Q500x ARM/THUMB microprocessor and the IEEE802.15.4com-pliant CC2420radio from Chipcon[4].
The communication subsystem of the XYZ sensor node was designed so that the correct operation of the radio chip is ensured.The radio chip is powered by the on-board voltage regulator and thus?uctuations in the battery voltage level do not a?ect the operation of the communication subsystem.In addition,the area under the chip on the PCB is used for grounding and it is well connected to the ground plane with several vias.The ground pins of the radio are connected to ground as close as possible to the package pin using individual vias and the microcontroller(as well as its support circuitry)was placed far away from the radio chip in order to avoid interference with the RF circuitry.
(a)(b)
Fig.1.a)The XYZ sensor node,b)Testbed node placement
An Empirical Characterization of Radio Signal Strength Variability329 The Chipcon CC2420IEEE802.15.4radio transceiver operates in the2.4GHz ISM band and includes a digital direct sequence spread spectrum(DSSS)mo-dem providing a spreading gain of9dB and an e?ective data rate of250Kbps. It was speci?cally designed for low power wireless applications and supports8 discrete power levels:0dBm,?1dBm,?3dBm,?5dBm,?7dBm,?10dBm,?15dBm and?25dBm at which its power consumption varies from29mW
to52mW[10].A built-in received signal strength indicator gives an8-bit dig-ital value:RSSI V AL.The RSSI V AL is always averaged over8symbol periods (128μs)and a status bit indicates when the RSSI V AL is valid(meaning that the receiver was enabled for at least8symbol periods).The power P at the RF pins can be obtained directly from RSSI V AL using the following equation:
P=RSSI V AL+RSSI OF F SET[dBm](1) where the RSSI OF F SET is found empirically from the front-end gain and it is approximately equal to?45dBm.In the next sections when we refer to the RSSI value we refer to the RSSI V AL and not the power P unless otherwise stated.
A straight piece of wire is used as a monopole antenna for our sensor node.The length of our antenna is equal to1.1inch,the optimal antenna length according to the CC2420’s datasheet[4].In all of the experiments described in the next sections,the length of the antenna on all the nodes was1.1inch unless otherwise stated.
4Sources of RSSI Variability
In addition to multipath,fading and shadowing of the RF channel,signal strength measurements are also a?ected by the following factors:
1.Transmitter variability:Di?erent transmitters behave di?erently even
when they are con?gured exactly in the same way.In practice,this means that when a transmitter is con?gured to send packets at a power level of d dBm then the transmitter will send these packets at a power level that is very close to d dBm but not necessarily exactly equal to d dBm.This can al-ter the received signal strength indication and thus it can lead to inaccurate distance estimation.
2.Receiver variability:The sensitivity of the receivers across di?erent radio
chips is di?erent.In practice,this means that the RSSI value recorded at di?erent receivers can be di?erent even when all the other parameters that a?ect the received signal strength are kept constant.
3.Antenna orientation:Each antenna has its own radiation pattern that is
not uniform.In practice,this means that the RSSI value recorded at the receiver for a given pair of communicating nodes and for a given distance between them varies as the pairwise antenna orientations of the transmitter and the receiver are changed.
330 D.Lymberopoulos,Q.Lindsey,and A.Savvides
4.1Path Loss Prediction Model
The majority of RSSI localization algorithms that do not use full location pro-?ling of the deployment environment make use of a signal propagation model that maps RSSI values to distance estimates
[17].The most widely used signal propagation model is the log-normal shadowing model:
RSSI (d )=P T ?P L (d 0)?10ηlog 10
d
d 0
+X σ(2)
where,P T is the transmit power,P L (d 0)is the path loss for a reference distance d 0,ηis the path loss exponent and X σis a gaussian random variable with zero mean and σ2variance,that models the random variation of the RSSI https://www.doczj.com/doc/875187033.html,ing the CC2420radio we were able to verify the log-normal shadowing model in an obstacle-free environment(basketball court).The e?ects of orienta-tion and calibration were isolated by taking measurements with a single pair of nodes,with the receiver and the transmitter on the same plane.Figure 5a shows the RSSI vs Distance plots.Based on our measurements in the basketball court,RSSI changes linearly with the log of the distance.
5Variations Across Di?erent Radios
In order to quantify the variability among di?erent transmitter-receiver pairs we conducted 2di?erent experiments.To characterize transmitter variations we used a single receiver and 9di?erent transmitters.In all of our experiments the
Fig.2.Quantifying transmitter’s variability
An Empirical Characterization of Radio Signal Strength Variability331
Fig.3.Quantifying receiver’s variability
receiver was exactly in the same position and with the same antenna orientation. One transmitter at a time was placed at a speci?c location that was1.31ft far away from the receiver.Each transmitter was transmitting packets at?15dBm while in4di?erent orientations(0,90,180,and270degrees).The nodes under test were placed in the middle of a room without furniture in order to minimize the e?ect of the re?ections in our measurements.
Figure2shows the RSSI values recorded at the receiver for all the transmitter and for all4orientations.For each orientation the average RSSI value and its standard deviation are computed.Averaging over all the average standard de-viations for all di?erent orientations we?nd that the overall standard deviation of the received RSSI value is equal to:https://www.doczj.com/doc/875187033.html,ing the log-normal signal propagation model shown in Figure5a we?nd that the2.24dBm RSSI standard deviation corresponds to0.4ft distance standard deviation.
To quantify the variability in the receiver we used a similar setup using1 transmitter and5di?erent receivers.The transmitter was transmitting pack-ets at?15dBm while in4di?erent orientations(0,90,180,and270degrees). Figure3shows the RSSI values recorded at the di?erent receivers for all4ori-entations of the transmitter.For each orientation the average RSSI value and its standard deviation are computed.Averaging over all the average standard deviations for all di?erent orientations we?nd that the overall standard devi-ation of the received RSSI value is equal to:https://www.doczj.com/doc/875187033.html,ing the log-normal signal propagation model shown in Figure5a we?nd that the1.86dBm RSSI standard deviation corresponds to0.33ft distance standard deviation.The same experiment was performed several times with di?erent transmitters in order to make sure that we were measuring the receiver variability and not something else that had to do with the speci?c transmitter.
332 D.Lymberopoulos,Q.Lindsey,and A.Savvides
6Antenna Characterization
The XYZ sensor node,as most of the generic sensor node platforms,uses a simple wire as a monopole antenna.Ideally,the radiation pattern of this antenna should be uniform and it should look like a circle(2-D space)or a sphere(3-D space).Of course,this does not hold in practice.However,without knowing our antenna’s radiation pattern it would be impossible to attempt inferring distance or location information directly from RSSI measurements.
We characterized our antenna in a basketball court measuring79ft in length and46ft in width.The ceiling of the court was at a height of30ft.In order to avoid the interference of the?oor we attached our transmitter node to a string running from the one side of the court to the other.The transmitter node was at a height of approximately8ft from the ground at the center of the court.Its antenna was vertical to the PCB board pointing down towards the?oor.
We measured RSSI with a receiver node at3di?erent heights from the?oor: 1.25ft,3.5ft,and6.5ft.For each one of these heights we measured the RSSI values for8di?erent angles of the receiver with respect to the transmitter:0, 45,90,135,180,215,270,and315degrees.For each of these orientations we recorded the RSSI values on the receiver at a distance resolution of2ft.We stopped taking measurements for a given height and orientation only when the receiver was not able to receive any packets.
6.1Antenna Length:Using a Suboptimal Antenna
According to the Chipcon’s Zigbee radio chip datasheet[4]the optimal length of the monopole antenna should be1.1inch.Therefore,in our?rst attempt to mea-sure the antenna we used a wire with1.1inch length as the monopole antenna. Both receiver and transmitter had exactly the same antenna.
Initially we tried to measure the antenna at the lowest power level(?25dBm) of the radio.We noticed that even at the lowest power level,transmitter and receiver could communicate for almost any position of the receiver in the basket-ball court.In addition,we noticed that the RSSI values recorded at the receiver were changing dramatically with very small changes in the distance between transmitter and receiver even when the orientation of the nodes was kept con-stant.Therefore,it was impossible to infer any signal propagation model based on the RSSI data.Apparently,even at the lowest power level the802.15.4ra-dio from Chipcon has a large communication range that is able to generate signi?cant re?ections even in the basketball court.Hence,the results in a real indoor environment with furniture and people would be much worse.By increas-ing the transmission power level of the radio we found out that even at slightly higher power levels two nodes could communicate over long distances even with-out line-of-sight.To reduce the e?ective communication range of the nodes we used a suboptimal antenna.Instead of using the recommended length(1.1inch) monopole antenna we used a2.9inch wire as our monopole antenna.As it can be seen in Figure5b,the communication range of the radio when using the sub-optimal antenna is signi?cantly reduced but the signal attenuation properties remain the same.
An Empirical Characterization of Radio Signal Strength Variability333 6.2Antenna Orientation in Basketball Court
After replacing the1.1inch antennas,on both the receiver and the transmitter, with2.9inch antennas we repeated the same experiment.At the lowest transmis-sion power level of the radio the communication range was3.3-6.6ft.Despite the fact that changing the length of the antenna reduced the communication range, still we could not get any signal propagation model at the lowest power level.It was obvious that communication was totally unreliable at the lowest power level with the2.9inch antenna.
However,we noticed that by using the next higher transmission power level we were getting consistent RSSI values on the receiver and we had reliable com-munication in a wide range of distances.The same was valid for all the other transmission power levels.Therefore,we decided to measure the2.9inch antenna at the power level of?15dBm using all the possible combinations described in the previous section.
Figures4a,4b,and4c show the RSSI values versus distance for all the orienta-tions and for the6.5ft,3.5ft,and1.25ft receiver heights respectively.Note that when the receiver is at1.25ft(Figure4c)and3.5ft(Figure4b)height from the ground the raw RSSI data cannot be used to infer any distance information.The reason is that signi?cantly di?erent distances can produce the same or almost the same RSSI values.In addition,similar distances correspond to very di?erent (even up to11dBm)RSSI values for di?erent antenna orientations.
However,when the receiver is at6.5ft height from the ground(Figure4a)the RSSI versus distance plot can be easily?tted to the widely used log-normal sig-nal propagational model.Note that as the distance between transmitter and receiver increases the variability in the RSSI value that corresponds to this distance also increases.In other words di?erent ranges of RSSI values provide distance information with di?erent levels of accuracy.This suggests that a prob-abilistic approach for translating RSSI values to distance information should be used.This can be easily implemented by computing the probability distribution of the raw RSSI values over the di?erent https://www.doczj.com/doc/875187033.html,ing this prob-
(a)(b)(c)
Fig.4.RSSI vs.Distance plots at di?erent heights a)6.5ft,b)3.5ft,c)1.25ft.RSSI values equal to?48dBm indicate absence of communication between receiver and transmitter
334 D.Lymberopoulos,Q.Lindsey,and A.
Savvides
(a)(b)
Fig.5.a)RSSI vs Distance plots for an obstacle-free environment (basketball court).Each data point is the average RSSI value recorded for 20packets,b)The e?ect of using a suboptimal antenna in an obstacle free indoor environment of size 24ft x 20ft .
ability distribution we can map an RSSI value to a speci?c distance with a given probability.The higher the probability the higher the accuracy of the distance estimation.
Figures
4a,4b,and 4c clearly show that di?erent antenna orientations can produce di?erent sets of RSSI values for the same distances between receiver and transmitter.In practice,this implies that the raw RSSI values cannot be directly translated to distance information.Extra knowledge about the speci?c antenna orientation that corresponds to this set of RSSI values is needed.Furthermore,our results show that even if we are able to map a set of RSSI values to a speci?c antenna orientation this does not necessarily mean that we can extract any useful distance information.The reason is that some antenna orientations do not provide a consistent signal attenuation.
(a)(b)
Fig.6.a)The best angle between receiver and transmitter,b)One of the worst an-gles between the receiver and the transmitter.RSSI values equal to ?48dBm indicate absence of communication between receiver and transmitter.
An Empirical Characterization of Radio Signal Strength Variability 335
Figures 6a and 6b provide some more insight to the antenna orientation e?ect.Figure 6shows the best transmitter antenna orientation.Note that a single signal propagation model can be extracted that is independent of the height of the receiver.
On the other hand,Figure 6a shows the worst transmitter antenna orienta-tion.It is obvious that any attempt to infer distance information directly from the RSSI values is impossible.Di?erent heights of the receiver produce very di?erent RSSI values.However,when the receiver is at 6.5ft height a signal propagation model can still be extracted.This implies that when the receiver is at 6.5ft the radiation pattern of the antenna seems to be very symmetric.This allows us to infer a signal propagation model independently of the antenna ori-entation of the transmitter.In other words,when the height di?erence between the transmitter and the receiver is small,antenna orientation does not a?ect the signal propagation model.But,as ?gure 6b shows,when the height di?erence between the transmitter and the receiver increases then the antenna orientation becomes a major factor that greatly a?ects the signal propagation model.
(a)(b)
Fig.7.a)Radiation Pattern of the monopole antenna,b)Indoors antenna character-ization.RSSI values equal to ?48dBm indicate absence of communication between receiver and transmitter.
This can be seen in ?gure 7where the radiation pattern of our monopole antenna is shown.The radiation pattern was constructed using all the measure-ments we collected in the basketball court.The shaded region of the antenna radiation pattern is the symmetric region for which a single signal propagation model can be extracted.Since the antenna orientation is not a major factor when the receiver and the transmitter are at the same height,the log-normal shad-owing model is very accurate in the case of a 2-D sensor network deployment at an obstacle-free environment (outdoor deployment).However,the log-normal shadowing model is not able to capture the e?ect of the transmitter’s antenna orientation in the case of a 3-D sensor network deployment even in an obstacle-free environment.
336 D.Lymberopoulos,Q.Lindsey,and A.Savvides
Consequently,a robust RSSI localization method should try to operate only in the shaded region of the antenna radiation pattern,shown in Figure7,where the log-normal shadowing model seems to hold.This requires isolating the shaded area from the rest of the communication region where the RSSI values are sig-ni?cantly a?ected by the antenna orientation of the transmitter and they cannot provide any reliable distance or location information.To demonstrate the dif-?culty of this task,consider the following case where a beacon is transmitting packets and a set of receivers listen the packets and record the RSSI values which are then send back to the beacon node.The beacon node is aware of a set of pairs of the following format:
6.3Antenna Orientation in Indoor Environments
In this section we focus on the e?ect of the indoor environment on the received signal strength between a pair of communicating nodes.Our?rst indoors exper-iment focused on the e?ect of re?ections on the antenna radiation pattern.We tried to replicate the experiment that we run in the basketball court in the3-D testbed(15ft(W)×20ft(L)×10ft(H))that is installed in our lab.Exactly the same transmitter that was used in the basketball court experiment was placed at a height of approximately7ft from the ground.The same receiver that was used in the basketball court experiment was placed in four di?erent heights from the ground:1.25ft,4.6ft,5.65ft,and6.17ft.For each one of these heights the receiver recorded the RSSI values for di?erent distances from the transmitter with a distance resolution of1ft(the transmitter was transmitting packets at the same power level as in the basketball court,?15dBm).In this experiment we focused only on a single transmitter antenna orientation,the one that gave us a single signal propagation model that was independent of the height of the receiver(Figure6)in the obstacle-free environment.
The RSSI values that were recorded on the receiver for all the di?erent dis-tances and for all the di?erent heights of the receiver can be seen in Figure7b. When the receiver is at6.17ft from the ground a clear log-normal signal prop-agation model can be derived as in the case of the obstacle-free environment. However,for the other three heights of the receiver the RSSI values seem totally random and no actual distance information can be extracted from these sets of RSSI values.What is even more interesting,is the fact that the randomness that the re?ections introduce in the RSSI values directly a?ects the symmetric region of the antenna and makes it signi?cantly narrower.Note that every RSSI value that is equal or smaller than?30dBm can actually correspond to any distance
An Empirical Characterization of Radio Signal Strength Variability337 that is larger than1.6ft and smaller than the communication range.The only RSSI values that can be used to accurately estimate the distance between the nodes are the RSSI values that are higher than?30dBm.This range of RSSI values can only be produced by the symmetric region of the antenna and it is not a?ected by the re?ections in the room or the height of the receiver.In addition, this range of RSSI values can be?tted to a linear signal propagation model and not to a log-normal signal propagation model.Unfortunately,the maximum dis-tance that this region of RSSI values can cover is very small and approximately 3ft to4ft.This suggests that even for small rooms a very large number of sensor nodes is required in order to perform accurate RSSI localization.
6.4Indoor Testbed Experiment
In order to verify the results of the previous section,we deployed381nodes with2.9inch antennas on our3-D testbed located inside our lab.The nodes were placed in3-dimensions inside the testbed as shown in Figure1b.The antennas of all the nodes on the?oor were pointing to the ceiling and the antennas of the nodes on the testbed were pointing either towards the center of the testbed or towards the?oor.In all cases,the antennas were vertical with respect to the PCB of the XYZ sensor node.
In our experiment,each node broadcasts10packets at each one of the eight available power levels.All the nodes that hear a packet record the RSSI value for this packet and the sender id.At every time instant only one node is broad-casting packets.After a node has?nished transmitting packets,a gateway node connected to a PC polls the recorded data from each node in the testbed sepa-rately.This process continues until all nodes transmit10packets at each power level.The experiment took place during the night when no people were in the lab. Received Signal Strength Data.Figures8a,8b,8c show the recorded RSSI values versus the true distances that they correspond to for di?erent power levels and for all38nodes.It is obvious that no actual distance information can be extracted directly from the RSSI values.This is due to the re?ections and the random placement of the nodes which created communicating pairs of nodes with random pairwise antenna orientations.Note,that as the transmitting power level used decreases,the RSSI data starts looking less random.The reason is that as the power level increases the re?ections in the testbed also increase.However, even at the low power level it is very di?cult to?t the RSSI data to a signal propagation model.
Connectivity and Link Symmetry.Our38node deployment also provided useful insight about the connectivity and the symmetry of the links in a real IEEE802.15.4sensor network.Figures10a,10b,and10c show the connectivity achieved by the lowest,low and maximum power levels respectively.
1Initially we deployed40nodes.Unfortunately,as it can be seen in Figure10,the bat-teries of nodes20and21were not full and therefore these nodes did not send/receive any packets.
338 D.Lymberopoulos,Q.Lindsey,and A.Savvides
(a)(b)(c)
Fig.8.
RSSI vs Distance plots for the38node indoor sensor network deployment at di?erent power levels:a)0dBm,b)-5dBm,c)-15dBm
(a)(b)
Fig.9.Percentage of a)One-way links and b)asymmetric links
(a)(b)
Fig.10.Connectivity plots for the38node indoor sensor network a)-25dBm b)-15dBm,c)0dBm.Nodes20and21were not equipped with fully charged batteries.
Figures9a and9b show the percentage of one-way links and the percentage of asymmetric2links respectively.As the power level of transmission decreases
2We call(A,B)link an asymmetric link if the RSSI value recorded at B when A is transmitting is di?erent than the RSSI value recorded at A when B is transmitting.
We call(A,B)link an one-way link if node A can reach node B but node B cannot reach node A.Asymmetric links include the one-way links.
An Empirical Characterization of Radio Signal Strength Variability339 the percentage of asymmetric links and their absolute di?erence as well as the percentage of one-way links increase.What is even more important,is the fact that the asymmetry of the links does not depend on the actual RSSI values. Our experimental data show that when node A transmits packets,node B might record a very high RSSI value that can be even equal to?23dBm or -25dBm.However,when node B transmits packets,node A might record a very small RSSI value or it might not record any RSSI value at all because it is not able to receive any packets.Our experimental results,shown in Figure9, show that the percentage of asymmetric links vary from21%to36%of the to-tal number of links in the network depending on the power level used during transmission.
7Discussion
Based on our detailed characterization we found that antenna orientation greatly impacts RSSI and link asymmetry in indoor and outdoor scenarios.This is es-pecially the case in3-D indoor deployments with random antenna orientations. These observations in?uence the assumptions of many node localization algo-rithms that utilize RSSI information.This includes RSSI distance prediction and pro?ling algorithms as well as other statistical approaches.Our results show that direct distance prediction from raw RSSI data in3-D indoor environments is impossible.For pro?ling approaches,our measurements show that antenna orientation information should be included in the?ngerprint.However,even if the antenna orientation that corresponds to a set of RSSI values is known it might be impossible to infer any distance information since some antenna orien-tations do not provide a consistent signal attenuation.This observation shows that modeling the antenna orientation e?ect as a random variable with gaussian distribution,as it is modeled in equation1,is not realistic.
Our experiments also show that the antenna orientation has a great impact on the ordering of the RSSI values.The ordering of RSSI values is meaningful only when the communication takes place in the symmetric region of the antenna as it is shown in Figure7(a).According to our?ndings this region of the antenna is only a small fraction of the communication range and therefore the ranking of the RSSI values provides little or no information in the case of3-D deployments where the antenna orientations of the communicating nodes are almost random.
The antenna orientation e?ect has also implications on the statistical RSSI localization algorithms.In most probabilistic algorithms a probability distri-bution,usually gaussian,of the RSSI values is assumed.In general,such an assumption holds only in the symmetric region of the antenna.When the com-munication between two nodes takes place in the non-symmetric region of the antenna,which is generally the case in a3-D network deployment,the variation in the RSSI values cannot be modeled by a gaussian distribution since,according to our experiments,there is a huge variation in the RSSI values.Consequently, our observations suggest that new probabilistic models that better capture RSSI variations need to be developed for3-D environments.
340 D.Lymberopoulos,Q.Lindsey,and A.Savvides
In the case of indoor environments,re?ections become the main problem in performing RSSI distance prediction.Only a very small range of RSSI values can be used for extracting distance information for up to3?4ft.In this region, RSSI changes linearly with distance.In addition,our?ndings show that3-D indoor sensor network deployments su?er of a high degree of link asymmetry. This link asymmetry is due to the multipath and fading e?ects as well as due to the random pairwise antenna orientations used during communication.
8Conclusions
We have conducted an empirical study of signal strength behavior using monopole antennas and the widely used Chipcon CC2420radio.Our experiments in a large open space with minimal multipath e?ects have shown that antenna orientation corrupts signal strength.This signi?cantly alters the quality of information that RSSI can provide for deriving spatial relationships.Our results and experience from this work show that signal strength localization will work in specially in-strumented scenarios.In other scenarios and3D deployments,signal strength localization remains an extremely challenging task.Statistical techniques and speci?c deployment scenarios will mitigate some of these challenges.However, the large amount of characterization needed will make the use of signal strength approaches with low power radios practically impossible.Our study also provides valuable insight into link asymmetry in indoor3D deployments. Acknowledgment
This work was supported in part by the National Science Foundation under award#0448082and a gift from OKI Semiconductors.The authors would also like to thank Prof.Sekhar Tatikonda for his valuable feedback on this work. References
1.P.Bahl and V.N.Padmanabhan.RADAR:An in-building RF-based user location
and tracking system.In Proc.IEEE Infocom,pages775–784,Tel-Aviv,Israel,April 2000.
2.M.Berna,B.Lisien,B.Sellner,G.Gordon,F.Pfenning,and S.Thrun.A learning
algorithm for localizing people based on wireless signal strength that uses labeled and unlabeled data.In Proceedings of IJCAI03,pages1427-1428,2003.
3.P.Castro,P.Chiu,T.Kremenek,and R.Muntz.A Probabilistic Location Service
for Wireless Network Environments.Ubiquitous Computing2001,September2001.
4.Chipcon:CC2420802.1
5.4compliant radio.https://www.doczj.com/doc/875187033.html,.
5.D.Niculescu and B.Nath.Vor base stations for indoor802.11positioning.In
Proceedings of Mobicom,2004.
6.E.Elnahrawy,X.Li,and R.M.Martin.The limits of localization using signal
strength:A comparative study.In Proceedings of Sensor and Ad-Hoc Communica-tions and Networks Conference(SECON),Santa Clara California,October2004.
An Empirical Characterization of Radio Signal Strength Variability341 7.T.He,C.Huang,B.Blum,J.Stankovic,and T.Abdelzaher.Range-free local-
ization schemes for large scale sensor networks.In International Conference on Mobile Computing and Networking(Mobicom),September14-19San Diego Cali-fornia,September2003.
8.Je?rey Hightower,Roy Want,and Gaetano Borriello.SpotON:An indoor3d loca-
tion sensing technology based on RF signal strength.UW CSE00-02-02,University of Washington,Department of Computer Science and Engineering,Seattle,WA, February2000.
9.Konrad Lorincz and Matt Welsh.Motetrack:A robust,decentralized aproachto rf-
based location tracking.In Proceedings of the International Workshop on Location-and Context-Awareness(Loca2005),2005.
10.D.Lymberopoulos and A.Savvides.Xyz:A motion-enabled,power aware sensor
node platform for distributed sensor network applications.In IPSN,SPOTS track, April2005.
11.D.Madigan,E.Elnahrawy,and R.Martin.Bayesian indoor positioning systems.
In Proceedings of INFOCOM2005,Miami,Florida,March2005.
12.D.Niculescu and B.Nath.Localized positioning in ad hoc networks.In Proceed-
ings of the First IEEE International Workshop on Sensor Network Protocols and Applications,San Diego,CA,May2003.
13.N.Patwari and A.O.Hero https://www.doczj.com/doc/875187033.html,ing proximity and quantized rss for sensor
localization in wireless networks.In WSNA03,San Diego,CA,September2003.
14.Prasithsangaree,P.Krishnamurthy,and P.K.Chrysanthis.On indoor position lo-
cation with wireless lans.In The13th IEEE International Symposium on Personal, Indoor,and Mobile Radio Communications(PIMRC2002),2002.
15.S.Ray,https://www.doczj.com/doc/875187033.html,i,and I.Pascalidis.Deployment optimization of sensornet-based
stochastic location-detection systems.In Proceedings of INFOCOM2005,Miami, Florida,March2005.
16.S.Saha,K.Chaudhuri,D.Sanghi,and P.Bhagwat.Location determination of a
mobile device using ieee802.11access point signals.In IEEE Wireless Communi-cations and Networking Conference(WCNC),2003.
17.Scott Y.Seidel and Theodore S.Rapport.914MHz path loss prediction model for
indoor wireless communications in multi?oored buildings.IEEE Transactions on Antennas and Propagation,40(2):207–217,February1992.
18.R.Stoleru and J.Stankovic.Probability grid:A location estimation scheme for
wireless sensor networks.In Proceedings of Sensor and Ad-Hoc Communications and Networks Conference(SECON),Santa Clara California,October4-72004.
19.P.Myllymaki T.Roos and H.Tirri.A statistical modeling approach to location
estimation.In IEEE Trnsactions on Mobile Computing,pages1:59–69,2002. 20.K.Whitehouse,A.Woo,C.Karlof,and D.Culler F.Jiang.The e?ects of ranging
noise on multi-hop localization:An empirical study.In Proceedings of Information Processing in Sensor Networks(IPSN),Los Angeles,CA,April2005.
21.K.Yedavalli,B.Krishnamachari,S.Ravula,and B.Srinivasan.Ecolocation:A
technique for rf based localization in wireless sensor networks.In Proceedings of Information Processing in Sensor Networks(IPSN),Los Angeles,CA,April2005.