Scalable Power Control for Many-Core Architectures Running Multi-threaded Applications
Kai Ma,Xue Li,Ming Chen,and Xiaorui Wang
Department of Electrical Engineering and Computer Science
University of Tennessee,Knoxville,TN37996
{kma3,xli44,mchen11,xwang}@https://www.doczj.com/doc/7e8827709.html,
ABSTRACT
Optimizing the performance of a multi-core microprocessor within a power budget has recently received a lot of attention.However, most existing solutions are centralized and cannot scale well with the rapidly increasing level of core integration.While a few recent studies propose power control algorithms for many-core architec-tures,those solutions assume that the workload of every core is in-dependent and therefore cannot effectively allocate power based on thread criticality to accelerate multi-threaded parallel applications, which are expected to be the primary workloads of many-core ar-chitectures.This paper presents a scalable power control solution for many-core microprocessors that is speci?cally designed to han-dle realistic workloads,i.e.,a mixed group of single-threaded and multi-threaded applications.Our solution features a three-layer de-sign.First,we adopt control theory to precisely control the power of the entire chip to its chip-level budget by adjusting the aggre-gated frequency of all the cores on the chip.Second,we dynami-cally group cores running the same applications and then partition the chip-level aggregated frequency quota among different groups for optimized overall microprocessor performance.Finally,we par-tition the group-level frequency quota among the cores in each group based on the measured thread criticality for shorter appli-cation completion time.As a result,our solution can optimize the microprocessor performance while precisely limiting the chip-level power consumption below the desired budget.Empirical results on a12-core hardware testbed show that our control solution can pro-vide precise power control,as well as17%and11%better appli-cation performance than two state-of-the-art solutions,on average, for mixed PARSEC and SPEC benchmarks.Furthermore,our ex-tensive simulation results for32,64,and128cores,as well as over-head analysis for up to4,096cores,demonstrate that our solution is highly scalable to many-core architectures.
Categories and Subject Descriptors
C.4[Performance of Systems]:Design studies;C.1.4[Processor Architectures]:Parallel architectures
General Terms
Design,Management,Performance,Experimentation
Permission to make digital or hard copies of all or part of this work for personal or classroom use is granted without fee provided that copies are not made or distributed for pro?t or commercial advantage and that copies bear this notice and the full citation on the?rst page.To copy otherwise,to republish,to post on servers or to redistribute to lists,requires prior speci?c permission and/or a fee.
ISCA’11,June4–8,2011,San Jose,California,USA.
Copyright2011ACM978-1-4503-0472-6/11/06...$10.00.Keywords
Chip multiprocessor,many-core architecture,power control,power capping,thread criticality,scalability,control theory
1.INTRODUCTION
Power dissipation has become a?rst-class constraint in current microprocessor design.As the gap between peak and average power widens with the rapidly increasing level of core integration,it is important to control the peak power of a many-core microproces-sor to allow improved reliability and reduced costs in chip cooling and packaging.Therefore,compared with the extensively studied power minimization problem,an equally,if not more,important problem is to precisely control the peak power consumption of a many-core microprocessor to stay below a desired budget while optimizing its performance.
Scalability is the?rst key challenge in controlling the power con-sumption of a many-core microprocessor.While various power control solutions have been proposed for multi-core microproces-sors(e.g.,[18,28,45]),the majority of current solutions relies on centralized decision making and thus cannot be applied directly to many-core systems.For example,the MaxBIPS policy[18]uses an exhaustive search to?nd a combination of DVFS(Dynamic V oltage and Frequency Scaling)levels for all the cores of a microproces-sor.The search is predicted to result in the best application perfor-mance while maintaining the power of the chip below the budget. While this solution works effectively for microprocessors with only a few cores,MaxBIPS does not scale well because the number of possible combinations increases exponentially with the number of cores.Therefore,highly scalable approaches need to be developed for many-core architectures.
The requirement to host multi-threaded applications is the sec-ond challenge for many-core power control.Although a few recent studies[47,39,29]present scalable control algorithms for many-core architectures based on per-core DVFS,they do not consider multi-threaded parallel applications and assume that the workload of every core is independent.As a result,these solutions may un-necessarily decrease the DVFS levels of the CPU cores running the critical threads in barrier-based multi-threaded applications.The unawareness of thread criticality can exacerbate the load imbal-ance in multi-core microprocessors and thus lead to unnecessarily long application execution times and undesired barrier stalls.This issue is particularly important for many-core architectures whose primary workloads are expected to be multi-threaded applications. Furthermore,many-core systems are likely to simultaneously host a mixed group of single-threaded and multi-threaded applications, due to the increasing trend of server consolidation,to fully utilize the af?uent core resource[27,8].Therefore,a power control algo-rithm must be able to handle such realistic workload combinations
and utilize thread criticality to ef?ciently allocate power among the cores that are running different applications.
Another major challenge in multi-core or many-core power con-trol is accurate power monitoring[34].Although the power con-sumption of a microprocessor can be measured by sensing the cur-rent fed into the chip[46],direct power measurement of a single core on a multi-core or many-core die is not yet available.On-die current sensors have been proposed,but have rarely been used in production due to problems such as area and performance overhead and calibration drift introduced by process variations[11].It is pos-sible to estimate the core power at runtime by counting the compo-nent utilizations(e.g.,cache accesses)and computing power based on a per-component power model.However,such direct compu-tation of core and structure power at runtime is complex due to a large number of performance statistics required[46].Since many-core systems are expected to have many simple cores[8],it may not be desirable to adopt an approach that requires a lot of extra hard-ware and statistics collection.Recently,Kansal et al.[21]have shown that the CPU power consumption of each Virtual Machine (VM)on a server can be estimated by adaptively weighting only one metric(CPU utilization)of each VM.However,they did not explicitly consider the impact of DVFS on their model despite the fact that the power consumption is different under different DVFS levels even for the same application.We propose to extend their work to estimate the power consumption of each core in a DVFS environment by taking both DVFS level and utilization into consid-eration.As a result,many-core power control can be evaluated on a real hardware platform instead of just by simulations as in previous work[47,39].
In this paper,we propose a novel and highly scalable power con-trol solution for many-core microprocessors that is speci?cally de-signed to handle realistic workload combinations.Our control so-lution features a three-layer design.First,we adopt control theory to precisely control the power of the whole chip to its chip-level budget,with theoretically guaranteed accuracy and stability,by ad-justing the aggregated frequency quota of all the cores on the chip. In a DVFS-enabled system,aggregated frequency is de?ned as the summation of the DVFS levels of all the cores normalized to the peak DVFS level of one core.Second,we dynamically group cores running the same applications and then partition the aggregated chip-level frequency quota derived from the chip-level power con-troller among different groups for optimized overall microproces-sor performance.Finally,we partition the group-level aggregated frequency quota among the cores in each group based on measured thread criticality for a shorter application completion time.As a result,our solution can optimize the processor performance while precisely limiting the chip-level power consumption below the de-sired budget.Speci?cally,this paper makes the following major contributions:
?We propose a highly scalable power control solution for many-core architectures running multi-threaded applications.Our
solution partitions the limited chip-level power budget among
different applications and cores based on measured applica-
tion performance and thread criticality.
?We adopt feedback control theory as a theoretical foundation
to control the power consumption of a many-core chip to its
desired power budget.This rigorous design methodology is
in sharp contrast to heuristic-based solutions that rely on ex-
tensive manual tuning.
?Since the power consumption of a core cannot be directly
measured in real multi-core microprocessors,we extend the
technique of estimating the power consumption of a VM on a
physical server to estimate the power consumption of a CPU
core and validate the estimation model on a hardware testbed.
?We implement our control solution on a12-core AMD Opteron processor and present empirical results to demonstrate that
our solution achieves better application performance within
a given power budget than two state-of-the-art solutions.Our
extensive simulation results with32,64,and128cores,as
well as overhead analysis for up to4,096cores,demonstrate
the scalability of our solution in many-core architectures. The rest of this paper is organized as follows.Section2discusses the system architecture of our control solution.Section3presents the chip-level power controller design.Section4describes dy-namic aggregated frequency quota partitioning at the chip and group levels.Section5presents the per-core power estimation technique. Section6introduces our hardware testbed,simulation setups,and the implementation details of our solution.Section7presents our evaluation results.Section8discusses the related work and Section 9concludes the paper.
2.SYSTEM ARCHITECTURE
In this section,we present a high-level description of our three-layer power control solution.As shown in Figure1,in the?rst layer,the chip-level power controller controls the power consump-tion of the whole chip to the chip power budget by adjusting the aggregated frequency quota(i.e.,summation of normalized DVFS levels)of all the cores.The second layer,i.e.,the chip-level fre-quency quota partitioning layer,partitions the chip-level aggregated frequency quota among the groups of cores,which host different applications proportionally to a metric called power ef?ciency(de-?ned in Section4.1.2).The third layer,i.e.,the group-level fre-quency partitioning layer,further partitions the group aggregated frequency quota among all the cores in each group,which host coupled threads of the same application,based on thread criticality (de?ned in Section4.2).The aggregated frequency quota is?rst partitioned among different applications(i.e.,groups of cores)and then partitioned among coupled threads(i.e.,individual cores)to achieve optimized performance.As a result,if the aggregated fre-quency quota of every core is enforced,the power of the entire chip can be controlled to stay within the desired power budget.In this paper,we adopt DVFS to enforce the frequency quota of each core, but our solution can also work with other frequency scaling tech-niques such as clock modulation.We assume that the frequency of each core can be adjusted individually in future many-core systems based on various industry practices and research studies[47,39]. For example,IBM and AMD have implemented per-core DVFS on commercial massive multi-core microprocessors(POWER78-core and Opteron12-core systems).Moreover,Intel has implemented per-tile DVFS on its24-tile many-core experimental chips[17].In addition,a167-core computational platform with per-core DVFS support has been implemented recently[42].Even in the systems without physically implemented per-core DVFS(e.g.,multi-power-island chips),Rangan et al.[36]have shown that thread migration on systems with only two power states can be used to approximate the functionality of continuous,per-core DVFS.
As shown in Figure1,the key components in the chip-level power control layer include a power controller and a power mon-itor.The following steps are invoked at the end of every control period:1)the power monitor(e.g.,an on-board power measure-ment circuit[46])measures the power consumption of the chip in the last control period and sends the value to the power controller and2)the power controller computes the new aggregated frequency
Figure1:applica-tions are grouped together.Idle cores(e.g.,C9)are transitioned into a low power mode.
quota for all the cores of the chip based on the desired power bud-get and measured power consumption.The aggregated frequency quota is then partitioned to optimize the system performance in the partitioning layers.
The key components in the chip-level frequency quota partition-ing layer include a single chip-level partitioner and an IPS(Instruc-tions Per Second)counter on each core.In order to effectively par-tition the power budget,we need to be able to calculate the power ef?ciency of each core.We adopt IPS/Watt as our power ef?ciency metric,which has been used by Intel as the power ef?ciency metric [16].The chip-level frequency quota is partitioned among multiple groups of cores periodically.At the end of each control period,the partitioner collects the grouping information of all the cores based on the OS scheduler(details are described in Section4.1.1).Each group of cores hosts all the threads of the same application.If a group consists of only one core,we refer to it as a single-threaded group;otherwise,we refer to it as a multi-threaded group.If a core is idle,we transition it to a low-power mode.For example,Core 1,2,5,and6are grouped together since they run four threads of a parallel application based on the scheduling information from OS. Core9is transitioned into the low-power mode since it is idle.The chip-level partitioner computes the power ef?ciency based on the IPS and the estimated power of each core,then calculates the over-all power ef?ciency of each group by summing up the ef?ciency of each core in the group.The chip-level partitioner partitions the ag-gregated frequency quota of the entire chip among the groups pro-portionally to the overall power ef?ciency of each group.Note that since the power control period at the chip level can be con?gured shorter than the OS scheduling period,we assume the mapping be-tween the threads and cores does not change within each control period.The same assumption has been made in[47].
The group-level frequency quota partitioning layer includes a group-level partitioner in each group,a criticality counter,and a DVFS modulator in each core.At the end of each control period, the criticality counter on each core monitors the criticality metric (de?ned in Section4.2)and forwards it to the partitioner.The partitioner receives the allocated group frequency quota from the chip-level partitioner and partitions the frequency quota among all the cores in the group based on the thread criticality of each core. Then,the DVFS modulator of each core changes the DVFS level of the core accordingly.
Because the computation of the controller may change the over-all aggregated frequency quota and the recalculation of chip-level partitioner may change the group aggregated frequency quota,the three layers run sequentially at the end of every control period.Fig-ure1shows a possible implementation that the three layers are integrated as?rmware on the service processor,similar to IBM POWER7’s power control module[46].We also discuss other im-plementation possibilities in Section6.3.
3.CHIP-LEVEL POWER CONTROL
In this section,we introduce the chip-level power controller that controls the power consumption of the entire chip to the desired power budget by adjusting the aggregated frequency quota(i.e., summation of normalized DVFS levels).A key advantage of the control-theoretic design approach is that it can tolerate a certain de-gree of modeling errors and adapt to online model variations based on dynamic feedback[15].Therefore,our solution does not rely on power models that are perfectly accurate,which is in sharp contrast to open-loop solutions that would fail without an accurate model. We?rst introduce some notation.T c is the control period.M is the number of cores on this chip.cp(k)is the power consump-tion of the entire chip in the k th control period.f(k)is the total aggregated frequency of all the cores on the chip in the k th control period.The dynamic range of f(k)is L?M≤f(k)≤M,rela-tive to the peak of one core,where L is the lowest available DVFS normalized to the peak level.We assume that our target system is a homogeneous-core system,which is the dominant con?guration of the current multi-core and many-core systems[17,43,4].How-ever,extending for heterogeneous-core systems is straightforward by scaling f(k).For example,if we have a more powerful core in the system along with the normal cores,instead of taking the dynamic range of the more powerful core as L to1like the nor-mal core,we count it as L′to H′.Both L′and H′are derived by scaling the available DVFS levels of the powerful core to the peak DVFS level of a normal core.?f(k)=f(k+1)?f(k).P t is the power budget of the whole chip,which can be determined by the thermal and power supply constraints of the processor or speci?ed by the user during runtime.e(k)is the control error,speci?cally, e(k)=P t?cp(k).The control goal is to direct cp(k)to converge to P t within a certain number of control periods by adjusting f(k). System Modeling.We now model the dynamics of the con-trolled system,namely the relationship between the controlled vari-able,i.e.,cp(k),and manipulated variable,i.e.,f(k).Existing studies by both Raghavendra et al.[35]and Wang et al.[44] have shown that the processor power can be modeled as an approx-imately linear function to the DVFS level within the limited DVFS adaptation range available in real multi-core processors.In this pa-per,the power consumption of a processor is modeled similarly as: cp(k)=a?f(k?1)+cp(k?1),(1) where a is the generalized parameters that may vary for different chips and applications.a is also the scaling factor that characterizes
the impact of DVFS change on chip power.In our design,we derive a by using the data sheet full power range(from the idle power to the maximum power of the chip[3])divided by the dynamic range of f(k).We conducted stability analysis[15]on our controlled system.The results show the stability range of a is from0to2a. Since we used the maximum possible a at design time,the variation of a could never exceed the range.The control loop is theoretically guaranteed to converge to the set point for all possible workloads. Controller Design.Proportional-Integral(PI)control can pro-vide robust control performance despite considerable modeling er-rors.Based on the system model(1),we design a PI controller as follows:
f(k)=f(k?1)+K1e(k)?K1K2e(k?1).(2) Following the standard pole placement method[15],we can choose our control parameters as K1=1/a and K2=0,such that the controlled system is stable and has a zero steady state error.The detailed steps can be found in a standard control textbook and are skipped due to space limitations.The desired aggregated frequency quota of all the cores on the chip in the k th control period can be computed accordingly as:
f(k)=f(k?1)+
(P t?cp i(k))
ET app
i(base).ET app
i(scheme)
is
the execution time of the i th application under a certain power man-
agement scheme.ET app
i(base)is the execution time of running the
i th application of the peak frequency level all the time.N a is the number of applications in the system,i.e.,the set of applications that execute together.FS is an indicator of the overall improvement in execution ef?ciency gained across the applications.It is also a metric of fairness.In the following sections,we?rst introduce how to group the cores that run the threads of the same application based on the scheduling information in the OS.We then present the aggregated frequency quota partitioning among the groups.
4.1.1Core Grouping
In many-core microprocessors,different threads run simultane-ously on different cores.We place the cores that host the threads of the same application into a group.Therefore,the number of groups is equal to the number of applications running on all the cores.The bene?t of core grouping is to reduce the coupling of the power de-mand among different applications.
In this project,we assume that the mapping between the threads and cores does not change within a certain period(i.e.,the schedul-ing period).Since the scheduling interval in operating systems is in tens of milli-seconds,if we conduct the power control in a shorter period,this assumption is valid.The same assumption is made in [47,5,7,10,28].At the end of each scheduling period,the chip-level frequency partitioner may collect the grouping information from the OS.If we implement the algorithm as a loadable kernel module of OS,the grouping information can be derived from a sys-tem function.If we implement the controller as a piece of hardware on the chip,this information exchange between hardware and soft-ware can be achieved by adding special purpose registers on the chip.If the proposed solution is implemented as?rmware running on the service processor on the motherboard,the information ex-change between the main processor and service processor can be achieved via external ports[46].
4.1.2Aggregated Frequency Partitioning
Before we discuss the chip-level power partitioning,we?rst in-troduce some notation.A many-core microprocessor has N groups of cores and group i runs application i,where1≤i≤N.IP S i is the average IPS of group i when running the i th application on the many-core microprocessor without any power constraint.IP S i can be derived by conducting application pro?ling on the desired number of cores at the peak DVFS level and then calculating the average IPS of each core.Note the pro?ling is only performed once for each application on the desired number of cores.The OS can send IP S i to the controller via on-chip registers.ips i(k)is the measured IPS of the i th group.W T i(k)is the estimated power of the i th group.Since each group may consist of multiple cores, ips i(k)and W T i(k)are the accumulated IPS and power of all the cores in the i th group.
To achieve optimized overall performance,the aggregated fre-quency quota partitioned among different groups should be propor-tional to the ratio between the performance and power consump-tion(i.e.,ips i(k)/W T i(k)).However,this may lead to the follow-ing problem.Some applications intrinsically have a low IPS even without any power constraint.To partition power based on IPS is unfair to those applications if they run simultaneously with other applications that have intrinsically high IPSs.To address this prob-lem,we use the relative IPS,rips i(k),as the performance met-ric in this paper,which is the measured IPS ips i(k)normalized to IP S i.Speci?cally,rips i(k)=ips i(k)/IP S i,similar to the fairness de?nition used in[22].We de?ne the power ef?ciency of the i th group e i(k)as the ratio between rips i(k)and W T i(k). Speci?cally,e i(k)=rips i(k)/W T i(k).
In this paper,we partition the chip-level aggregated frequency quota among groups proportionally based on the power ef?ciency of each group to achieve the optimized performance
fg i(k)=
e i(k?1)
Table1:Workload mixes used in testbed and simulation experiments.
1.Physical testbed workload mixes
PARSEC2.1,SPEC2006
mix1all separated applications
12-Streamcluster
mix3no-barrier parallel workload
4-x264,8-?uidanimate
mix5low-barrier and high-barrier mix
4-(vips,facesim),1-(libquantum,astar,soplex,dealII)
Mixes Aggregate Effect
water(nsquared)
mix2all seperated applications
FFT,Ocean_non,LU_con,LU_non(each occupies1/4number of cores)
,(5)
L1penalty
where N(L1miss)is the number of L1misses that hit in the L2
cache,N(L1L2miss)is the number of L1misses that also miss
in the L2cache,and L1L2penalty and L1penalty are L2and L1
cache miss penalties,respectively.The cache miss penalty is mea-
sured in CPU cycles.Within a parallel working group,a higher
criticality value implies a more poorly-cached,slower thread[5],
which means that additional power needs to be shifted to that thread
from the non-critical threads(with smaller criticality values)to re-
duce the runtime imbalance.In our design,we proportionally sub-
partition the frequency quota of a multi-threaded group to its cores
based on criticality as follows
cr ij(k?1)
fc ij(k)=
.(8)
M
For heterogeneous-core systems,we could extend the model by
scaling f i(as described in Section3).Intuitively,the workload
characteristics could be more accurately captured by using different
weights(W i instead of W)for different cores.However,this ap-
proach would make the complexity of the on-line regression prob-
lem increase linearly with the number of cores,which might not be
favorable for many-core architectures.
Table2:Simulator con?guration parameters for SESC.
CMP2-way,64bytes block32KB,2cycles hit latency Alpha21264like Private L2cache
Peak Frequency/Vdd(4,8,16)x8mesh,wormhole switching
65nm/80?Network latency
fetch/issue/commit width400cycles
6.IMPLEMENTATION
In this section,we?rst introduce the physical testbed and the simulation environment used in our experiments.Next,we discuss the possible implementation of our solution on a physical chip. 6.1Testbed
Our testbed is a12-core AMD Opteron6168processor,which supports per-core DVFS with?ve different levels[3].The operat-ing system is OpenSUSE11.2with Linux kernel2.6.31.To evalu-ate our power control policy,we simultaneously run different com-binations of selected benchmarks from the PARSEC2.1[6]and SPEC CPU2006suites on our physical testbed.We use the SPEC suite subset identi?ed in[33]to represent the major characteristics of SPEC CPU2006.The constructed workload combinations of PARSEC and SPEC cover a variety of different aggregate effects and are listed in Table1.In Table1,the number-appname nota-tion is the number of threads of the application with the name of appname for PARSEC and SPLASH-2workloads;for SPEC2006 workload,it is the number of copies of the application with the name of appname.
To measure the power consumption of the processor,we use the approach proposed in[14,19].An Agilent34410A digital multi-meter is used together with a Fluke i410current probe to measure the current running through the12V power lines that power the processor.The probe is clamped to the12V lines and produces a voltage signal proportional to the current running through the lines with a coef?cient of1mv/A.The resultant voltage signal is then measured with the multimeter.The measured value is read by the server through a USB cable using a USBTMC device driver. The accuracy of the current probe is(3.5%of reading+0.5A). The power consumption of each core is estimated periodically(de-scribed in Section5).
on our prototype testbed,we implement the control algorithm as an OS daemon process to control the target processor,though the controller can be implemented in the service processor?rmware in a real system.The controller periodically reads the power con-sumption from the power monitor and the performance statistics from OS.It then executes the control algorithm presented in Sec-tion3.As the outputs of the control algorithm,new DVFS levels are calculated and enforced in the next control period.The control period T c for the controller is set to1second because the timer res-olution in Linux is10ms.Note that much shorter control periods could be used in a real?rmware or on-chip implementation. Since the new aggregated DVFS level periodically received from the power controller can be any value,it may not be exactly one of the DVFS levels supported by the processor.Therefore,a DVFS modulator is needed to approximate the desired level with a series of supported DVFS levels.For example,to approximate0.9dur-ing a control period,the modulator would output the sequence,0.8, 1.0,0.8,1.0etc,on a smaller timescale.To implement the approx-imation,we use the?rst-order delta-sigma modulator[24]to gen-erate the sequence in each control period.This type of modulator is commonly used in analog-to-digital signal conversion.Clearly, when the sequence has more numbers during a control period,the approximation will be better,but the actuation overhead may be-come higher.On our prototype testbed,we use10subintervals to approximate the desired DVFS level and each subinterval is100ms.As a result,the effect of actuation overhead on system performance is no more than0.02%(20μs of DVFS overhead[40]divided by 100ms),even in the worst scenario when the DVFS level needs to be changed in each subinterval.
6.2Simulation Environment
To simulate different applications running in the many-core sys-tem,we simultaneously run different combinations of selected bench-marks from the SPLASH-2[48]and SPEC CPU2006suites in our simulator.We use SPLASH-2in our simulation because there is no known report about cross-compiling PARSEC for SESC.We are working with the PARSEC authors on it.
To stress test our power management solution in a many-core microprocessor with a large-scale con?guration(i.e.,a large num-ber of cores),we conduct simulations using SESC[37]simulator with modi?cations for per-core DVFS support.The cores are con-?gured based on an Alpha21264(EV6)scaled to current process technology.Its main parameters are listed in Table2.Each core has4DVFS levels normalized to the maximum frequency(i.e.,1, 0.9,0.8and0.7).We integrate the MESI cache coherence protocol on the top of the basic Network on Chip(NoC)module of SESC to construct a fully functional NoC so that our simulated many-core microprocessor can provide a coherence guarantee among all the cores.The power of the core part is derived as the combination of the dynamic power reported by Wattch[9]and leakage power estimated by HotLeakage[49].We use Orion2.0[20]to estimate the power consumption of the NoC.To simulate the DVFS actu-ation overhead,we assume that no instruction is executed during synchronization[18].Based on recent studies[23],the DVFS ac-tuation overhead can be decreased to tens of ns in the near future. Therefore,we choose to use a250ns transition overhead[5]and10 subintervals in a control period of250μs,which leads to a DVFS overhead of up to1%in each control period.Our scheme allows a higher DVFS overhead by having a longer control period.For ex-ample,if we change control period from250μs to5ms,the DVFS overhead is still up to1%with a5μs transition time as in Nehalam processors[1].
6.3Discussion on Hardware Implementation Since power management algorithm might need to be imple-mented on-chip[38]due to the future system integration trend,we discuss the possible on-chip implementation of our solution in this section.The dominant circuit in our solution is the?xed-point divi-sion in the partitioner and the?xed-point multiplication in the con-troller.The division could be implemented as a multiplier with10% extra circuits[32].Since the controller and two partitioners are se-quential in our algorithm,they could share the same piece of hard-ware that could be deployed on an on-chip PMU[38].For the total power budget on the order of hundreds of Watts(a10-bit repre-sentation is suf?ciently accurate for power management purpose), we conservatively use a16-bit?xed-point multiplier.Bitirgen et al.[7]have estimated that a16-bit?xed-point multiplier yields an area of0.0057mm2with65nm process technology.For a typical 200mm2die,the hardware overhead is only0.003%.To approx-imate the power consumption by the?xed-point multiplier circuits in the hardware,we assume the power density of IBM POWER6’s FPU[13],which is0.56W/mm2at100%utilization with nominal
0204060801001200
102030405060708090
P o w e r (W )
Time (s)
Measured
Estimated
0204060801001200
102030405060708090
P o w e r (W )
Time (s)
Measured
Estimated
(a)Power trace when cores run at the peak DVFS level.(b)Power trace when cores run at randomized DVFS levels.
306090
120
150
0.8
1.31.911.50.81.31.911.50.81.31.911.5A v e r a g e p o w e r (W )
Frequency level (GHz)
Measured Estimated
mix1mix2mix3mix4mix5mix60
5101520
2530
0.8
1.31.911.50.81.31.911.50.81.31.911.5P o w e r S t d e v (W )
Frequency level (GHz)
Measured Estimated
mix1mix2mix3mix4mix5mix6(c)Average measured and estimated power.(d)Standard deviation of measured and estimated power.
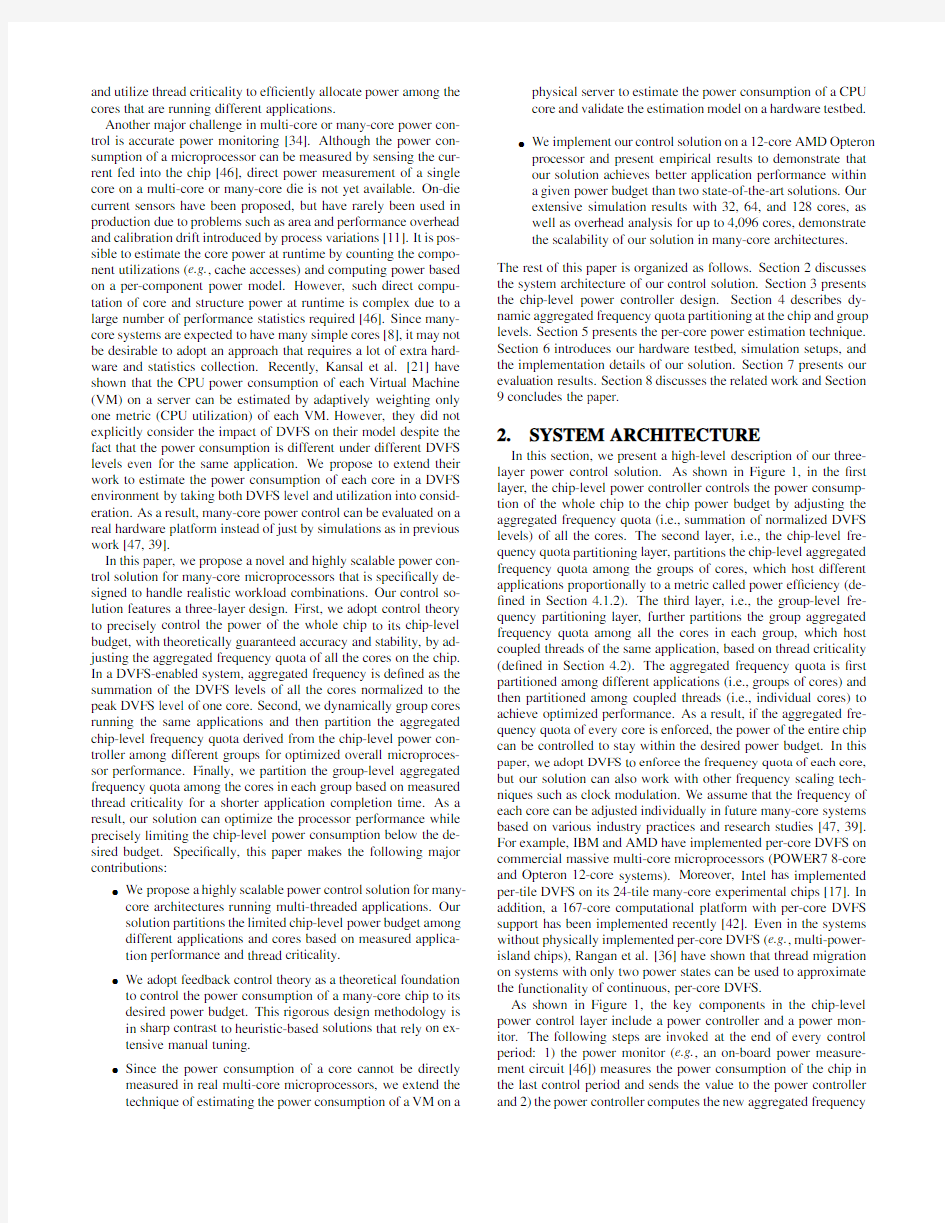
Figure 2:Power estimation accuracy experiments on a 12-core hardware testbed.
voltage and frequency values (1.1V and 4GHz).The extra power consumed by the ?x-point multiplier is only 0.003W.Additionally,we need to add two programmable registers on each core:one is to record the base IPS (IP S i de?ned in Section 4.1.2)of the thread scheduled on this core;the other is to record the grouping informa-tion.The performance counters recording the instruction count and cache miss count are already available on most modern micropro-cessors.The delta-sigma modulator consists of one accumulator and one comparison,which is a very light-weight piece of circuit.Furthermore,if the DVFS level is ?ne-gained enough (e.g.,[46]),the modulator could be eliminated.Therefore,our solution is a hardware-ef?cient solution even for on-chip implementation.
7.EV ALUATION
First,we introduce two state-of-the-art baselines.Next,we present our physical testbed and simulation results for many-core architec-tures.Finally,we provide both the theoretical and experimental analysis of the scalability of our solution.
7.1Baselines
Our ?rst baseline,referred to as Priority ,is a heuristic-based power controller for CMPs proposed by Isci et al.[18].The control scheme of Priority is brie?y summarized as follows.1)Every core is assigned a priority.2)In each control period,if the total power consumption of the chip is lower than the set point,Priority chooses the core with the highest priority to increase its DVFS level by one.If the core is already running at its highest DVFS level,the core with the next highest priority will be tried.Alternatively,if the power of the chip is above the set point,Priority chooses a core (starting from the lowest priority core)to decrease its DVFS level by one.3)Priority repeats step 2until the system stops.Priority represents a typical centralized solution that adopts a light-weight trial-and-error approach to exploit the combinations of the power states of all the cores.We compare our power management solution against Priority to show that heuristic-based,though light-weight,
solutions may be insuf?cient for many-core architectures due to the exponential explosion of the number of global power states.
Our second baseline,referred to as Steepest Drop ,is a heuristic-based optimization algorithm for many-core architectures proposed by Winter et al.[47].When the chip power is over the budget,the algorithm selects the application/core pair that would provide the biggest ratio of power reduction to performance loss if the DVFS level was dropped by one step.This process is repeated until the total power is smaller than the budget.Although Steepest Drop has been demonstrated to outperform a variety of state-of-the-art algo-rithms and have a small computation overhead even for a 256-core system,it is based on the assumption that all the cores run indepen-dent workloads.This assumption is invalid since it oversimpli?es the coupling among the cores hosting the same parallel application.We compare it with our solution to show that it is necessary to con-sider the couplings among all the cores in power management for improved application performance.
In the following subsections,we refer to our solution as FreqPar .
7.2Estimation Accuracy
In this experiment,we test the accuracy of our online power esti-mator presented in Section 5.In Figure 2(a),we set all the cores to the peak frequency and run mix1on the 12cores.Figure 2(a)shows that the estimated total chip power can track the measured actual power during the execution time with only small errors.To stress test our estimation scheme,in Figure 2(b),we randomly modulate the DVFS levels of all the cores.Figure 2(b)shows our scheme can track the total power with a reasonable accuracy.In Figures 2(c)and (d),we plot the average and standard deviation of the mea-sured and estimated power respectively,under different frequency levels and benchmark mixes.On our physical testbed,there are ?ve DVFS levels:0.8GHz,1.0GHz,1.3GHz,1.5GHz,and 1.9GHz.For the estimated average power,the average difference between esti-mated and measured power is within 1Watt in most cases,with the worst case being mix5at 1.9GHz with a 3.6W difference.For the standard deviation,the average difference between estimated and
7
891011121345
556575850
10
20304050T o t a l f r e q u e n c y P o w e r (W )
Time (s)
Power Budget
Freq
789101112
1345
556575850
10
20304050T o t a l f r e q u e n c y P o w e r (W )
Time (s)
Power Budget
Freq
(a)Total frequency and power trace:Priority .
7
891011121345
556575850
10
20304050T o t a l f r e q u e n c y P o w e r (W )
Time (s)
Power
Budget
Freq
(c)Total frequency and power trace:FreqPar .
Figure 3:Power control accuracy comparison.In (a)-(c),the frequencies are relative to the peak of a selected core.In (d),the power values are relative to the peak power in each test case.measured power is within 2Watt in most cases,with the worst case being mix4at 0.8GHz with a standard deviation difference of 3.2W.
7.3Testbed Results
In this subsection,we compare our solution with the two base-lines on our physical testbed,in terms of power control accuracy and application performance.
7.3.1Power Control Accuracy
In this subsection,we ?rst perform a case study to investigate dif-ferent power management algorithms to show that the algorithms based on the feedback control theory can achieve better power con-trol accuracy.Then,we present the average power control results of FreqPar and the baselines under different power budgets.
In Figures 3(a)-(c),we schedule 12copies of lbm from SPEC CPU2006suite on the 12cores and all algorithms start with all cores set to the lowest frequency level,which is the default setting policy of Linux if the cores are idle.Since the power is lower than the set point (80W for all the policies in this test)at the beginning,all the policies try to raise the DVFS levels of the cores to improve performance.In Figure 3(a)Priority responds by increasing the DVFS level of one core at a time,until the power is higher than the set point in the 20th control periods.Then it directs the DVFS level of a core up/down around the set point.There are two parts of this simple algorithm that can be improved.The ?rst one is that a large number of cores will lead to a very long settling time because Pri-ority only steps up/down one level of a core in each control period.The second one is that Priority always oscillates between two ad-jacent DVFS levels of a core,even in the steady state.As a result,it never settles to the set point.Since Priority has steady state er-rors,it may be undesirable to use Priority in a real system because a positive steady state error (i.e.,average power is above the set point)may violate the power budget.Lefurgy et al.[24]have iden-ti?ed this issue and addressed it by having a safety margin when the power budget is assigned.To ensure that the safety margin is safe for all the benchmarks,we run the most hungry benchmark
(mix1)on every set point between 60W to 85W with 1W step to get the maximum positive steady-state errors,which is 2.42W.By ap-plying such a safety margin when assigning the power budget,we ensure that the average power is always within the power budget.We refer to the Priority policy with a safety margin as Improved Priority .Note that Improved Priority is actually not feasible in practice because it is dif?cult to have such a priori knowledge about the safety margin before actually running the workload with all the possible power set points.In the following experiments,we use Improved Priority as a baseline that can achieve the best possible performance in an ad hoc way and yet does not violate the power constraint.
In order to address the long settling time,Steepest Drop [47]has been proposed to explore multiple steps in each control period,based on an analytical model of the power consumption and per-formance contribution of a core.Figure 3(b)plots the typical run of Steepest Drop .Steepest Drop takes advantage of the direction of its model,going directly to the estimated optimal DVFS level each time.This policy successfully addresses the long settling time issue in Priority .However,even in the ideal case,the power man-aged under Steepest Drop is always lower than the set point because the algorithm terminates the search until the estimated power is just lower than the budget,resulting in an unnecessarily lower total run-ning frequency.
Figure 3(c)shows that FreqPar can precisely control the power of the chip by receiving a desired DVFS level from the controller,and then using the DVFS modulator to generate a series of sup-ported DVFS levels on a ?ner timescale to approximate the desired level.One may think that Priority could be improved by also using a series of DVFS levels for each core.However,Priority would still have the same steady-state error because,without a desired DVFS level precisely determined based on control theory,Priority can only oscillate between two DVFS levels of a https://www.doczj.com/doc/7e8827709.html,pared with Steepest Drop in Figure 3(b),FreqPar on average runs at a higher frequency (9.9relative to the peak of one core,compared to
3691215
180.6
0.70.80.911.11.20
10
20304050W e i g h t e d c a c h e
m i s s e s (x 10,000)
F r e q u e n c y
Time (s)
FreqCore0FreqCore1
Imbalance
(b)Frequency allocation trace:Steepest Drop .0
36912
15
18
0.6
0.70.80.911.11.20
10
20304050W e i g h t e d c a c h e m i s s e s (x 10,000)
F r e q u e n c y
Time (s)
FreqCore0FreqCore1
Imbalance
(c)Frequency allocation trace:FreqPar .
Figure 4:Group-level (thread criticality-aware)frequency quota (i.e.,sum of normalized DVFS levels)allocation traces of FreqPar and the baselines.
9.4for Steepest Drop ),because the precise control policy of Freq-Par can use all the available power budget.
Figure 3(d)plots the average power with standard deviations (as error bars)for FreqPar and the baselines.In all the tests,we run the application mixes to the end.The power readings are relative to the peak power in each test case.As discussed previously,FreqPar can precisely achieve the desired power budgets while the other two methods waste the budgets.
7.3.2Application Performance
In this subsection,we ?rst provide two case studies to discuss the underlying reasons that FreqPar has better performance at both the group and chip levels.Then,we present the average performance of FreqPar and the baselines under different power budgets.
Figures 4(a)-(c)show the reason that FreqPar can outperform the baselines for parallel workloads.In this experiment,we run two threads of streamcluster (PARSEC)on Core 0and Core 1and leave the other cores unused with a 45W total chip power budget.Under the management of Steepest Drop ,the algorithm always fa-vors the cores hosting a high raw IPC,which is not necessarily the critical thread that needs more frequency quota within the paral-
lel workload at runtime.Considering the spinning lock,in which the thread has a very high IPC without real progress,a policy that simply favors the high IPC will make the imbalance worse [2].Bhattacharjee et al.[5]have identi?ed that the weighted cache misses are positively correlated with criticality and proposed to take weighted cache misses as the imbalance indicator.In Figures 4(a)and (b),we observe that the imbalanced frequency allocation poli-cies like Priority and Steepest Drop increase the weighted cache miss difference between the two cores within a short period of time (60s in this test).The cross-marked curves in Figure 4are the ag-gregated weighted cache misses.In contrast,with FreqPar ,Figure 4(c)shows that the frequency quota is fairly shared by the two cores and always shifted to the cores with a higher criticality within the working group,which dramatically reduces the imbalance between the two threads.As a comparison,we also test the case of evenly dividing frequency quota between the two cores in our initial de-sign as Even .Our results show that by dynamically allocating the frequency to the critical thread,FreqPar is better than Even .The average absolute weighted cache misses differences between the cores in this test are 7843,4437,1703,and 739for Priority ,Steep-est Drop ,Even ,and FreqPar ,respectively.
Figure 5illustrates the reason why FreqPar can outperform the baselines in terms of FS (Fair Speedup)at the chip level.In this experiment,we run one copy of milc (SPEC CPU2006)on Core 0and one copy of zeusmp (SPEC CPU2006)on Core 1.We leave the other cores unused.Figures 5(a)-(c)show the frequencies of the two cores under different policies with a 45W chip power budget.Steepest Drop always favors the core hosting high raw IPC because that core generally has a higher IPC/Watt gradient,hence sacri?c-ing fairness.In Figure 5(b),Core 1has advantage because it has a higher IPC by nature than Core 0.Therefore,Core 0is always placed into a low frequency level except when Core 1has reached its peak frequency and power consumption is still lower than the budget.Improved Priority in Figure 5(a)behaves in a similar way because it has a preset static priority.In contrast,with FreqPar ,Fig-ures 5(c)and (d)show that the frequency quota is always shifted to the core with a higher relative power ef?ciency.Both cores have the opportunity to get their fair share of the frequency quota under the power budget.FreqPar outperforms the baselines because FreqPar uses relative power ef?ciency as the frequency quota partitioning criterion to achieve optimized performance with fairness consider-ation.In FreqPar ,rips i (k )(de?ned in Section 4.1.2)captures the relative application progress and eliminates the instruction count in?ation caused by the natural characteristics of the applications.In contrast,the fairness-blind baselines favor some applications too much over other co-scheduled applications,resulting in degraded overall performance.Based on rips i (k ),FreqPar allocates more frequency quota to high-ef?ciency applications to optimize overall performance with fairness consideration.
Figure 6plots the overall performance comparison among dif-ferent power budgets and benchmarks in terms of FS.Due to the reasons discussed in the previous case studies,we observe that Fre-qPar outperforms the Improved Priority and Steepest Drop by 17%and 11%on average,respectively.
7.4Simulation Results
In this subsection,we compare FreqPar with the two baselines in our simulation environment.
In our simulator,for each number of core con?guration,we run the constructed benchmarks (Table 1)with a power budget of 75%of the peak power of each benchmark mix and report the average.We fastforward 1billion instructions and simulate 3,5,and 8bil-lions for 32,64,and 128core con?guration,respectively.Figure 7
Figure 5:Chip-level (power ef?ciency-aware)frequency quota (i.e.,sum of normalized DVFS levels)allocation traces and power ef?ciency of FreqPar and the baselines.
Figure 6:Overall performance comparison between FreqPar the baselines on a 12-core hardware testbed.
shows the power control accuracy and performance of each policy.Power readings are relative to the power budget.The FS numbers are relative to the FS of FreqPar in each test case.We observe that FreqPar can precisely control the power of the chip to the de-sired set point while both the two baselines waste certain amount of available power budget.Note that when we calculate the average power,we skipped the initial phase and compute the steady phase for all the policies.Figure 7also shows that FreqPar has better performance than the baselines for each core con?guration.Fur-thermore,FreqPar ’s power and performance improvements over the baselines increase with the number of cores.This is because Improved Priority spends a long time under the budget because of its long settling time.For Steepest Drop ,with more cores,the raw-IPC-directed optimization without fairness and criticality consider-ations worsens the imbalance among the cores.
7.5Discussion on Algorithm Complexity and
Scalability
The computational complexity in terms of the algorithm execu-tion time determines the algorithm scalability.We ?rst analyze the
computational complexity of studied algorithms and then provide experimental results.Suppose there is an M-core system that sup-ports per-core DVFS and the number of available DVFS levels is L .Priority adjusts the DVFS level of a core by one step at a time.It is a O (1)algorithm.However,its long convergence time makes it unlikely to be implemented in many-core systems.In the worst case,if the current power state is that every core is running at the peak state,Priority takes L M control periods to reach the lowest power set point.During that time,undesirable overheating may oc-cur.Steepest Drop checks all the cores to determine the optimal one step action based on an analytical model in one iteration,and it iterates multiple times until the estimated power of the analytical model is less than the budget.In the worst case,the search goes up-/down L ?M times.Therefore,it is a O (L ?M 2)algorithm.Winter et al.[47]propose a special data structure to reduce the implemen-tation complexity to O (L ?Mlg (M )).Since IBM has implemented a digital phase-locked loop [41],which achieves a near-continuous set of output frequencies without skipping processing cycles,an al-gorithm with an execution time linearly increasing with the number of available DVFS levels might be unfavorable.In contrast,even in the worst case,FreqPar proceeds through the cores twice (one for the chip-level and one for the group-level).Therefore,it is a O (M )algorithm independent from L .Furthermore,if the avail-able DVFS levels are ?ne enough,the delta-sigma modulator could be eliminated,resulting in an even simpler design.
We now conduct experiments to measure the execution times of the three algorithms on our testbed.We examine the algorithm execution time as the number of cores increases in Figure 8.In the experiment,we invoke the investigated algorithms 500times on our physical testbed with random generated power and DVFS levels as the inputs and present the average execution time.
In Figure 8,the execution time scaling trends of the algorithms con?rm our theoretical analysis.As a O (L ?Mlg (M ))algorithm,Steepest Drop achieves a modest execution time scaling with the
simulations under different number of cores.
5
10
15
20
25
166425610244096 E
x
e
c
u
t
i
o
n
t
i
m
e
Number of cores
Steepest Drop (50 levels) (1ms)
Steepest Drop (2 levels) (100us)
FreqPar (100us)
Figure8:Execution time experiments show that Fre-qPar is more scalable than Steepest Drop.
number of cores when the number of available DVFS levels is small (e.g.,2levels).However,when the number of DVFS levels is large, the scalability is questionable.Suppose that the dynamic power adaptation range of one core is from0.5to1relative to the peak, with a1%step size(achievable for POWER7[41]),the average execution time of Steepest Drop uses more than20ms on a4096-core system.In contrast,FreqPar is a scalable O(M)algorithm independent from the number of DVFS levels.Even for managing a4096-core system,the average execution time of FreqPar is only 650μs.The key reason that FreqPar outperforms Steepest Drop (a classic down-hill search algorithm with optimized implementa-tion)on scalability is that,with the delta-sigma modulator,FreqPar uses a numerical computation to replace the discrete search used by Steepest Drop in the decision making part.
8.RELATED WORK
Power dissipation has been one of the major design concerns for computing systems.Much prior work has focused on minimizing the power consumption within a speci?ed performance guarantee. For example,Li et al.[25]propose a solution called thrifty barrier that places the faster cores into a lower power mode at the bar-riers(i.e.,joint point)while waiting for the slower cores so that power can be saved.Liu et al.[26]use per-core DVFS to slow down the faster cores,such that both the idle time due to wait-ing and power consumption are reduced.Cai et al.[10]extend [26]by adding meeting points within the execution of the parallel loops and solve the same problem at a?ner granularity.However, all of the solutions cannot provide any explicit guarantees for the power consumption to stay below a desired budget though the per-formance is guaranteed to some extent.Our work is different in that we focus on a different,but equally important,problem,i.e.,power capping to avoid power overload or thermal violations and prevent over-provision of cooling,packaging,and power supply capacities at the processor design time.
Some work has been performed to manage peak power or tem-perature for CMPs.Intel Foxton technology[38]has successfully controlled the power and temperature of a microprocessor using chip-wide DVFS.Isci et al.[18]propose a closed-loop algorithm called Priority and a prediction-based algorithm called MaxBIPS to limit the power of a CMP.Wang et al.[45]also apply advanced control theory to develop a power control algorithm for improved CMP performance.However,the application of these solutions on many-core systems is prohibited either by the exponential explo-sion of the number of possible global power management states in many-core architectures,e.g.,[38,18],or by the high control delay and computation overhead due to centralized decision making,e.g., [45].As a result,none of them are scalable to the large number of cores in many-core architectures.
A recent study by Winter et al.[47]presents a global power management algorithm called Steepest Drop for many-core systems with a light overhead.Sartori et al.[39]discuss to use hierarchical structure to cap the power of many-core systems.Another related piece of work by Mishra et al.[30,29]uses absolute BIPS to al-locate the chip power budget to each power island and performs per-island power control.However,these solutions assume the in-dependence of workloads among all the cores.Therefore,it may impair the coupling of workloads among all the cores and result in degraded system performance.In contrast,our highly scalable solution can dynamically shift the power budget among the groups of cores that host different applications based on power ef?ciency, and then further among all the cores in the same group that host the coupled threads from the same application based on thread critical-ity.
9.CONCLUSION
The majority of existing solutions on power control of multi-core architectures does not scale well for many-core architectures.More importantly,those solutions cannot effectively allocate power based on thread criticality to accelerate multi-threaded parallel applica-tions,which are expected to be the primary workloads of many-core architectures.In this paper,we have presented a highly scal-able power control solution that is speci?cally designed to han-dle realistic workloads,i.e.,a mixed group of single-threaded and multi-threaded applications.Our solution features a three-layer de-sign.First,we adopt control theory to precisely control the power of the entire chip to its chip-level budget by adjusting the aggre-gated frequency of all the cores on the chip.Second,we dynami-cally group cores running the same applications and then partition the chip-level aggregated frequency quota among different groups for optimized overall processor performance.Finally,we parti-tion the group-level aggregated frequency quota among the cores on each group based on the measured thread criticality for shorter application completion time.As a result,our solution can optimize the processor performance while precisely limiting the chip-level power consumption below the desired budget.Empirical results on a physical testbed show that our control solution can provide pre-cise power control,as well as17%and11%better application per-formance than two state-of-the-art solutions,on average,for mixed PARSEC and SPEC benchmarks.Furthermore,our extensive sim-ulation results for32,64,and128cores,as well as overhead anal-ysis for up to4,096cores,demonstrate that our solution is highly scalable to many-core architectures.
10.ACKNOWLEDGEMENTS
This work was supported,in part,by NSF under Grants CCF-1017336,CNS-0915959,and CNS-0845390(CAREER Award), and by ONR under Grant N00014-09-1-0750.We would also like to thank the anonymous reviewers for their valuable comments. 11.REFERENCES
[1]Intel turbo boost technology.
https://www.doczj.com/doc/7e8827709.html,/technology/turboboost/,2007.
[2]A.R.Alameldeen and D.A.Wood.IPC considered harmful
for multiprocessor workloads.IEEE Micro,26(4),2006. [3]AMD.AMD family10h server and workstation processor
power and thermal data sheet,2010.
[4]S.Bell et al.Tile64processor:A64-core SoC with mesh
interconnect.In ISSCC,2008.
[5]A.Bhattacharjee and M.Martonosi.Thread criticality
predictors for dynamic performance,power,and resource
management in chip multiprocessors.In ISCA,2009.
[6]C.Bienia et al.The PARSEC benchmark suite:
Characterization and architectural implications.In PACT,
2008.
[7]R.Bitirgen et al.Coordinated management of multiple
interacting resources in chip multiprocessors:A machine
learning approach.In MICRO,2008.
[8]S.Borkar.Thousand core chips:a technology perspective.In
DAC,2007.
[9]D.Brooks et al.Wattch:a framework for architectural-level
power analysis and optimizations.In ISCA,2000.
[10]Q.Cai et al.Meeting points:using thread criticality to adapt
multicore hardware to parallel regions.In PACT,2008. [11]T.Calin et al.Built-in current sensor for IDDQ testing in
deep submicron CMOS.In VLSITS,1999.
[12]A.K.Coskun et al.Evaluating the impact of job scheduling
and power management on processor lifetime for chip
multiprocessors.In SIGMETRICS,2009.
[13]B.Curran et al.4GHz+low-latency?xed-point and binary
?oating-point execution units for the POWER6processor.In ISSCC,2006.
[14]D.Economou et al.Full-system power analysis and
modeling for server environments.In MOBS,2006.
[15]G.F.Franklin et al.Digital Control of Dynamic Systems,3rd
edition.Addition-Wesley,1997.
[16]E.Grochowski et al.Energy per instruction trends in intel
microprocessors.Technical report,Intel Microarchitecture
Research Lab,2006.
[17]J.Howard et al.A48-core IA-32message-passing processor
with DVFS in45nm CMOS.In ISSCC,2010.
[18]C.Isci et al.An analysis of ef?cient multi-core global power
management policies:Maximizing performance for a given
power budget.In MICRO,2006.
[19]C.Isci and M.Martonosi.Runtime power monitoring in
high-end processors:Methodology and empirical data.In
MICRO,2003.
[20]A.Kahng et al.Orion2.0:A fast and accurate noc power and
area model for early-stage design space exploration.In
DATE,2009.
[21]A.Kansal et al.Virtual machine power metering and
provisioning.In SoCC,2010.
[22]S.Kim et al.Fair cache sharing and partitioning in a chip
multiprocessor architecture.In PACT,2004.
[23]W.Kim et al.System level analysis of fast,per-core DVFS
using on-chip switching regulators.In HPCA,2008.
[24]C.Lefurgy et al.Server-level power control.In ICAC,2007.
[25]J.Li et al.The thrifty barrier:Energy-aware synchronization
in shared-memory multiprocessors.In HPCA,2004.
[26]C.Liu et al.Exploiting barriers to optimize power
consumption of CMPs.In IPDPS,2005.
[27]M.R.Marty and M.D.Hill.Virtual hierarchies to support
server consolidation.In ISCA,2007.[28]K.Meng et al.Multi-optimization power management for
chip multiprocessors.In PACT,2008.
[29]A.K.Mishra et al.CPM for CMPs:Coordinated power
management for chip-multiprocessors.In SC,2010.
[30]A.K.Mishra et al.Poster:Coordinated power management
of voltage islands in CMPs.In SIGMETRICS,2010. [31]D.B.Noonburg and J.P.Shen.Theoretical modeling of
superscalar processor performance.In MICRO,1994. [32]S.Oberman.Floating point division and square root
algorithms and implementation in the AMD-K7TM
microprocessor.In CA,1999.
[33]A.Phansalkar et al.Analysis of redundancy and application
balance in the SPEC CPU2006benchmark suite.SIGARCH Comput.Archit.News,35(2),2007.
[34]M.Powell et al.CAMP:A technique to estimate
per-structure power at run-time using a few simple
parameters.In HPCA,2009.
[35]R.Raghavendra et al.No Power Struggle:Coordinated
Multi-level Power Management for the Data Center.In
ASPLOS,2008.
[36]K.R.Rangan et al.Thread motion:Fine-grained power
management for multi-core systems.In ISCA,2009. [37]J.Renau et al.SESC simulator,2005.
https://www.doczj.com/doc/7e8827709.html,.
[38]M.Rich et al.Power and temperature control on a90-nm
Itanium family processor.IEEE Journal of Solid-State
Circuits,41(1),2006.
[39]J.Sartori and R.Kumar.Distributed peak power
management for many-core architectures.In DATE,2009. [40]K.Skadron et al.Temperature-aware microarchitecture:
Modeling and implementation.ACM Trans.Archit.Code
Optim.,1(1),2004.
[41]J.Tierno et al.A DPLL-based per core variable frequency
clock generator for an eight-core POWER7x2122
microprocessor.In VLSIC,2010.
[42]D.N.Truong et al.A167-processor computational platform
in65nm CMOS.IEEE Journal of Solid-State Circuits
(JSSC),44(4),2009.
[43]S.R.Vangal et al.An80-tile sub-100-w tera?ops processor
in65-nm CMOS.IEEE Solid-state circuits,43(1),2008. [44]X.Wang and M.Chen.Cluster-level feedback power control
for performance optimization.In HPCA,2008.
[45]Y.Wang,K.Ma,and X.Wang.Temperature-constrained
power control for chip multiprocessors with online model
estimation.In ISCA,2009.
[46]M.Ware et al.Architecting for power management:The
IBM POWER7approach.In HPCA,2010.
[47]J.A.Winter,D.H.Albonesi,and C.A.Shoemaker.Scalable
thread scheduling and global power management for
heterogeneous many-core architectures.In PACT,2010. [48]S.C.Woo et al.The SPLASH-2programs:characterization
and methodological considerations.In ISCA,1995.
[49]Y.Zhang et al.Hotleakage:A temperature-aware model of
subthreshold and gate leakage for architects.Technical
report,University of Virginia,2003.