Cognitive Science30(2006)725–731
Copyright ?2006Cognitive Science Society, Inc. All rights reserved.
Unsupervised Discovery of Nonlinear Structure
Using Contrastive Backpropagation
Geoffrey Hinton, Simon Osindero, Max Welling,Yee-Whye Teh
Department of Computer Science, University of Toronto
Received 1 September 2005; received in revised form 7 January 2006; accepted 12 January 2006
Abstract
We describe a way of modeling high-dimensional data vectors by using an unsupervised,nonlinear, multilayer neural network in which the activity of each neuron-like unit makes an additive contribution to a global energy score that indicates how surprised the network is by the data vector.The connection weights that determine how the activity of each unit depends on the activities in earlier layers are learned by minimizing the energy assigned to data vectors that are actually observed and maximizing the energy assigned to“confabulations”that are generated by perturbing an observed data vector in a direction that decreases its energy under the current model.
Keywords:Neural networks;Backpropagation; Unsupervised learning; Topographic maps; Distributed representations; Energy-based models
The backpropagation algorithm(Rumelhart,Hinton,&Williams,1986)trains the units in the intermediate layers of a feedforward neural net to represent features of the input vector that are useful for predicting the desired output.This is achieved by propagating information about the discrepancy between the actual output and the desired output backward through the net to compute how to change the connection weights in a direction that reduces the dis-crepancy.In this article we show how to use backpropagation to learn features and con-straints when each input vector is not accompanied by a supervision signal that specifies the desired output.
When no desired output is specified,it is not immediately obvious what the goal of learning should be.We assume here that the aim is to characterize the observed data in terms of many different features and constraints that can be interpreted as hidden factors.These hidden fac-tors could be used for subsequent decision making or they could be used to detect highly im-probable data vectors by using the global energy.We define the probability that the network as-Correspondence should be addressed to Geoffrey E.Hinton,Department of Computer Science,University of Toronto, 6 Kings College Road, Toronto, Canada M5S 3G4. E-mail:hinton@https://www.doczj.com/doc/5f6646592.html,
signs to a data vector,x ,by comparing its global energy,E (x ),with the energies of all possible data vectors,v :
Intuitively,a good unsupervised learning procedure should find hidden factors that assign high probability to patterns that typically occur.This can be achieved by lowering the energies of observed data vectors and raising the energies of “negative”data vectors—patterns that should be observed if the hidden factors constituted a good model of the data.By using the current model to generate a set of negative data vectors we can convert an unsupervised learning task into the supervised task of assigning low energies to the observed data vectors and high ener-gies to the negative data vectors.Notice,however,that the set of negative data vectors depends on the current model and it will change as the model learns.
The quality of the set of features and constraints discovered by the neural network can be quantified by the summed log probability that gets assigned to the observed data vectors.The contribution of a single data vector to this sum is:
The features and constraints can be improved by repeatedly adjusting the weights on the connections to maximize the log probability of the observed data.To perform gradient ascent in the log likelihood we would need to compute exact derivatives of the log probabilities:
where w ij is the weight on the connection from unit i in one layer to unit j in the next layer.The first term is easy to compute.We assume that each unit,j ,sums the weighted activities coming from units,i ,in the layer below to get its total input,z j =Σi y i w ij ,where an activity y i in the layer below is equal to x i if it is the input layer.A smooth nonlinear function of z j is then used to compute the unit’s activity,y j .The energy contributed by the unit can be any smooth function of its activity.In this article we use two layers of nonlinear hidden units and the energy is determined by the activities of units in the second hidden layer:
where y j is the activity of unit j in the second hidden layer and λj is a scale parameter that is also learned by contrastive backpropagation.This “heavy-tailed”energy contribution is good for modeling constraints that are usually satisfied fairly precisely and occasionally violated by a lot.In images of natural scenes,for example,a local,oriented edge filter will have an output of almost exactly zero almost everywhere.On the few occasions when its output departs from zero,however,it may be quite large,so the distribution of the violations is very non-Gaussian.
726G. E. Hinton, S.Osindero, M. Welling, Y. W.Teh/Cognitive Science 30(2006)
()()()(1)
E E e p e --=?x v v x ()
log ()()log (2)
E p E e -=--?v v x x log ()()()()(3)
ij ij ij ij p E E w p w w w ???D μ=-+????v x x v v 2()(1)
(4)
j j j E log y =+?x λ
By using the energy contributions in Equation 4we encourage the network to model the data distribution by finding constraints of this type (Hinton &Teh, 2001).
After performing a forward pass through the network to compute the activities of all the units,we do a backward pass as described in Rumelhart et al.(1986).The backward pass uses the chain rule to compute ?E (x )/?w ij for every connection weight,and by backpropagating all the way to the inputs we can also compute ?E (x )/?x i for each component,x i ,of the input vector.Unfortunately,the second term in Equation 3is much harder to deal with.It involves a weighted average of the derivatives from all conceivable data vectors so it cannot be computed efficiently except in special cases.We usually expect,however,that this average will be domi-nated by a very small fraction of the conceivable data vectors,so it seems reasonable to approx-imate this term by averaging ?E (x )/?w ij over a relatively small number of samples from the dis-tribution p (·).One way to generate samples from this distribution is to run a Markov chain that simulates a physical process with thermal noise.If we think of the dataspace as forming a hori-zontal plane and we represent the energy of each data vector as height,the neural network de-fines a potential energy surface with a height and gradient that are easy to compute.We imag-ine a particle on this surface that tends to move downhill but is also jittered by additional Gaussian noise.After enough steps,the particle will have lost all information about where it started and if we use small enough steps,its probability of being at any particular point in the dataspace will be given by the Boltzmann distribution in Equation 1.This is a painfully slow way of generating samples and even if the equilibrium distribution is reached,the variance cre-ated by sampling may mask the true learning signal.
Rather surprisingly,it is unnecessary to allow the simulated physical process to reach the equilibrium distribution.If we start the process at an observed data vector and just run it for a few steps,we can generate a “confabulation”that works very well for adjusting the weights (Hinton,2002).Intuitively,if the Markov chain starts to diverge from the data in a systematic way,we already have evidence that the model is imperfect and that it can be improved (in this local region of the dataspace)by reducing the energy of the initial data vector and raising the energy of the confabulation.It is theoretically possible that this learning procedure will cause the model to assign very low energies to unvisited regions of the dataspace that are far from any data vector.However,the fact that the learning works well on a variety of tasks suggests that this theoretical problem is insufficient grounds for rejecting the learning procedure,just as the existence of local minima was insufficient grounds for rejecting backpropagation.
The contrastive backpropagation learning procedure cycles through the observed data vec-tors adjusting each weight by:
where ηis a learning rate and x
is a confabulation produced by starting at x and noisily follow-ing the gradient of the energy surface for a few steps.1
To illustrate the learning procedure,we applied it to the task of discovering the nonlinear ki-nematic constraints in a simulated three-dimensional “arm”that has five rigid links and five ball joints.The first ball joint attaches the arm to the origin,and each data vector consists of the 15cartesian coordinates of the remaining link endpoints.This apparently 15-dimensional data G. E. Hinton, S.Osindero, M. Welling, Y. W.Teh/Cognitive Science 30(2006)727
?()()(5)
ij ij ij E E w w w ????÷?÷D =-+?÷?÷??è?x x η
really has only 10degrees of freedom because of the 5one-dimensional constraints imposed by the 5 rigid links. These constraints are of the form:
where i and i +1index neighboring joints and l i,i +1is the length of the link between them.Be-cause the constraints are highly nonlinear,linear dimensionality-reduction methods like prin-cipal components analysis or factor analysis are of little help.
We used a neural net with 15input units and two hidden layers.Each of the 15units in the first hidden layer computes a weighted sum of the inputs and then squares it.Each of the 5units in the top layer computes a weighted sum of the squares provided by the first hidden layer and adds a learned bias.It is clear that with the right weights and biases,each top-layer unit could implement one of the constraints represented by Equation 6by producing an output of exactly zero if and only if the constraint is satisfied.The question is whether the network can discover the appropriate weights and biases just by observing the data.
For this example,the units in the first hidden layer do not contribute to the energy and the units in the second hidden layer each contribute an energy of .This heavy-tailed energy function penalizes top-level units with nonzero outputs,but changing the output has lit-tle effect on the penalty if the output is already large.
Fig.1shows the weights and top-level biases that were learned by contrastive back-propagation.For each pair of neighboring joints,there are three units in the first hidden layer that have learned to compute differences between the coordinates of the two joints.These dif-ferences are always computed in three orthogonal directions.Each unit in the second hidden layer has learned a linear combination of the five constraints,but it uses weights of exactly the same size for the three squared differences in each constraint so that it can exactly cancel the fixed sum of these three squared differences by using its bias.
The same network can also learn the five constraints when a random 10%of the input vari-ables are missing from each data vector.The missing input variables are treated as additional parameters that are initialized at random values and are learned using a version of Equation 5in which w ij is replaced by x i .The random inputs mean that each instance of a constraint is only satisfied with a probability of .96=.53at the start of learning.However,the heavy-tailed en-ergy function means that strongly violated constraints only contribute a very small gradient,so the learning is driven by the accurately satisfied constraints.
We have also applied a similar neural network on the more challenging task of learning fea-tures that allow us to compactly describe the statistical structure within small patches of digi-tized images of natural scenes.For this task,we used the same layered architecture,activation functions,and energy functions as described previously,but this time in a net with 256units in the input layer and 400units in each of the two hidden layers.We also arranged the units within each hidden layer on a 20×20square grid,and topographically restricted the connectivity so that each unit in the first hidden layer could only send connections to the unit at the same grid position in the second hidden layer and to this unit’s 24 nearest neighbors.2
Fig.2illustrates some of the features learned in such a model.The first-layer units have self-organized to form a representation of the image patches in terms of a set of oriented,band-pass features.These features bear a striking resemblance to the receptive fields of simple
728G. E. Hinton, S.Osindero, M. Welling, Y. W.Teh/Cognitive Science 30(2006)
22221111()()()0(6)i i i i i i i i x x y y z z l +++,+-+-+--=2log(1)j j y +λ
cells found in the primary visual cortex of most mammals and are also similar to the features learned in other models that seek to capture statistical structure in natural images (Bell &Sejnowski,1997;Olshausen &Field,1996).The second-layer units display similar response preferences for orientation and spatial frequency,but appear to be somewhat insensitive to the spatial phase present in the input.As a result of the restricted connectivity between the two hid-den layers,the features form a topographic map with local continuity in spatial location,orien-tation, and spatial frequency.
The contrastive backpropagation learning procedure is quite flexible.It puts no constraints other than smoothness on the activation functions or the functions for converting activations into energy contributions.For example,the procedure can easily be modified to use recurrent neural networks that receive time-varying inputs such as video sequences.The energy of a whole sequence is simply defined to be some function of the time history of the activations of the hidden units.Backpropagation through time (Werbos,1990)can then be used to obtain the derivatives of the energy with respect to the connection weights and also the energy gradients required for generating a whole confabulated sequence.
G. E. Hinton, S.Osindero, M. Welling, Y. W.Teh/Cognitive Science 30(2006)
729
Fig.1.The areas of the small black and white rectangles represent the magnitudes of the negative and positive weights learned by the network.Each column in the lower block represents the weights on the connections to a unit in the first hidden layer from the joint coordinates x 1,y 1,z 1,x 2,y 2,z 2…x 5,y 5,z 5.For example,the first,second,and seventh columns show the weights of three hidden units that compute the squared distances between the last two joints in three orthogonal directions.Each row in the higher block represents the weights on connections from units in the first hidden layer to a unit in the second hidden layer.For example,the first,second,and seventh units in the first hidden layer have equal negative weights to the unit represented by the third row in the higher block.The weights started with very small random values and were learned by 3,300passes through a training set of 800ran-dom arm configurations in which every link was of length 1.The weights were updated after every 100training cases.To eliminate unnecessary weights,a decay toward zero of 0.0002was added to the weight change,?w ij speci-fied by Equation 5before multiplying by the learning rate for that connection,ηij ,which started at 0.0001.ηij in-creased by 1%if ?w ij agreed in sign with its previous value and decreased by 5%if it disagreed.To further speed learning without causing divergent oscillations,each weight update included 0.9times the previous weight update.
Notes
1.We used a simplified version of the hybrid Monte Carlo procedure in which the particle
is given a random initial momentum and its deterministic trajectory along the energy surface is then simulated for a number of time steps (20for the example in Fig.1and 10for Fig.2).If this simulation has no numerical errors the increase,?E ,in the combined potential and kinetic energy will be zero.If ?E is positive,the particle is returned to its initial position with a probability of 1–exp (–?E ).The step size is slowly adapted so that only about 10%of the trajectories get rejected.Numerical errors up to second order are eliminated by using a leapfrog method (Neal,1996)that uses the potential energy gradi-ent at time t to compute the velocity increment between time t –?and t +?and uses the velocity at time t + ? to compute the position increment between time t and t + 1.
2.The original data for this model were vectors representing the pixel intensities in 20×
20patches extracted from photographs of natural scenes (van Hateren &van der Schaaf,1998).These vectors then underwent standard and biologically motivated pre-processing (Olshausen &Field,1996;van Hateren &van der Schaaf,1998)that in-volved subtracting the mean value from each pixel and then taking the variance normal-ized projection onto the leading 256eigenvectors of the pixel covariance matrix.
730G. E. Hinton, S.Osindero, M. Welling, Y. W.Teh/Cognitive Science 30
(2006)
Fig.2.Each small square depicts the basis function associated with the unit at the corresponding grid position within the first layer of spatially ordered units.The image within each small square indicates the contribution to the represented image that each unit would have,were its activity level set to 1.The basis functions are obtained by tak-ing the pseudo-inverse of the bottom-up weight matrix,and we show these rather than the weights themselves be-cause they provide greater clarity within a small figure.
G. E. Hinton, S.Osindero, M. Welling, Y. W.Teh/Cognitive Science30(2006)731
Topographic maps can also be learned by using a similar architecture and energy func-tion,but replacing contrastive backpropagation with a stochastic sampling procedure (Osindero,Welling,&Hinton,2006).It is harder,however,to extend the stochastic sampling approach to work with more hidden layers,whereas this extension is trivial with contrastive backpropagation.Other methods of learning topographic maps from natural image patches(Hyvarinen&Hoyer,2001)are also hard to extend to more hid-den layers.
Acknowledgments
We would like to thank David MacKay,Radford Neal,Sam Roweis,Zoubin Ghahramani, Chris Williams,Carl Rasmussen,Brian Sallans,Javier Movellan,and Tim Marks for helpful discussions and two anonymous referees for improving the article.This research was sup-ported by the Gatsby Charitable foundation,NSERC, CFI, and CIAR.
References
Bell,A.J.,&Sejnowski,T.J.(1997).The“independent components”of natural scenes are edge filters.Vision Re-search, 37,3327–3338.
Hinton,G.E.(2002).Training products of experts by minimizing contrastive divergence.Neural Computation,14, 1771–1800.
Hinton,G.E.,&Teh,Y.W.(2001).Discovering multiple constraints that are frequently approximately satisfied.In Proceedings of the Seventeenth Conference on Uncertainty in Artificial Intelligence(UAI-2001)(pp.227–234).
San Francisco: Morgan Kaufmann.
Hyvarinen,A.,&Hoyer,P.O.(2001).A two-layer sparse coding model learns simple and complex cell receptive fields and topography from natural images.Vision Research, 41,2413–2423.
Neal,R.M.(1996).Bayesian learning for neural networks(Lecture Notes in Statistics No.118).New York: Springer.
Olshausen,B.A.,&Field,D.J.(1996).Emergence of simple-cell receptive field properties by learning a sparse code for natural images.Nature,381,607–609.
Osindero,S.,Welling,M.,&Hinton,G.E.(2006).Topographic product models applied to natural scene statistics.
Neural Computation,18,381–414.
Rumelhart,D.E.,Hinton,G.E.,&Williams,R.J.(1986).Learning representations by back-propagating errors.Na-ture, 323,533–536.
van Hateren,J.H.,&van der Schaaf,A.(1998).Independent component filters of natural images compared with simple cells in primary visual cortex.Proceedings of the Royal Society of London B:Biological Sciences,265, 359–366.
Werbos,P.J.(1990).Backpropagation through time:What it does and how to do it.Proceedings of the IEEE,78, 1550–1560.
TEMS DISCOVERY DISCOVERY的几大功能: 一:数据展示(地理化窗口/layer 3/图形化显示)都是在project中可以直接打开显示的。二:出报告 三:地理化的差值分析/平均分析 Discovery和TI导入数据的想法不一样,TI是用logfile进行导入后分析,discovery是通过PROJECT形式导入各种数据(.cel/map/log这些数据是基于project) 第一步:新建一个project:点击project explorer---new
上图中我们需要给project定义一个project name。然后SAVE一下。(再导入cell/map之前GIS/CELL CONFIGATION是空的,导入之后这里会有相应的显示) UDR:uers defined region(用户自定义区域) 第二步: 导入数据 路测数据 地理化数据
小区数据 天线数据(天线的主瓣旁瓣) 覆盖图(planning tools导出来的)
在导入.cel(小区数据) 文件时的选项:要定义小区数据是属于哪一个project(define target project),然后Browse小区数据。 导入过程中,我们会在TASK WINDOW中看到相应的project/.cel导入信息。 导入好小区数据之后我们会在project Explorer中看到我们新建的project (20100801)中会出现Composite(组合)/datasets(数据组),现在这里还是空的,然后我们右键project(比如:20100801)—view/edit properties会看到我们cell configuration已经存在CELL文件了。 ,
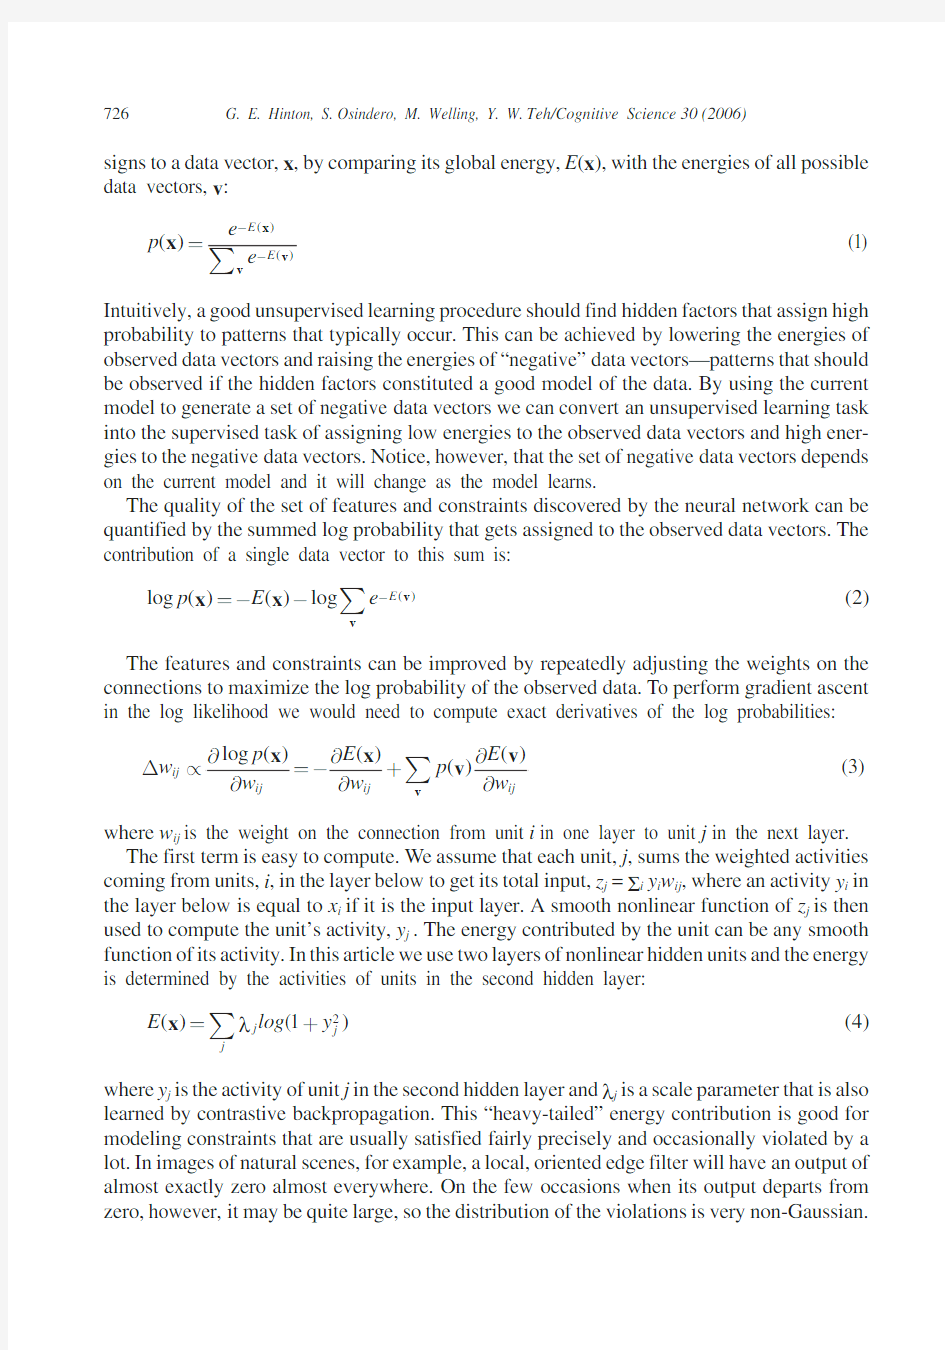
Deep Learning for Human Part Discovery in Images Gabriel L.Oliveira,Abhinav Valada,Claas Bollen,Wolfram Burgard and Thomas Brox Abstract—This paper addresses the problem of human body part segmentation in conventional RGB images,which has several applications in robotics,such as learning from demon-stration and human-robot handovers.The proposed solution is based on Convolutional Neural Networks(CNNs).We present a network architecture that assigns each pixel to one of a prede?ned set of human body part classes,such as head, torso,arms,legs.After initializing weights with a very deep convolutional network for image classi?cation,the network can be trained end-to-end and yields precise class predictions at the original input resolution.Our architecture particularly improves on over-?tting issues in the up-convolutional part of the network.Relying only on RGB rather than RGB-D images also allows us to apply the approach outdoors.The network achieves state-of-the-art performance on the PASCAL Parts dataset.Moreover,we introduce two new part segmentation datasets,the Freiburg sitting people dataset and the Freiburg people in disaster dataset.We also present results obtained with a ground robot and an unmanned aerial vehicle. I.INTRODUCTION Convolutional Neural Networks(CNNs)have recently achieved unprecedented results in multiple visual perception tasks,such as image classi?cation[14],[24]and object detection[7],[8].CNNs have the ability to learn effective hierarchical feature representations that characterize the typical variations observed in visual data,which makes them very well-suited for all visual classi?cation tasks.Feature descriptors extracted from CNNs can be transferred also to related tasks.The features are generic and work well even with simple classi?ers[25]. In this paper,we are not just interested in predicting a single class label per image,but in predicting a high-resolution semantic segmentation output,as shown in Fig.1. Straightforward pixel-wise classi?cation is suboptimal for two reasons:?rst,it runs in a dilemma between localization accuracy and using large receptive?elds.Second,standard implementations of pixel-wise classi?cation are inef?cient computationally.Therefore,we build upon very recent work on so-called up-convolutional networks[4],[16].In contrast to usual classi?cation CNNs,which contract the high-resolution input to a low-resolution output,these networks can take an abstract,low-resolution input and predict a high-resolution output,such as a full-size image[4].In Long et al.[16], an up-convolutional network was attached to a classi?cation network,which resolves the above-mentioned dilemma:the contractive network part includes large receptive?elds,while the up-convolutional part provides high localization accuracy. All authors are with the Department of Computer Science at the University of Freiburg,79110Freiburg,Germany.This work has partly been supported by the European Commission under ERC-StG-PE7-279401-VideoLearn, ERC-AG-PE7-267686-LIFENA V,and FP7-610603-EUROPA2. (a)PASCAL Parts(b)MS COCO (c)Freiburg Sitting People(d)Freiburg People in Disaster Fig.1:Input image(left)and the corresponding mask(right) predicted by our network on various standard datasets. In this paper,we technically re?ne the architecture of Long et al.and apply it to human body part segmentation,where we focus especially on the usability in a robotics context.Apart from architectural changes,we identify data augmentation strategies that substantially increase performance. For robotics,human body part segmentation can be a very valuable tool,especially when it can be applied both indoors and outdoors.For persons who cannot move their upper body, some of the most basic actions such as drinking water is rendered impossible without assistance.Robots could identify human body parts,such as hands,and interact with them to perform some of these tasks.Other applications such as learning from demonstration and human robot handovers can also bene?t from accurate human part segmentation.For a learning-from-demonstration task,one could take advantage of the high level description of human parts.Each part could be used as an explicit mapping between the human and joints of the robot for learning control actions.Tasks such as human-robot handovers could also bene?t.A robot that needs to hand a tool to its human counterpart must be able to detect where the hands are to perform the task. Human body part segmentation has been considered a very challenging task in computer vision due to the wide variability of the body parts’appearance.There is large variation due to pose and viewpoint,self-occlusion,and clothing.Good results have been achieved in the past in conjunction with depth sensors[22].We show that CNNs can handle this variation very well even with regular RGB cameras,which can be used also outdoors.The proposed network architecture yields correct body part labels and also localizes them precisely. We outperform the baseline by Long et al.[16]by a large
中国电视纪录片发展现状研究 本文的目的在于研究中国电视纪录片发展现状。新中国成立以来电视纪录片的的发展经历了四个阶段新闻纪录、专题纪录、创新纪录、媒 介融合。从研究历史出发通过对当下纪录片生态环境、市场化问题、 话语权三大问题的现状分析归纳出体制内外纪录片发展中共同面临 的问题。世纪在新的传播环境和传播语境下中国当下的电视纪录片依 托传播学的理念从自身改造突破问题寻找出路。关键词电视纪录片市场化问题话语权传播过程引言引言研究缘起在年第届奥斯卡金像奖 提名名单中华人女导演杨紫烨凭借执导的环保题材纪录短片《仇岗卫士》成功入围最佳纪录短片提名。杨紫烨接受采访时说“现在是中国纪录片最好的时代。与“最好时代”不相称的是纪录片现状的尴尬局面翻阅电视报几乎找不到它的身影即使找到了也被安排在午夜等非黄 金时段相亲节目选秀节目竟猜节目……充斥于荧屏成为了老百姓茶 余饭后的谈资。与二十世纪九十年代的辉煌相比电视纪录片节目渐渐 冷清甚至已淡出人们的视线。纪录片遇到了怎样的困境把电视台的资源拱手让于其他节目电视纪录片在中国为何会有此境遇它的出路又 在哪里这就是笔者写作的缘起也是重点研究的问题。纪录得益于电 影。年月日法国卢米埃尔兄弟开创了电影的先河,工厂大门》、火车到站》、《婴儿进餐》等影片的公开收费放映使得电影真正走入了人类世 界展示出独有的光影魅力。这些影片就像一幅幅活动的相片带有很大程度的纪实性质。而就在年电影很快登陆中国。上海、北京、香港、
台湾陆续出现电影但放映的都是外国人的影片。直到年北京丰泰照相馆的老板任庆泰以著名京剧艺术家谭鑫培作为拍摄对象拍下了他表 演定军山》的几个片断观众反响热烈。这预示了中国纪录片的萌芽。 而国际上公认的第一部纪录电影是罗伯特?弗拉哈迪在年拍摄的北方的纳努克》这也是他的第一部电影。直到今天这部电影仍然充满着无穷的魔力被热爱纪录片的专家学者作为研究欣赏图本。原因就在于他开创了纪录片的拍摄手法。纪录片依托电影发展壮大在电影和电视界闯下了一番天地被全世界人民所认同。从年电视发明以后人们就可以足不出户了解世界新闻、博览社会百态。影视合流成了趋势。电视 纪录片应电视技术的成熟、媒体力量的聚合诞生了。美国国家地理频道、探索频道依托纪录片而崛起、发展英国的日本的在世界上在纪录片的专属领域中享有美誉。中国的电视杨紫烨现在是中国纪录片最好时代新浪网? 引言纪录片发从年起步至今已走过了五十三年的历史 现状又是如何呢研究的目的和意义选择中国电视纪录片的现状作为 论文的研究对象其目的和意义在于第一新千年已进入第十一个年头 科学技术日新月异中国电视纪录片自身在承载内容和外在形式上都 表现出个性化、丰富化的特点通过回顾半个世纪的电视纪录史分析出每个时期电视纪录片的共性站在历史的肩头才能更好的审视现在展 望未来。第二电视生态环境与纪录片发展息息相关在市场经济时代纪 录片面临着哪些问题又该如何把握自己的话语权这些问题的探讨是 纪录片现状生存必须面对的课题。第三电视纪录片是一个复杂动态的
用STM32F4-Discovery套件自带调试器烧录STM32芯片 碧云天书 STM32F4-Discovery自带了SWD调试连接器,可以用来调试和烧录STM32芯片和开发板。一般STM32开发板上的调试接口为20脚的JTAG接口,而STM32F4-Discovery板载的SWD调试连接器为6教SWD接口,可以用一条20脚转6脚的连接线将SWD调试器连接到开发板的JTAG接口上。 一、硬件连接 下图是JLink接口的SWD端口配置图,可以作为连接参考。引脚编号为简易牛角座顶视图对应的编号。红线标识的引脚对应着ST-LINK/V2调试连接器CN2的6个引脚。 表1STM32F4-Discovery自带的ST-LINK/V2调试连接器CN2引脚定义(SWD) 引脚CN2说明 1VDD_TARGET来自应用的VDD 2SWCLK SWD时钟 3GND地线 4SWDIO SWD数据输入/输出 5NRST目标MCU的复位 6SWO保留(TRACESWO,连接目标MCU的PB3,可以不接) 由于使用ST-LINK/V2上的NRST就得断开SB11锡桥,因此不使用NRST线。需要连接剩下的5根线,分别是VCC,SWDIO,SWCLK,SWO,GND。其中SWO也可以不接,这样就只需要连4条线。下面的表2总结了连线方式。 表2连接STM32F4-Discovery自带的ST-LINK/V2调试连接器到开发板JTAG接口的连线 VDD SWCLK GND SWDIO SWO(可省略) 12346 ST-LINK/V2 (CN2) JTAG接口194713
连接线实物 使用STM32F4-Discovery自带的ST-LINK/V2调试连接器时,需要把CN3上的跳线拔掉,这时板载的ST-LINK/V2处于调试外部开发板状态。如下图:
Discovery纽约时代广场探索博物馆EB-5项目 项目概况 探索频道(Discovery Channel)于1985年在美国创立,探索频道目前覆盖全球 超过160个国家、4亿5千万个家庭,探索公司同时也是美国的上市公司,是美国最大的主流媒体之一。 Discovery博物馆(mDiscovery Times Square)成立于2009年,是探索频道(Discovery)的官方合作伙伴,为纽约市的前五大的博物馆。地处于时代广场核心的44街与第七第八大道中间,过去成功展出:泰坦尼克号、哈利波特、法老王和兵马俑等世界知名展览,已接待超过数百万人次的游客。继成功推出纽约时代广场第一期娱乐项目“百老汇4D剧院”项目(进展顺利,投资者均取得I-526移民申请通过)后,曼哈顿区域中心(MRC)又重磅推出位于纽约时代广场的第二期娱乐项目Discovery博物馆——探索纽约项目,该项目与第一期4D剧院项目仅隔一街距离。
项目特点 独一无二的地理优势 纽约时代广场在2013年迎接了5340万次游客,游客总消费超过了400亿美金,旅游消费预计将会在未来4年每年以8.5%的速度增长。 良好的发展前景——纽约市的旅游统计表
足够的就业机会创造 依照Michael Evans所做出的就业人数计算(即RIMS Ⅱ计算方式,该计算方法为美国移民局比较推荐的就业机会计算方式),该项目预计产生593个新的就业机会。远远超过EB-5所需的240个就业机会空间高达60%。 银行专户还款 Discovery博物馆参观门票预计价格为22美元,娱乐产业一直以来都是现金流十分可观的产业,依照与其他时代广场相似项目比较并且保守评估推算,每年项目净利润预计高达一千万美元以上,项目承诺在营运方面将保留60%的现金存放至还款账户中,专款专户作为未来贷款五年还款准备。 资金结构
DAVID使用说明文档 一、DAVID简介 DA VID (the Database for Annotation,Visualization and Integrated Discovery)的网址是https://www.doczj.com/doc/5f6646592.html,/。DA VID是一个生物信息数据库,整合了生物学数据和分析工具,为大规模的基因或蛋白列表(成百上千个基因ID或者蛋白ID列表)提供系统综合的生物功能注释信息,帮助用户从中提取生物学信息。 DA VID这个工具在2003年发布,目前版本是v6.7。和其他类似的分析工具,如GoMiner,GOstat等一样,都是将输入列表中的基因关联到生物学注释上,进而从统计的层面,在数千个关联的注释中,找出最显著富集的生物学注释。最主要是功能注释和信息链接。 二、分析工具: DAVID需要用户提供感兴趣的基因列表,在基因背景下,使用提供的分析工具,提取该列表中含有的生物信息。这里说的基因列表和背景文件的选取对结果至关重要。 1.基因列表:这个基因列表可能是上游的生物信息分析产生的基因ID列表。对于富集分析而言,一般情况下,大量的基因组成的列 表有更高的统计意义,对富集程度高的特殊Terms有更高的敏感度。富集分析产生的p-value在相同或者数量相同的基因列表中具有可比性。 DAVID对于基因列表的格式要求为每行一个基因ID或者是基因ID用逗号分隔开。基因列表的质量会直接影响到分析结果。这里定性给出好的基因列表应该具有的特点,一个好的基因列表至少要满足以下的大部分的要求: (1)包含与研究目的相关的大部分重要的基因(如标识基因)。
教你DIY中文增强版Geexbox Geexbox是一款可以从光盘上直接启动的Linux多媒体操作系统【当然也可以从硬盘和USB闪存上启动】,它是基于Linux和MPlayer进行开发应用的,它可以让你不用进windows 就可以欣赏大片。它几乎支持大部分主流媒体格式,包括AVI、RM、RMVB、MPEG-4、MP3及外挂中文字幕,可以让旧电脑变成强悍的媒体中心。可惜官方提供的只有英文的ISO 镜像,因此网上也出现了不少网友定制的中文版。他们是怎么做的呢?其实很简单。利用官方提供的GeeXboX ISO Generator,你也可以轻松DIY属于自己的Geexbox中文增强版。还犹豫什么呢?下面就和笔者一起来体会DIY的乐趣。 一、GeeXboX ISO Generator初上手 “工欲善其事,必先利其器”,首先,请你到Geexbox的官方网站 (https://www.doczj.com/doc/5f6646592.html,/en/downloads.html)下载最新的GeeXboX ISO Generator。然后将下载到的geexbox-generator-1.0.i386.tar.gz用Winrar解压到硬盘中(本文以“D:\geexbox”为例进行说明)。进入解压目录,双击generator.exe运行软件(这个镜像生成器还包括在Linux和Macosx下使用的程序)。进入程序界面,你可以看到八个标签页,它们分别是:界面设置(Interface)、音频设置(Audio)、视频设置(Video)、遥控设置(Remote control)、网络设置(Network)、服务设置(Services)、液晶显示设置(Lcd display)、套件设置(Packages)。 接下来,请你单击“Packages“,进入套件设置项。这里列出的都是一些非常有用却没有包含在压缩包中的解码器(Codecs)、固件(Filmwares)、字体(Fonts)和主题(Themes)。建议你选中所有的解码器、固件、主题以及字体——“Chinese Simplified-GB2312”,然后点击”DownlOad”按钮下载。好啦,沏杯热茶慢慢等,Generator自己会通过网络把相应的文件下载到本地硬盘中。(如图1)心急的朋友如果受不了牛速,你也可以直接进入官方ftp下载所需资源: ⑴.解码器:https://www.doczj.com/doc/5f6646592.html,/codecs/ 将下得的压缩包解压至 D:\geexbox\iso\GEEXBOX\codec\即可。 ⑵.固件:https://www.doczj.com/doc/5f6646592.html,/firmwares/ 将下得的压缩包解压至 D:\geexbox\iso\GEEXBOX\firmwares\即可。 ⑶.字体:https://www.doczj.com/doc/5f6646592.html,/fonts/ 将下得的压缩包解压至 D:\geexbox\i18n\fonts\即可。
discovery软件在测井资料标准化中的应用 趋势而分析方法是依据物质的某一物理参数的测量值来研究幷空间分布特点及变化规律的方法。任何汕出实际地质参数在横向上差不多上具有某种规律性渐变,即可看作是趋势面变化。趋势而分析的差不多思路确实是对标准层的测井响应多项式趋势面作图,并认为与地层原始趋势而具有一致性。若趋势面分析的残差图仅为随机变量,则是测井刻度误差造成的,若存在一组专门残差值,则认为是岩性变化导致的0 1981年J H Doveton和E?Bomcman 进一步用趋势而分析来描述这一标准化过程,1991年石汕大学熊绮华教授在进行牛庄洼陷万全汕田油藏描述研究过程中采纳该方法对测井曲线进行标准化。 Discovery软件是应用较为广泛的油藏描述软件,该软件在用趋势面分析方法进行测井 曲线标准化方而具有操作简单、图形化输出及运算等特点,使得测井曲线标准化变得专门方便。 1 Discovery软件的趋势面分析方法 1.1趋势面分析方法的数学原理 若趋势而分析的残差图仅为随机变量,则是测井刻度误差造成的,若存在一组专门残差值,则认为是岩性变化导致的。它的数学方法概述如下: 设用z(x,y)表示所研究的地质特点,其中(x,y)是平面上点的坐标.则趋势值和剩余值用下式表示: z(x,y)= Z (x,y)+e 其中:2(xj)为趋势值,C为剩余值。 关于已知的数据:z,x\yiJH2 No 通常用回来分析求出趋势值和剩余值,即依照已知的数据求出回来方程f(x?y),使得: N 2 =乞忆一/(兀,片)] r-l 达到最小。实际上这确实是最小二乘意义下的曲面拟合咨询题,即依据运算值z(xj)用回来分析方法求出一个回来而: 对应于回来而上的值Z = 为趋势值,残差z,.名为剩余值。
探索频道(Discovery Channel)是由探索传播公司(Discovery Communications, Inc./DCI;NASDAQ:DISCA,旗下拥有197多家全球性电视网,包括Discovery探索频道、动物星球频道、Discovery科学频道和Discovery高清视界频道等)于1985年创立的,总部位于美国马里兰州蒙哥马利县银泉市。探索频道主要播放流行科学、科技、历史、考古及自然纪录片。 探索频道自1985年在美国启播后、现今已成为世界上发展最迅速的有线电视网络之一、覆盖面遍及全国百分之九十九的有线电视订户、在全球145个国家和地区有超过14400万个家庭订户。探索频道是全球最大的纪录片制作及买家、它吸引全球最优秀的纪录片制作人、所以探索频道的节目均被认为是世界上最优秀的纪实娱乐节目。也是世界上发行最广的电视品牌,目前到达全球160多个国家和地区的30600多万家庭,以35种不同语言播出节目。 探索频道在世界主要国家地区均有落地,但探索频道会因应不同地区设立不同版本,加上字幕或配音。美国版本主要播放写实电视节目,如著名的流言终结者系列。亚洲探索频道除着重播放写实节目之外,也播放文化节目,如介绍中国、日本文化的一系列节目。 亚洲探索频道于1994年成立,总部在新加坡,为美国Discovery传播公司(DCI)的全资附属机构,提供二十四小时精彩的纪实娱乐节目。据2005年泛亚媒体调查(PAX)的结果显示,探索频道在富裕成人中连续9年被公认为亚洲地区收视人口最多的有线及卫星电视频道。在新加坡举办的2004年“亚洲电视大奖”评选中,探索频道还荣膺“年度最佳有线及卫星电视频道”。 中国国际电视总公司(中央电视台全额投资的大型国有独资公司,成立于1984年,是中国内地规模最大、赢利能力最强的传媒公司)境外卫星代理部接收探索频道信号,通过亚太6号卫星(东经134度)发射KU波段信号。该服务一般只提供给三星级或以上的涉外宾馆酒店,外国人居住区,领事馆及大使馆。中国大陆各省市的地方电视台会转播或播放探索频道制作的节目。同时,还与浙江华数集团成立合资公司,向由杭州电视台开办的四个面向全国播出的高清付费电视频道(求索纪录、求索生活、求索科学、求索动物)提供绝大多数的节目内容。
微波合成仪标准操作手册 一、操作流程 1、例行检查:仪器开机前,首先检查仪器整体是否正常;反应腔及内衬溢出杯是否清洁;检查自 动压控装置APD是否清洁;自动进样器是否在正常位置;仪器电源线、数据线、气体管路连接情况是否正常。经检查一切正常方可开机。如内衬、APD不清洁或其它问题未经处理而运行仪器所造成的损害,属于非正常操作范畴。 2、开机顺序:先打开计算机电源,再打开Discover主机电源,然后运行Synergy软件(在计算机 桌面上)。最后打开空压机电源。 3、登记制度:检查、开机均正常,请认真按规定填写仪器使用记录,记录信息不全将承担后续使 用问题的责任。检查、开机、运行过程中,发现任何问题请及时联系管理员。 4、启动软件:运行Synergy软件,选择用户名并输入密码,进入软件操作界面后,可从屏幕右下 方工具栏察看Discover和Explorer的联机情况。 5、放入样品:按要求装配好微波反应管(详见第六部分),放入仪器衰减器。 6、选择方法:打开软件界面中相应用户的“M ethod”文件夹图标,选择所需方法,单击鼠标左键拖 拽到相应样品位置,如有需要,可新建方法或对方法进行修改(详见第四部分) 7、运行前检查:检查衰减器是否处于锁定状态;察看屏幕右侧温度、压力的显示是否正常。 8、运行方法:点击软件界面上部工具栏中的“P lay”按钮,仪器自动运行。 二、禁止的操作项 1、严禁频繁开关机;开机后1min内关机;关机后1min内开机。 2、严禁修改电脑系统设置如注册表项等内容。 3、严禁使用破损的、有裂痕的、划痕严重的反应瓶。 4、严禁使用变形的样品盖。 5、反应瓶盖必须严格按要求装配,禁止未经过检查就放置于自动进样器架上。 6、严禁将标签纸粘贴在反应瓶的任何部位。 7、严禁将文献中多模微波仪器(特别是家用微波炉)的反应条件直接用于该仪器。 8、严禁长时间无人值守,仪器运行过程中,必须每2小时进行巡视查看,并做好检查记录。 9、微波程序运行过程中,严禁非仪器管理员在线修改反应参数。 10、仪器登陆用户只有管理员的权限可以设置为“Admin”其他均设置为“User”。 11、仪器各登陆用户的参数设置应符合仪器要求(详见第三部分),禁止修改。
扫描工具SuperScan使用教程(如何使用SuperScan) SuperScan 是由Foundstone开发的一款免费的,但功能十分强大的工具,与许多同类工具比较,它既是一款黑客工具,又是一款网络安全工具。一名黑客可以利用它的拒绝服务攻击(DoS,denial of service)来收集远程网络主机信息。而做为安全工具,SuperScan能够帮助你发现你网络中的弱点。下面我将为你介绍从哪里得到这款软件并告诉你如何使用它。 如何获得SuperScan SuperScan4.0是免费的,并且你可以在如下地址下载: https://www.doczj.com/doc/5f6646592.html,:81/up/soft3_2010/SuperScan.rar 因为SuperScan有可能引起网络包溢出,所以Foundstone站点声明某些杀毒软件可能识别SuperScan是一款拒绝服务攻击(Dos)的代理。 SuperScan4.0只能在Windows XP或者Windows 2000上运行。对一些老版本的操作系统,你必须下载SuperScan3.0版。 SuperScan的使用 给SuperScan解压后,双击SuperScan4.exe,开始使用。打开主界面,默认为扫描(Scan)菜单,允许你输入一个或多个主机名或IP范围。你也可以选文件下的输入地址列表。输入主机名或IP范围后开始扫描,点Play button,SuperScan开始扫描地址,如下图A。
图A:SuperScan允许你输入要扫描的IP范围。 扫描进程结束后,SuperScan将提供一个主机列表,关于每台扫描过的主机被发现的开放端口信息。SuperScan还有选择以HTML格式显示信息的功能。如图B。
1、美国探索教育视频资源服务平台 平台内容及意义 大众文化的流行,娱乐学习一体化的浪潮席卷全球。同时随着社会发展,多学科交叉融合,使得社会对大学生综合能力要求颇高。在某一个方面出类拔萃的复合型人才,越来越受到企业社会的青睐。综合性人才在当今社会炙手可热,因此学校在重视专业课的同时,加强对课外知识的普及符合当今教育时代的发展需求。 美国探索教育视频资源服务平台坚持以“科教兴国”为总方略,以提高在校师生综合素质、开拓师生眼界为宗旨;以教育、科学、文化、历史、探险等为题材的多学科交叉融合的教育视频资源服务平台。平台始终坚持科学研究与教学理论相统一,历史知识和文化教育相结合,以求达到师生即使足不出户,亦能知大千世界之神奇、能知世界各地前沿性科学技术,能解世间万物之疑惑。此平台已经成为西安数图网络科技有限公司一个独具特色的教育资源服务平台。 平台特色 美国探索教育视频资源服务平台,结合高校科学教育及科普知识所需,精选整合美国探索频道(Discovery)和美国国家地理频道(National Geography)两大世界知名频道近年来的最新节目,精心制作而成。 1、美国探索频道(Discovery) 1985年开播 使用客户在全球达到160多个国家,3亿零6百多万家庭。 通过15颗卫星用36种语言、24小时播放来源于全球不同地方摄制的精彩高品质纪实节目 2、美国国家地理频道(National Geography) 遍布全球达171个国家及地区 通过48种语言收看 荣获1次奥斯卡金像奖和2次金像奖提名,129座艾美奖 平台分类 自然科学,历史人文,科学发现,生命科学,旅游风光,体育探索,军事侦探,交通机械,工程建筑
第一章:前言 (1) 第二章:微机油藏描述系统集成 (3) 一、Landmark公司微机油藏描述系统发展历程 (3) 二、微机油藏描述系统各模块集成 (4) (一)工区、数据管理系统 (二)GESXplorer地质分析与制图系统 (三)SeisVision 2D/3D二维三维地震解释系统 (四)PRIZM 测井多井解释系统 (五)ZoneManager层管理与预测 (六)GMAPlus正演建模 三、Discovery微机油藏描述系统软件特色 (12) 第三章:微机三维地震解释系统软件应用方案研究 (13) 一、工区建立 (13) (一)工区目录建立 (二)一般工区建立 (三)工区管理 二、数据输入 (20) (一)地质数据输入 1 井头数据输入 2 井斜数据输入 3 分层数据输入 4 试油数据输入 5 生产数据加载 6 速度数据输入 (二)测井数据输入 1 ASCII格式测井数据输入 2 LAS格式测井数据输入 (三)地震数据输入 1 SEG-Y三维地震数据输入 2 层位数据输入 3 断层数据输入
三、微机地质应用 (31) (一)微机地质应用工作流程工作流程 1 地质分析工作流程 2 沉积相分析工作流程 (二)微机地质应用 1 井位图建立 2 等值线图(isomap)建立 3 各种剖面图(Xsection)建立 4 生产现状图制作 5 沉积相图制作 四、微机三维地震解释综合应用 (48) (一)微机三维地震解释工作流程 1 合成记录及层位工作流程 2 地震解释工作流程 3 速度分析工作流程 (二)微机三维地震解释综合应用 1 地震迭后处理-相干体 2 合成记录制作及层位标定 3 层位和断层建立、解释 4 三维可视化 5 速度分析与时深转换 6 构造成图 7 地震测网图建立 8 地震属性提取 五、微机单井测井解释及多井评价 (104) (一)微机单井测井解释及多井评价工作流程 1 测井曲线环境校正与标准化工作流程 2 测井分析流程 (二)微机单井测井解释及多井评价 1 打开测井曲线 2 测井曲线显示模板制作 3.测井曲线显示、编辑与预处理 4.交会图制作与分析 5 测井解释模型建立与解释 6 测井解释成果报告
BBC一百多部记录片 BBC.生物记录片.细胞 https://www.doczj.com/doc/5f6646592.html,/cszGSiqUkU9cr(访问密码:e215)自然风光喜马拉雅山脉 https://www.doczj.com/doc/5f6646592.html,/cs4iYcAeiHKIn 提取码:28c1自然风光巴厘岛 https://www.doczj.com/doc/5f6646592.html,/csizn3trNnCGv 提取码:e5edBBC纪录片《野性水域终极挑战》[MKV] https://www.doczj.com/doc/5f6646592.html,/Qi24t6zR3TyCK (提取码:bbcb)[历史地理] 詹姆斯·卡梅隆的深海挑战. https://www.doczj.com/doc/5f6646592.html,/lk/cJxR8pIvfSvR8 访问密码4076远方的家-边疆行全100集 https://www.doczj.com/doc/5f6646592.html,/cszGATNBFhjjw(访问密码:52c6)美丽中国湿地行50集
https://www.doczj.com/doc/5f6646592.html,/cszX2JZKa6UVy 访问密码2f2f李小龙:勇士的旅程》(Bruce Lee A Warriors Journey) https://www.doczj.com/doc/5f6646592.html,/csFPTqFZr8GTz 提取码6c71CHC高清纪录片:星球奥秘之地球雪球期MKV 720P 1.4G 英语中字 https://www.doczj.com/doc/5f6646592.html,/QGEpqiPbfGfsG (访问密码:cdb2)探索频道:狂野亚洲:四季森林 https://www.doczj.com/doc/5f6646592.html,/cJxPJZXa8wGzA 访问密码1034BBC 纪录片《美国的未来》[MKV/4集全] https://www.doczj.com/doc/5f6646592.html,/QivxnUNbqLEau (提取码:27fe)生命的奇迹.全5集 https://www.doczj.com/doc/5f6646592.html,/cJXTIkq5jLBY5 访问密码7d2f《华尔街》高清收藏版[HDTV/720p/MKV/全10集] https://www.doczj.com/doc/5f6646592.html,/cy5PrZeud43Rk 提取码8497远方的家-沿海行(高清全112集) https://www.doczj.com/doc/5f6646592.html,/cszX4jUKD29ay 访问密码a52aBBC
全球著名电视台 掌门人:霍珂灵 标签:文化国家 电视台(TV station /television station )指的是制作电视节目并通过电视或网络播放的媒体机构。它由国家或商业机构创办的媒体运作组织,传播视频和音频同步的资讯信息,这些资讯信息可通过有线或无线方式为公众提供付费或免费的视频节目。其播出时间固定,节目内容一部分为其自己制作,也有相当部分为外购。比较有名的电视台:CNN,BBC,TVB,CCTV等。 美国有线电视新闻网(CNN ) CNN由特德·特纳于1980年创办,1995年被时代—华纳公司兼并。总部设在美国佐治亚州首府亚特兰大市,在美国本土以外设有28个分部,在世界各地的雇员达4000人。CNN使用英语和西班牙语广播,它的资金来源于用户付费和广告收入。CNN因独家报道1991年海湾战争而成为家喻户晓的有线新闻广播公司,目前已覆盖全球210个国家和地区。 ? 什么叫CNN? ?CNN是什么? ?CNN什么意思啊好像最近很流行还有什么流行词啊? ?美国的CNN公司是什么东西请消息说明一下 ?CNN 是美国的还是法国的 ?CNN歪曲报道原文 英国广播公司(BBC) 这一新闻频道由英国广播公司于1991年成立。它在海外拥有250名记者和58个分部,资金来源于用户付费和广告收入。该频道声称在全球拥有2.7亿个家庭用户。英国广播公司今年宣布,计划于2007年新开播一个阿拉伯语的新闻频道。 ? BBC是什么? ?BBC什么意思 ?BBC是什么啊 ?BBC是哪个国家的媒体哦? ?bbc的经典语录(games[TV]的BBC) ?求bbc所有纪录片目录 半岛电视台(AlJazeera) 半岛电视台由卡塔尔政府于1996年成立。它在全球雇有170名记者,拥有26个分部。世界各地都能收看到半岛电视台的阿拉伯语频道。半岛电视台因不断报道伊拉克和中东其他地区的一些事件而遭到美国的指责。美国总统布什甚至曾计划轰炸它的卡塔尔总部。2006年,该电视台还将推出英语频道。 ?半岛电视台的相关资料? ?卡塔尔半岛电视台与cctv ?为什么半岛电视台收视率全球第一?cctv1呢? ?基地组织为什么要把拉登的录音送到半岛电视台? ?半岛电视台在中东哪里?据说很有名的! ?半岛电视台是哪国的 欧洲新闻电视台(Euronews) 欧洲新闻电视台建立于1993年,它的特点之一就是使用英语、法语、德语、意大利语、葡萄牙语、西班牙语和俄语7种语言播报新闻。该电视台所以能这样做是因为它主要使用各个通讯社提供的图像,而没有亮相屏幕的新闻主播。该电视台由19个欧洲公共部门电视频道共同所有,总部设在法国城市里昂,雇
纪录片不一定要完全真实 对于纪录片真实性的鉴定,就犹如不同的人看《哈姆雷特》,每个人都有自己的看法,而我的观点是:纪录片不一定要完全真实。我在这里提到的完全真实是指没有摆拍,没有编排。我认为纪录片中可以存在重现,摆拍。 有种对纪录片的定义是:一切真实记录社会和自然事物的非虚构的电影片或电视片都是纪录片。对于非虚构的电影片或电视片就可能存在编排和摆拍。 我的想法在国外和少数中国导演那里可以得到些许的认可。 在国外,纪录片是很受欢迎的,甚至纪录片的频道需要付费。就拿众所周知的美国的Discovery探索频道为例,美国的Discovery探索频道于1985年开播,是世界上发行最广的电视品牌,目前到达全球160多个国家和地区的3亿零6百多万家庭,以35种不同语言播出节目。 美国的Discovery探索频道的很多纪录片就是摆拍,重现的。Discovery有一档栏目叫重案夜现场,这个栏目并不是完全跟拍警方的破案过程,而是进行情景再现的,以摆拍,采访的方式进行重述。在这个节目里事件是真实的,专家的口述是真实的,而犯罪现场的以及犯罪证据,甚至犯罪过程的还原都是情景再现的,除了重案夜现场,历史零时差,与恐龙共舞特别篇等等都是情景再现的方式。情景再现即编排和摆拍。
黑格尔曾经说过:真实不是别的,而是缓慢的成熟过程。我觉得这句话,对于中国的纪录片仍然是很实用的。在我们国家,为什么人们不喜欢看纪录片?我想很大原因是因为我们国家的纪录片很多是不成熟的,但是有些导演的纪录片是很招人喜欢的,比如张以庆导演的影片《英和白》《幼儿园》《周周的世界》,冷冶夫的《伴》《油菜花开》等等,那么他们的影片是否是完全真实的呢? 冷冶夫在接受采访时说,他的《油菜花开》:“基本全部是摆拍,因为它是一种实验纪录片,国外翻译过来是“真实电影”,这种纪录片除了载体好以外,它的故事也好。我在主流媒体做的都是纪实风格的纪录片,很多人看不到我的另一面,所以我今天斗胆地放了这样一部片子”。当记者问到:“那您觉得摆拍还叫纪录片吗?”冷冶夫答道:“其实国际上往往把有没有这件事作为纪录片的鉴定。写剧本拍摄,那属于虚构的故事片,如果有这么件事,不管你怎么弄,它都是属于非虚构类的。国外对纪录片的分类特别粗,你也可以看到,包括国外那些Discovery节目几乎都用了情景再现的方式。” 我个人喜欢看《油菜花开》这样的纪录片,首先它的镜头很美,假如是跟拍,想必一定没有这么美的镜头;其次选材更容易,事件的结局知道,就更容易分析这件事件,就更容易找到切入点,在接下来编排摆拍时就更容易制造氛围,从而达到教育感化等效果,如果从开始就跟拍的纪录片,不一定能准确料定时间的结局,就不容易分析事件。 张以庆导演的纪录片一直以选材新颖,立意深刻著称,他肯花大