
RAMA HOETZLEIN
Graphics Research Engineer | SIGGRAPH 2013
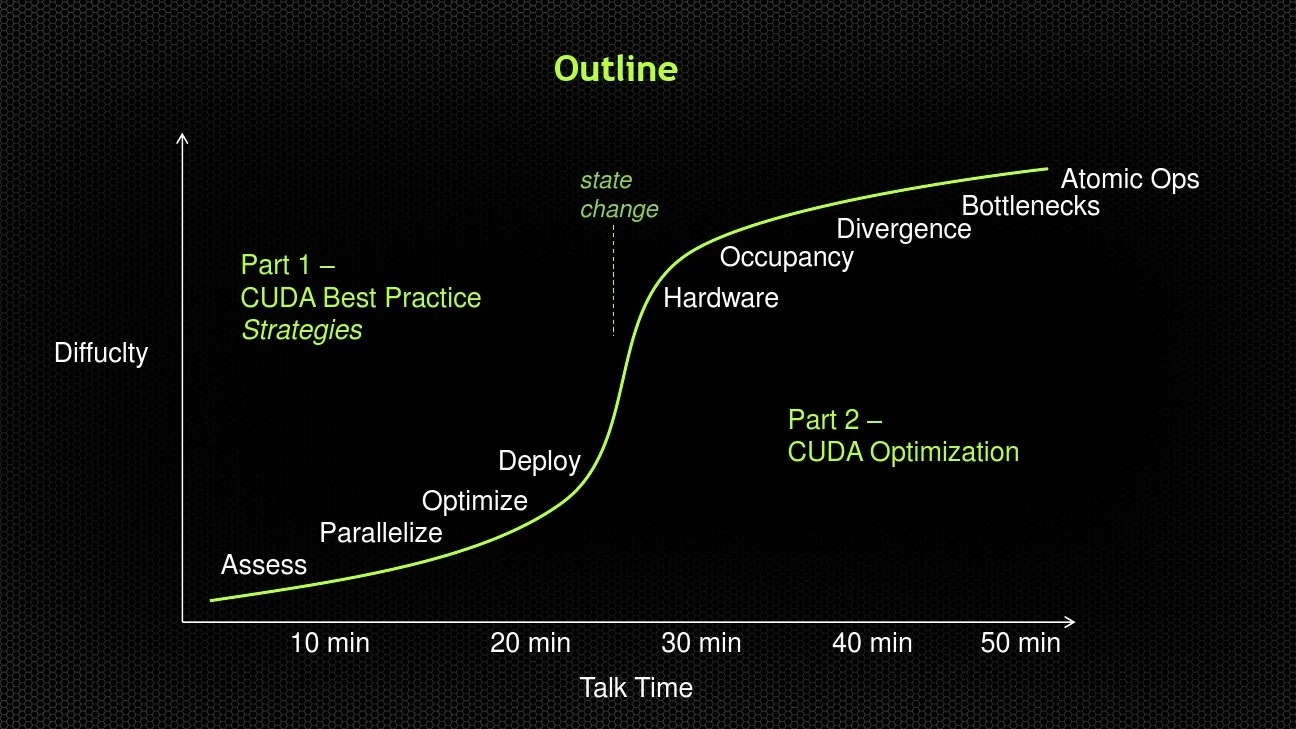
Outline
Diffuclty
Talk Time
10 min 20 min 30 min 40 min 50 min
Part 1 –
CUDA Best Practice Strategies
Part 2 –
CUDA Optimization
Assess
Parallelize
Optimize
Deploy Hardware
Occupancy
Divergence
Bottlenecks
Atomic Ops
state change
Part #1 –Best Practices: Strategies
Assess
Parallelize
Optimize
Deploy APOD: A Systematic Path to Performance
Assess
?Know your application problem
?Know your hardware capabilities ?Determine what aspects of problem are best suited to parallelization. Identify “hotspots”?Use profiling tools for find critical bottlenecks in CPU code
NVIDIA CUDA-MEMCHECK
for Linux & Mac
NVIDIA Nsight
Eclipse & Visual Studio Editions
Allinea DDT with CUDA Distributed Debugging T ool
T otalView for CUDA for Linux Clusters
NVIDIA CUDA-GDB for Linux & Mac
Profiling and Debugging
Solutions
https://www.doczj.com/doc/5a807964.html,/nsight
1. Know your hardware!
CPU Core i7-3770 4 108 25
GeForce GTX480 480 1345 177
Quadro K5000 1536 2168 172
Tesla K20X 2688 3950 250
Cores Gflops MB/s
threads run in parallel on many cores
Practical Example: Fluid Simulation
2. Know your problem! Insert into
Accel Grid
Compute
Forces
Compute
Pressures
Integrate
2. Know your problem! Insert into
Accel Grid
Compute
Forces Compute Pressures
Integrate Search for neighboring particles. (NNS) Like to be slowest part of code.
CPU version:
O ( n^2 ) worst case
O ( n k ) spatial grid lookup
3. Determine metrics
Time:
Standardize your units (avoid using fps)
Consider time to complete task, time per frame, and time per sub-task.
e.g. milliseconds
Performance:
Measures the overall ability to do work.
Choose a reasonable metric.. e.g. Image processing.. pixels/sec
Combination of algorithm efficiency and hardware.
e.g. particles / second == particles / op * ops / second Efficiency:
Normalizes performance by dividing by hardware Gflops.
Measures the capability of the algorithm regardless of hardware.
e.g. (particles / second) / Gflops == particles / Gflop
4. Identify hotspots
524,288 particles
One frame
Total: 1300 ms / frame Power = 403,289 particles / sec Efficiency = 186 p/s/Gf
4. Identify hotspots
524,288 particles
Insert 7 ms Pressure 480 ms Force 788 ms Advance 36 ms Order of magnitude greater than
other steps
?Determine amount of crosstalk in the problem ?Identify parallel method suitable to problem ?Translate CPU algorithms to GPU
1. Crosstalk and Coherency
determine ease of parallelism
Color
Grading
Simple Particles Image Blur
N-Body
Problem Fluid Simulation Raytracing
coherent incoherent
2. Design parallel algorithm
Example: Fluid Simulation Key Observations
1. Particles are dynamic
2. Particles become incoherent in memory (mix) as they move
3. Radix-Sort can keep coherency. Radix = fast parallel sort.
4. Do Neighbor Search on coherent particles.
Assign one particle per thread. Keep coherent by sorting each frame.
Many resources available: CUDA SDK Samples Developer Forums
https://www.doczj.com/doc/5a807964.html,/gpu-computing-sdk https://www.doczj.com/doc/5a807964.html,
1. Compare GPU to CPU
One frame CPU Time: 1300 ms
CPU Pow: 403,289 p/sec
CPU Effic: 3734 p/s/Gf GPU Time: 90 ms / frame
GPU Pow: 5,825,422 p/sec 14x faster
GPU Effic: 2687 p/s/Gf
524,288 particles
2. Memory Architecture
Kepler Memory Hierarchy
L2 Global Memory
Registers
SM-N
Registers
SM-0
Registers
SM-1
L1 SMEM Rea
d
only
L1 SMEM Read
only
L1 SMEM Rea
d
only
Global Memory 170 GB/s (inc. Local Memory) (400 cyl.)
L2 Cache, 1.5MB GK110
Shared Memory, 64k 2000 GB/s (shared per SMX)
Read-only, 48k
Texture Memory (100 cyl.) L1 Cache
Registers 8000 GB/s
3. Keep Optimizing! What is
occupancy?
Why is it
56% for
Forces?
Why
is shared
memory
not used?
Shared mem:
100x faster
Deploy
Once you have a working, efficient GPU solution…?Multiple GPUs cudaGetDeviceCount ?Error handling cudaGetErrorString() ?NVML: Cluster management NV-SMI: System monitoring