INTRODUCTION
The capability to accurately predict noise, vibration, and harshness (NVH) levels inside the compartment of a passenger vehicle prior to the existence of physical prototypes is critical to consistently meet demanding product development schedules and budgets while continuing to meet customer expectations for comfort, performance, and quality.In particular, the achievement of structure-borne NVH performance targets in the low frequency range (below 200Hz) is often required in order to meet basic customer expectations in these critical areas. For vehicles with an internal combustion (IC) engine, the source of low frequency structure-borne NVH typically originates from the random and cyclical forces induced by the powertrain, wheels, and the impacting road surface. In a typical vehicle design,multiple layers of isolation are incorporated throughout the powertrain, suspension, and body to help control and minimize the propagation of objectionable structure-borne
noise and vibration to passengers inside the cabin. In particular, carbon-filled rubber material compounds are widely used across the automotive industry, as well as in other industries, in the design of vibration isolators such as cab mounts, engine mounts, exhaust mounts, suspension bushings, etc. for its performance-to-cost efficiency.
Despite the fundamental importance of isolators in NVH system design, there are many limitations in the current industry-standard practice for modeling isolator components in NVH analysis models, particularly early in the product development process. The first limitation is the unavailability of reliable static and dynamic property information prior to the manufacturing and testing of physical components which often only occurs much later in the development process. As a consequence, simulation engineers must rely on substitute methods for roughly estimating properties, such as referencing legacy component test data from prior designs or by applying general rules of thumb. A second limitation
is
2012-01-0525
Published 04/16/2012
Copyright ? 2012 SAE International
doi:10.4271/https://www.doczj.com/doc/5d187367.html,
Finite Element Overlay Technique for Predicting the Payne
Effect in a Filled-Rubber Cab Mount
Christopher Robert Hartley
Nissan Technical Center North America, Inc.
Jaehwan Choi
Dassault Systemes Simulia Corp
ABSTRACT
Filled-rubber is widely used in automotive applications for noise and vibration isolation. The inherent material characteristics of filled-rubber make it suitable for these applications, but its complicated nonlinear behavior under both static and dynamic loading can make material modeling a challenge. This paper presents a two-element overlay technique to capture the nonlinear vibration amplitude dependency of a carbon-filled rubber material commonly referred to as the “Payne Effect.” This overlay technique is practically applied to predict the nonlinear dynamic stiffness and damping loss characteristics of a carbon-filled rubber body cab mount component from a body-on-frame vehicle calculated as a function of large static pre-strain, dynamic excitation frequency, and small dynamic strain amplitude in a single analysis. The first layer of elements is assigned a joint hyperelastic and linear viscoelastic material model that captures the pre-strain and frequency dependent behavior of the rubber material. While the second layer of elements, which is superimposed upon the first layer, is assigned a multi-linear kinematic hardening plasticity material model that captures the hysteresis and amplitude dependency of the material when subjected to dynamic loads. The two-element overlay technique is implemented using commercially available finite element software and is validated using physical test results. The technique accurately predicts the nonlinear dynamic stiffness of the filled-rubber component showing excellent correlation to physical test results while limiting model size and complexity as compared to other approaches.CITATION: Hartley, C. and Choi, J., "Finite Element Overlay Technique for Predicting the Payne Effect in a Filled-Rubber Cab Mount," SAE Int. J. Passeng. Cars - Mech. Syst. 5(1):2012, doi:10.4271/2012-01-0525.
____________________________________
413
that the experimental data points acquired during physical component testing are often too sparse to sufficiently define the nonlinear behavior of the isolator in the finite element model, which again requires simulation engineers to make an estimate based on the limited information on-hand and prior experience. Adhering to non-predictive estimations such as these can introduce additional uncertainty in the accuracy of simulations, especially when isolator shapes and material formulations are all-new designs. A third limitation involves the common modeling approach where the isolator is represented by simple one degree-of-freedom linear spring elements which, by definition, will respond with the same stiffness and damping regardless of the applied preload, frequency, and vibration amplitude.
The critical role of isolation components in meeting customer expectations for vehicle NVH performance underscores the importance, the motivation, and main benefit for developing more advanced capabilities to simulate the behavior of rubber components. However, simulating the static and dynamic characteristics of filled-rubber compounds with much confidence can be a challenging endeavor as it often exhibits highly nonlinear behavior that is dependent on multiple factors such as the magnitude of static pre-strain, dynamic rate of excitation (frequency), dynamic amplitude of excitation, and temperature, among others. From a simulation standpoint, constructing a material model capable of predicting the dynamic stiffness and loss characteristics as a function of all these factors simultaneously within a single analysis has proven itself to be a challenge. Material definitions that capture the effects of large static pre-strains and frequency simultaneously within a single analysis using a combination of hyperelastic and linear viscoelastic definitions are commonly available in many leading commercial finite element codes. But by itself this material modeling approach is not able to also capture the nonlinear stiffness of the rubber as a function of vibration amplitude, which is often referred to as the “Payne Effect,” as it is limited by the linear viscoelastic portion of the model which responds linearly regardless of the vibration amplitude that is applied.
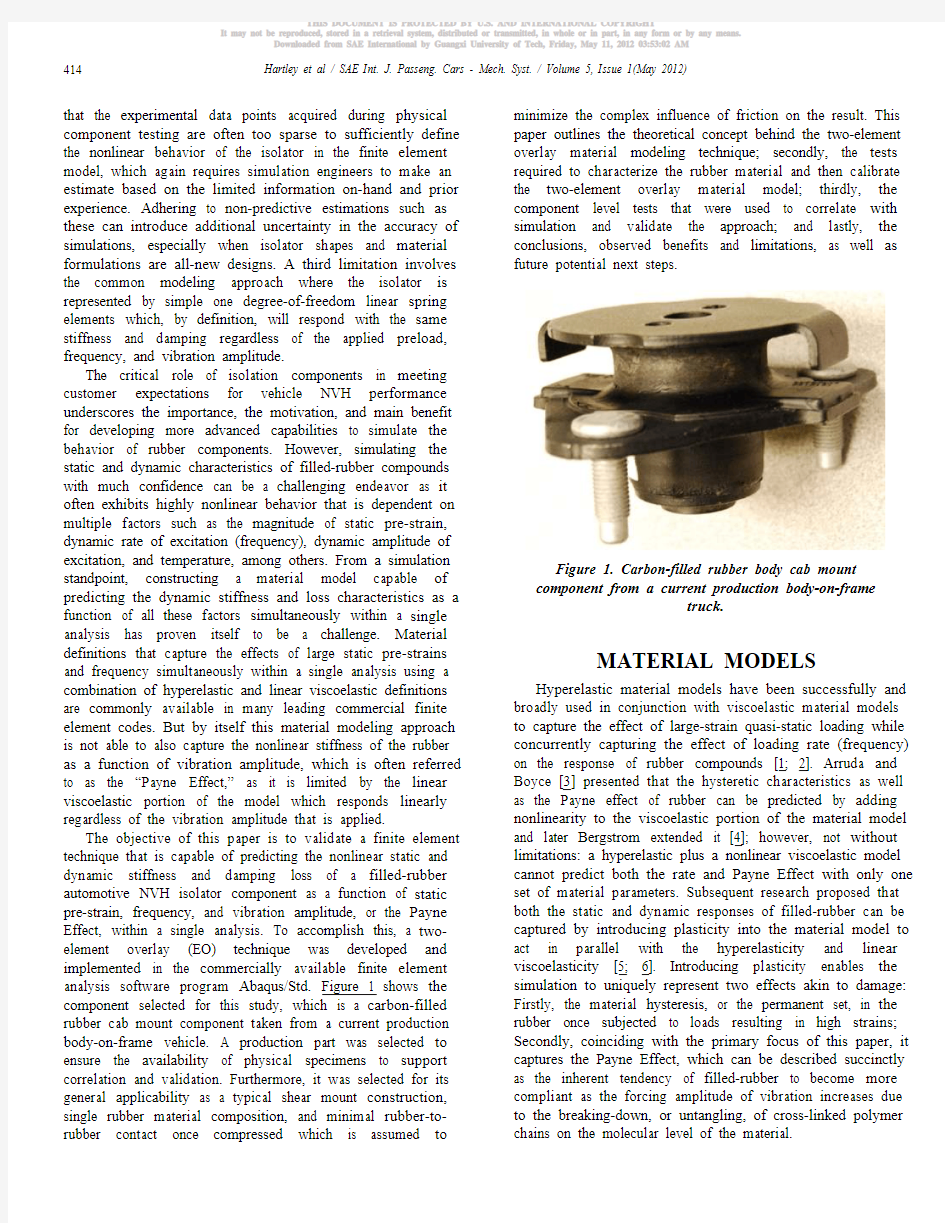
The objective of this paper is to validate a finite element technique that is capable of predicting the nonlinear static and dynamic stiffness and damping loss of a filled-rubber automotive NVH isolator component as a function of static pre-strain, frequency, and vibration amplitude, or the Payne Effect, within a single analysis. To accomplish this, a two-element overlay (EO) technique was developed and implemented in the commercially available finite element analysis software program Abaqus/Std. Figure 1 shows the component selected for this study, which is a carbon-filled rubber cab mount component taken from a current production body-on-frame vehicle. A production part was selected to ensure the availability of physical specimens to support correlation and validation. Furthermore, it was selected for its general applicability as a typical shear mount construction, single rubber material composition, and minimal rubber-to-rubber contact once compressed which is assumed to minimize the complex influence of friction on the result. This paper outlines the theoretical concept behind the two-element overlay material modeling technique; secondly, the tests required to characterize the rubber material and then calibrate the two-element overlay material model; thirdly, the component level tests that were used to correlate with simulation and validate the approach; and lastly, the conclusions, observed benefits and limitations, as well as
future potential next steps.
Figure 1. Carbon-filled rubber body cab mount component from a current production body-on-frame
truck.
MATERIAL MODELS
Hyperelastic material models have been successfully and broadly used in conjunction with viscoelastic material models to capture the effect of large-strain quasi-static loading while concurrently capturing the effect of loading rate (frequency) on the response of rubber compounds [1; 2]. Arruda and Boyce [3] presented that the hysteretic characteristics as well as the Payne effect of rubber can be predicted by adding nonlinearity to the viscoelastic portion of the material model and later Bergstrom extended it [4]; however, not without limitations: a hyperelastic plus a nonlinear viscoelastic model cannot predict both the rate and Payne Effect with only one set of material parameters. Subsequent research proposed that both the static and dynamic responses of filled-rubber can be captured by introducing plasticity into the material model to act in parallel with the hyperelasticity and linear viscoelasticity [5; 6]. Introducing plasticity enables the simulation to uniquely represent two effects akin to damage: Firstly, the material hysteresis, or the permanent set, in the rubber once subjected to loads resulting in high strains; Secondly, coinciding with the primary focus of this paper, it captures the Payne Effect, which can be described succinctly as the inherent tendency of filled-rubber to become more compliant as the forcing amplitude of vibration increases due to the breaking-down, or untangling, of cross-linked polymer chains on the molecular level of the material.
Hartley et al / SAE Int. J. Passeng. Cars - Mech. Syst. / Volume 5, Issue 1(May 2012) 414
Using current finite element technology, the plasticity cannot be combined with a single hyperelastic-viscoelastic material model. So, the concept of an element overlay (EO) technique was developed to overcome this limitation. In previous works [5; 6], six parallel elastic perfectly plastic networks were overlaid onto a single layer of hyperelastic-viscoelastic material model, which resulted in 7 total elements and 7 times the number of degrees-of-freedom per material point. In this paper, as an efficiency improvement to this initial 7-element overlay approach, the total number of parallel elements was reduced to 2 per material point by replacing the 6 additional elastic perfectly plastic networks with a single multi-linear kinematic hardening plasticity (MULTILIN) model in Abaqus/Std software accessed by a built-in user-subroutine. The MULTILIN model has multiple sub-volumes where each are defined independently as elastic perfectly plastic stress-strain pairs ultimately reducing the total DOF of the rubber component model by 2/7 compared to previous works.
Figure 2 illustrates the material model representation of the EO method designed to implement hyper-viscoelastic and plastic material models onto a single material point. Notice there are 3 networks: Network A) Hyperelastic network with nonlinear elasticity K h; Network B) Viscoelastic network with K v and η; and, Network C) Plasticity network with K p and σy defined by the MULTILIN model. Networks A and B are defined on one element while Network C is defined on a parallel element layer with both element layers sharing the same nodal connectivity. While node sharing ensures the strain across all 3 networks is the same, the unique formulation of each network results in different stresses in each network. Superposition is used to describe the total
composite stress calculation in equation (1) as:
(1)
Figure 2. Schematic of hyper-viscoelastic with
plasticity.HYPERELASTICITY (NETWORK A) Hyperelastic materials are modeled numerically in terms of strain energy potential which defines the energy stored in the material per unit of reference volume as a function of the strain at a certain point in the material. There are several forms of strain energy potentials available to model fully or nearly incompressible elastomers. The 3rd order reduced polynomial form (or Yeoh Model) was selected where the
strain energy potential is expressed as:
(2) where U is the strain energy per unit reference volume, C i0 and D i are calibrated material parameters, and I1is the first deviatoric strain invariant. The material parameters, C i0and D i, are calibrated by curve-fitting the following calculated stress to material characterization test measurements conducted in simple tension (ST), planar tension (PT), and
equi-biaxial extension (EB).
(3)
(4)
(5) where λU, λS, and λB are uniaxial (from ST), shear (from PT), and biaxial (from EB) stretches, respectively. VISCOELASTICITY (NETWORK B) The linear time domain viscoelasticity is defined by a Prony series expansion of the dimensionless relaxation
modulus [1] as:
(6)
where N,
, and , i = 1, 2, …, N, are material constants calibrated from material characterization ST stress relaxation test data.
Hartley et al / SAE Int. J. Passeng. Cars - Mech. Syst. / Volume 5, Issue 1(May 2012)415
PLASTICITY (NETWORK C)
A piece-wise linear stress-plastic strain curve, originally developed by Besseling [7], is input to the MULTILIN model. Figure 3 shows the stress-plastic strain curve in case of five sub-volumes. The number of sub-volumes is equal to the number of stress-plastic strain pairs defined. The yield strength of the i
th sub-volume is calculated as:
(7)
and the weight of the i
th sub-volume is:
(8)
where μ is the shear modulus and H i is the hardening modulus between i
th and (i+1)th data points.
Figure 3. Stress - plastic strain curve for MULTILIN
model.For a given time increment, all sub-volumes are subjected to the same strain. For each sub-volume, the increment of the plastic strain {} and the total stress {σi } at the end of the increment are calculated using von Mises yield criterion. The
total stress and total plastic strain for the entire volume are:
(9)
(10)
where N is the number of sub-volume, {εP }0 is the total plastic strain at the beginning of the increment,
and is
the equivalent plastic strain of the i th sub-volume.
Six pairs of (σi
, ) parameters, the same six elastic perfectly plastic networks previously defined as 6 separate
elements in [3,4], were extracted through the least square fit of equation (8) and then optimized in conjuction with the hyperelastic Yeoh Model parameters to match the original simple tension specimen test data. The next section presents a brief overview of the physical experiments conducted to characterize the rubber material for calibration of the hyperelastic, viscoelastic, and elastic-plastic parameters.
OVERVIEW OF EXPERIMENTS
Two categories of tests were conducted at different phases of the study. The first category is the rubber material characterization tests which provide data for the material model calibrations. The second category is the component level bench tests which provide data for correlation and validation of the developed simulation technique. Molded material slabs composed of the same material compound as the actual production-level cab mount component were obtained from the component manufacturer and used for the material characterization specimen tests. A list of the specimen tests are:
Material Characterization Tests:?Simple Tension tests (ST)?Planar Tension tests (PT)?Equi-Biaxial tension tests (EB)?Volumetric Tests (VT)?Constant Strain Rate tests (CR)
?Short Term Stress Relaxation tests (STSR)
ST, PT, EB, VT, and STSR results were used for the material model calibration, described in the previous section.While CR and HV data were used to fine tune and correlate the material model on a simple “dog bone” shaped https://www.doczj.com/doc/5d187367.html,ponent Level Bench Tests:?Harmonic Vibration tests (HV)
?3 Vibration Amplitudes (0.1mm, 0.2mm, 0.5mm)?3 Pre-Strain Levels (0 N, 1850 N, 3000 N)
?Frequency Range 0-200Hz
Afterwards, the static and dynamic testing of the body cab mount component was conducted for validation of the simulation technique.
The scope of the material modeling development was to predict its response under assumed normal operating conditions. Therefore, all tested specimens and components were pre-conditioned to a strain level and rate that slightly exceeded the ranges of interest prior to the actual measurements in order to mitigate the effects of initial damage, or break-in, of the rubber material.
Hartley et al / SAE Int. J. Passeng. Cars - Mech. Syst. / Volume 5, Issue 1(May 2012)
416
MATERIAL TESTING
Quasi-Static and Constant Strain Rate Testing
Figure 4 shows the relative size and shapes of multiple test specimens extracted from the molded material slab provided by the rubber manufacturer as presented by Miller [8]. “Dog bone” shaped specimens were used for the simple tension (ST), short-term stress relaxation (STSR), and constant strain rate (CR) tests. The wide, flat aspect ratio specimen and a circular shape with multiple legs specimens were used for the planar and equi-biaxial tension tests respectively to characterize the shear and compressive behavior of the material. The row of the circular disc shaped specimens was used for the volumetric test to characterize the
bulk modulus of the material.
Figure 4. Specimen preparation from the material slab
[8].The engineering stress vs. strain response of the rubber material in simple, planar, and equi-biaxial tension are shown in Figure 5. The tests were performed for 3 separately prepared specimens to confirm the repeatability. The constant strain rate tests are shown in Figure 6 and clearly exhibits the rate dependency characteristic of the rubber material; the observed trend is that the nominal stress in the material increases as the rate of cyclic loading increases, which
translates to higher material stiffness at higher loading rates.
Figure 5. ST, PT, and EB specimen Test Results.
Figure 6. Constant Strain Rate Test Results
Short-Term Stress Relaxation Testing
Figure 7 shows the short term stress relaxation test results,which were also performed on the “dog bone” shaped material specimen. Two levels of pre-strains (e1 and e2) were measured based on the maximum strain anticipated within the rubber of the cab mount component once it is pre-strained statically. The pre-strains were applied in a relatively short time period and the stress variation was then monitored.Additionally, by measuring multiple levels of pre-strain and then normalizing and overlaying their responses, it was verified that the assumption of linear viscoelasticity holds for this particular filled-rubber material within the anticipated strain range of interest.
Hartley et al / SAE Int. J. Passeng. Cars - Mech. Syst. / Volume 5, Issue 1(May 2012)417
Figure 7. Short-Term Stress Relaxation Test Results.
Harmonic Vibration Testing
Figure 8 and Figure 9 shows the dynamic harmonic test results, which were also performed on the “dog bone” shaped material specimen, which is the same specimen shape as the one used in the static simple tension as well as the stress relaxation tests. The test was performed at 2 separate dynamic strain amplitudes, each under 3 distinct pre-strain levels across the frequency range of interest. In the figures,‘pre1’, ‘pre2’, and ‘pre3’ correspond to 10%, 30%, and 50%static pre-strain levels, respectively. While ‘amp1’ and ‘amp2’ correspond to 1% and 2% dynamic strain amplitudes.Figure 8 shows the changing dynamic modulus (K*) of the material as a function of pre-strain, frequency, and dynamic amplitude, while Figure 9 shows the tan(δ) results where δ is the phase angle between the time signals of the stress and strain response and is representative of the dynamic damping characteristic of the rubber material. The dynamic modulus is shown to increase with frequency, and decrease with dynamic amplitude (Payne Effect). The pre-strain dependency of dynamic modulus is not consistent. The dynamic modulus decreases as the pre-strain changes from 10% to 30%, then there is almost no change in dynamic modulus as the pre-strain changes from 30% to 50%. From the simple tension static test results shown in Figure 5 (black lines), we can see that the tangent slope is decreasing as the strain increases,and the tangent slope is almost constant when the strain level is about 20% or more. Since the dynamic modulus is related to this tangent slope of the static strainstrain curves, the inconsistent pre-strain dependency of the dynamic modulus can be explained. The dynamic damping behavior (tan(δ)) is shown to increase with frequency and amplitude, but
decrease with pre-strain.
Figure 8. Dynamic Modulus Test Results
Figure 9. tan(δ) results.
COMPONENT TESTING
Figure 10 shows the fixture setup that was used for the cab mount component test. Special fixtures were built to constrain the cab mount at the bolt locations. A hydraulic test frame having a very heavy base that was isolated at the floor was used to accurately measure the dynamic characteristics.The component tests included:
?Quasi-static loading and unloading with 3.5mm maximum stroke displacement.
?Dynamic harmonic vibration tests
?3 Vibration Amplitudes (0.1mm, 0.2mm, 0.5mm)?3 Pre-Strain Levels (0 N, 1850 N, 3000 N)
?Frequency Range 0-200Hz (frequency sweep in 10 Hz increments)
Hartley et al / SAE Int. J. Passeng. Cars - Mech. Syst. / Volume 5, Issue 1(May 2012)
418
Figure 10. Component bench test setup for the cab
mount isolator Three bolt holes were fixed and the load was applied on top plate in the vertical compression direction as shown in Figure 10. Two samples of the quasi-static test results are
overlaid in Figure 11 showing acceptable repeatability.
Figure 11. Component Static Test Results
Figure 12 and Figure 13 show the harmonic vibration test results of the cab mount. In the figure, ‘pre0’ corresponds to a 0 N preload, ‘pre1’ corresponds to a 1850N pre-load, and ‘pre2’ corresponds to a 3000 N preload, while ‘amp1’,‘amp2’, and ‘amp3’ corresponds to dynamic vibration amplitudes of 0.1mm, 0.2mm, and 0.5mm, respectively.Trend-wise, the behavior of the component is similar to the material level harmonic vibration test: i) both dynamic stiffness and tan(δ) increase as frequency, ii) dynamic stiffness decreases as dynamic amplitude increases (Payne effect, amplitude dependency), iii) tan(δ) increases as increasing dynamic amplitude, iv) dynamic stiffness increases as the preload increases, and v) tan(δ) decreases as
preload increases.
Figure 12. Measured Dynamic Stiffness (N/mm) of the
cab mount component
Figure 13. Measured tan(δ) of the cab mount component
COMPONENT ANALYSIS
A detailed finite element model of the cab mount isolator component was constructed and the calibrated material model was applied. Next, the static and dynamic stiffness and loss as a function of vibration amplitude, preload, and frequencies were simulated using the finite element solver Abaqus/Std with the user-subroutine MULTILIN. Finally, the simulation results were compared with experimental results to validate the 2-element overlay (2-EO) technique.
FINITE ELEMENT (FE) MODEL
Figure 14 shows the finite element model of a cab mount.Per the proposed 2-EO approach, the rubber portion of the part has two duplicate elements per material point where one element layer describes the hyperelastic plus viscoelastic material and the other layer describes the plasticity of the material using MULTILIN. Two elements per material point share the nodal connectivity. Practically, this is implemented by adding the following additional keywords to the syntax of the model input file:
Hartley et al / SAE Int. J. Passeng. Cars - Mech. Syst. / Volume 5, Issue 1(May 2012)419
?Assume the following node and element definitions representing the 1st
layer of elements in a rubber part.
?Then,
use keyword to create the 2nd layer of elements, which are associated with the MULTILIN material
as:
Fixed boundary conditions were applied to the 3 bolt holes of the bottom steel plate, and the static and dynamic excitations were applied at the center position of top plate in
the vertical compression direction.
Figure 14. Finite element model of a cab mount The static analysis is carried-out in two discrete loads steps, large-strain loading and unloading. Harmonic vibration analysis is then carried-out by defining an additional three load steps including: large-strain preloading, material stress relaxation, and harmonic excitation at defined frequencies and vibration amplitudes.
CORRELATION
Simulation results were compared with test data as validation. As shown in Figure 15, the simulated large-strain hyperelastic static results are in very good agreement with
test data for both the loading and unloading responses of cab mount component. The peak reaction force is accurately captured at the top of the loading cycle while the inclusion of plasticity in the material model enables the model to effectively capture the damping hysteresis loop during unloading as well as the permanent set left after the unloading
cycle is complete.
Figure 15. Simulation vs. Test results - correlation of the
cab mount component
Figure 16. Simulation results - strain contour cut-away
section of the cab mount component
The dynamic harmonic vibration responses of the cab mount were calculated using a dynamic transient analysis and subsequently compared with experimental test results. The dynamic stiffness (N/mm) is calculated from the overall slope of the simulated force - displacement curve. The loss stiffness (N/mm) is calculated by multiplying the dynamic stiffness by sin(δ), where δ is the phase angle between the force and displacement signals. The frequency dependent dynamic and loss stiffness are compared in Figure 17, Figure 18, Figure 19, Figure 20, Figure 21, Figure 22 for multiple preloads and vibration amplitudes. Generally, the simulated dynamic stiffness is in very good agreement with test results with respect to both trend and magnitude as shown in Figure 17,
Hartley et al / SAE Int. J. Passeng. Cars - Mech. Syst. / Volume 5, Issue 1(May 2012)
420
Figure 19, and Figure 21. However, the correlation of the loss stiffness is inconsistent and much less reliable as can be seen in Figure 18, Figure 20, and Figure 22. A comparison of the raw data signal can provide more specifics about the likely cause for the differences between simulation and test results.As shown in Figure 23 (10 Hz at 3000 N preload) and Figure 24 (100 Hz at 3000 N preload), subjectively, the shape and trend of the simulated hysteresis loop coincides with the test data reasonably well. The slope of the hysteresis loop, which corresponds to the dynamic stiffness, is accurately captured by the simulation; however, the area within the hysteresis loop, which corresponds to the amount loss stiffness, shows significant differences between the simulation and test condition. Overall it is observed that the developed 2-Element Overlay material model is capable of accurately predicting the static loading and unloading force-displacement response and the dynamic stiffness (N/mm)with good confidence. Furthermore, the developed 2-EO technique accurately simulates the Payne Effect in a filled-rubber component. However, due to observed discrepancies between simulation and test results regarding the area within the hysteresis loops, caution should be taken if relying on this technique to predict the trend or frequency dependent
damping characteristics of a filled-rubber material.
Figure 17. Correlation of cab mount dynamic stiffness
under 0 N preload.
Figure 18. Correlation of cab mount loss stiffness under
0 N preload
Figure 19. Correlation of cab mount dynamic stiffness
under 1850 N preload.
Figure 20. Correlation of cab mount of loss stiffness
under 1850 N preload
Hartley et al / SAE Int. J. Passeng. Cars - Mech. Syst. / Volume 5, Issue 1(May 2012)421
Figure 21. Correlation of cab mount dynamic stiffness
under 3000 N preload
Figure 22. Correlation of cab mount loss stiffness under
3000 N preload
Figure 23. Correlation of cab mount dynamic hysteresis
at 10 Hz under 3000 N preload
Figure 24. Correlation of cab mount dynamic hysteresis
at 100 Hz under 3000 N preload
Hartley et al / SAE Int. J. Passeng. Cars - Mech. Syst. / Volume 5, Issue 1(May 2012)
422
CONCLUSIONS
The finite element method developed and outlined in this paper is shown to accurately predict both the nonlinear static and dynamic stiffness of a filled-rubber cab mount component as a function of preload, frequency, and most notably the vibration amplitude, which is commonly referred to as the Payne Effect. Furthermore it describes the basic theoretical concept of a 2-element overlay technique which effectively and simultaneously captures the hyperelastic (static preload dependency), viscoelastic (rate/ frequency dependency), and the representative plastic (vibration amplitude dependency, hysteresis, and permanent set) behavior of a filled-rubber material by applying the single material model definition MULTILIN in Abaqus/Std FE software. The 2-Element Overlay technique reduces the model degrees-of-freedom by 2/7 as compared to the previously proposed 7-element approach [5; 6] resulting in efficiencies from reduced model sizes and calculation times. Additionally, the material characterization specimen tests that are required to calibrate the parameters in the 2-element overlay material model are outlined and discussed. By applying the simulation technique outlined in this paper, uncertainties resulting from non-predictive assumptions can be reduced by predicting the nonlinear static (Ks) and dynamic (Kd) stiffness rates and then forward applying it to NVH vehicle system and/or subsystem models ultimately providing greater confidence in higher-level vehicle simulation results earlier in the product development cycle. Conceivably, this simulated approach could also be used to generate dynamic rate information for other translational or rotational directions, and not just compression, that might otherwise be impossible or exceedingly expensive or time consuming to measure experimentally on a physical specimen. A potential hurdle of this approach is that it increases model complexity and workload as it uses a transient analysis approach to capture the material nonlinear behavior which would likely be a shift for many NVH vehicle simulation teams that are accustomed to applying implicit linear dynamic modal-based solutions with isolators modeled as simple springs to solve massive models at very high speeds. Future potential work could include developing a co-simulation approach that combines the linear dynamic modal-based solution, which is very well suited to simulate the body structure, and the nonlinear transient solution, which is best suited to simulate NVH components composed of highly nonlinear materials such as filled-rubber isolators.
REFERENCES
1.Dassault Systèmes Simulia Corp., “Abaqus Analysis User's Manual,”
Providence : s.n., (2010).
2.Yeoh, O.H. “Some Forms of the Strain Energy Function for Rubber,”
Rubber Chemistry and Technology, Vol. 66, 754-771, (1993)
3.Arruda, E.M. and Boyce, M.C., “A Three-Dimensional Constitutive
Model for the Large Stretch Behavior of Rubber Elastic Materials”.
Journal of the Mechanics and Physics of Solids, Vol. 41, 389-412 (1993).
4.Bergstrom, J.S. and Boyce, M.C., “Constitutive Modeling of the Large
Strain Time-Dependent Behavior of Elastomers,” Journal of the Mechanics and Physics of Solids, Vol. 46, 931-954, (1998).5.Ahmadi, H.R., Kingston, J.G.R. and Muhr, A.H. “Dynamic Properties of
Filler Rubber - Part I: Simple Model, Experimental Data and Simulated Results,” Pittsburgh: Technical Meeting of the Rubber Division, American Chemical Society, (2007).
6.Ahmadi, H.R., et al. “Interpretation of the high low-strain modulus of
filled rubbers as an inelastic effect,” [ed.] Busfield and Muhr, (2003). 7.Besseling, J.F., “A Theory of Elastic, Plastic, and Creep Deformation of
an Initially Isotropic Material Showing Anisotropic Strain-Hardening, Creep Recovery, and Secondary Creep.” Journal of Applied Mechanics, 529-536, (1958).
https://www.doczj.com/doc/5d187367.html,ler, K., “Testing Elastomers for Hyperelastic Material Models in
Finite Element Analysis,” Axel Products, Inc., (2000).
CONTACT INFORMATION Christopher Hartley
Nissan Technical Center North America, Inc.
39001 Sunrise Drive
Farmington Hills, MI 48331
+1 (248) 488-6525
hartlec@https://www.doczj.com/doc/5d187367.html,
Jaehwan Choi
Dassault Systèmes Simulia Corp.
21680 Haggerty Rd.
Northville, MI 48167
+1 (248) 349-4669
jaehwan.choi@https://www.doczj.com/doc/5d187367.html,
ACKNOWLEDGMENTS The authors would like to thank Kurt Miller of Axel Products, Inc. for sharing his knowledge concerning the analysis and testing of rubber; to Steve Wood and Steve Telando from Cooper Standard Automotive for their support in providing components and materials critical for physical testing; to David Lepley and Mitch Prabhu from Nissan and to Tod Dalrymple and Randy Marlow from Simulia Corp for their guidance and support of this work.
DEFINITIONS/ABBREVIATIONS
MULTILIN
Multi-linear kinematic hardening plasticity
ST
Simple Tension
PT
Planar Tension test
EB
Equi-Biaxial test
VT
Volumetric Test
CR
Constant Strain Rate test
STSR
Short Term Stress Relaxation test
HV
Harmonic Vibration test
IC
Internal Combustion
EO
Element Overlay
DOF
Degrees of Freedom
Hartley et al / SAE Int. J. Passeng. Cars - Mech. Syst. / Volume 5, Issue 1(May 2012)423
FE
Finite Element
Kd
Dynamic Stiffness Rate
Ks
Static Stiffness Rate
NVH
Noise, Vibration, Harshness Hartley et al / SAE Int. J. Passeng. Cars - Mech. Syst. / Volume 5, Issue 1(May 2012)
424
华南师范大学实验报告 课程名称:仪器分析实验实验项目:原子吸收光谱法测定水 中的铜含量 原子吸收光谱法测定水中的铜含量 一、实验目的 1. 掌握火焰原子吸收光谱仪的操作技术; 2. 优化火焰原子吸收光谱法测定水中铜的分析火焰条件; 3. 熟悉原子吸收光谱法的应用。 二、方法原理 原子吸收光谱法是一种广泛应用的测定元素的方法。它是一种基于待测元素基态原子在蒸气状态对其原子共振辐射吸收进行定 量分析的方法。为了能够测定吸收值,试样需要转变成一种在适合的介质中存在的自由原子。化学火焰是产生基态气态原子的方便方法。 待测试样溶解后以气溶胶的形式引入火焰中。产生的基态原子吸收适当光源发出的辐射后被测定。原子吸收光谱中一般采用的空心阴极灯这种锐线光源。这种方法快速、选择性好、灵敏度高且有着较好的精密度。 然而,在原子光谱中,不同类型的干扰将严重影响方法的准确性。干扰一般分为四种:物理干扰、化学干扰、电离干扰和光谱干扰。物
理和化学干扰改变火焰中原子的数量,而光谱干扰则影响原子吸收信号的准确测定。干扰可以通过选择适当的实验条件和对试样的预处理来减少或消除。所以,应从火焰温度和组成两方面作慎重选择。 由于试样中基本成分往往不能准确知道,或是十分复杂,不能使用标准曲线法,但可采用另一种定量方法——标准加入法,其测定过程和原理如下。 取笑体积的试液两份,分别置于相同溶剂的两只容量瓶中。其中一只加入一定量待测元素的标准溶液,分别用水稀释至刻度,摇匀,分别测定其吸光度,则: Ax=kfx Ao=k(fo十fx) 式中,fx,为待测液的浓度;f。为加入标准溶液后溶液浓度的增量;测量的吸光度,将以上两式整理得:Ao分别为两次在实际测定中,采取作图法(图6—6)的结果更为准确。一般吸取四份等体积试液置于四只等容积的容量瓶中,从第二只容量瓶开始,分别按比例递增加人待测元素的标准溶液,然后用溶剂瓶稀释至刻度,摇匀,分别测定溶液fx,cx十fo,fx十2co,cx十3fo的吸光度为Ax,A1,Az,A:,然后以吸光度A对待侧元素标准溶液的加入量作图,得图6—6所示的直线,其纵轴上截距Ax为只含试样fx 的吸光度,延长直线与横坐标轴相交于cX,即为所需要测定的试样中该元素的浓度。
“十二五”规划12th Five-Year Plan 《关于禁止发展、生产和储存细菌(生物)及毒素武器和销毁此种武器的公约》(于1972年4月10日在伦敦、莫斯科和华盛顿签订)Prohibition of the Development, Production and Stockpiling of Bacteriological (Biological) and Toxin Weapons and on Their Destruction, (signed at London, Moscow and Washington on 10 April 1972) 《关于禁止在战争中使用窒息性、毒性或其他气体和细菌作战方法的议定书》(1925年《日内瓦议定书》)的原则和目标the principles and objectives of the Protocol for the Prohibition of the Use in War of Asphyxiating, Poisonous or Other Gases, and of Bacteriological Methods of Warfare, signed at Geneva on 17 June 1925 (the Geneva Protocol of 1925) 《联合国宪章》的宗旨和原则purposes and principles of the Charter of the United Nations 《维也纳外交关系公约》Vienna Convention on Diplomatic Relations ?根据本公约进行规定活动的视察组成员应免纳外交代表根据《维也纳外交关系公约》第34条所免纳的一切捐税。The members of the inspection team carrying out prescribed activities pursuant to this Convention shall be accorded the exemption from dues and taxes accorded to diplomatic agents pursuant to Article 34 of the Vienna Convention on Diplomatic Relations. 1, 3-二(2-氯乙硫基)正丙烷1,3-Bis (2-chloroethylthio)-n-propane 1, 4-二(2-氯乙硫基)正丁烷1,4-Bis (2-chloroethylthio)-n-butane 1, 5-二(2-氯乙硫基)正戊烷1,5-Bis (2-chloroethylthio)-n-pentane 1925年《日内瓦议定书》规定的义务obligations assumed under the Geneva Protocol of 1925 2,2-二苯基-2-羟基乙酸2,2-Diphenyl-2-hydroxyacetic acid 2-氯乙基氯甲基硫醚2-Chloroethylchloromethylsulfide atmospheric storage tank BZ:二苯乙醇酸-3-奎宁环酯BZ: 3-Quinuclidinyl benzilate DCS(分散控制系统、集散控制系统) distributed control system DF:甲基膦酰二氟DF: Methylphosphonyldifluoride flash drum HN1:N, N-二(2-氯乙基)乙胺HN1: Bis(2-chloroethyl)ethylamine HN2:N, N-二(2-氯乙基)甲胺HN2: Bis(2-chloroethyl)methylamine HN3:三(2-氯乙基)胺HN3: Tris(2-chloroethyl)amine O形环O-ring PFIB: 1,1,3,3,3 - 五氟-2-三氟甲基-1-丙烯PFIB:1,3,3,3-Pentafluoro-2-(trifluoromethyl)-1-propene pump (for firefighting water) QL:甲基亚膦酸乙基-2-二异丙氨基乙酯QL O-Ethyl O-2-diisopropylaminoethyl methylphosphonite slide valve U-V组合坡口combination U and V groove U形螺栓U-bolt U形弯管“U” bend VX(甲基硫代膦酸乙基-S-2-二异丙氨基乙酯)VX (O-Ethyl -2-diisopropylaminoethyl methyl phosphonothiolate) V形坡口V groove V型混合机V-type mixer X形坡口double V groove Y型粗滤器Y-type strainer γ射线照相Gamma radiography 安(培)Ampere (A) 安瓶ampule 安全safety 安全标志safety mark 安全等级safety class 安全防护装置safety protection device 安全连锁safety interlock (SI) 安全喷淋洗眼器safe spray eye wash 安全设施safety device 安全完整性等级safety integrity level (SIL) 安全卫生safety & health 安全系数margin of safety; safety coefficient; safety factor; coefficient of safety 安全仪表系统safety instrumented system (SIS) 安全照明safety lighting 安慰剂dummy drug ?他们对第二组用了安慰剂(无任何作用的药)。For the second group they used dummy drug. 安装erection; installation 氨氮ammonia-nitrogen (NH4+-N) 氨分离器ammonia separator 氨分缩器ammonia partial condenser 氨解ammonolysis 氨冷冻剂ammonia refrigerant 氨冷凝器ammonia condenser 氨冷器ammonia chiller 氨气ammonia gas 氨收集器ammonia accumulator 氨树脂amino resin 氨吸收制冷ammonia absorption refrigeration 鞍座saddle ?固定鞍座fixed saddle ?滑动鞍座sliding saddle 按国际惯例in line (accordance) with internationally accepted practices; compatible with established international practices; in accordance with international practice 胺吸磷:硫代磷酸二乙基-S-2-二乙氨基乙酯及相应烷基化盐或质子化盐Amiton: O,O-Diethyl S-[2-(diethylamino)ethyl] Phosphorothiolate and corresponding alkylated or protonated salts 奥氏体不锈钢Austenitic stainless steel 板框压滤器plate-and-fram filter press 板式输送机slat type conveyor 半成品semi-manufactured goods; semi- finished products; semi-finished goods semi-processed goods 半径radius (R) 半模拟盘(屏)semi-graphic panel 半贫液semi-lean solution 半衰期half-life; half-life period 半自动程序控制器semi-automatic sequence controller 1
SA T II 化学词汇表 Part 1 foundation chemistry 基础化学 Chapter 1 acid 酸 apparatus 仪器,装置 aqueous solution水溶液 arrangement of electrons 电子排列 assumption 假设 atom 原子 atomic mass原子量 atomic number 原子序数 atomic radius原子半径 atomic structure 原子结构 be composed of 由……组成 bombard ment 撞击 boundary 界限 cathode rays 阴极射线 cathode-ray os cilloscope (C.R.O) 阴极电子示波器ceramic 陶器 charge-clouds 电子云 charge-to-mass ratio(e/m) 质荷比 chemical behaviour 化学行为 chemical property化学性质 clockwise顺时针方向的 compound 化合物 configuration 构型 copper 铜 correspond to 相似 corrosive 腐蚀 d-block elements d 区元素 deflect 使偏向,使转向 derive from 源于 deuterium (D)氘 diffuse mixture 扩散混合物 distance effect 距离效应? distil 蒸馏 distinguish 区别 distribution 分布 doubly charged(2+) ion正二价离子 dye 染料 effect of electric current in solutions 电流在溶液里的影响electrical charge电荷 electrical field 电场
英语化学词汇的组词规律 1.化学元素(Chemical elements) A—音译transliteration 锂lithium 镁magnesium 硒selenium 氦helium 锰manganese 钡barium 氟fluorine 钛titanium 铀uranium 氖neon 镍nickel 钙calcium B—意译transcribe or free translation 氧铝溴 氢hydrogen 硅silicon 钾potassium 碳carbon 磷phosphorus 汞mercury 氮nitrogen 硫sulphur(sulfur) 钠sodium C—意音兼译translation by meaning and pronunciation 碘iodine 氯chlorine 砷arsenic 2.化学基团chemical groups 各种元素element的原子atom组合成分子molecule,按性质可以把分子分为不同的原子团radicle,分子中这些具有相对独特性质的原子团,称为官能团functional group,或范围更广一点,称作化学基团chemical group. propylene 丁/四butyl butane butanol butylene butyne butanone 戊/五pentyl pentane pentanol pentylene戊二烯 pentene 戊烯 pentyne pentanone 己/六hexyl hexane hexanol hexylene hexyne hexanone 庚/七heptyl heptane heptanol heptylene heptyne heptanone 辛/八octyl octane octanol octylene octyne octanone 壬/九nonyl nonane nonanol nonylene nonyne nonanone 癸/十decatyl decane decanol decylene decyne decanone 说明:-ol表示醇羟基,-an与烷有关,表示是饱和状态,-en与烯有关,有不饱和的意义,相应的饱和状态的羟基即醇-anol,不饱和状态的羟基即酚-enol。在结构较为复杂的醇类化合物中,常常只用-ol;酮-one是相当于用氧o替换了烯-ene中的一个碳,二者均为不饱和结构。 ether(醚),ester(酯),只要在化学基后加上这两个词,就获得了两组英文词。例如:甲醚methyl ether,甲酯methyl ester。 3.化合物类别及化学官能团Classes of compounds and functional groups 化合物类别 烃hydrocarbon 酚hydroxybenzene/phenol 胺amine 烷alkane 醚ether 亚胺imine 烯alkene 酮ketone 腈nitrile 炔alkyne 醛aldehyde 亚砜sulfoxide 苯benzene 酸acid 砜sulfone 醇alcohol 酐anhydride 碱alkali/base 官能团 烷基alkyl 羟基hydroxyl 羰基carbonyl
Atoms,Elements and Ions atom 原子 element 元素 ion 离子 anion 阴离子 cation 阳离子 electron 电子 neutral 中性的 proton 质子 atomic nucleus 原子核 nucleon 核子 nuclide symbol 核素符号 nuclide 核素 isotope 同位素 alpha particle 粒子 alpha ray 射线 beta particle 粒子 anode 阳级,正极 cathode 阴极 atomic mass unit 原子质量单位 element symbol 元素符号 atomic number 原子序数 atomic weight 原子量 mass number 质量数 atomic theory 原子理论 brownian motion 布朗运动 cathode ray 阴极射线 chemical change 化学变化,化学反应 compound 化合物 deuterium 氘 electric charge 电荷 heavy water 重水 isotopic abundance 同位素的丰度 natural abundance 自然丰度 isotopic mass 同位素质量 law of conservation of mass 物质守恒定律,物质不灭定律 law of definite proportions 确定化定律 law of multiple proportions 整比定律 mass spectrometer 质谱仪 mass spectrometry 质谱学,质谱测量,质谱分析 mass spectrum 质谱(复数形式:mass spectra) nuclear binding energy 核能量 radioactivity 放射能 X–ray spectrum X射线光谱(复数形式:X-ray spectra)
铜、银及其它常考的过渡金属元素 【重要知识点回顾】 一、铜 1.铜:(1)铜的颜色色(2)火法或湿法制铜: (3)铜与下列物质反应:铜在空气中生成铜绿、浓硫酸(加热)、双氧水(加稀硫酸酸性);硝酸(浓)、硝酸(稀)、硝酸银溶液、铁盐溶液、稀硫酸中加入少量铜不溶解,若加(通)入下列物质,能使铜溶解的是①硫酸铁②硝酸钾③双氧水④氧气(加热)。 (4)粗铜精炼:阳极为,有关电极反应式,比铜活泼的金属如铁以进入,比铜不活泼的金属沉积在中;阴极为,电极反应式;电解质溶液为,电解过程中电解质溶液浓度。 (5)溶液中Cu2+含量测定(碘量法)有关反应的离子方程式: 、 2.氧化铜:色。做用氢气还原氧化铜的实验时应先后,实验结果时应先 后。可用于还原氧化铜的物质有: 将铜丝在空气中加热后迅速插入乙醇中,现象为,有关化学方程式为、,总方程式为,铜的作用是。3、氧化亚铜:色。氧化亚铜溶于稀硫酸: 氧化亚铜溶于稀硝酸: 检验用氢气还原氧化铜所得产物中是否含氧化亚铜的实验方法是 4、氢氧化铜:色。配制新制氢氧化铜悬浊液的操作: 乙醛与新制氢氧化铜加热的化学方程式为 5、硫化铜:色。制备方法硫酸铜溶液中通入硫化氢: 硫化铜不溶于盐酸、稀硫酸但溶于稀硝酸: 硫化亚铜:色。制备方法铜在硫蒸气中加法: 硫化亚铜溶于稀硝酸: 鉴别CuS和Cu2S两种黑色粉末的方法是 6、CuH:红色固体,难溶于水;CuH与氯气点燃 CuH中加稀盐酸 CuH中加稀硝酸酸(只产生一氧化氮一种气体) 二、银 1、银溶于稀硝酸:(应用:试管的洗涤) 2、银氨溶液的配制方法是:, 有关反应为 乙醛发生银镜反应的离子方程式为 3、往硝酸银溶液中依次滴加足量氯化钠溶液、溴化钠溶液、碘化钠溶液、硫化钠溶液,现象为、、、,加入硫化钠溶液的离子方程式 三、其他过渡元素 1. Zn (1)实验室常用锌与稀硫酸反应制取氢气,为了加快反应速率,可采取的措施有: (2)银锌电池的负极是锌,正极是氧化银,电解质是氢氧化钾,负极反应式为,正极反应式为 2.Mn(1)实验室制氧气、氯气都可用到锰的化合物,写出有关化学方程式: 氧气氯气
表2-1 中英文对照
CC
表8-1 中英文对照 常用玻璃仪器英文表示 adapter 接液管广口瓶air condenser 空气冷凝管beaker 烧杯boiling flask 烧瓶 boiling flask-3-neck 三口烧瓶burette clamp 滴定管夹 burette stand 滴定架台Busher funnel 布氏漏斗Claisen distilling head 减压蒸馏头 condenser-Allihn type 球型冷凝管 condenser-west tube 直型冷凝管
crucible tongs 坩埚钳 crucible with cover 带盖的坩埚distilling head 蒸馏头 distilling tube 蒸馏管 Erlenmeyer flask 锥型瓶evaporating dish (porcelain) 瓷蒸发皿filter flask(suction flask) 抽滤瓶florence flask 平底烧瓶fractionating column 分馏柱 Geiser burette (stopcock) 酸氏滴定管graduated cylinder 量筒 Hirsch funnel 赫氏漏斗 long-stem funnel 长颈漏斗medicine dropper 滴管 Mohr burette for use with pinchcock 碱氏滴定管 Mohr measuring pipette 量液管mortar 研钵 pestle 研杵 pinch clamp 弹簧节流夹 plastic squeeze bottle 塑料洗瓶reducing bush 大变小转换接头rubber pipette bulb 吸耳球 screw clamp 螺旋夹 separatory funnel 分液漏斗stemless funnel 无颈漏斗 test tube holder 试管夹 test tube 试管 Thiele melting point tube 提勒熔点管transfer pipette 移液管 tripod 三角架 volumetric flask 容量瓶 watch glass 表皿 wide-mouth bottle 广口瓶 【分享】有机物英语单词后缀表 有机物英语单词后缀表 -acetal 缩醇 acid 酸 -al 醛 alcohol 醇 -aldehyde 醛 -aldechydic acid 醛酸
Bunsen burner 本生灯 product 化学反应产物 flask 烧瓶 apparatus 设备 PH indicator PH值指示剂,氢离子(浓度的)负指数指示剂 matrass 卵形瓶 litmus 石蕊 litmus paper 石蕊试纸 graduate, graduated flask 量筒,量杯 reagent 试剂 test tube 试管 burette 滴定管 retort 曲颈甑 still 蒸馏釜 cupel 烤钵 crucible pot, melting pot 坩埚 pipette 吸液管 filter 滤管 stirring rod 搅拌棒 element 元素 body 物体 compound 化合物 atom 原子 gram atom 克原子 atomic weight 原子量 atomic number 原子数 atomic mass 原子质量 molecule 分子 electrolyte 电解质 ion 离子 anion 阴离子 cation 阳离子 electron 电子 isotope 同位素 isomer 同分异物现象 polymer 聚合物 symbol 复合 radical 基 structural formula 分子式 valence, valency 价 monovalent 单价 bivalent 二价 halogen 成盐元素bond 原子的聚合mixture 混合combination 合成作用compound 合成物alloy 合金 metal 金属metalloid 非金属Actinium(Ac) 锕Aluminium(Al) 铝Americium(Am) 镅Antimony(Sb) 锑Argon(Ar) 氩Arsenic(As) 砷Astatine(At) 砹Barium(Ba) 钡Berkelium(Bk) 锫Beryllium(Be) 铍Bismuth(Bi) 铋Boron(B) 硼Bromine(Br) 溴Cadmium(Cd) 镉Caesium(Cs) 铯Calcium(Ca) 钙Californium(Cf) 锎Carbon(C) 碳Cerium(Ce) 铈Chlorine(Cl) 氯Chromium(Cr) 铬Cobalt(Co) 钴Copper(Cu) 铜Curium(Cm) 锔Dysprosium(Dy) 镝Einsteinium(Es) 锿Erbium(Er) 铒Europium(Eu) 铕Fermium(Fm) 镄Fluorine(F) 氟Francium(Fr) 钫Gadolinium(Gd) 钆Gallium(Ga) 镓Germanium(Ge) 锗Gold(Au) 金Hafnium(Hf) 铪Helium(He) 氦
物质的转化和元素的循环 (一)金属的氧化和金属氧化物的还原 1、铜与氧化铜之间的相互转化实验 (1)实验步骤和实验现象: ①用坩埚钳夹着铜片在酒精灯的外焰上加热。现象:发现紫红色铜片变成了黑色。铜的表面生成了氧化铜。 ②把在酒精灯外焰上加热后的铜片,马上插入酒精(乙醇)中。现象:铜片表面又由黑色变成了紫红色。 (2)实验结论: 在这个过程中,铜在加热的条件下能和空气中的氧气结合形成黑色的氧化铜,铜片表面生成的黑色氧化铜马上和酒精(乙醇)反应又转化成了铜。 (3)注意事项: 铜一定要在酒精灯的外外焰上加热,不要使铜碰到酒精灯的灯芯。因为在铜的表面生成的氧化铜与酒精灯的内焰或灯芯接触,实质上是和还没有燃烧的酒精(乙醇)蒸气接触,会使已经生成的氧化铜又被酒精还原成铜。 (4)实验小结: ①氧气在加热的条件下能和铜结合生成氧化铜。金属获得氧的过程被称为金属的氧化(oxidation)。 ②酒精能与灼热的氧化铜反应从氧化铜中夺取氧,使氧化铜转化为铜。金属氧化物失去氧的过程被称为金属氧化物的还原(deoxidation)。 2、使铁的表面形成氧化层保护膜实验
铁片放在浓硝酸、浓硫酸中,没有气体放出,这是因为铁在浓硝酸、浓硫酸中生成了铁的氧化物,正是这层致密的氧化膜保护了铁,使铁不能与酸反应生成氢气。但将铁片放在稀硫酸中,则有气体放出,即生成了氢气。 绝大部分金属都能在一定条件下与氧气化合生成金属的氧化物,但一些不活泼的金属如:金、铂等,很难和氧化合生成氧化物。金属还能和某些能提供氧的物质如:硝酸、浓硫酸等反应,生成金属氧化物。 3、氢气还原氧化铜实验 (1)实验步骤: 在干燥的硬质试管里铺一薄层黑色氧化铜粉末,固定在铁架台上,通入氢气,待空气排尽后,加热氧化铜。反应完成后停止加热,再继续通入一会儿氢气,直到试管冷却。 (2)实验装置: (3)实验现象: 黑色的氧化铜变成紫红色,试管口有水珠生成。 (4)注意事项: ①试管口应略向下倾斜,防止反应过程中生成的水流到试管底部使试管破裂; ②氢气的导入管要伸到试管的底部; ③反应开始前要先通入氢气,以排尽试管中的空气;当反应完成时,要先停止加热,继续通入氢气,直到试管冷却,再停止通入氢气,以防止生成的灼热的铜又被空气中的氧气氧化成氧化铜。
普通化学术语中英文对照表原子atom 原子核nucleus 质子proton 中子neutron 电子electron(abbr.e) 离子ion[an] 阳离子cation 阴离子anion 分子molecular[mlekjl] 单质element 化合物compound 纯净物puresubstance/chemicalsubstance 混合物mixture 相对原子质量relativeatomicmass(abbr.Ar) 相对分子质量relativemolecularmass(abbr.Mr) 化学式量relativeformulamass 物质的量amountofsubstance 阿伏加德罗常数Avogadroconstant(abbr.NA) 摩尔mole 摩尔质量molarmass 实验式/最简式/经验式empiricalformula 气体摩尔体积molarvolume 阿伏加德罗定律Avogadro’sLaw 溶液solution 溶解dissolve 浓度concentration 质量/体积分数mass/volumeconcentration 浓缩concentrate 稀释dilute 蒸馏distillation 萃取extraction 化学反应方程式chemicalequation 反应物reactant 生成物product 固体solid 液体liquid 气体gaseous
溶液aqueous 配平balance 化学计量学stoichiometry 酸acid 碱 base/alkali(referstosolublebases)盐salt 酸式盐acidsalt 离子方程式ionicequation 结晶水waterofcrystallisation 水合的hydrated 无水的anhydrous 滴定titration 指示剂indicator 氧化数oxidationnumber 氧化还原反应redoxreaction 氧化反应oxidationreaction 还原反应reductionreaction 歧化反应disproportionationreaction 归中反应 comproportionation(symproportiona tion) reaction 氧化剂oxidisingagent 还原剂reducingagent 电子层(壳)(electron)shell 电离能ionisationenergy(abbr..) 第一,第二,第三等电离能 first,second,third,etc.ionisation energy(abbr.1st,2nd,3rd,etc..) 电子亲和能 electronaffinityenergy(abbr..) 屏蔽效应electronicshielding(screening) 原子轨道atomicorbital 电子云electroncloud 电子亚层sub-shell 能层layer 能级energylevel 电子排布electronconfiguration 电子云重叠shelloverlap 洪特规则Hund’srule 泡利原理Pauliexclusionprinciple
无机化学实验题答案 实验习题p 区非金属元素( 卤素、氧、硫)1. 氯能从含碘离子的溶液中取代碘,碘又能从氯酸钾溶液中取代氯,这两个反应有无矛盾?为什么?答:这两个反应无 矛盾。因为氯的氧化性强于碘,而碘的氧化性又强于氯酸钾。 2. 根据实验结果比较:① S2O82-与MnO4-氧化性的强弱;② S2O32-与I- 还原性的强弱。答:因为S2O82-可以将Mn2+氧化为MnO4-,所以S2O82-的氧化性强于MnO4-,S2O32-能将I2 还原为 I- ,S2O32-和还原性强于I- 。3. 硫代硫酸钠溶液与硝酸银溶液反应时,为何有时为硫化银沉淀,有时又为[Ag(S2O3)2]3- 配离子?答:这与溶液的浓度和酸碱性有关,当酸性强时,会生成硫化银沉淀,而在中性条件下就会生成[Ag(S2O3)2]3- 配离子。 4. 如何区别:①次氯酸钠和氯酸钠;②三种酸性气体:氯化氢、二氧化硫、硫化氢;③硫酸钠、亚硫酸钠、硫代硫酸钠、硫化钠。答:① 分别取少量两种固体,放入试管中,然后分别往试管中加入适量水,使固体全部溶解,再分别向两支试管中滴入两滴品红溶液,使品红溶液褪色的试管中放入的固体为次氯酸钠,剩下的一种为氯酸钠。②将三种气体分别通入品红溶液中,使品红褪色的是二氧化硫,然后将剩余的两种气体分别通入盛有 KMnO4溶液的试管中,产生淡蓝色沉淀的是H2S,剩下的一种气体是氯化氢。③分别取四种溶液放入四支试管中,然后向四支试管中分别加入适量等量的H2SO4溶液,有刺激性气味 气体产生的是亚硫酸钠,产生臭鸡蛋气味气体是的硫化钠,既有刺激性气味气体产生,又有黄色沉淀产生的是硫代硫酸钠,无明显现象的是硫酸钠。 5. 设计一张硫的各种氧化态转化关系图。 6. 在氯酸钾和次氯酸钠的制备实验中,如果没有二氧化锰,可改用哪些药品代替地二氧化锰?答:可用高锰酸钾代替二氧化锰。7. 用碘化钾淀粉试纸检验氯气时,试纸先呈蓝色,当在氯气中放置时间较长时,蓝色褪去,为什么?答:因为2KI+Cl2=2KCl+I2,I2 遇淀粉变蓝,因此试纸呈蓝色,但氯气有氧化性,可生成HClO,可以将蓝色漂白,所以在氯气中放置时间较长时,蓝色褪去。8. 长久放置的硫化氢、硫化钠、亚硫酸钠水溶液会发生什么变化?如何
化学常用英语词汇 1.TheIdeal-GasEquation理想气体状态方程 2.PartialPressures分压 3.RealGases:DeviationfromIdealBehavior真实气体:对理想气体行为的偏离 4.ThevanderWaalsEquation范德华方程 5.SystemandSurroundings系统与环境 6.StateandStateFunctions状态与状态函数 7.Process过程 8.Phase相 9.TheFirstLawofThermodynamics热力学第一定律 10.HeatandWork热与功 11.EndothermicandExothermicProcesses吸热与发热过程 12.EnthalpiesofReactions反应热 13.Hess’sLaw盖斯定律 14.EnthalpiesofFormation生成焓 15.ReactionRates反应速率 16.ReactionOrder反应级数 17.RateConstants速率常数 18.ActivationEnergy活化能 19.TheArrheniusEquation阿累尼乌斯方程 20.ReactionMechanisms(机制)反应机理 21.HomogeneousCatalysi(s catalysis英[k?'t?l?s?s]n.催化作用)均相催化剂 22.HeterogeneousCatalysis非均相催化剂 23.Enzymes酶 24.TheEquilibriumConstant平衡常数 25.theDirectionofReaction反应方向 26.LeChatelier’sPrinciple列沙特列原理 27.EffectsofVolume,Pressure,TemperatureChangesandCatalys体ts积,压力,温度变化以及催化剂的影响
转无机化学实验习题答案 实验习题p区非金属元素(卤素、氧、硫)1.氯能从含碘离子的溶液中取代碘,碘又能从氯酸钾溶液中取代氯,这两个反应有无矛盾?为什么?答:这两个反应无 矛盾。因为氯的氧化性强于碘,而碘的氧化性又强于氯酸钾。2.根据实验结果比较:①S2O82-与MnO4-氧化性的强弱;②S2O32-与I-还原性的强弱。答:因为 S2O82-可以将Mn2+氧化为MnO4-,所以S2O82-的氧化性强于MnO4-,S2O32-能将I2还原为I-,S2O32-和还原性强于I-。3.硫代硫酸钠溶液与硝酸银溶液反应时,为 何有时为硫化银沉淀,有时又为[Ag(S2O3)2]3-配离子?答:这与溶液的浓度和酸 碱性有关,当酸性强时,会生成硫化银沉淀,而在中性条件下就会生成 [Ag(S2O3)2]3-配离子。4.如何区别:①次氯酸钠和氯酸钠;②三种酸性气体:氯 化氢、二氧化硫、硫化氢;③硫酸钠、亚硫酸钠、硫代硫酸钠、硫化钠。答:① 分别取少量两种固体,放入试管中,然后分别往试管中加入适量水,使固体全部 溶解,再分别向两支试管中滴入两滴品红溶液,使品红溶液褪色的试管中放入的 固体为次氯酸钠,剩下的一种为氯酸钠。②将三种气体分别通入品红溶液中,使 品红褪色的是二氧化硫,然后将剩余的两种气体分别通入盛有KMnO4溶液的试管中,产生淡蓝色沉淀的是H2S,剩下的一种气体是氯化氢。③分别取四种溶液放入四支试管中,然后向四支试管中分别加入适量等量的H2SO4溶液,有刺激性气味 气体产生的是亚硫酸钠,产生臭鸡蛋气味气体是的硫化钠,既有刺激性气味气体 产生,又有黄色沉淀产生的是硫代硫酸钠,无明显现象的是硫酸钠。5.设计一张 硫的各种氧化态转化关系图。6.在氯酸钾和次氯酸钠的制备实验中,如果没有二 氧化锰,可改用哪些药品代替地二氧化锰?答:可用高锰酸钾代替二氧化锰。7.用 碘化钾淀粉试纸检验氯气时,试纸先呈蓝色,当在氯气中放置时间较长时,蓝色 褪去,为什么?答:因为2KI+Cl2=2KCl+I2,I2遇淀粉变蓝,因此试纸呈蓝色,但 氯气有氧化性,可生成HClO,可以将蓝色漂白,所以在氯气中放置时间较长时, 蓝色褪去。8.长久放置的硫化氢、硫化钠、亚硫酸钠水溶液会发生什么变化?如何
化学常用英语词汇 1.The Ideal-Gas Equation 理想气体状态方程 2. Partial Pressures 分压 3. Real Gases: Deviation from Ideal Behavior 真实气体:对理想气体行为的偏离 4. The van der Waals Equation 范德华方程 5. System and Surroundings 系统与环境 6. State and State Functions 状态与状态函数 7. Process 过程 8. Phase 相 9. The First Law of Thermodynamics 热力学第一定律 10. Heat and Work 热与功 11. Endothermic and Exothermic Processes 吸热与发热过程 12. Enthalpies of Reactions 反应热 13. Hess’s Law 盖斯定律 14. Enthalpies of Formation 生成焓 15. Reaction Rates 反应速率 16. Reaction Order 反应级数 17. Rate Constants 速率常数 18. Activation Energy 活化能 19. The Arrhenius Equation 阿累尼乌斯方程 20. Reaction Mechanisms 反应机理 21. Homogeneous Catalysis 均相催化剂 22. Heterogeneous Catalysis 非均相催化剂 23. Enzymes 酶 24. The Equilibrium Constant 平衡常数 25. the Direction of Reaction 反应方向 26. Le Chatelier’s Principle 列沙特列原理 27. Effects of V olume, Pressure, Temperature Changes and Catalysts体积,压力,温度变化以及催化剂的影响
2014级研究生《高等半导体器件物理》试题 1.简单说明抛物线性能能带和非抛物线性能带的能带结构以及各自 的特点、应用。 2.试描述载流子的速度过冲过程和弹道输运过程,以及它们在实际 半导体器件中的应用。 3.什么是半导体超晶格?半导体器件中主要的量子结构有哪些? 半导体超晶格:两种或者两种以上不同组分或者不同导电类型超薄层材料,交替堆叠形成多个周期结构,如果每层的厚度足够薄,以致其厚度小于电子在该材料中的德布罗意波的波长, 这种周期变化的超薄多层结构就叫做超晶格. 主要的量子结构:超晶格中, 周期交替变化的超薄层的厚度很薄,相临势阱中的电子波函数能够互相交叠, 势阱中的电子能态虽然是分立的, 但已被展宽. 如果限制势阱的势垒进度足够厚, 大于德布罗意波的波长, 那么不同势阱中的波函数不再交叠, 势阱中电子的能量状态变为分立的能级. 这种结构称之为量子阱( QW).在上述结构中,电子只在x 方向上有势垒的限制, 即一维限制,而在y , z 两个方向上是二维自由的. 如果进一步增加限制的维度,则构成量子线和量子点. 对于量子线而言, 电子在x , y 两个方向上都受到势垒限制; 对于量子点来说, 在x , y , z 三个方向上都有势垒限制. 我们通常将这些量子结构称为低维结构, 即量子阱、量子线和量子点分别为二维、一维和零维量子结构. 4.PHEMT的基本结构、工作原理以及电学特点。 5.隧道谐振二极管的主要工作特点,RITD的改进优势有哪些? 6.突变发射结、缓变基区HBT的工作原理、特点及其应用。 7.举例讨论半导体异质结光电器件的性能。
参考文献: 1.沃纳,半导体器件电子学,电子工业出版社,2005 2.施敏,现代半导体器件物理,科学出版社,2002 3.王良臣等,半导体量子器件物理讲座(第一讲~第七讲),物理(期刊),2001~2002
如有帮助欢迎下载支持 Atoms,Elements and Ions atom 原子 element 元素 ion 离子 anion 阴离子 cation 阳离子 electron 电子 neutral 中性的 proton 质子 atomic nucleus 原子核 nucleon 核子 nuclide symbol 核素符号 nuclide 核素 isotope 同位素 alpha particle 粒子 alpha ray 射线 beta particle 粒子 anode 阳级,正极 cathode 阴极 atomic mass unit 原子质量单位 element symbol 元素符号 atomic number 原子序数 atomic weight 原子量 mass number 质量数 atomic theory 原子理论 brownian motion 布朗运动 cathode ray 阴极射线 chemical change 化学变化,化学反应 compound 化合物 deuterium 氘 electric charge 电荷 heavy water 重水 isotopic abundance 同位素的丰度 natural abundance 自然丰度 isotopic mass 同位素质量 law of conservation of mass 物质守恒定律,物质不灭定律 law of definite proportions 确定化定律 law of multiple proportions 整比定律 mass spectrometer 质谱仪 mass spectrometry 质谱学,质谱测量,质谱分析 mass spectrum 质谱(复数形式:mass spectra) nuclear binding energy 核能量 radioactivity 放射能 X–ray spectrum X射线光谱(复数形式:X-ray spectra)