
使用条件:
?应变量Y是一个二值变量,取值为0和1
?自变量X1,X2,……,Xm。
?P表示在m个自变量作用下事件发生的概率。
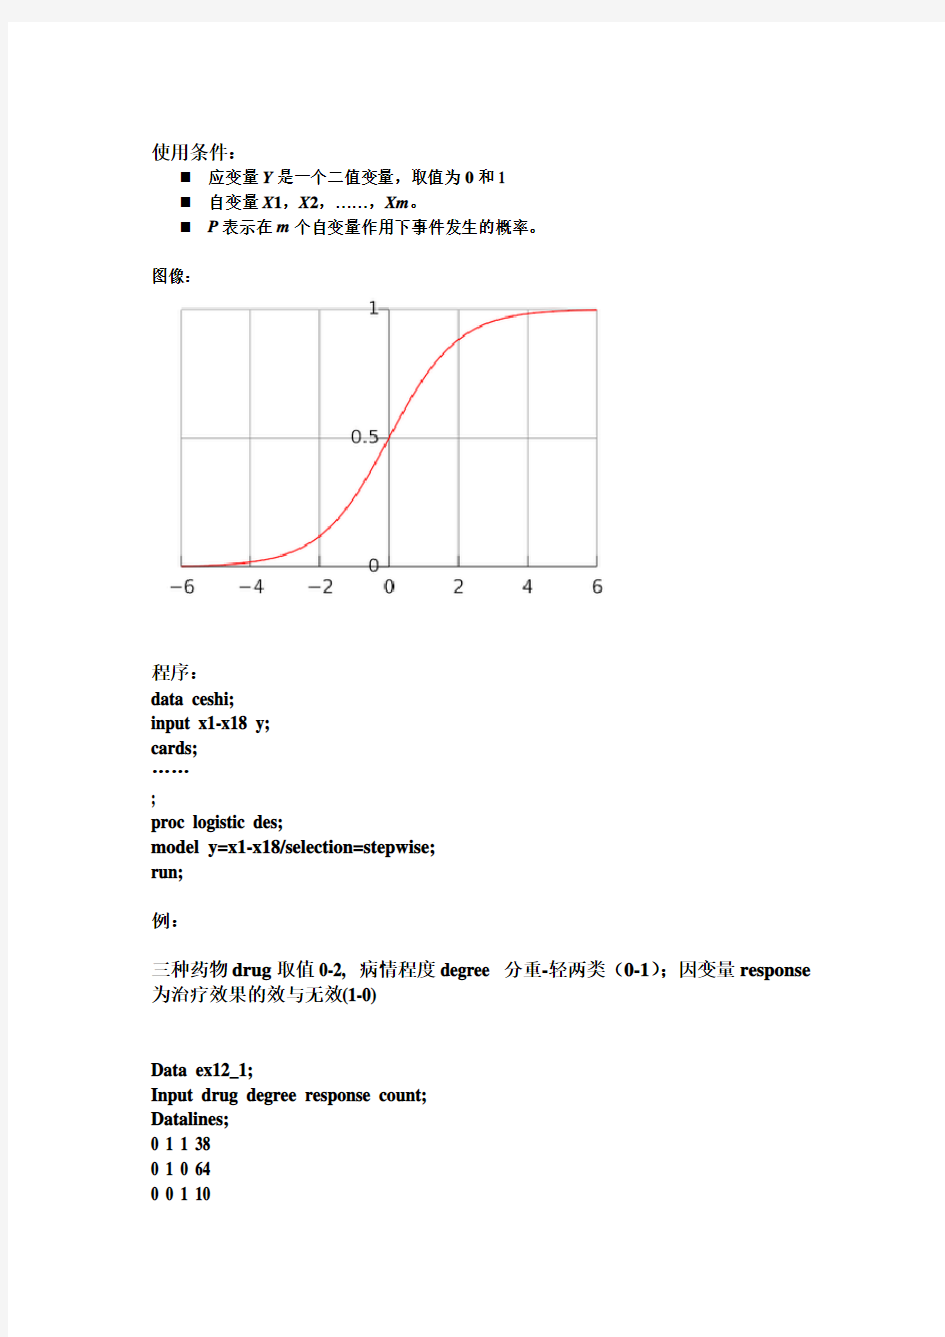
图像:
程序:
data ceshi;
input x1-x18 y;
cards;
……
;
proc logistic des;
model y=x1-x18/selection=stepwise;
run;
例:
三种药物drug取值0-2, 病情程度degree 分重-轻两类(0-1);因变量response 为治疗效果的效与无效(1-0)
Data ex12_1;
Input drug degree response count;
Datalines;
0 1 1 38
0 1 0 64
0 0 1 10
0 0 0 82
1 1 1 95
1 1 0 18
1 0 1 50
1 0 0 35
2 1 1 88
2 1 0 26
2 0 1 34
2 0 0 37
;
Proc logistic data=ex12_1 descending;
Freq count;
Class drug/param=ref descending;
Model response=drug degree/rsq scale=n aggregate;
Run;
Rsq显示R2
Scale, SCALE= speci?es method to correct overdispersion,指定参数,=n表示不需要修正。
Aggregate计算卡方检验统计量
Class 语句将分类变量化成虚拟变量,三种药用两个虚拟变量表示。
铸铁冶炼,要对铁加热heat和水中热处理(soaking time),n 表示铸铁块数,r 表示没有准备好轧制的铁块数。
data ingots;
input Heat Soak r n @@;
datalines;
7 1.0 0 10 14 1.0 0 31 27 1.0 1 56 51 1.0 3 13 7 1.7 0 17 14 1.7 0 43 27 1.7 4 44 51 1.7 0 1 7 2.2 0 7 14 2.2 2 33 27 2.2 0 21 51 2.2 0 1 7 2.8 0 12 14 2.8 0 31 27 2.8 1 22 51 4.0 0 1 7 4.0 0 9 14 4.0 0 19 27 4.0 1 16
;
proc logistic data=ingots;
model r/n=Heat Soak;
run;
Using the parameter estimates, you can calculate the estimated logit of as Logit(p)=log(p/1-p)=-5.5592+0.082 × Heat+0.0568 × Soak
If Heat=7 and Soak=1, then logit(p)=-4.92584. Using this logit estimate, you can calculate as follows:
P=1/(1+e4.9284)=0.0072
Y表示骑车上班(1男,0女)
Data p256;
Input X3 X1 X2 y;
Datalines;
0 18 850 0
0 21 1200 0
0 23 850 1
0 23 950 1
0 28 1200 1
0 31 850 0
0 36 1500 1
0 42 1000 1
0 46 950 1
0 48 1200 0
0 55 1800 1
0 56 2100 1
0 58 1800 1
1 18 850 0
1 20 1000 0
1 25 1200 0
1 27 1300 0
1 28 1500 0
1 30 950 1
1 3
2 1000 0
1 33 1800 0
1 33 1000 0
1 38 1200 0
1 41 1500 0
1 45 1800 1
1 48 1000 0
1 5
2 1500 1
1 56 1800 1
;
Proc logistic data=p256 descending ; Model y=x1-x3;
output out=pred p=phat lower=lcl upper=ucl predprobs=(individual crossvalidate);
run;
proc print data=pred;
Data ex1;
Input no n n1 x; Datalines;
1 10.0 1.5 2.0
2 20.0 3.2 3.0
3 25.0 4.0 4.0
4 30.0 5.0 5.0
5 40.0 8.0 6.0
6 50.0 12.0 8.0
7 60.0 18.0 10.0
8 80.0 28.0 13.0
9 100.0 45.0 15.0
10 70.0 36.0 20.0
11 65.0 39.0 25.0
12 50.0 33.0 30.0
13 40.0 30.0 35.0
14 25.0 20.0 40.0
15 30.0 27.0 50.0
16 40.0 38.0 60.0
17 50.0 48.0 70.0
18 60.0 58.0 80.0 ;
Proc logistic data=ex1; Model n1/n=x;
Run;